Crown and diameter structure of pure Pinus massoniana Lamb. forest in Hunan province, China
-
Siwen Su


Abstract
Non-spatial structure of forest is an important aspect for harvesting regimes, silvicultural treatments, and ecosystem service provisions. In this pursuit, the present research envisaged the measurement of the crown and diameter structure of Pinus massoniana Lamb. Specifically, the forests were assessed with a range of nine cities in Hunan Province, China. The gradient boosting model was used to quantify the contribution of seven drivers of the diameter at breast height (DBH) diversity. Moreover, the relationship between the crown structure and DBH/tree height was explored using TSTRAT and path analysis. The Anderson–Darling test results indicated that DBH distributions of nine cities did not occur from the same population, the maturing diameter distribution was the main type among the cities. Slope direction was identified as the most impacted factor affecting the DBH diversity, followed by landform and stand density. The vertical stratification indicated a simple vertical structure, and the relationship between the DBH/tree height and crown structure changed in different stages, which reflected the competition mechanism and adaption strategy in the forest. Our study summarized the diameter and crown structure of pure P. massoniana forest in Hunan province, which can provide valuable information in the forest management, planning, and valuation of ecosystem services.
1 Introduction
Forest is an ecosystem that functions with a self-growth regulation, and its structure affects the biomass and productivity [1,2]. The structure of the forest affects the biodiversity, biomass production, along with the habitat function [3]. A reasonable adjustment of the forest structure is conducive to its ecological function [4]. Forest structure consists of vertical and horizontal components and consists of the species composition, size, and distribution of trees, shrubs, and ground cover vegetation [5,6]. Vertical stand structure often refers to the layering of tree crowns, while the horizontal structure mostly represents the distribution of the diameter and spatial patterns of the tree species [7]. So far, many models have been applied in different tree species to describe the forest structures [8–10]. Forest structure diversity can reflect the complexity of stands, which can benefit the forest monitoring, formulating policy, management, and assessing the ecosystem services [11,12]. The assessment of structure diversity has been performed based on the variety of variables including the species number, tree size, foliage height, coarse woody debris, etc. [5,13]. Among them, structural diversity can be assessed by the distribution of diameter of a population of trees. Previous studies show that the diameter distributions can be classified into three types as youthful distribution, maturing distribution, and mature distribution that is important in explaining the natural progression of the distribution of diameter [11,14,15]. Diameter distribution varies with the management, tree species, stand dynamics, and disturbance regimes [16]. Many factors such as altitude, slope direction, soil type, and soil nutrient affect the diameter at breast height (DBH) that were used for type site division, but the quantitative study of these effects is limited.
The vertical structure is mostly represented with the distribution of tree height and crown, and many indexes have been proposed to characterize the vertical structure [17–19]. Additionally, the tree crowns determine the light interception, gas exchange and water through photosynthesis and evapotranspiration, which influence many aspects of the ecosystem [20]. Thus, it plays a very important role in the vertical structure analysis. Tree crown allometry describes the scaling relationships between the crown dimensions and more easily measurable variable such as stem diameter, which is widely used in the quantification of the ecosystem function and determination of the tree spacing [20,21]. The tree height and DBH are considered as the best indicators in crown prediction [21,22]. In the modeling process, many approaches like the mixed effect model, spatial statistics model, and multiple regression models have been used to develop appropriate and valuable models [23,24], but the effects and application are limited.
Masson pine (Pinus massoniana Lamb.) is a major coniferous tree species that is widely distributed in the subtropical forests of South China [25]. In Hunan province, the Masson pine is an important source of timber and wood pulp, and most pine forests are artificial pure forests. Previous studies of Masson pine are limited to a single city or subset of the tree population. They provide valuable information for the practical management, but fail to provide a comprehensive assessment of the diameter distribution or crown structure in the Hunan province. The present study was aimed to assess the Masson pine population in Hunan province in terms of tree height, stem diameter at DBH, and crown structure, with the following objectives: (1) assessment of the DBH structure of trees in each city, (2) quantifying the impact of common stand dynamics factors on DBH diversity at a large scale, and (3) develop path model to provide a theoretical basis for establishing a better crown size prediction model at large scale. Additionally, based on our analysis, some suggestions are provided in regards to the forest plantation.
2 Materials and methods
2.1 Data sources
An ecological forest has the function of maintaining the ecological balance and protecting the biodiversity. The ecological forest is the main forest resource that covers 36.65% of the Hunan province, and deforestation is not allowed in this ecological forest. The forest survey data were obtained from the forest fixed sample plot investigation database of Hunan ecological forests (updated in 2019). A total of 683 fixed sample plots in this database were set by equal space in the area of ecological forest, and the space was calculated according to the total forest area in the geographical information system software. The size of plot was 25 m (vertically to the counter line) × 40 m (parallel to contour line). The crown width (average of two crown diameters perpendicular to each other), tree height, and DBH of each tree were measured. The crown length was calculated as the height from the first living branch to the top. Additionally, the stand dynamics factors such as altitude, slope position, and stand density of each plot were also measured. In this study, 31 pure P. massoniana forest plots were selected, and a total of 3,633 trees were sampled that distributed among nine cites of the Hunan province (Table 1, Figure 1). The distribution range of GPS data within the study sites was 109.6465°–114.0073°E, 25.1357°–30.0865°N. The altitude of all plots ranged from 105 to 1,250 m. The forests’ age ranged from 8 to 51 years, the average DBH on all trees in the plots ranged from 6.7 to 24.8 cm, and the height of the trees in all plots ranged from 5.4 to 20 m.
Information of 31 pure P. massoniana forest plots
| City | Sampled plots | Sampled trees (number) |
|---|---|---|
| Chenzhou | 8 | 1,123 |
| Hengyang | 1 | 80 |
| Huaihua | 6 | 729 |
| Loudi | 1 | 28 |
| Shaoyang | 3 | 218 |
| Xiangtan | 1 | 73 |
| Xiangxi | 4 | 434 |
| Yongzhou | 4 | 467 |
| Yueyang | 3 | 481 |
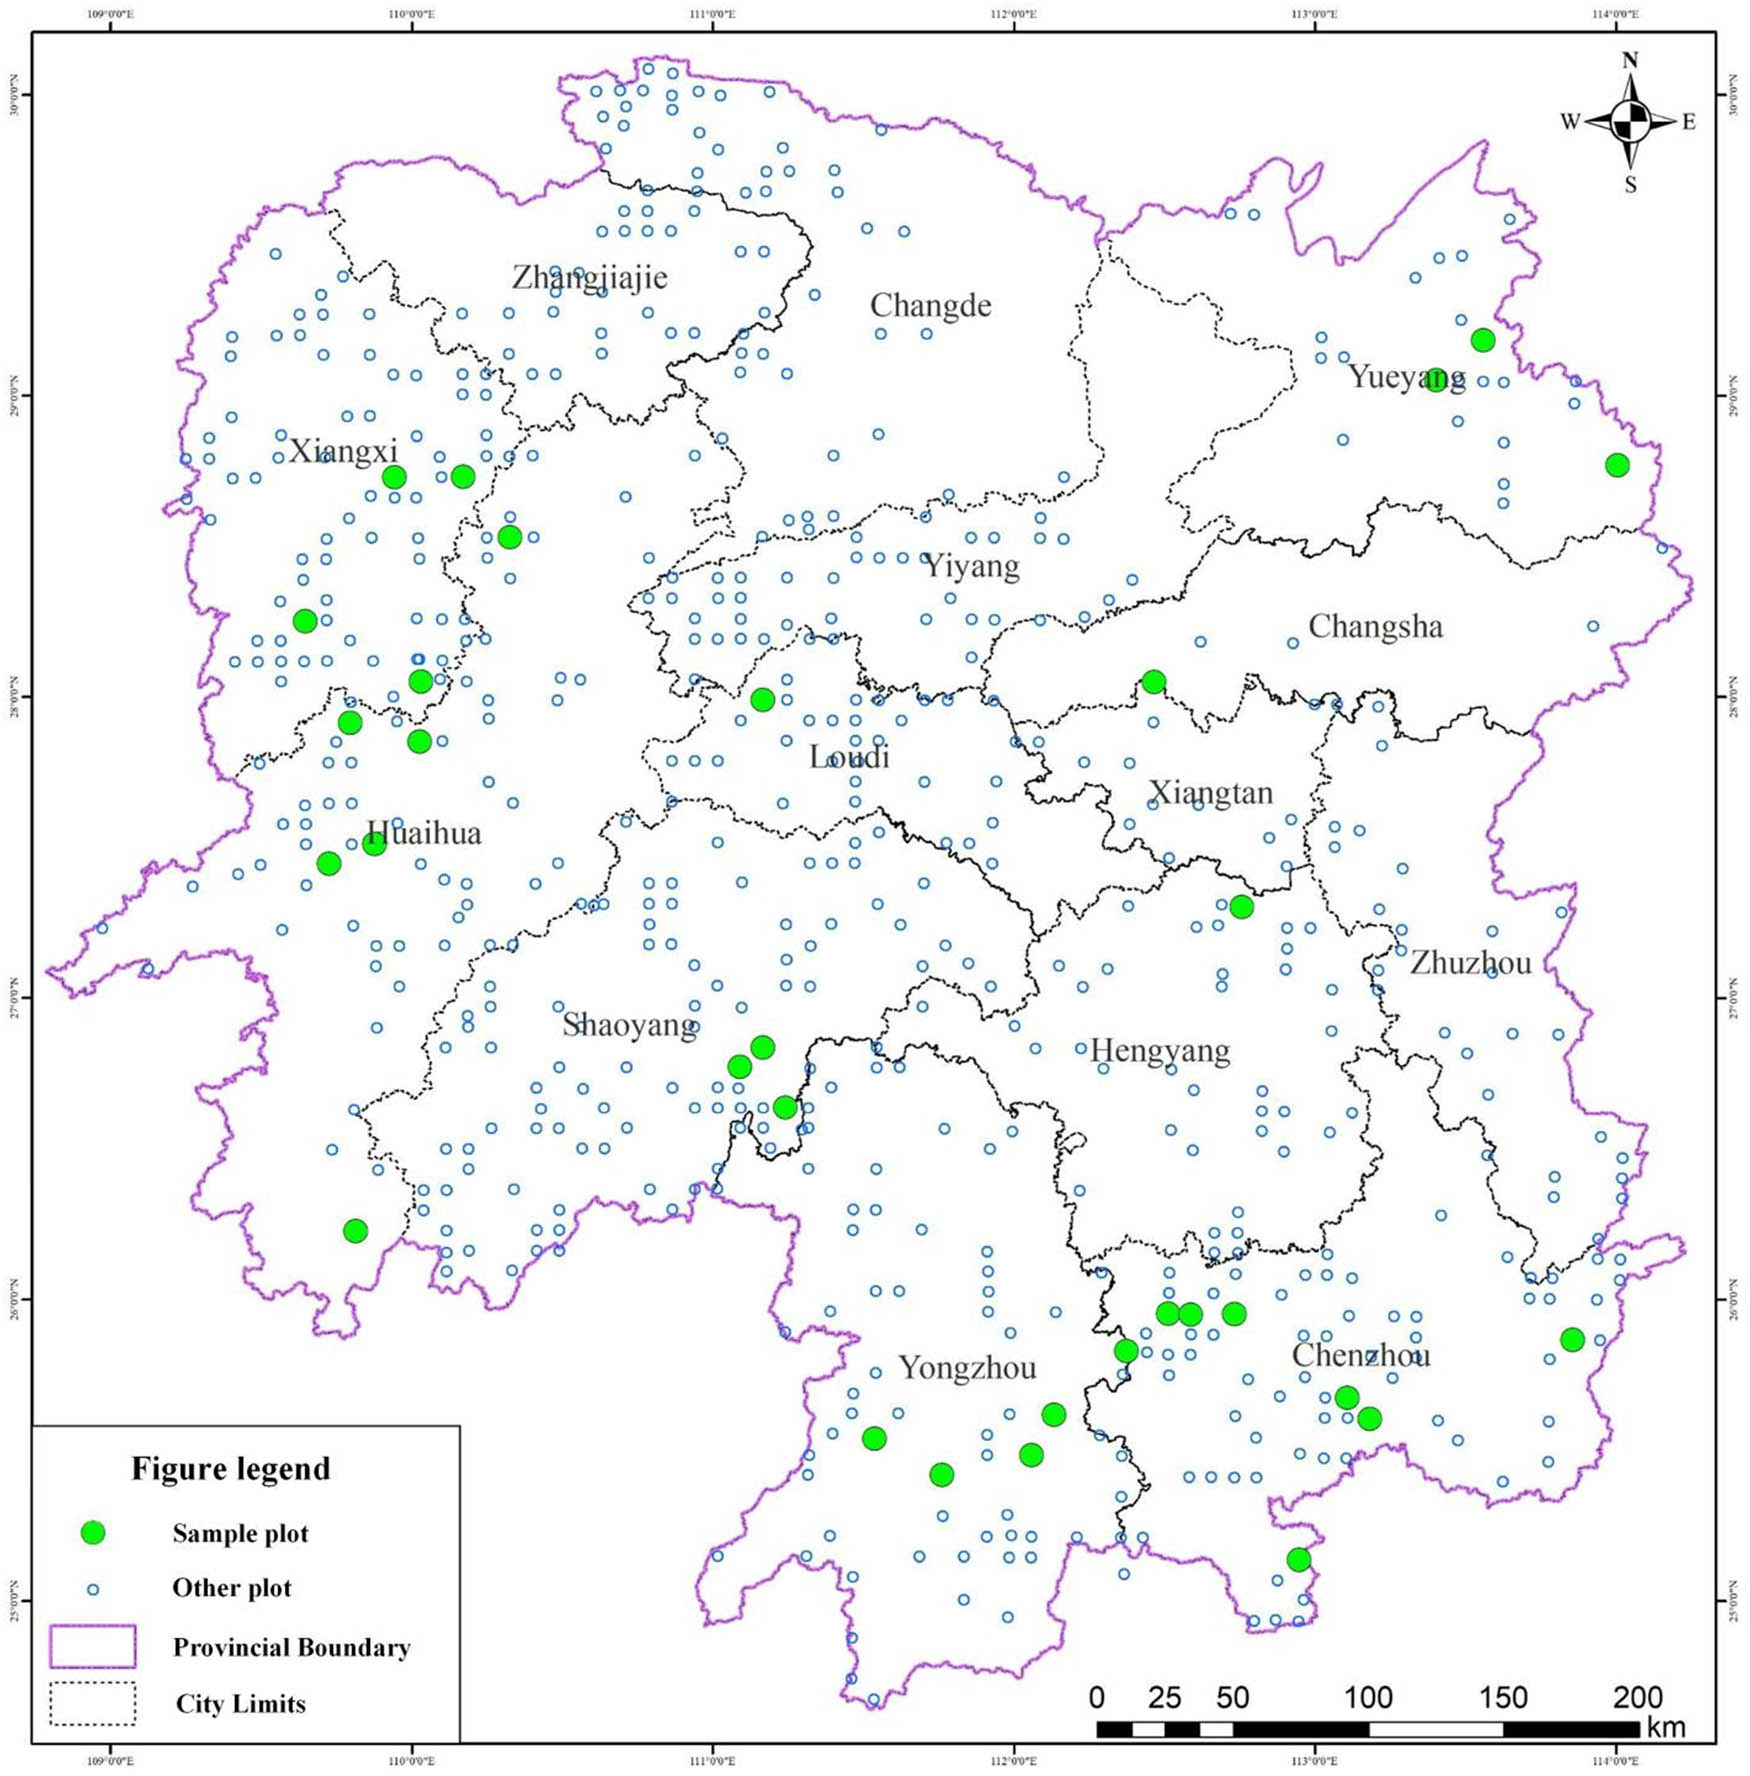
Locations of 31 plots.
2.2 Horizontal structure analysis
The DBH, crown length, and tree height of the forest are the basic parameters in a stage of certain age, which reflects the growth of the forest. In this study, all the P. massoniana plots were divided into four stages of age, first: young aged (≤20), middle aged (21–30), near mature (31–40), and mature (41–60), where the age in years is presented in parentheses. The DBH, tree height, crown width, and crown length of four stages were analyzed and compared. Wilcoxon test for differences between age stages was conducted.
To assess the DBH structure of trees in the whole area and nine cities, the plots were grouped according to the city distribution. Anderson–Darling (AD) k-Sample test was initially used to test the null hypothesis between the cities that all DBH distributions occurred from a common population. The AD test is a robust and proven method to test the differences among the DBH distributions [26]. The p-value <0.05 indicated that the samples were not from the same population. The DBH was divided into following classes: ≤5, 5–8, 8–12, 12–16, 16–20, 20–24, 24–28, 28–32, 32–36, and 36–40 cm. The Shannon–Wiener index was used to calculate the structural diversity index from the proportional abundance of trees in different DBH classes [11,27]:
where p i is the proportion of trees in the ith diameter class and n is the number of diameter classes (n = 10 for all cities). The Shannon–Wiener index was calculated for each city and plot.
2.3 Identification of driving factors for the DBH diversity
From the selected plots, five stand dynamics factors were extracted from the database to estimate their contribution to the DBH diversity. These factors included the altitude, stand density (number of trees in 1,000 m2), landform, slope direction, and soil type (red soil, lateritic red soil, and yellow soil). Landforms were divided into three types in this study: hill (altitude range from 200 to 500 m), low-mountain (altitude range from 500 to 1,000 m), and mid-mountain (altitude range from 1,000 to 3,500 m). Additionally, the average temperature and average precipitation of each plot was gained from the world climate database (WorldClim: http://www.worldclim.org/). The above factors were considered as the basic components that reflected the potential forest productivity according to the Chinese National Standard-Technical regulations as an inventory for the forest management planning and design (GB/T 26424-2010). We quantified the relative contribution of these seven drivers to the DBH diversity of all plots using the gradient boosting model (GBM) [28], based on the Shannon–Wiener index of each plot. This model can fit the nonlinear relationship continuously between diversity and factors, and its flexibility, explanatory variable selection and cross-validation approach offer an advantage in the ecology studies [29,30]. Additionally, the marginal plots were constructed, which reflected the influence from one predictor variable, when the other predictor variables were fixed.
2.4 Vertical structure analysis
The TSTRAT algorithm developed by Latham et al. [17] was used to assess the vertical structure of forest. The algorithm determines a vertical height cut-off point and assigns trees to vertical strata based on tree heights and crown length layers. The formula is shown in the following equation:
where CPS represents the cut-off height value, HBLC represents the height-to-base of the live crown, and CL represents the crown length. The coefficient 0.4 arises from the consideration that the competition to stay in an advantageous position for the acquisition of light was the greatest in the top 60% of the tree crown. The vertical strata of each plot were calculated by the TSTRAT algorithm to assess the vertical structure of the whole population.
The tree height and DBH were considered as the best indicators in crown prediction [21,22]. But in practical application, due to site conditions, management measures, human activities, and other factors, the relationship between the crown and other factors is complex and may be nonlinear. The traditional correlation analysis only describes the overall relationship between two or more characteristics. However, the path analysis method developed by Wright [31] and Bhatt [32] to study the direct and indirect relationships between multiple independent variables and a dependent variable is useful in determining the contribution of component variables to a character [33]. Hence, in this study, the path analysis was used to analyze the effects of height and DBH on crown width and live crown ratio under different age classes. The live crown ratio was calculated as per the following equation:
where L represents the crown length (height from the first living branch to the top) and H represents the tree height.
The path coefficients were calculated as follows:
where Cv
ij
represents the covariance of i and j,
All the data analysis and graphics were conducted by using R Core Team, ggplot2 [34], pastecs [35], SEM [36], lattice [37], and gbm [38] software packages.
3 Results
3.1 DBH, height, and crown distributions of different age stages
The DBH distribution of four age stages is shown in Figure 2a. The average DBH value increased with the age stage (p < 0.05). The DBH distribution at the succession stages appeared to be inclined to the right side, except that of the mature stage. The average DBH from young to mature stage were 8.73, 12.19, 14.4, and 21.75 cm, respectively. The height of young aged stage was significantly lower than that of the other stages (p < 0.05). Middle aged and near-mature stage showed no significant difference, and the distributions of the young aged, near-mature, and mature stages were multimodal (Figure 2b). The crown width of the young aged, middle aged, and near-mature stages showed statistically different variables between each two stages. The distributions were multimodal except for the near-mature stage (Figure 2c). The crown length of the young aged and mature stage was significantly higher than that of the other stages, and the distribution appeared to be inclined to the right side, except in that of the mature stage (Figure 2d).
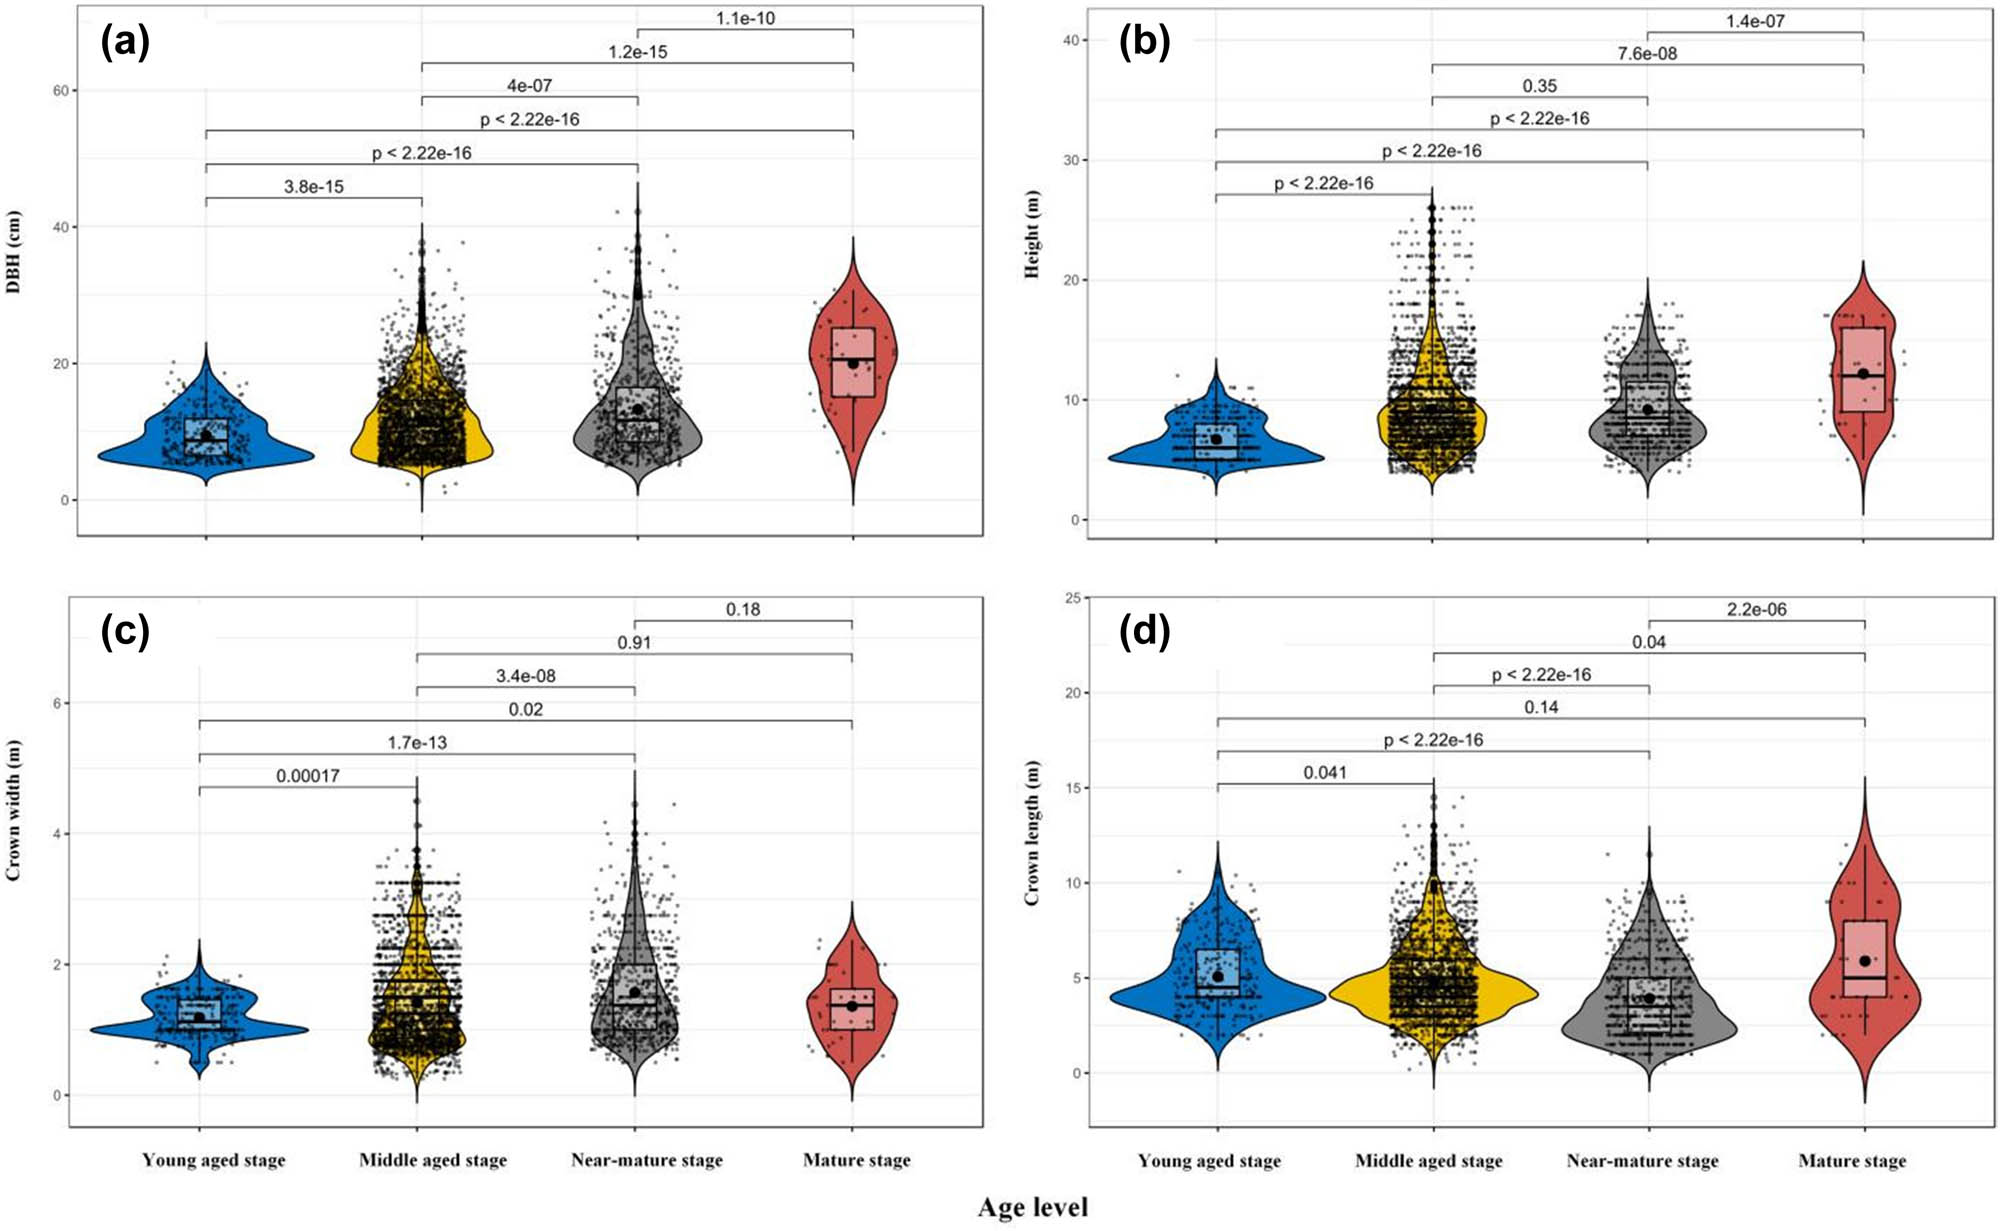
Violin plot of DBH (a), height (b), crown width (c), and crown length (d) (values represent the Wilcoxon test between the stages of age).
3.2 DBH structure of trees in each city
It was observed that the AD k-Sample test (p < 2.2 × 10⁻¹⁶) rejected the null hypothesis, i.e., the diameter distributions of nine cities did not occur from the same population. The skewness and kurtosis of the DBH distribution in each city were calculated (Table 2). The skewness of Yongzhou was highest that indicated the greatest degree of deviation (1.6807), and the distribution was right-skewed except in case of Loudi. The kurtosis indicated that the distribution was steep compared to the normal distribution except for the cities Hengyang and Loudi, while Xiangtan and Yongzhou had the greatest degree of deviation (4.111).
Normal distribution test and diversity of DBH distribution in nine cities
| City | Skewness | Kurtosis | Shannon–Wiener index |
|---|---|---|---|
| Chenzhou | 1.1024 | 1.7682 | 1.323 |
| Hengyang | 0.4374 | −0.0692 | 1.666 |
| Huaihua | 0.9008 | 1.1986 | 1.564 |
| Loudi | −0.2733 | −1.0658 | 1.846 |
| Shaoyang | 0.7673 | 0.3982 | 1.689 |
| Xiangtan | 0.0028 | −0.7865 | 1.762 |
| Xiangxi | 0.8231 | 0.6559 | 1.895 |
| Yongzhou | 1.6807 | 4.1112 | 1.508 |
| Yueyang | 0.9925 | 0.9834 | 1.449 |
The average age of each plot was 24, which indicated that the forest was in the middle age. The distributions of DBH class across the nine cities are presented in Figure 3 with binary polynomial fitting curve and Shannon–Wiener index (also in Table 2). An exponential reduction in the proportion of trees in each subsequently larger diameter class was found in the Chenzhou, Huaihua, Shaoyang, Xiangxi, and Yongzhou cities. These cities had a large proportion of trees with small DBH (<15 cm). Hengyang, Xiangtan, and Yueyang cities showed a linear decrease in the proportion of trees in each subsequently larger diameter class. Loudi exhibited an even diameter distribution, whereby the largest DBH class had the same proportion with others. Most cities showed a maturing structure. The DBH diversity of Xiangxi city was the highest (1.895) followed by Loudi city (1.846), which indicated a better DBH structure. The DBH diversity of Chenzhou and Yueyang city was 1.323 and 1.449, respectively, which indicates the presence of a relatively simple stand structure, and needs more effort to promote the forest structure.
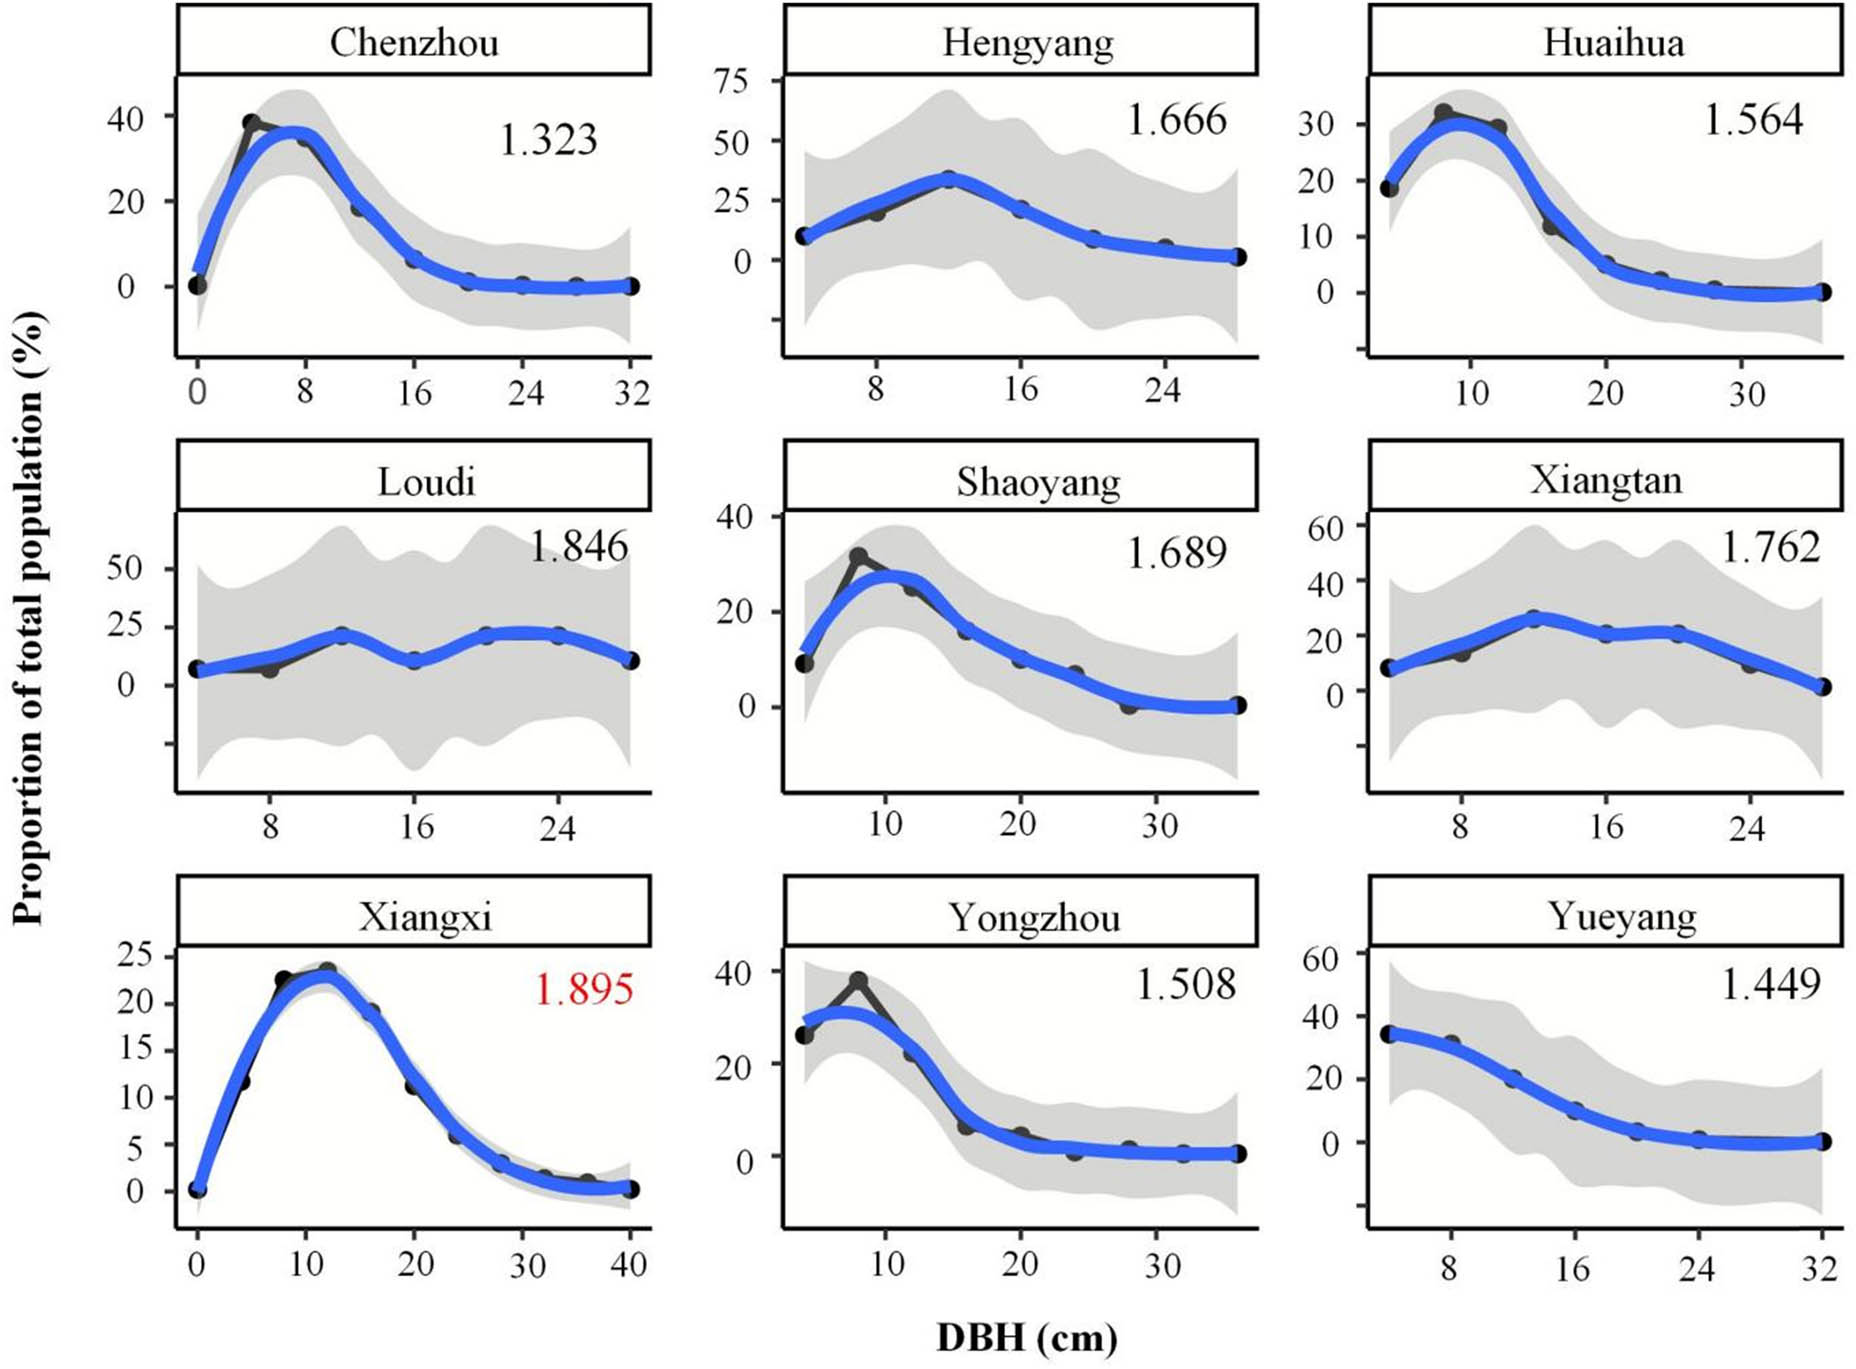
DBH distributions for nine cities (Data points represent the percent trees in each city within the DBH class. Shannon–Wiener index of each city is in the upper right corner. Blue line represents the fitting curve, at 95% confidence).
3.3 Driving factors of DBH diversity
The effect of each single factor is shown in Figure 4a. DBH diversity sharply decreased, when the stand density reached 150 (per 1,000 m2). In case of the landform, the plots in low- and mid-mountain exhibited a higher DBH diversity. Considering the soil type, the plots with yellow soil exhibited a higher DBH diversity. In case of the altitude factor, the DBH diversity increased at 200 m and then decreased and at last remains unchanged at altitude over 400 m. In case of the landform and slope direction, the plots with north, north-east, and north-west presented a higher DBH diversity; but the plots with lateritic and yellow soil exhibited a higher DBH diversity. Considering the temperature factor, the plot with 17℃ showed a highest DBH diversity, and in case of the precipitation, the plot with precipitation over 1,500 mm exhibited a higher DBH diversity.
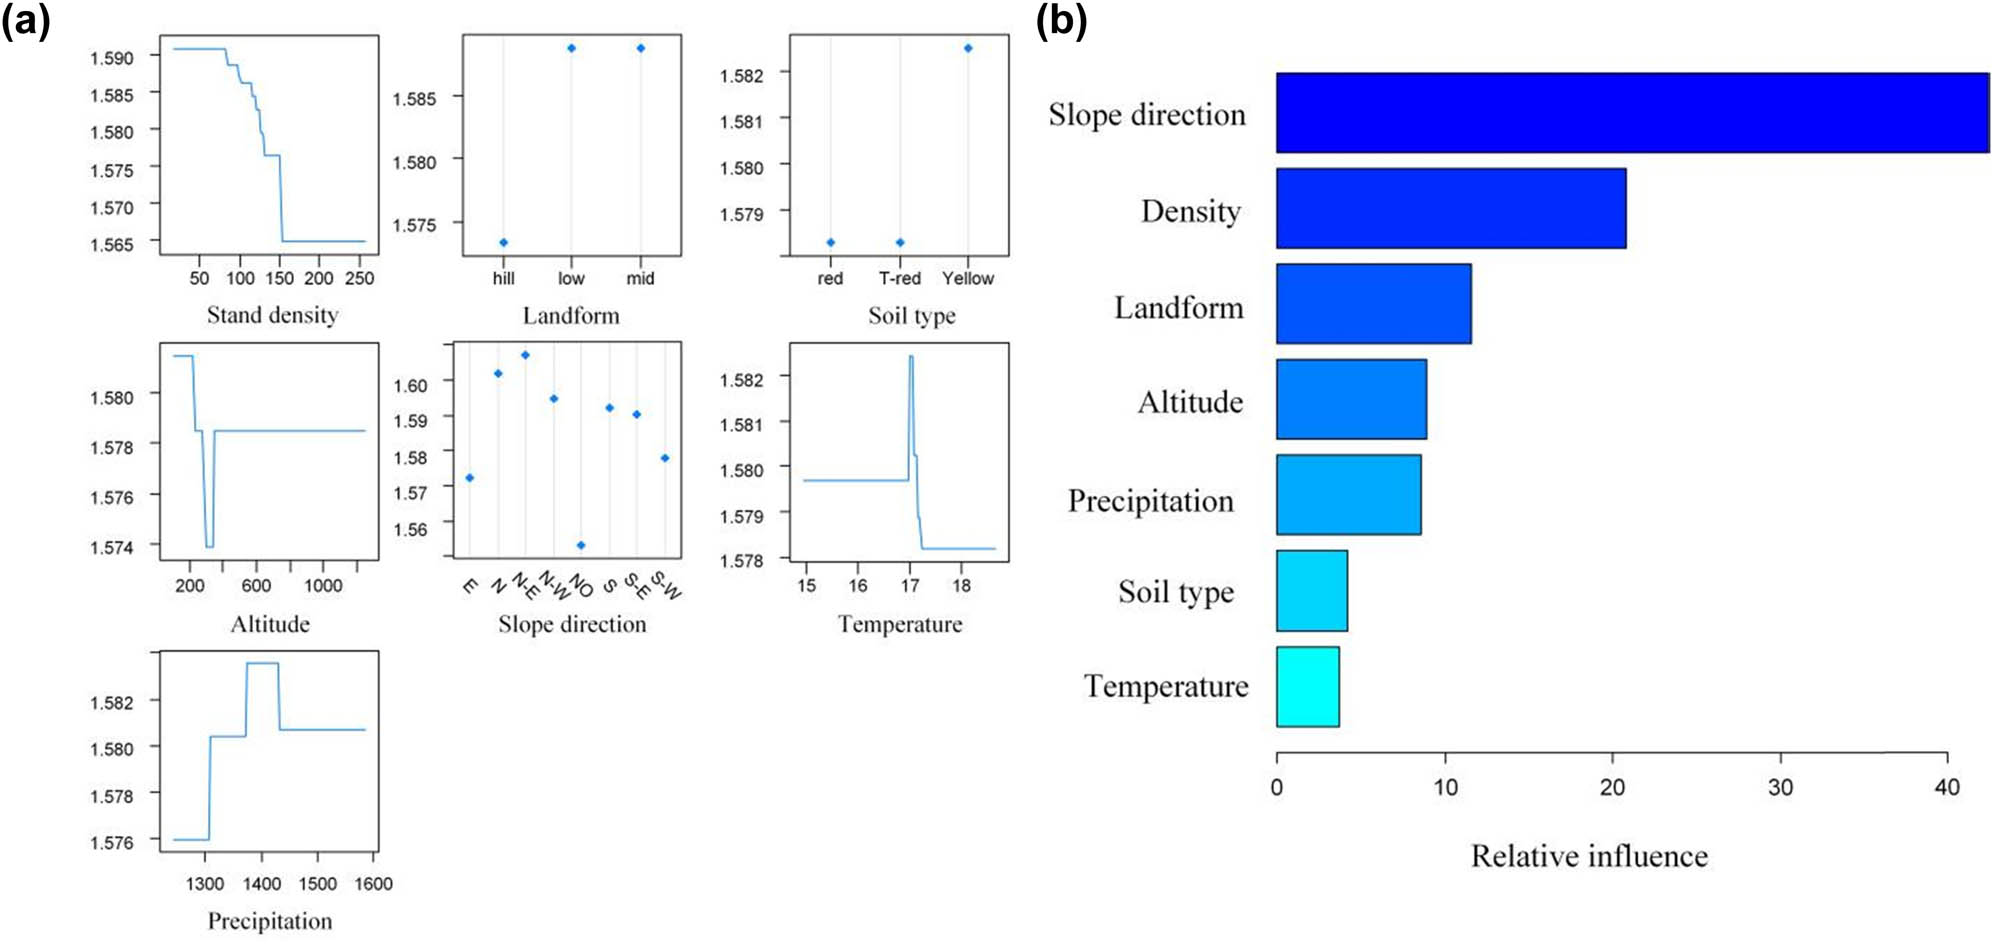
Relationships between the DBH diversity and seven factors: (a) effect of single factor and (b) importance of factors. Vertical (y) axis represents the DBH diversity index.
The importance of seven factors is presented in Figure 4b. The diversity was most affected by slope direction (over 40% relative influence), followed by stand density, landform, altitude, precipitation, soil type, and temperature. Additionally, the three-way marginal analysis was conducted. Figure 5a presents the three-way margin plot of the stand density, altitude, and slope direction. The DBH diversity reached the maxima at an altitude below about 220 m and stand density below 80 (per 1,000 m2), while it was minimum at an altitude between 200 and 400 m and stand density over 150 (per 1,000 m2). It is notable that the DBH diversity of the plot with south-east was minimum at an altitude below 380 m. In Figure 5b (three-way margin plot of stand density, altitude, and landform), it can be seen that the DBH diversity reached the maximum value at an altitude below 220 m and stand density below 80 (per 1,000 m2), and was minimum at an altitude between 300 and 370 m and stand density over 150 (per 1,000 m2).
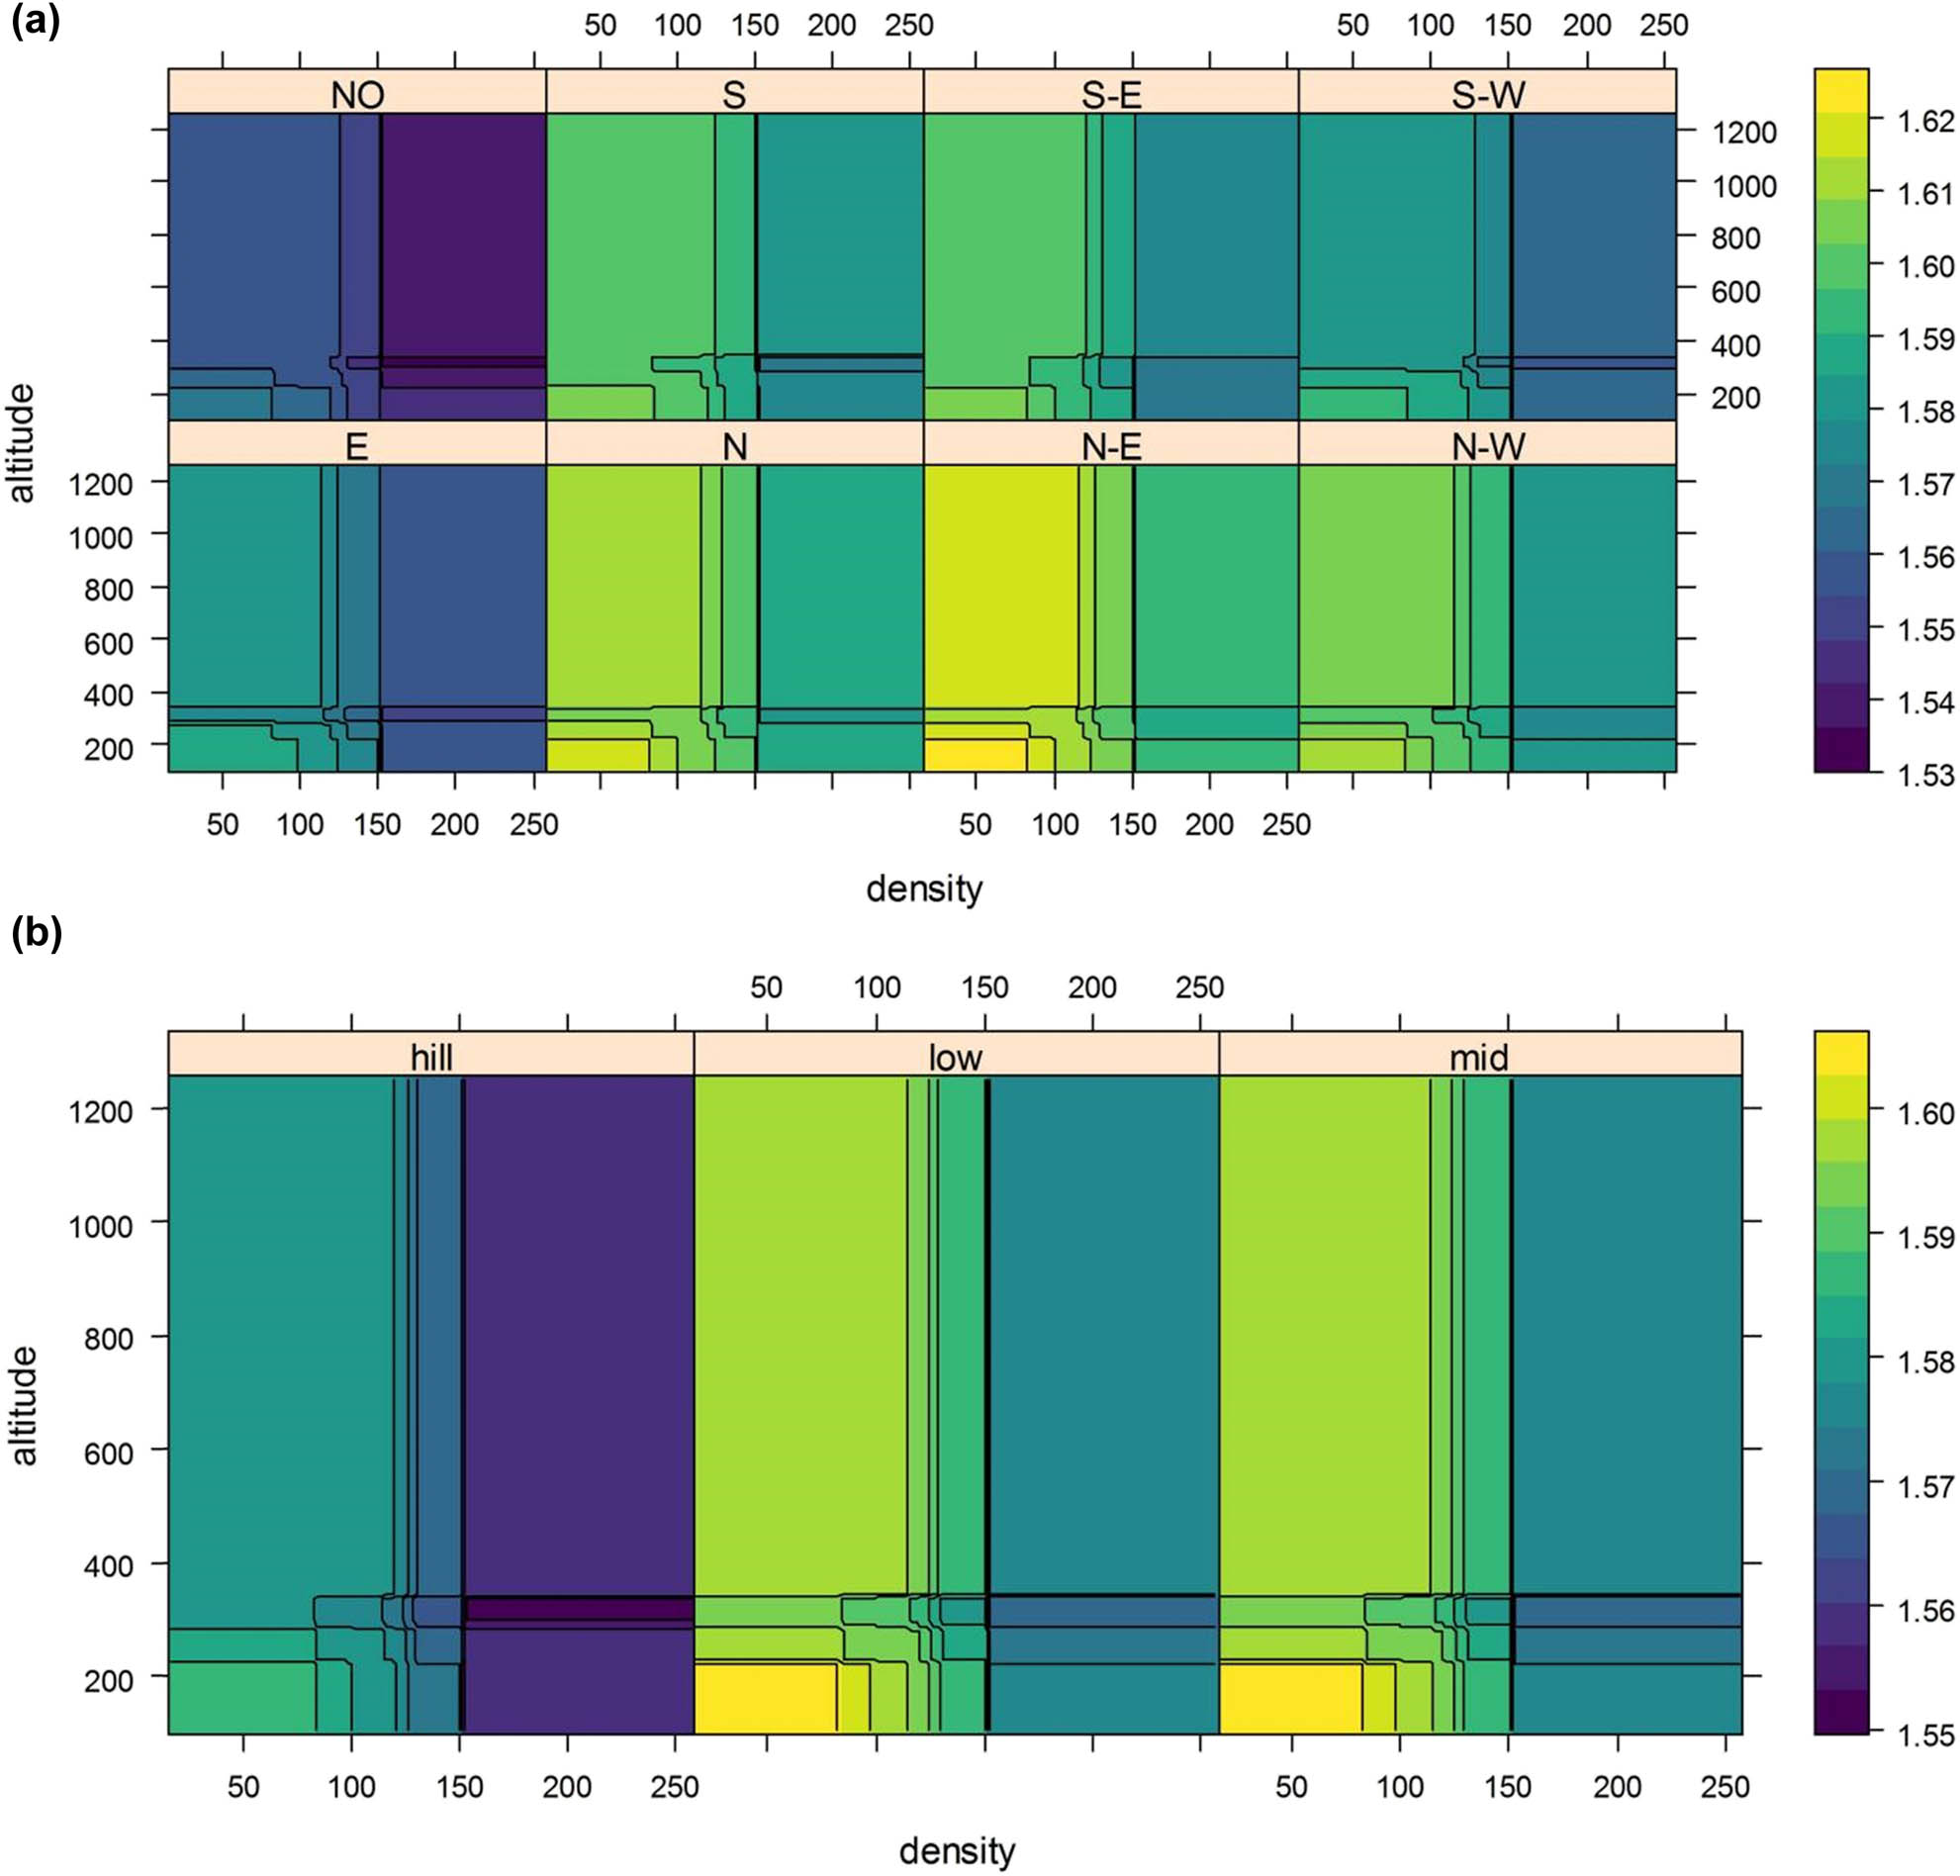
Three-way plots of marginal effect: (a) stand density, altitude, and slope direction on DBH diversity and (b) stand density, altitude, and landform on DBH diversity (color represents the value of DBH diversity).
3.4 Vertical and crown structure analysis
Using the TSTRAT method, a preliminary analysis showed that 13 plots were characterized by two vertical layers, and 19 were characterized by one vertical layer. The dominant layer represented 94.74% of the trees, the average tree height of dominant layer was 9.18 m, the average crown length was 4.73 m, and the average DBH was 11.94 cm. Specifically, in the plots characterized by two canopy layers, the average percentage of dominant layer was 84.64%. This analysis of the vertical structure showed a reduced complexity of the stand, which may cause competition between the trees in the dominant layer.
Path analysis of the crown width showed that the degree of direct effect was higher (higher absolute value of coefficient), and both DBH and tree height had significant effects on the crown width (Table 3, p < 0.001). DBH showed a significant positive direct effect on the crown width in all stages, and the effect reached the peak at mature stage (1.03). The direct effect of DBH was higher than that of tree height. The tree height exhibited a positive direct effect on the crown width, except for the mature stage (p < 0.001), and presented a direct negative effect on the crown width in the mature stage (−0.69). The result showed that DBH estimation was more accurate in quickly obtaining the crown width of all stages.
Path analysis coefficient of DBH and tree height to crown width
| Forest age stage | Direct path coefficient | Indirect path coefficient | ||
|---|---|---|---|---|
| DBH | Tree height | DBH | Tree height | |
| Young aged | 0.47*** | 0.27*** | 0.32 | 0.17 |
| Mid aged | 0.42*** | 0.17*** | 0.23 | 0.08 |
| Near-mature | 0.48*** | 0.30*** | 0.35 | 0.20 |
| Mature | 1.03*** | −0.69*** | 0.52 | −0.06 |
Note: ‘***’ represent the significant level of 0.001.
Path analysis of the live crown ratio showed that the degree of direct effect was higher (higher absolute value of coefficient). DBH showed a significant positive effect in the mid- and near-mature stages, while had significant negative effects in the mature stages (Table 4, p < 0.001). The tree height had a significant positive effect in the young and mature stage, and had a significant negative effect in the mid- and near-mature stage (p < 0.001). The absolute value of the direct path coefficient of tree height was higher than DBH in the young, mid, and mature stages. The results showed that the tree height estimation was more accurate in quickly obtaining the live crown ratio of the young, mid, and mature stages, while the estimation of DBH was more accurate in near-mature stages.
Path analysis coefficient of DBH and tree height to live crown ratio
| Forest age stage | Direct path coefficient | Indirect path coefficient | ||
|---|---|---|---|---|
| DBH | Tree height | DBH | Tree height | |
| Young aged | −0.04 | 0.64*** | −0.02 | 0.39 |
| Mid aged | 0.30*** | −0.56*** | −0.03 | 0.19 |
| Near-mature | 0.42*** | −0.15*** | 0.13 | −0.03 |
| Mature | −0.46*** | 0.47*** | 0.05 | 0.06 |
Note: ‘***’ represent the significant level of 0.001.
4 Discussion
Many of the earlier studies on P. massoniana forest structures were based on the conditions of few study plots only and/or were situated over a limited GPS range [39–42]. The present study was conducted based on the latest inventory data (2019) of nine cities in the Hunan province with a range of different site conditions, which provided a comprehensive understanding of pure P. massoniana forest structure. The results indicated that the distribution of DBH, height, crown width, and crown height in the different stages suggested an unstable state; specifically, the DBH, crown width, and crown length between the succession age stages were small. Due to the early uniform standards of planting and management strategy, most pure P. massoniana forests were composed of individuals with same age, and the planting density did not match the stand dynamics, which caused a simple horizontal structure. The DBH fitting distribution curve of Chenzhou, Huaihua, Shaoyang, and Xiangxi in the present study was consistent with a maturing distribution. These cities were rich in forest resource in the Hunan province and had a greater proportion of trees with 5–20 cm DBH. Among the nine cities, Loudi city presented a mature distribution. Yongzhou and Yueyang cities exhibited a youthful distribution, which suggest a recent increase in tree planting efforts [11]. In the DBH distribution, most of the cities were dominated by small trees. In fact, the forest in Loudi that was identified as mature population also indicated that there was a need of more effective management efforts. A close-to-nature management has been applied on many species including the P. massoniana, and this strategy simulates the process in a natural forest. A youthful and maturing distribution may help to ensure stability, because the high proportion of seedlings and saplings are recruited into larger diameter classes over time to counteract the high rates of mortality [15]. Previous studies show that a proper introduction of broad-leaved trees into pure P. massoniana forests improved the DBH growth and ecological value [43].
There are many ways to quantify structural diversity [44]. Quantify stand structure diversity with tree-size variability were applied in Canada [45]. Size-density indices were used in the contrast between even-aged vs uneven-aged stands [46,47]. DBH is among the most commonly collected data, and is useful in making the management and planning decisions [48]. The diversity characterized by DBH has been used as an indicator of forest stability and ecosystem services [11,15]. However, the extent and the influencing factors of the diversity were rarely studied. In this research, we verified and compared the contributions of the explanatory variables to the DBH diversity. GBM and marginal effect analyses showed that the slope direction strongly influenced the diversity, followed by the stand density, landform, and altitude. In the study area, there was a little difference in the regional climate; hence, the temperature and precipitation were not the primary affecting factors. Slope direction is the most important factor in landform that can affect the species component and production [49]. The solar radiation and angle between the wind direction are different in each slope direction, and the redistribution of water and heat conditions forms different micro-climates on the slope surface in different slope directions [50]. In Hunan province, most forest lies in the mountainous region. The micro-environment caused by slope direction and landform plays a great role in the mountain ecology, and can largely reflect the site quality. Previous studies found that the slope with north direction has a higher content of soil nutrients in the Mediterranean region and Qilian Mountains [51,52]. The higher content of soil nutrition reduces the competition by providing more natural resource. In this research, the DBH diversity was higher in the south direction, indicating that the slope with south direction provided more resource, contradicting the results of the previous study. Furthermore, it was found that the DBH diversity was also affected by other factors according to marginal analysis, such as stand density and altitude. The practical significance of the study shows that the capacity of the land resources should be fully considered during the formulation of a management plan. Thus, in the silviculture and management of P. massoniana in Hunan province, the stand density needs to be controlled, and the stand dynamics should be matched for a better DBH structure. According to our analysis, the matching of the suitable stand density the different stand dynamics was proposed. For example, the hill area with altitude over about 200 m should have the stand density below 120 (per 1,000 m2), the area with east slope direction and altitude below 300 m should have the stand density below 100 (per 1,000 m2). Chinese professional standard-technology regulations of the intermediate and management on P. massoniana (LYT2697-2016 suggests that the stand density should be ranged from 97 to 150 (per 1,000 m2) in a middle age forest, and the recommended stand density was similar to our findings. Our study supports the national standard-technology to a certain extent, and we proposed preliminary suggestions for the regional forest management. For the cities with poor DBH structure such as Chenzhou and Yueyang, a reasonable density adjustment can be the most simple and effective method.
Tree crown plays an important role in the growth of trees, and it can affect the growth and survival of trees [53], determines the size of the tree [54], and reflects the long-term competition level of the trees [55]. The tree with a bigger crown has a higher photosynthetic capacity, but the respiration of other organs gets enhanced and leads to a low production efficiency [56]. The relationship is that, the smaller the crown area per unit volume, the lower the productivity [57]. In the forest with high stand density, an increased competition between the individual trees has a negative influence on crown width [58], and narrower crowns have been associated with higher stand densities [59]. The crown of young trees is vulnerable to natural disasters, but not the stand density. In this study, the distribution of crown width was narrow, and the multimodal distribution could be caused by natural damage. Additionally, the crown width increased from the middle aged stage to a near-mature stage, and was steady in the mature stage. The crown length showed opposite trend, which indicated the adjustment in the growth strategy of the trees. The vertical structure characterized by TSTRAT indicated that the crown layer appeared quite compact with a small number of gaps. An ongoing competition between the trees in the dominant layer indicated a limited potential diversity, since the vertical distribution of the crown interferes with the presence of suitable habitat to accommodate different plant and animal species. For example, the complex crown structure has a higher bird diversity [60,61].
In this research, the crown width of each age stage had a strong relation with the DBH and tree height, which was consistent with the findings of previous studies [20–22]. Except for the no significant correlation between the live crown ratio and DBH of young aged forest, live crown ratio had a strong connection with DBH and tree height. Since there is a little competition in young aged forest, we assumed that the crown height may be decided by its inherited characteristics. Path analysis showed that the crown width exhibited a significant positive correlation with DBH in each stage, but showed a significant negative correlation with height in the mature stage. These results indicate that the trees tend to increase the height and DBH for the light resource and support, but the wider crown increases the risk of wind-breakage in the mature stage. From the results of live crown ratio and distribution, we can assume that the trees tend to increase the crown width and reduce the crown height in the competition of light and space before maturity, and then a narrow and deep crown gets developed to increase the area of photosynthesis and reduce the risk of wind-breakage in the mature stage.
5 Conclusion
In the present study, we presented the diameter and crown structure of pure P. massoniana forest in the Hunan province. It was found that the distribution of DBH, height, crown width, and crown height in different stages followed a non-normal distribution. There were statistically significant differences in the DBH distributions across the cities, indicating the apparent qualitative differences. The results indicate that there is a need to undertake measures to improve the forest by the local forest department. Furthermore, the slope direction, landform, and stand density had a stronger effect on the diameter diversity, and some management activities were suggested to use to improve the structure. The relationship between the crown structure and DBH/tree height showed an obvious change according to the different age stages, which highlighted the competition strategy of the population. Our study is the first comprehensive study on the non-spatial structure of pure P. massoniana forest in Hunan province, and can provide valuable information in the forest management, planning, and valuation of the ecosystem services.
Acknowledgements
The authors wish to thank anonymous reviewers for their constructive reviews.
-
Funding information: This research was supported by the Forestry Science and Technology Innovation Project of Hunan Province (HNGYL-2019-01).
-
Author contributions: Research conceptualization, Y.X.T. and N.D.; methodology and analysis, N.D. and Q.A.S.; writing and editing, S.W.S. and F.F.M. All authors have read and agreed to the published version of the manuscript.
-
Conflict of interest: Authors state no conflict of interest.
-
Data availability statement: The datasets generated during and/or analyzed during the current study are available from the corresponding author on reasonable request.
References
[1] Forrester DI, Kohnle U, Albrecht AT, Bauhus J. Complementarity in mixed-species stands of Abies alba and Picea abies varies with climate, site quality and stand density. For Ecol Manag. 2013;304:233–42.10.1016/j.foreco.2013.04.038Search in Google Scholar
[2] Zhang Y, Han Y, Chen H. Individual size inequality links forest diversity and above-ground biomass. J Ecol. 2015;103(5):1245–52.10.1111/1365-2745.12425Search in Google Scholar
[3] Gadow KV, Zhang CY, Wehenkel C, Pommerening A, Corral-Rivas J, Korol M, et al. Forest structure and diversity. Berlin: Springer; 2011.10.1007/978-94-007-2202-6_2Search in Google Scholar
[4] Rutten G, Ensslin A, Hemp A, Fischer M. Vertical and horizontal vegetation structure across natural and modified habitat types at Mount Kilimanjaro. PLOS One. 2015;10(9):e0138822.10.1371/journal.pone.0138822Search in Google Scholar PubMed PubMed Central
[5] Varga P, Chen HYH, Klinka K. Tree-size diversity between single- and mixed-species stands in three forest types in western Canada. Can J For Res. 2005;35(3):593–601.10.1139/x04-193Search in Google Scholar
[6] Podlaski R, Sobala T, Kocurek M. Patterns of tree diameter distributions in managed and unmanaged Abies alba Mill. and Fagus sylvatica L. forest patches. For Ecol Manag. 2019;435:97–105.10.1016/j.foreco.2018.12.046Search in Google Scholar
[7] Kara F. Comparison of tree diameter distributions in managed and unmanaged Kazda fir forests. Silva Balcanica. 2021;22(1):31–43.10.3897/silvabalcanica.22.e58020Search in Google Scholar
[8] Gorgoso JJ, Rojo A, Camara-Obregon A, Dieguez-Aranda U. A comparison of estimation methods for fitting Weibull, Johnson’s SB and beta functions to Pinus pinaster, Pinus radiata and Pinus sylvestris stands in northwest Spain. For Syst. 2012;21(14):446–59.10.5424/fs/2012213-02736Search in Google Scholar
[9] Mateus A, Tomé M. Modeling the diameter distribution of Eucalyptus plantations with Johnson’s probability density function: parameters recovery from a compatible system of equations to predict stand variables. Ann For Sci. 2011;68:325–35.10.1007/s13595-011-0037-7Search in Google Scholar
[10] Gorgoso-Varela JJ, Rojo-Alboreca A. Short communication: a comparison of estimation methods for fitting Weibull and Johnson’s SB functions to pedunculate oak (Quercus robur) and birch (Betula pubescens) stands in northwest Spain. For Syst. 2014;23(3):500–5.10.5424/fs/2014233-04939Search in Google Scholar
[11] Morgenroth J, Nowak DJ, Koeser AK. DBH distributions in America’s urban forests – an overview of structural diversity. Forests. 2020;11(2):135.10.3390/f11020135Search in Google Scholar
[12] Buongiorno J, Dahir S, Lu HC, Lin CR. Tree size diversity and economic returns in uneven-aged forest stands. For Sci. 1994;40(4):83–103.10.1093/forestscience/40.1.83Search in Google Scholar
[13] Mcroberts RE, Winter S, Chirici G, Hauk E, Pelz D, Moser MA, et al. Large-scale spatial patterns of forest structural diversity. Can J For Res. 2012;38:429–38.10.1139/X07-154Search in Google Scholar
[14] McPherson EG, Rowntree RA. Using structural measures to compare twenty-two U.S. street tree populations. Landsc J. 1989;8(1):13–23.10.3368/lj.8.1.13Search in Google Scholar
[15] McCarthy JW, Weetman G. Age and size structure of gap-dynamic, old-growth boreal forest stands in Newfoundland. Silva Fenn. 2006;40(2):209–30.10.14214/sf.339Search in Google Scholar
[16] Kara FJM, Lhotka B. Comparison of unmanaged and managed Kazdağı Fir-Scots pine forests for structural complexity. Turk J Agric For. 2020;44(1):62–70.10.3906/tar-1903-58Search in Google Scholar
[17] Latham PA, Zuuring HR, Coble DW. A method for quantifying vertical forest structure. For Ecol Manag. 1998;104(1):157–70.10.1016/S0378-1127(97)00254-5Search in Google Scholar
[18] BeBi P, Kienast F, SchönenBerger W. Assessing structures in mountain forests as a basis for investigating the forest’s dynamics and protective function. For Ecol Manag. 2001;145(1):3–14.10.1016/S0378-1127(00)00570-3Search in Google Scholar
[19] McElhinny C, Gibbons P, Bauhus J, Brack C. Forest and woodland stand structural complexity: its definition and measurement. For Ecol Manag. 2005;218(3):1–24.10.1016/j.foreco.2005.08.034Search in Google Scholar
[20] Loubota Panzou GJ, Fayolle A, Jucker T, Phillips OL, Bohlman S, Banin LF, et al. Pantropical variability in tree crown allometry. Glob Ecol Biogeogr. 2020;30(2):1–17.10.1111/geb.13231Search in Google Scholar
[21] Reid DEB, Uldis S, Lieffers VJ. Stem sapwood permeability in relation to crown dominance and site quality in self-thinning fire-origin lodgepole pine stands. Tree Physiol. 2003;12(23):833–40.10.1093/treephys/23.12.833Search in Google Scholar PubMed
[22] Foli EG, Alder D, Miller HG, Swained MD. Modelling growing space requirements for some tropical forest tree species. For Ecol Manag. 2003;173(1):79–88.10.1016/S0378-1127(01)00815-5Search in Google Scholar
[23] Fu LY, Sun H. Individual crown diameter prediction for Cunninghamia lanceolata forests based on mixed effects models. Sci Silvae Sin. 2013;49(8):65–74 (Chinese).Search in Google Scholar
[24] Gill SJ, Biging GS, Murphy EC. Modeling conifer tree crown radius and estimating canopy cover. For Ecol Manag. 2000;126(3):405–16.10.1016/S0378-1127(99)00113-9Search in Google Scholar
[25] Quan W, Ding G. Root tip structure and volatile organic compound responses to drought stress in Masson pine (Pinus massoniana Lamb.). Acta Physiol Plant. 2017;39(3):258.10.1007/s11738-017-2558-7Search in Google Scholar
[26] Engmann S, Cousineau D. Comparing distributions: the two-sample Anderson–Darling test as an alternative to the Kolmogorov–Smirnoff test. J Appl Quant. Methods. 2011;6(3):1–17.Search in Google Scholar
[27] Spellerberg IF, Fedor PJ. A tribute to Claude Shannon (1916–2001) and a plea for more rigorous use of species richness, species diversity and the ‘Shannon–Wiener’ Index. Glob Ecol Biogeogr. 2003;12(3):177–9.10.1046/j.1466-822X.2003.00015.xSearch in Google Scholar
[28] Friedman J. Greedy function approximation: a gradient boosting machine. Ann Stat. 2001;29(5):1189–1232.10.1214/aos/1013203451Search in Google Scholar
[29] Chen S, Jiang G, Ouyang Z, Xu W, Xiao Y. Relative importance of water, energy, and heterogeneity in determining regional pteridophyte and seed plant richness in China. J Syst Evol. 2011;49(2):95–107.10.1111/j.1759-6831.2011.00120.xSearch in Google Scholar
[30] Gu Y, Han S, Zhang JH, Chen ZJ. Temperature-dominated driving mechanisms of the plant diversity in temperate forests. Northeast China For. 2020;11(2):227.10.3390/f11020227Search in Google Scholar
[31] Wright S. Theory of path coefficients. Genetics. 1923;8:239–55.10.1093/genetics/8.3.239Search in Google Scholar PubMed PubMed Central
[32] Bhatt GM. Significance of path coefficient analysis in determining the nature of character association. Euphytica. 1973;22(2):338–43.10.1007/BF00022643Search in Google Scholar
[33] Santos C, Senalik D, Simon PW. Path analysis suggests phytoene accumulation is the key step limiting the carotenoid pathway in white carrot roots. Genet Mol Biol. 2005;28(2):287–93.10.1590/S1415-47572005000200019Search in Google Scholar
[34] Wickham H. ggplot2: Elegant graphics for data analysis. New York: Springer-Verlag; 2016.10.1007/978-3-319-24277-4Search in Google Scholar
[35] Philippe G, Frederic I, Michele E. Package for analysis of space–time ecological series; 2018: https://github.com/phgrosjean/pastecs.Search in Google Scholar
[36] John F, Zhenghua N, Jarrett B, Michael C, Saikat D, Michael F, et al. SEM: structural equation models; 2022: https://socialsciences.mcmaster.ca/jfox/.Search in Google Scholar
[37] Sarkar D. Lattice: multivariate data visualization with R. New York: Springer; 2008.10.1007/978-0-387-75969-2Search in Google Scholar
[38] Brandon G, Bradley B, Jay C. gbm: Generalized boosted regression models; 2022: https://github.com/gbm-developers/gbm.Search in Google Scholar
[39] Huang JR, Meng XY, Guan YX. Neural network models of diameter distribution for Pinus massoniana plantations. J Beijing Forestry Univ. 2006;28(1):28–31. Chinese.Search in Google Scholar
[40] Deng C, Zhang Y, Lu JY, Froese RE, Ming A, Li QF. Thinning effects on the tree height–diameter allometry of Masson pine (Pinus massoniana Lamb.). Forests. 2019;10(12):1129.10.3390/f10121129Search in Google Scholar
[41] Wang YQ, Yan PD, Ma JM, Guo F, Wei JM, Li MJ. Study on characteristics of DBH class and tree height class structure of artificial Pinus massoniana population in Guangxi. Guangxi Forestry Sci. 2020;49(4):481–91. Chinese.Search in Google Scholar
[42] Zhou J, Zhou Z, Zhao Q, Han Z, Dian Y. Evaluation of different algorithms for estimating the growing stock volume of Pinus massoniana plantations using spectral and spatial information from a SPOT6 image. Forests. 2020;11(5):540.10.3390/f11050540Search in Google Scholar
[43] Wang YQ, Yan PD, Ma JM, Guo F, Wei JM, Li MJ. Study on characteristics of DBH class and tree height class structure of artificial Pinus massoniana population in Guangxi. Guangxi Forestry Sci. 2020;49(4):480–91.Search in Google Scholar
[44] Staudhammer CL, Lemay VM. Introduction and evaluation of possible indices of stand structural diversity. Can J Res. 2001;31(7):1105–15.10.1139/x01-033Search in Google Scholar
[45] Brassard BW, Chen YH, Wang JR, Duinker PN. Effects of time since stand-replacing fire and overstory composition on live-tree structural diversity in the boreal forest of central Canada. Can J Res. 2008;38(7):52–62.10.1139/X07-125Search in Google Scholar
[46] Lozano-García B, Parras-Alcántara L, Brevik EC. Impact of topographic aspect and vegetation (native and reforested areas) on soil organic carbon and nitrogen budgets in Mediterranean natural areas. Sci Total Environ. 2016;544(8):963–70.10.1016/j.scitotenv.2015.12.022Search in Google Scholar PubMed
[47] Ducey MJ. The ratio of additive and traditional stand density indices. West J Appl For. 2009;24(1):5–10.10.1093/wjaf/24.1.5Search in Google Scholar
[48] Roman LA, McPherson EG, Scharenbroch BC, Bartens J. Identifying common practices and challenges for local urban tree monitoring programs across the United States. Arboric Urban For. 2013;39(6):292–9.10.48044/jauf.2013.038Search in Google Scholar
[49] Zhu M, Feng Q, Qin Y, Cao JJ, Li HY, Zhao Y. Soil organic carbon as functions of slope aspects and soil depths in a semiarid alpine region of Northwest China. Catena. 2017;152:94–102.10.1016/j.catena.2017.01.011Search in Google Scholar
[50] Sun W, Zhu H, Guo S. Soil organic carbon as a function of land use and topography on the Loess Plateau of China. Ecol Eng. 2015;83:249–57.10.1016/j.ecoleng.2015.06.030Search in Google Scholar
[51] Long JN, Shaw JD. A density management diagram for even-aged ponderosa pine stands. West J Appl For. 2005;20(4):205–15.10.1093/wjaf/20.4.205Search in Google Scholar
[52] Qin YY, Holden NM, Feng Q, Meng Z. Influence of slope aspect on plant community composition and its implications for restoration of a Chinese mountain range. Pol J Environ Stud. 2017;26(1):375–83.10.15244/pjoes/64458Search in Google Scholar
[53] Kramer H. Crown development in conifer stands in Scotland as influenced by initial spacing and subsequent thinning treatment. Forestry. 1996;39(1):40–58.10.1093/forestry/39.1.40Search in Google Scholar
[54] Hamilton GJ. The dependence of volume increment of individual trees on dominance, crown dimensions, and competition. Forestry. 1969;42(2):133–44.10.1093/forestry/42.2.133Search in Google Scholar
[55] Biging GS, Matthias D. A comparison of distance-dependent competition measures for height and basal area growth of individual conifer trees. Forestence. 1992;38(3):695–720.Search in Google Scholar
[56] Larocque GR, Marshall PL. Evaluating the impact of competition using relative growth rate in red pine (Pinus resinosa Ait.) stands. For Ecol Manag. 1993;58(1):65–83.10.1016/0378-1127(93)90132-7Search in Google Scholar
[57] Gong NN, Ma LY, Jia LM, Duan J. Effects of different stand densities and site conditions on crown of Pinus tabulaeformis plantations in Beijing mountain area. J Northeast Forestry Univ. 2010;38(5):9–12.Search in Google Scholar
[58] Forrester DI, Benneter A, Bouriaud O, Bauhus J. Diversity and competition influence tree allometric relationships-developing functions for mixed-species forests. J Ecol. 2017;105(3):761–74.10.1111/1365-2745.12704Search in Google Scholar
[59] Moncrieff GR, Lehmann CER, Schnitzler J, Gambiza J, Hiernaux P, Ryan CM, et al. Contrasting architecture of key African and Australian savanna tree taxa drives intercontinental structural divergence. Glob Ecol Biogeogr. 2014;23(11):1235–44.10.1111/geb.12205Search in Google Scholar
[60] Sanesi G, Padoa-Schioppa E, Lorusso L, Bottoni L, Lafortezza R. Avian ecological diversity as an indicator of urban forest functionality. Results from two case studies in Northern and Southern Italy. Arboriculture Urban Forestry. 2009;35(2):80–6.10.48044/jauf.2009.015Search in Google Scholar
[61] Elia M, Lafortezza R, Tarasco E, Colangelo G, Sanesi G. The spatial and temporal effects of fire on insect abundance in Mediterranean forest ecosystems. For Ecol Manag. 2012;263:262–7.10.1016/j.foreco.2011.09.034Search in Google Scholar
© 2023 the author(s), published by De Gruyter
This work is licensed under the Creative Commons Attribution 4.0 International License.
Articles in the same Issue
- Biomedical Sciences
- Systemic investigation of inetetamab in combination with small molecules to treat HER2-overexpressing breast and gastric cancers
- Immunosuppressive treatment for idiopathic membranous nephropathy: An updated network meta-analysis
- Identifying two pathogenic variants in a patient with pigmented paravenous retinochoroidal atrophy
- Effects of phytoestrogens combined with cold stress on sperm parameters and testicular proteomics in rats
- A case of pulmonary embolism with bad warfarin anticoagulant effects caused by E. coli infection
- Neutrophilia with subclinical Cushing’s disease: A case report and literature review
- Isoimperatorin alleviates lipopolysaccharide-induced periodontitis by downregulating ERK1/2 and NF-κB pathways
- Immunoregulation of synovial macrophages for the treatment of osteoarthritis
- Novel CPLANE1 c.8948dupT (p.P2984Tfs*7) variant in a child patient with Joubert syndrome
- Antiphospholipid antibodies and the risk of thrombosis in myeloproliferative neoplasms
- Immunological responses of septic rats to combination therapy with thymosin α1 and vitamin C
- High glucose and high lipid induced mitochondrial dysfunction in JEG-3 cells through oxidative stress
- Pharmacological inhibition of the ubiquitin-specific protease 8 effectively suppresses glioblastoma cell growth
- Levocarnitine regulates the growth of angiotensin II-induced myocardial fibrosis cells via TIMP-1
- Age-related changes in peripheral T-cell subpopulations in elderly individuals: An observational study
- Single-cell transcription analysis reveals the tumor origin and heterogeneity of human bilateral renal clear cell carcinoma
- Identification of iron metabolism-related genes as diagnostic signatures in sepsis by blood transcriptomic analysis
- Long noncoding RNA ACART knockdown decreases 3T3-L1 preadipocyte proliferation and differentiation
- Surgery, adjuvant immunotherapy plus chemotherapy and radiotherapy for primary malignant melanoma of the parotid gland (PGMM): A case report
- Dosimetry comparison with helical tomotherapy, volumetric modulated arc therapy, and intensity-modulated radiotherapy for grade II gliomas: A single‑institution case series
- Soy isoflavone reduces LPS-induced acute lung injury via increasing aquaporin 1 and aquaporin 5 in rats
- Refractory hypokalemia with sexual dysplasia and infertility caused by 17α-hydroxylase deficiency and triple X syndrome: A case report
- Meta-analysis of cancer risk among end stage renal disease undergoing maintenance dialysis
- 6-Phosphogluconate dehydrogenase inhibition arrests growth and induces apoptosis in gastric cancer via AMPK activation and oxidative stress
- Experimental study on the optimization of ANM33 release in foam cells
- Primary retroperitoneal angiosarcoma: A case report
- Metabolomic analysis-identified 2-hydroxybutyric acid might be a key metabolite of severe preeclampsia
- Malignant pleural effusion diagnosis and therapy
- Effect of spaceflight on the phenotype and proteome of Escherichia coli
- Comparison of immunotherapy combined with stereotactic radiotherapy and targeted therapy for patients with brain metastases: A systemic review and meta-analysis
- Activation of hypermethylated P2RY1 mitigates gastric cancer by promoting apoptosis and inhibiting proliferation
- Association between the VEGFR-2 -604T/C polymorphism (rs2071559) and type 2 diabetic retinopathy
- The role of IL-31 and IL-34 in the diagnosis and treatment of chronic periodontitis
- Triple-negative mouse breast cancer initiating cells show high expression of beta1 integrin and increased malignant features
- mNGS facilitates the accurate diagnosis and antibiotic treatment of suspicious critical CNS infection in real practice: A retrospective study
- The apatinib and pemetrexed combination has antitumor and antiangiogenic effects against NSCLC
- Radiotherapy for primary thyroid adenoid cystic carcinoma
- Design and functional preliminary investigation of recombinant antigen EgG1Y162–EgG1Y162 against Echinococcus granulosus
- Effects of losartan in patients with NAFLD: A meta-analysis of randomized controlled trial
- Bibliometric analysis of METTL3: Current perspectives, highlights, and trending topics
- Performance comparison of three scaling algorithms in NMR-based metabolomics analysis
- PI3K/AKT/mTOR pathway and its related molecules participate in PROK1 silence-induced anti-tumor effects on pancreatic cancer
- The altered expression of cytoskeletal and synaptic remodeling proteins during epilepsy
- Effects of pegylated recombinant human granulocyte colony-stimulating factor on lymphocytes and white blood cells of patients with malignant tumor
- Prostatitis as initial manifestation of Chlamydia psittaci pneumonia diagnosed by metagenome next-generation sequencing: A case report
- NUDT21 relieves sevoflurane-induced neurological damage in rats by down-regulating LIMK2
- Association of interleukin-10 rs1800896, rs1800872, and interleukin-6 rs1800795 polymorphisms with squamous cell carcinoma risk: A meta-analysis
- Exosomal HBV-DNA for diagnosis and treatment monitoring of chronic hepatitis B
- Shear stress leads to the dysfunction of endothelial cells through the Cav-1-mediated KLF2/eNOS/ERK signaling pathway under physiological conditions
- Interaction between the PI3K/AKT pathway and mitochondrial autophagy in macrophages and the leukocyte count in rats with LPS-induced pulmonary infection
- Meta-analysis of the rs231775 locus polymorphism in the CTLA-4 gene and the susceptibility to Graves’ disease in children
- Cloning, subcellular localization and expression of phosphate transporter gene HvPT6 of hulless barley
- Coptisine mitigates diabetic nephropathy via repressing the NRLP3 inflammasome
- Significant elevated CXCL14 and decreased IL-39 levels in patients with tuberculosis
- Whole-exome sequencing applications in prenatal diagnosis of fetal bowel dilatation
- Gemella morbillorum infective endocarditis: A case report and literature review
- An unusual ectopic thymoma clonal evolution analysis: A case report
- Severe cumulative skin toxicity during toripalimab combined with vemurafenib following toripalimab alone
- Detection of V. vulnificus septic shock with ARDS using mNGS
- Novel rare genetic variants of familial and sporadic pulmonary atresia identified by whole-exome sequencing
- The influence and mechanistic action of sperm DNA fragmentation index on the outcomes of assisted reproduction technology
- Novel compound heterozygous mutations in TELO2 in an infant with You-Hoover-Fong syndrome: A case report and literature review
- ctDNA as a prognostic biomarker in resectable CLM: Systematic review and meta-analysis
- Diagnosis of primary amoebic meningoencephalitis by metagenomic next-generation sequencing: A case report
- Phylogenetic analysis of promoter regions of human Dolichol kinase (DOLK) and orthologous genes using bioinformatics tools
- Collagen changes in rabbit conjunctiva after conjunctival crosslinking
- Effects of NM23 transfection of human gastric carcinoma cells in mice
- Oral nifedipine and phytosterol, intravenous nicardipine, and oral nifedipine only: Three-arm, retrospective, cohort study for management of severe preeclampsia
- Case report of hepatic retiform hemangioendothelioma: A rare tumor treated with ultrasound-guided microwave ablation
- Curcumin induces apoptosis in human hepatocellular carcinoma cells by decreasing the expression of STAT3/VEGF/HIF-1α signaling
- Rare presentation of double-clonal Waldenström macroglobulinemia with pulmonary embolism: A case report
- Giant duplication of the transverse colon in an adult: A case report and literature review
- Ectopic thyroid tissue in the breast: A case report
- SDR16C5 promotes proliferation and migration and inhibits apoptosis in pancreatic cancer
- Vaginal metastasis from breast cancer: A case report
- Screening of the best time window for MSC transplantation to treat acute myocardial infarction with SDF-1α antibody-loaded targeted ultrasonic microbubbles: An in vivo study in miniswine
- Inhibition of TAZ impairs the migration ability of melanoma cells
- Molecular complexity analysis of the diagnosis of Gitelman syndrome in China
- Effects of maternal calcium and protein intake on the development and bone metabolism of offspring mice
- Identification of winter wheat pests and diseases based on improved convolutional neural network
- Ultra-multiplex PCR technique to guide treatment of Aspergillus-infected aortic valve prostheses
- Virtual high-throughput screening: Potential inhibitors targeting aminopeptidase N (CD13) and PIKfyve for SARS-CoV-2
- Immune checkpoint inhibitors in cancer patients with COVID-19
- Utility of methylene blue mixed with autologous blood in preoperative localization of pulmonary nodules and masses
- Integrated analysis of the microbiome and transcriptome in stomach adenocarcinoma
- Berberine suppressed sarcopenia insulin resistance through SIRT1-mediated mitophagy
- DUSP2 inhibits the progression of lupus nephritis in mice by regulating the STAT3 pathway
- Lung abscess by Fusobacterium nucleatum and Streptococcus spp. co-infection by mNGS: A case series
- Genetic alterations of KRAS and TP53 in intrahepatic cholangiocarcinoma associated with poor prognosis
- Granulomatous polyangiitis involving the fourth ventricle: Report of a rare case and a literature review
- Studying infant mortality: A demographic analysis based on data mining models
- Metaplastic breast carcinoma with osseous differentiation: A report of a rare case and literature review
- Protein Z modulates the metastasis of lung adenocarcinoma cells
- Inhibition of pyroptosis and apoptosis by capsaicin protects against LPS-induced acute kidney injury through TRPV1/UCP2 axis in vitro
- TAK-242, a toll-like receptor 4 antagonist, against brain injury by alleviates autophagy and inflammation in rats
- Primary mediastinum Ewing’s sarcoma with pleural effusion: A case report and literature review
- Association of ADRB2 gene polymorphisms and intestinal microbiota in Chinese Han adolescents
- Tanshinone IIA alleviates chondrocyte apoptosis and extracellular matrix degeneration by inhibiting ferroptosis
- Study on the cytokines related to SARS-Cov-2 in testicular cells and the interaction network between cells based on scRNA-seq data
- Effect of periostin on bone metabolic and autophagy factors during tooth eruption in mice
- HP1 induces ferroptosis of renal tubular epithelial cells through NRF2 pathway in diabetic nephropathy
- Intravaginal estrogen management in postmenopausal patients with vaginal squamous intraepithelial lesions along with CO2 laser ablation: A retrospective study
- Hepatocellular carcinoma cell differentiation trajectory predicts immunotherapy, potential therapeutic drugs, and prognosis of patients
- Effects of physical exercise on biomarkers of oxidative stress in healthy subjects: A meta-analysis of randomized controlled trials
- Identification of lysosome-related genes in connection with prognosis and immune cell infiltration for drug candidates in head and neck cancer
- Development of an instrument-free and low-cost ELISA dot-blot test to detect antibodies against SARS-CoV-2
- Research progress on gas signal molecular therapy for Parkinson’s disease
- Adiponectin inhibits TGF-β1-induced skin fibroblast proliferation and phenotype transformation via the p38 MAPK signaling pathway
- The G protein-coupled receptor-related gene signatures for predicting prognosis and immunotherapy response in bladder urothelial carcinoma
- α-Fetoprotein contributes to the malignant biological properties of AFP-producing gastric cancer
- CXCL12/CXCR4/CXCR7 axis in placenta tissues of patients with placenta previa
- Association between thyroid stimulating hormone levels and papillary thyroid cancer risk: A meta-analysis
- Significance of sTREM-1 and sST2 combined diagnosis for sepsis detection and prognosis prediction
- Diagnostic value of serum neuroactive substances in the acute exacerbation of chronic obstructive pulmonary disease complicated with depression
- Research progress of AMP-activated protein kinase and cardiac aging
- TRIM29 knockdown prevented the colon cancer progression through decreasing the ubiquitination levels of KRT5
- Cross-talk between gut microbiota and liver steatosis: Complications and therapeutic target
- Metastasis from small cell lung cancer to ovary: A case report
- The early diagnosis and pathogenic mechanisms of sepsis-related acute kidney injury
- The effect of NK cell therapy on sepsis secondary to lung cancer: A case report
- Erianin alleviates collagen-induced arthritis in mice by inhibiting Th17 cell differentiation
- Loss of ACOX1 in clear cell renal cell carcinoma and its correlation with clinical features
- Signalling pathways in the osteogenic differentiation of periodontal ligament stem cells
- Crosstalk between lactic acid and immune regulation and its value in the diagnosis and treatment of liver failure
- Clinicopathological features and differential diagnosis of gastric pleomorphic giant cell carcinoma
- Traumatic brain injury and rTMS-ERPs: Case report and literature review
- Extracellular fibrin promotes non-small cell lung cancer progression through integrin β1/PTEN/AKT signaling
- Knockdown of DLK4 inhibits non-small cell lung cancer tumor growth by downregulating CKS2
- The co-expression pattern of VEGFR-2 with indicators related to proliferation, apoptosis, and differentiation of anagen hair follicles
- Inflammation-related signaling pathways in tendinopathy
- CD4+ T cell count in HIV/TB co-infection and co-occurrence with HL: Case report and literature review
- Clinical analysis of severe Chlamydia psittaci pneumonia: Case series study
- Bioinformatics analysis to identify potential biomarkers for the pulmonary artery hypertension associated with the basement membrane
- Influence of MTHFR polymorphism, alone or in combination with smoking and alcohol consumption, on cancer susceptibility
- Catharanthus roseus (L.) G. Don counteracts the ampicillin resistance in multiple antibiotic-resistant Staphylococcus aureus by downregulation of PBP2a synthesis
- Combination of a bronchogenic cyst in the thoracic spinal canal with chronic myelocytic leukemia
- Bacterial lipoprotein plays an important role in the macrophage autophagy and apoptosis induced by Salmonella typhimurium and Staphylococcus aureus
- TCL1A+ B cells predict prognosis in triple-negative breast cancer through integrative analysis of single-cell and bulk transcriptomic data
- Ezrin promotes esophageal squamous cell carcinoma progression via the Hippo signaling pathway
- Ferroptosis: A potential target of macrophages in plaque vulnerability
- Predicting pediatric Crohn's disease based on six mRNA-constructed risk signature using comprehensive bioinformatic approaches
- Applications of genetic code expansion and photosensitive UAAs in studying membrane proteins
- HK2 contributes to the proliferation, migration, and invasion of diffuse large B-cell lymphoma cells by enhancing the ERK1/2 signaling pathway
- IL-17 in osteoarthritis: A narrative review
- Circadian cycle and neuroinflammation
- Probiotic management and inflammatory factors as a novel treatment in cirrhosis: A systematic review and meta-analysis
- Hemorrhagic meningioma with pulmonary metastasis: Case report and literature review
- SPOP regulates the expression profiles and alternative splicing events in human hepatocytes
- Knockdown of SETD5 inhibited glycolysis and tumor growth in gastric cancer cells by down-regulating Akt signaling pathway
- PTX3 promotes IVIG resistance-induced endothelial injury in Kawasaki disease by regulating the NF-κB pathway
- Pancreatic ectopic thyroid tissue: A case report and analysis of literature
- The prognostic impact of body mass index on female breast cancer patients in underdeveloped regions of northern China differs by menopause status and tumor molecular subtype
- Report on a case of liver-originating malignant melanoma of unknown primary
- Case report: Herbal treatment of neutropenic enterocolitis after chemotherapy for breast cancer
- The fibroblast growth factor–Klotho axis at molecular level
- Characterization of amiodarone action on currents in hERG-T618 gain-of-function mutations
- A case report of diagnosis and dynamic monitoring of Listeria monocytogenes meningitis with NGS
- Effect of autologous platelet-rich plasma on new bone formation and viability of a Marburg bone graft
- Small breast epithelial mucin as a useful prognostic marker for breast cancer patients
- Continuous non-adherent culture promotes transdifferentiation of human adipose-derived stem cells into retinal lineage
- Nrf3 alleviates oxidative stress and promotes the survival of colon cancer cells by activating AKT/BCL-2 signal pathway
- Favorable response to surufatinib in a patient with necrolytic migratory erythema: A case report
- Case report of atypical undernutrition of hypoproteinemia type
- Down-regulation of COL1A1 inhibits tumor-associated fibroblast activation and mediates matrix remodeling in the tumor microenvironment of breast cancer
- Sarcoma protein kinase inhibition alleviates liver fibrosis by promoting hepatic stellate cells ferroptosis
- Research progress of serum eosinophil in chronic obstructive pulmonary disease and asthma
- Clinicopathological characteristics of co-existing or mixed colorectal cancer and neuroendocrine tumor: Report of five cases
- Role of menopausal hormone therapy in the prevention of postmenopausal osteoporosis
- Precisional detection of lymph node metastasis using tFCM in colorectal cancer
- Advances in diagnosis and treatment of perimenopausal syndrome
- A study of forensic genetics: ITO index distribution and kinship judgment between two individuals
- Acute lupus pneumonitis resembling miliary tuberculosis: A case-based review
- Plasma levels of CD36 and glutathione as biomarkers for ruptured intracranial aneurysm
- Fractalkine modulates pulmonary angiogenesis and tube formation by modulating CX3CR1 and growth factors in PVECs
- Novel risk prediction models for deep vein thrombosis after thoracotomy and thoracoscopic lung cancer resections, involving coagulation and immune function
- Exploring the diagnostic markers of essential tremor: A study based on machine learning algorithms
- Evaluation of effects of small-incision approach treatment on proximal tibia fracture by deep learning algorithm-based magnetic resonance imaging
- An online diagnosis method for cancer lesions based on intelligent imaging analysis
- Medical imaging in rheumatoid arthritis: A review on deep learning approach
- Predictive analytics in smart healthcare for child mortality prediction using a machine learning approach
- Utility of neutrophil–lymphocyte ratio and platelet–lymphocyte ratio in predicting acute-on-chronic liver failure survival
- A biomedical decision support system for meta-analysis of bilateral upper-limb training in stroke patients with hemiplegia
- TNF-α and IL-8 levels are positively correlated with hypobaric hypoxic pulmonary hypertension and pulmonary vascular remodeling in rats
- Stochastic gradient descent optimisation for convolutional neural network for medical image segmentation
- Comparison of the prognostic value of four different critical illness scores in patients with sepsis-induced coagulopathy
- Application and teaching of computer molecular simulation embedded technology and artificial intelligence in drug research and development
- Hepatobiliary surgery based on intelligent image segmentation technology
- Value of brain injury-related indicators based on neural network in the diagnosis of neonatal hypoxic-ischemic encephalopathy
- Analysis of early diagnosis methods for asymmetric dementia in brain MR images based on genetic medical technology
- Early diagnosis for the onset of peri-implantitis based on artificial neural network
- Clinical significance of the detection of serum IgG4 and IgG4/IgG ratio in patients with thyroid-associated ophthalmopathy
- Forecast of pain degree of lumbar disc herniation based on back propagation neural network
- SPA-UNet: A liver tumor segmentation network based on fused multi-scale features
- Systematic evaluation of clinical efficacy of CYP1B1 gene polymorphism in EGFR mutant non-small cell lung cancer observed by medical image
- Rehabilitation effect of intelligent rehabilitation training system on hemiplegic limb spasms after stroke
- A novel approach for minimising anti-aliasing effects in EEG data acquisition
- ErbB4 promotes M2 activation of macrophages in idiopathic pulmonary fibrosis
- Clinical role of CYP1B1 gene polymorphism in prediction of postoperative chemotherapy efficacy in NSCLC based on individualized health model
- Lung nodule segmentation via semi-residual multi-resolution neural networks
- Evaluation of brain nerve function in ICU patients with Delirium by deep learning algorithm-based resting state MRI
- A data mining technique for detecting malignant mesothelioma cancer using multiple regression analysis
- Markov model combined with MR diffusion tensor imaging for predicting the onset of Alzheimer’s disease
- Effectiveness of the treatment of depression associated with cancer and neuroimaging changes in depression-related brain regions in patients treated with the mediator-deuterium acupuncture method
- Molecular mechanism of colorectal cancer and screening of molecular markers based on bioinformatics analysis
- Monitoring and evaluation of anesthesia depth status data based on neuroscience
- Exploring the conformational dynamics and thermodynamics of EGFR S768I and G719X + S768I mutations in non-small cell lung cancer: An in silico approaches
- Optimised feature selection-driven convolutional neural network using gray level co-occurrence matrix for detection of cervical cancer
- Incidence of different pressure patterns of spinal cerebellar ataxia and analysis of imaging and genetic diagnosis
- Pathogenic bacteria and treatment resistance in older cardiovascular disease patients with lung infection and risk prediction model
- Adoption value of support vector machine algorithm-based computed tomography imaging in the diagnosis of secondary pulmonary fungal infections in patients with malignant hematological disorders
- From slides to insights: Harnessing deep learning for prognostic survival prediction in human colorectal cancer histology
- Ecology and Environmental Science
- Monitoring of hourly carbon dioxide concentration under different land use types in arid ecosystem
- Comparing the differences of prokaryotic microbial community between pit walls and bottom from Chinese liquor revealed by 16S rRNA gene sequencing
- Effects of cadmium stress on fruits germination and growth of two herbage species
- Bamboo charcoal affects soil properties and bacterial community in tea plantations
- Optimization of biogas potential using kinetic models, response surface methodology, and instrumental evidence for biodegradation of tannery fleshings during anaerobic digestion
- Understory vegetation diversity patterns of Platycladus orientalis and Pinus elliottii communities in Central and Southern China
- Studies on macrofungi diversity and discovery of new species of Abortiporus from Baotianman World Biosphere Reserve
- Food Science
- Effect of berrycactus fruit (Myrtillocactus geometrizans) on glutamate, glutamine, and GABA levels in the frontal cortex of rats fed with a high-fat diet
- Guesstimate of thymoquinone diversity in Nigella sativa L. genotypes and elite varieties collected from Indian states using HPTLC technique
- Analysis of bacterial community structure of Fuzhuan tea with different processing techniques
- Untargeted metabolomics reveals sour jujube kernel benefiting the nutritional value and flavor of Morchella esculenta
- Mycobiota in Slovak wine grapes: A case study from the small Carpathians wine region
- Elemental analysis of Fadogia ancylantha leaves used as a nutraceutical in Mashonaland West Province, Zimbabwe
- Microbiological transglutaminase: Biotechnological application in the food industry
- Influence of solvent-free extraction of fish oil from catfish (Clarias magur) heads using a Taguchi orthogonal array design: A qualitative and quantitative approach
- Chromatographic analysis of the chemical composition and anticancer activities of Curcuma longa extract cultivated in Palestine
- The potential for the use of leghemoglobin and plant ferritin as sources of iron
- Investigating the association between dietary patterns and glycemic control among children and adolescents with T1DM
- Bioengineering and Biotechnology
- Biocompatibility and osteointegration capability of β-TCP manufactured by stereolithography 3D printing: In vitro study
- Clinical characteristics and the prognosis of diabetic foot in Tibet: A single center, retrospective study
- Agriculture
- Biofertilizer and NPSB fertilizer application effects on nodulation and productivity of common bean (Phaseolus vulgaris L.) at Sodo Zuria, Southern Ethiopia
- On correlation between canopy vegetation and growth indexes of maize varieties with different nitrogen efficiencies
- Exopolysaccharides from Pseudomonas tolaasii inhibit the growth of Pleurotus ostreatus mycelia
- A transcriptomic evaluation of the mechanism of programmed cell death of the replaceable bud in Chinese chestnut
- Melatonin enhances salt tolerance in sorghum by modulating photosynthetic performance, osmoregulation, antioxidant defense, and ion homeostasis
- Effects of plant density on alfalfa (Medicago sativa L.) seed yield in western Heilongjiang areas
- Identification of rice leaf diseases and deficiency disorders using a novel DeepBatch technique
- Artificial intelligence and internet of things oriented sustainable precision farming: Towards modern agriculture
- Animal Sciences
- Effect of ketogenic diet on exercise tolerance and transcriptome of gastrocnemius in mice
- Combined analysis of mRNA–miRNA from testis tissue in Tibetan sheep with different FecB genotypes
- Isolation, identification, and drug resistance of a partially isolated bacterium from the gill of Siniperca chuatsi
- Tracking behavioral changes of confined sows from the first mating to the third parity
- The sequencing of the key genes and end products in the TLR4 signaling pathway from the kidney of Rana dybowskii exposed to Aeromonas hydrophila
- Development of a new candidate vaccine against piglet diarrhea caused by Escherichia coli
- Plant Sciences
- Crown and diameter structure of pure Pinus massoniana Lamb. forest in Hunan province, China
- Genetic evaluation and germplasm identification analysis on ITS2, trnL-F, and psbA-trnH of alfalfa varieties germplasm resources
- Tissue culture and rapid propagation technology for Gentiana rhodantha
- Effects of cadmium on the synthesis of active ingredients in Salvia miltiorrhiza
- Cloning and expression analysis of VrNAC13 gene in mung bean
- Chlorate-induced molecular floral transition revealed by transcriptomes
- Effects of warming and drought on growth and development of soybean in Hailun region
- Effects of different light conditions on transient expression and biomass in Nicotiana benthamiana leaves
- Comparative analysis of the rhizosphere microbiome and medicinally active ingredients of Atractylodes lancea from different geographical origins
- Distinguish Dianthus species or varieties based on chloroplast genomes
- Comparative transcriptomes reveal molecular mechanisms of apple blossoms of different tolerance genotypes to chilling injury
- Study on fresh processing key technology and quality influence of Cut Ophiopogonis Radix based on multi-index evaluation
- An advanced approach for fig leaf disease detection and classification: Leveraging image processing and enhanced support vector machine methodology
- Erratum
- Erratum to “Protein Z modulates the metastasis of lung adenocarcinoma cells”
- Erratum to “BRCA1 subcellular localization regulated by PI3K signaling pathway in triple-negative breast cancer MDA-MB-231 cells and hormone-sensitive T47D cells”
- Retraction
- Retraction to “Protocatechuic acid attenuates cerebral aneurysm formation and progression by inhibiting TNF-alpha/Nrf-2/NF-kB-mediated inflammatory mechanisms in experimental rats”