Monitoring of hourly carbon dioxide concentration under different land use types in arid ecosystem
-
Khalid Guma Biro Turk
 ,
Abdulrahman O. Alghannam
,
Abdulrahman O. Alghannam

Abstract
Air pollution is a major factor affecting human life and living quality in arid and semiarid regions. This study was conducted in the Al-Ahsa district in the Eastern part of Saudi Arabia to measure carbon dioxide (CO2) concentration over different land-use types. Initially, the study’s land use/land cover (LULC) was classified using the spectral characteristics of Landsat-8 data. Then, sensors were placed in five sites of different LULC types to detect CO2, air temperature, and relative humidity. The Friedman test was used to compare CO2 concentration among the five sites. Five LULC types were identified over the study area: date palm, cropland, bare land, urban land, and water. The results indicated that CO2 concentration showed a maximum mean value of 577 ppm recorded from a site dominated by urban lands. During the peak time of human transportation, a maximum value of 659 ppm was detected. The CO2 concentration mean values detected for the other LULC types showed 535, 515, and 484 ppm for the bare land, cropland, and date palm, respectively. This study’s sensors and procedures helped provide information over relatively small areas. However, modelling CO2 fluctuations with time for LULC changes might improve management and sustainability.
1 Introduction
Air quality, air-condition, and climate are major factors affecting human life and living quality [1]. The atmospheric carbon dioxide (CO2) resulting from photosynthesis plays a major role in vegetation growth and is a crucial greenhouse gas (GHG) that contributes to global warming [2]. The carbon balance of arid regions can be significantly affected by environmental stresses and human activities [3,4]. The trend of the world population is to inhabit cities by 2050 [5], which might reflect the importance of decreasing GHG emissions [6]. As a result, the global mean concentration of CO2 rose steadily from approximately 280 ppm to a level exceeding 400 ppm in the present [7].
Land use/land cover (LULC) changes due to urban expansion are considered crucial factors affecting CO2 emissions [8]. LULC change affects the climate through changes in CO2 fluxes between the land and the atmosphere [9] and accounting for approximately 10–15% of the atmospheric increase in CO2 concentrations [10,11]. However, the LULC change can modulate the land–atmosphere CO2 flux at a regional scale compared to the effects of GHG [12]. The direct and indirect GHG emissions from land-use activities such as livestock farming, manure management, fertiliser use, and paddy rice contribute around 12% of today’s total GHG emissions and about 10% rise in CO2 emissions from deforestation [13,14]. Nevertheless, terrestrial ecosystems can play an important role in sequestering atmospheric CO2 for mitigating the GHG effect [15,16].
The observation of the land surface temperature (LST) in Shenyang, China, indicated that it was higher in urban and bare lands compared to agricultural and green lands [17]. The impact of the local climate zones (LCZ) on LST was investigated in Shenyang city, China’s urban and rural areas, by Zhao et al. [18]. Their findings showed that the LST of LCZs did not follow a fixed order, as they changed from one month to another depending on the land-use type in the urban and rural areas. Therefore, monitoring CO2 concentration in urban areas is essential to measure the CO2 emission from cities and estimate its contribution to the regional carbon budget [19]. CO2 fluxes in urban areas are affected by the vegetative cover, human activity, and climate factors such as precipitation and temperature [20,21]. However, it is crucial to separate the influences of climatic factors for air pollution and environment management controlling over different land-use systems [22]. In cities, the CO2 fluxes are controlled by fuel combustion from vehicles, industries, and buildings rather than biological processes [23,24]. Vegetation cover in urban areas can significantly influence the daily and seasonal patterns of the CO2 balances [25].
Climate change and LULC change significantly affect CO2 dynamics, and the main drivers are temperature and precipitation [26]. For example, the regional drought due to climate change in the lower Mississippi River Valley affected vegetation productivity, net carbon exchange flux, and atmospheric CO2 concentration. Thus, the productivity in the drought area decreases by 23% [27]. The intervention of climate change and LULC changes and their impacts on the CO2 process were investigated at a global scale using various climate change models; accordingly, for further reading, interested readers are advised to use the following cited literature [11,28–33].
Monitoring CO2 levels is an important research theme in most parts of the world [34]. Therefore, a wide range of CO2 sensors was developed using different materials for monitoring CO2 concentration. A semiconductor sensor was used for detecting CO2 for environmental observations [35]. Also, CO2 sensors made of solid electrolytes [36–39], optic fibres [39], laser diodes [7], and non-dispersive infrared (NDIR) [40,41] detectors were utilised for observing CO2 emissions.
The atmospheric measurement of the CO2 concentration depends widely on NDIR sensors because they are stable and robust against interference by other air components, including pollutants [19]. In addition, the NDIR has excellent durability, which makes it the most popular sensor for measuring atmospheric CO2 [41]. The calibrated NDIR sensors can reasonably provide accurate air CO2 concentrations [7].
In Saudi Arabia, the increasing population within the urban and sub-urban areas puts pressure on natural resources and increases the hazard of CO2 emissions. The study area’s land-use system, located in the Eastern part of Saudi Arabia, showed a significant increase in urban lands during the last three decades [42]. Estimating CO2 emissions from the LULC changes is considered uncertain due to the difficulty of assessing this flux from measurements [43]. However, in this study, direct measurements of CO2 were made to investigate its flux along with the different LULC systems. Hence, the emergence of different patterns of land-use systems in the region will inevitably affect the amounts of CO2 emitted. Also, the land-use system usually effectively represents the spatial distribution of CO2 emissions and carbon sinks [44]. These conditions necessitate the importance of CO2 observation under different arid lands and zones. Therefore, the main objective of this study was to measure CO2 concentration over different land-use types. Also, an attempt was made to analyse the impact of CO2 emissions on the arid ecosystem of the study area.
2 Materials and methods
2.1 Study area
The study was carried out in five sites in the Al-Ahsa District located in the Eastern part of Saudi Arabia (Figure 1). The area has a population of 1.1 million (https://www.stats.gov.sa/) and is dominated by a hot, desert climate [45]. The seasonal average temperatures might reach 45°C in summer and 5°C in winter. The rainfall is present only in winter, with less than 250 mm per annum [46]. The land-use system in the study area is predominated by agricultural activities that include date palm plantation and cropping of rice and vegetables. The study sites have different land-use types, areas, and elevations, although they are located in the same climatic zone (Table 1).
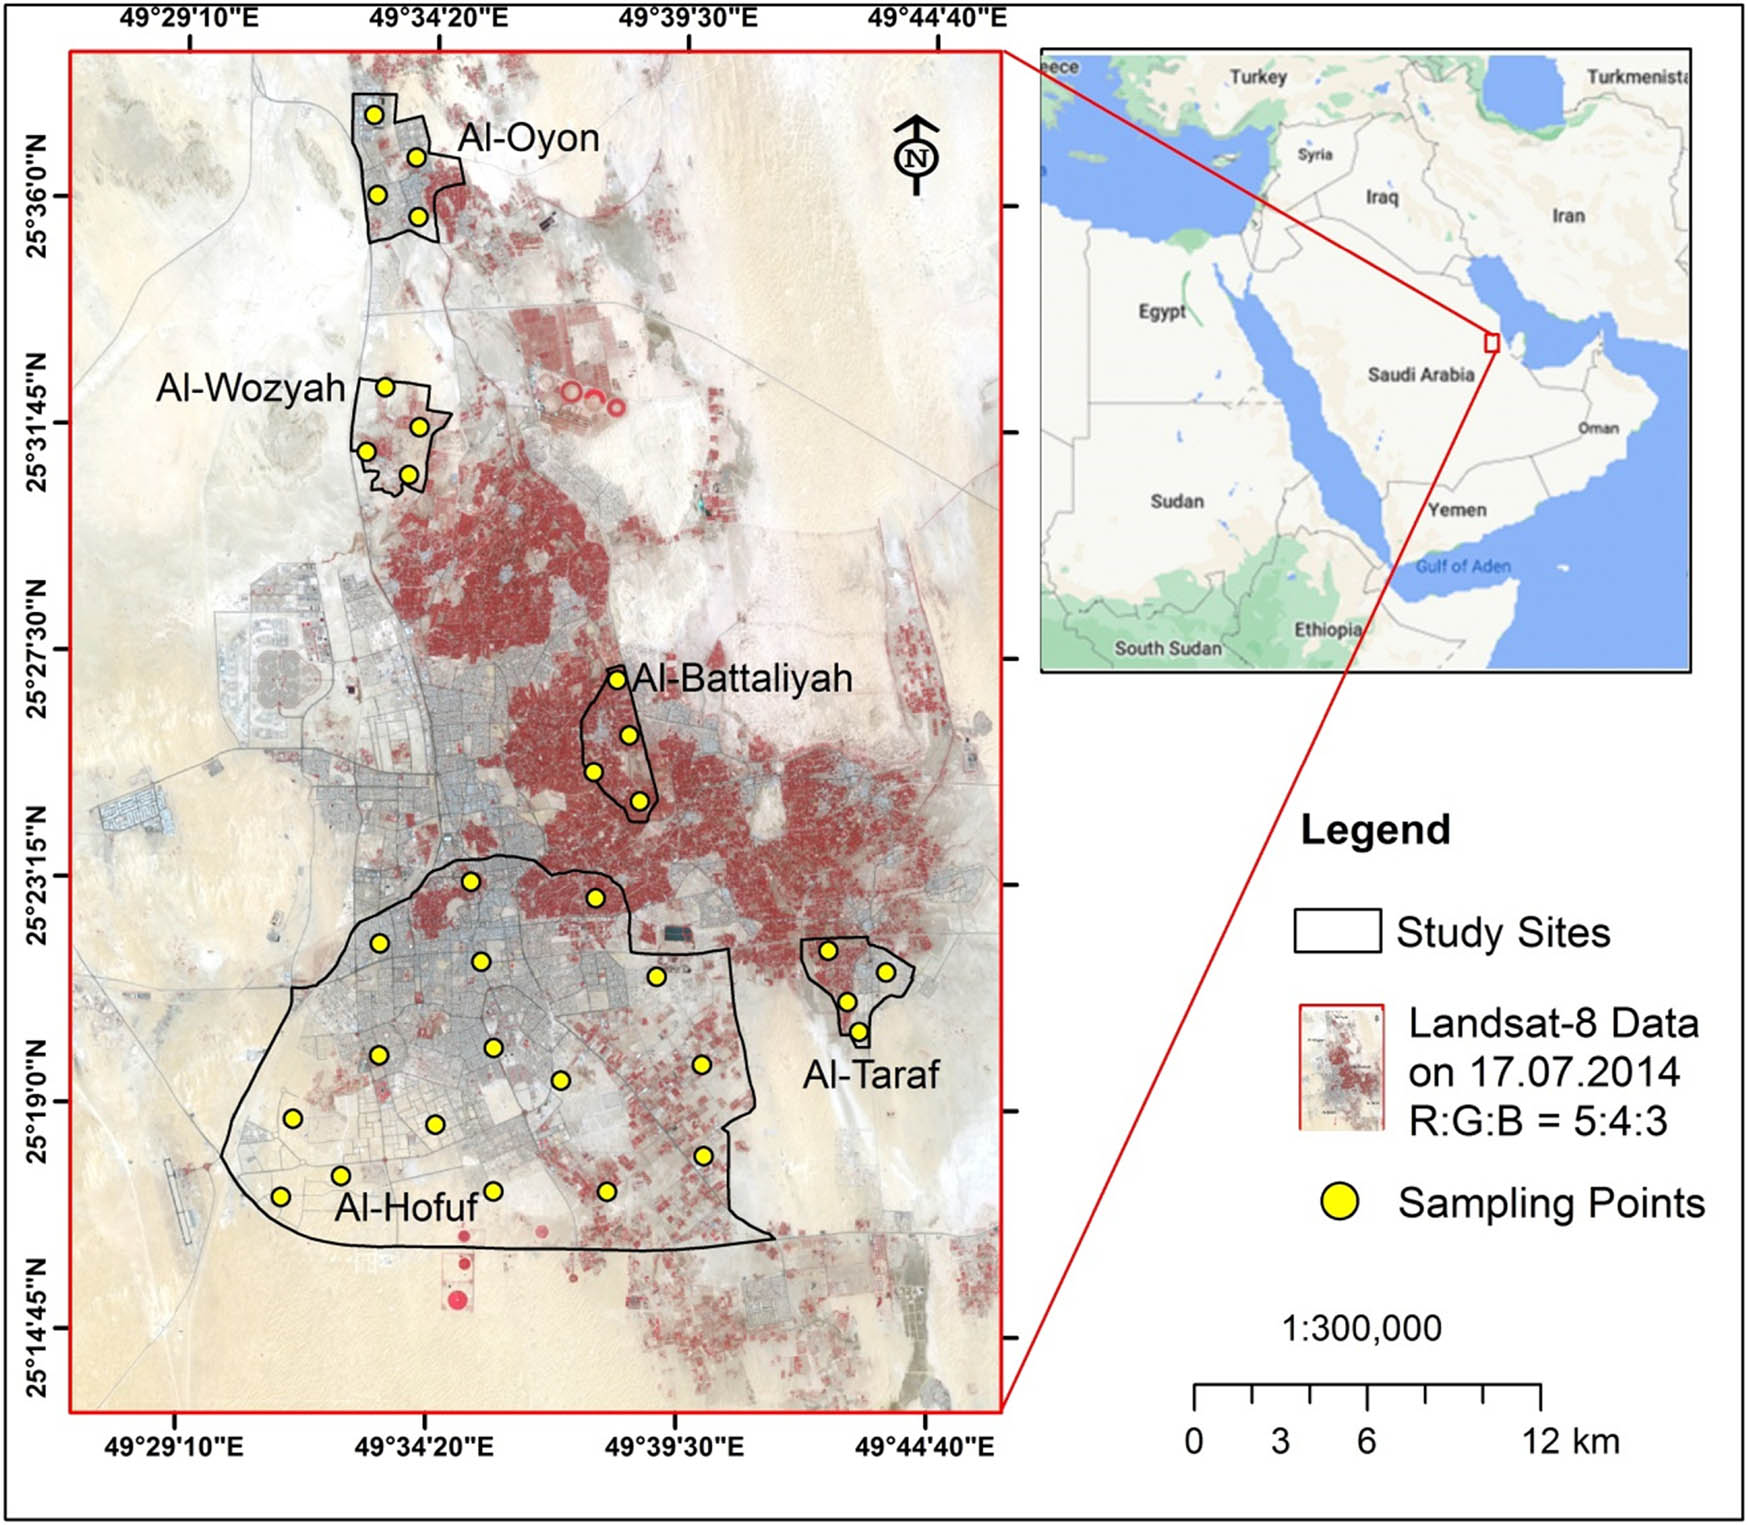
Location of the study sites within Al-Ahsa Zone. The background of the study sites is a Landsat-8 image acquired on 17 July 2014.
General characteristics of the five study sites and sampling time
| Site | Latitude | Longitude | Area (km2) | Elevation (m) | Start day and time | End day and time | Total hours (days) |
|---|---|---|---|---|---|---|---|
| Al-Oyon | 25.61000 | 49.55700 | 13 | 112 | 01 July 2014 06:00:00 AM | 30 July 2014 23:00:00 PM | 714 (30) |
| Al-Wozyah | 25.52900 | 49.55700 | 10 | 130 | 01 July 2014 06:00:00 AM | 30 July 2014 23:00:00 PM | 714 (30) |
| Al-Battaliyah | 25.43000 | 49.63600 | 9 | 140 | 01 July 2014 06:00:00 AM | 30 July 2014 23:00:00 PM | 714 (30) |
| Al-Hofuf | 25.32900 | 49.59800 | 192 | 155 | 01 July 2014 06:00:00 AM | 30 July 2014 23:00:00 PM | 714 (30) |
| Al-Taraf | 25.35700 | 49.71700 | 8 | 125 | 01 July 2014 06:00:00 AM | 30 July 2014 23:00:00 PM | 714 (30) |
2.2 LULC classification
The LULC classification of the study area was conducted using the Landsat-8 image (path/row is 164/042) acquired on 17 July 2014 (Figure 1) from the United States Geological Survey (https://earthexplorer.usgs.gov/). The Landsat-8 image obtained corresponds with the CO2 and climate data collected during the summer season of 2014. The image characteristics are shown in Table 2.
Characteristics of Landsat-8 data used in this study
| Sensor | Bands type | Wavelength (µm) | Spatial resolution (m) |
|---|---|---|---|
| Operational Land Imager and Thermal Infrared Sensor | Band 1, Coastal aerosol | 0.43–0.45 | 30 |
| Band 2, Blue | 0.45–0.51 | 30 | |
| Band 3, Green | 0.53–0.59 | 30 | |
| Band 4, Red | 0.64–0.67 | 30 | |
| Band 5, Near infrared | 0.85–0.88 | 30 | |
| Band 6, Short-wave infrared 1 | 1.57–1.65 | 30 | |
| Band 6, Short-wave infrared 2 | 2.11–2.29 | 30 | |
| Band 8, Panchromatic | 0.50–0.68 | 15 | |
| Band 9, Cirrus | 1.36–1.38 | 30 | |
| Band 10, Thermal infrared 1 | 10.60–11.19 | 100 | |
| Band 10, Thermal infrared 2 | 11.50–12.51 | 100 | |
| Dataset attribute | Attribute value | ||
| Land Cloud Cover | 0.00 | ||
| Scene Cloud Cover L1 | 0.00 | ||
| Geometric RMSE Model | 7.278 | ||
| Geometric RMSE Model X | 4.239 | ||
| Geometric RMSE Model Y | 5.916 | ||
In order to identify the LULC within the study area, a field survey was conducted using a Global Positioning System instrument to obtain accurate location point data for each LULC class included in the classification process. The total number of the reference ground control points (GCPs) collected during the field survey was 110. The supervised maximum likelihood classification (MLC) technique was applied to classify the image. MLC is valid and widely used in remote sensing for image classification [47–49]. For image accuracy assessment, 30% of the collected GCPs was used to validate the classification results. In addition, visual interpretation of the unclassified satellite image, Google Earth maps, and field observations were used to verify the LULC maps. The stratified random sampling method was adopted during the image classification to reduce bias [50]. The overall accuracy, user’s and producer’s accuracy, the Kappa statistic, and conditional Kappa were derived from the classification error matrices [51].
2.3 CO2 and climate parameter measurements
The commercial GE Telaire 7001 carbon dioxide sensor measured CO2 and temperature. The GE Telaire 7001 sensor was operating using the dual-beam NDIR technology, and it was connected to an analogue input on a HOBO H22 data logger. The sensor specifications are shown in Table 3, and it has independent CO2 and temperature readings. The sensor has been factory calibrated and should be recalibrated once every 12 months using either a zero concentration gas or a gas with a specified concentration of CO2 [52]. The sensors were distributed along with the study sites based on the area covered by each side. Accordingly, four sensors were fixed at each site in Al-Oyon, Al-Wozyah, Al-Battaliyah, and Al-Taraf, and a total number of 16 sensors were fixed in Al-Hofuf (Figure 1). The temperature (T) and relative humidity (RH) sensors were distributed following the same order as the CO2 sensors. The sensors were distributed along the study site to assure data accuracy and fairness. In addition, the average sensor data from each site read the hourly CO2, T and RH were collected to represent each site fairly. The wind speed data were collected during July 2014 from a local meteorological station in the study area.
Specifications of the GE Telaire 7001 CO2 and temperature monitor
| Standards | CO2 channel | Temperature channel |
|---|---|---|
| Measurement range | 0–10,000 ppm display | 0–50°C display |
| Display resolution | ±1 ppm | 0.1°C |
| Accuracy | ±50 ppm or ±5% for reading up to 5,000 ppm | ±1°C |
| Response time | 60 s for 90% of step change | 20–30 min |
| Sample method | Diffusion or flow through (50–100 mL/min) | |
| Power requirement | 100 mA peak, 20 mA average from 6 V | |
| Operating conditions | 0–50°C, 0–95% RH, non-condensing | |
2.4 Data analysis
The Friedman test was used to compare CO2 concentration in the five sites. The Friedman test is a non-parametric analysis used to test the significance for more than two groups; it tests the null hypothesis [53]. Thus, Friedman’s test determines whether the rank totals for each treatment differ significantly from the values expected by chance [54]. The computational formula for the Friedman test [54,55] is
where K is the number of groups (treatments), n is the number of subjects, and
Moreover, Kendall’s W test was used to assess the agreement trend among the treatments. Kendall’s W is referred to the normalization of the Friedman statistic, and it ranges from 0 to 1. The value “1” refers to the complete agreement between the raters, and “0” refers to the non-complete agreement between raters [56]. Therefore, Kendall’s W can be calculated from Friedman’s
The Inverse Distance Weighted (IDW) tool of Geostatistical Analyst in the ArcGIS 10.2 software was used to perform data interpolation for the recorded CO2 and produce the spatial distribution map [58].
The Statistica [59] and Microsoft Excel 2010 [60] software packages were used to perform the statistical analysis and produce graphs.
3 Results and discussion
3.1 LULC analysis
The study area analysis indicated that the existing LULC classes were the date palm, cropland, bare land, urban land, and water (Figure 2). However, within the study sites, the urban land occupied large areas in Al-Hofuf compared to the other sites (Table 4). The date palm orchards were dominant in Al-Battaliyah concerning its relative total occupied area. Bare lands cover about 125 km2 in Al-Hofuf, 7 km2 for Al-Oyon and Al-Wozyah, and 1.4–3 km2 in Al-Battaliyah and Al-Taraf (Table 4). The cropland areas ranged between 1 and 2 km2 in all study sites and extended to 12 km2 in Al-Hofuf. The LULC map of the study area showed how the different LULC classes were spatially distributed along with the study sites. Thus the LULC types were considered to affect the level of the CO2 concentration in a varying way depending on the human activities at each site. Al-Hofuf represents one of the two largest city centres in the Al-Ahsa District. Therefore, urban lands extend in Al-Hofuf, covering large areas. In Saudi Arabia, many residents who lived in the major cities increased from 58% in 1975 to 82% in 2014 [61]. Most urban residents migrated to the cities to seek a modern lifestyle, better employment, and educational opportunities [62]. Also, the built-up area increased by 28.9% during 1990–2014 in Dammam, the capital of the Eastern Region in Saudi Arabia [48].

LULC map of the study area on 02 August 2014.
Areas of LULC for the different study sites
| LULC | Area (km2) | ||||
|---|---|---|---|---|---|
| Al-Oyon | Al-Wozyah | Al-Battaliyah | Al-Hofuf | Al-Taraf | |
| Date palm | 1.0 | 1.4 | 5.4 | 19.0 | 2.0 |
| Cropland | 1.0 | 1.2 | 2.0 | 12.0 | 1.0 |
| Urban land | 4.0 | 0.4 | 0.2 | 36.0 | 2.0 |
| Bare land | 7.0 | 7.0 | 1.4 | 125.0 | 3.0 |
| Total area (km 2 ) | 13 | 10 | 9 | 192 | 8 |
The overall accuracy of the classified LULC map was 90%, with a Kappa statistic of 86% (Table 4). However, the user’s and producer’s accuracies of different LULC classes ranged between 81 and 100%. Also, conditional Kappa coefficients for the different LULC types are shown in Table 5. The user’s accuracy is the probability that a value predicted in a specific class is that class. That means it shows the reality on the ground. In statistical terms, the user’s accuracy measures errors of commission. The producer’s accuracy indicates the proportion of the reference data that are classified correctly for a given class. It corresponds to the statistical concept of errors of omission [49]. Urban lands show low conditional Kappa, user’s and producer’s accuracies compared to the other LULC classes. This can be attributed to the misclassification of some urban land into bare land and cropland. On the other hand, bare lands and water recorded higher accuracies because they have less mixture than the other classes.
Accuracy assessment of LULC classification
| LULC | Classification accuracy (%) | ||
|---|---|---|---|
| User’s | Producer’s | Conditional Kappa | |
| Date palm | 92 | 91 | 89 |
| Cropland | 81 | 83 | 78 |
| Bare land | 94 | 93 | 89 |
| Urban land | 79 | 81 | 76 |
| Water | 100 | 100 | 100 |
| Overall accuracy (%) | 90 | ||
| Kappa statistic (%) | 86 | ||
The hourly recorded T patterns are almost similar in all study sites showing a minimum value of 24°C and a maximum value of 52°C (Figure 3). However, the average T values ranged between 36 and 39°C; hence sites with large vegetation covers showed relatively low T compared to sites dominated by urban and bare lands. The variation of RH along the study sites is clearly shown in Figure 4. The minimum detected RH was 24%, while the maximum was 82%. However, the mean values ranged between 29 and 36%. The low amount of RH can be found during the early morning hours, while the high values occur during the day and most of the evening. Nevertheless, the highest RH value was observed in the site dominated by vegetation cover. The average daily wind speed over the study sites showed a minimum value of 3 km/day and a maximum value of 15 km/day (Figure 5). The dominant wind direction was north to north-west. High wind speed resulted in increasing T in urban lands, while the low wind speed decreased the RH in the sites with high vegetation cover.
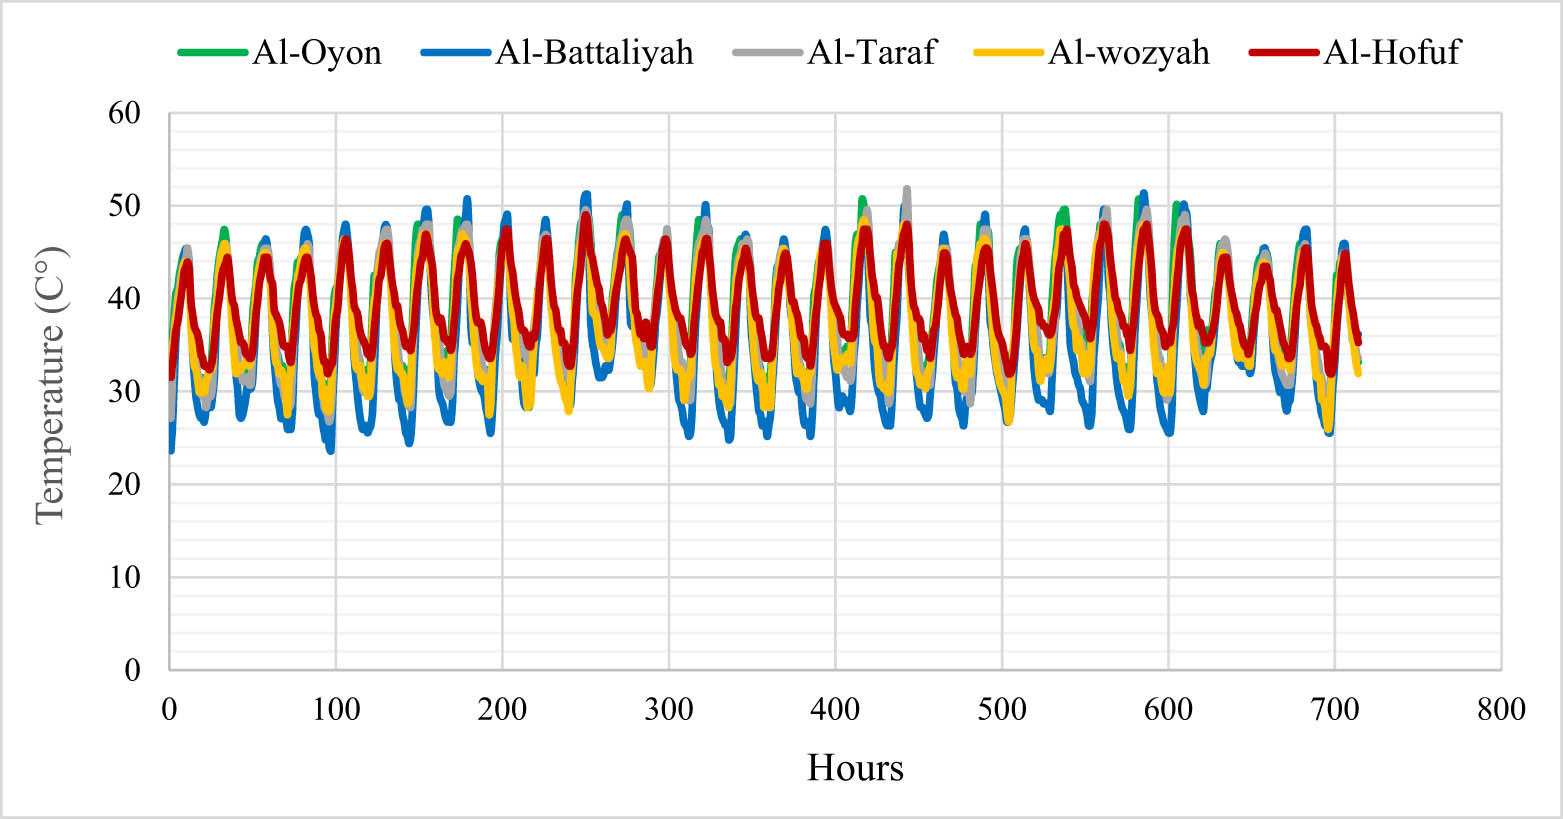
Hourly time series for the T levels in the different study sites during July 2014.
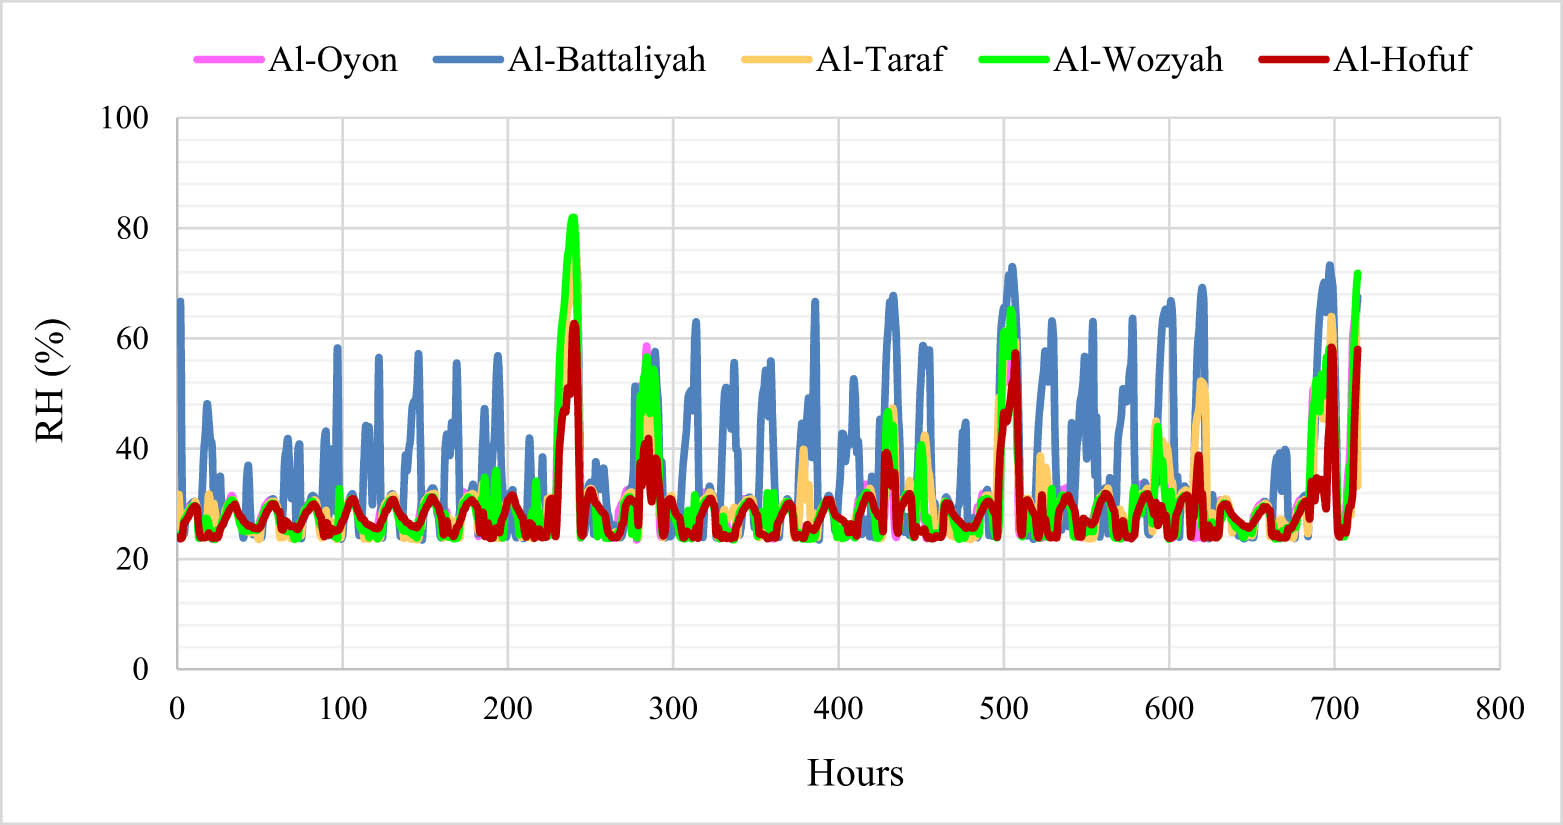
Hourly time series for the RH in the different study sites during July 2014.

Average daily wind speed over the study area during July 2014.
In urban areas, the physical environmental parameters, including climatic factors, influence pollutant dispersion, which might increase heat island [63]. Therefore, considering the meteorological conditions is important when developing policies to control urban air quality [64].
3.2 CO2 concentration and levels
The spatial distribution of CO2 over the different study sites showed high concentration levels in Al-Hofuf and Al-Wozyah, followed by Al-Battaliyah and Al-Taraf. In contrast, low levels were detected in Al-Oyon (Figure 6). The CO2 maximum mean value (μ^) of 577 ppm was observed in Al-Hofuf, while a minimum mean value of 391 ppm was detected in Al-Oyon (Figure 7). However, the statistical analysis of the CO2 levels indicated significant differences (P < 0.001) among the study sites based on the Friedman test. Nevertheless, no significant difference (P < 0.001) was observed between Al-Battaliyah and Al-Taraf (Table 6). The low value of the
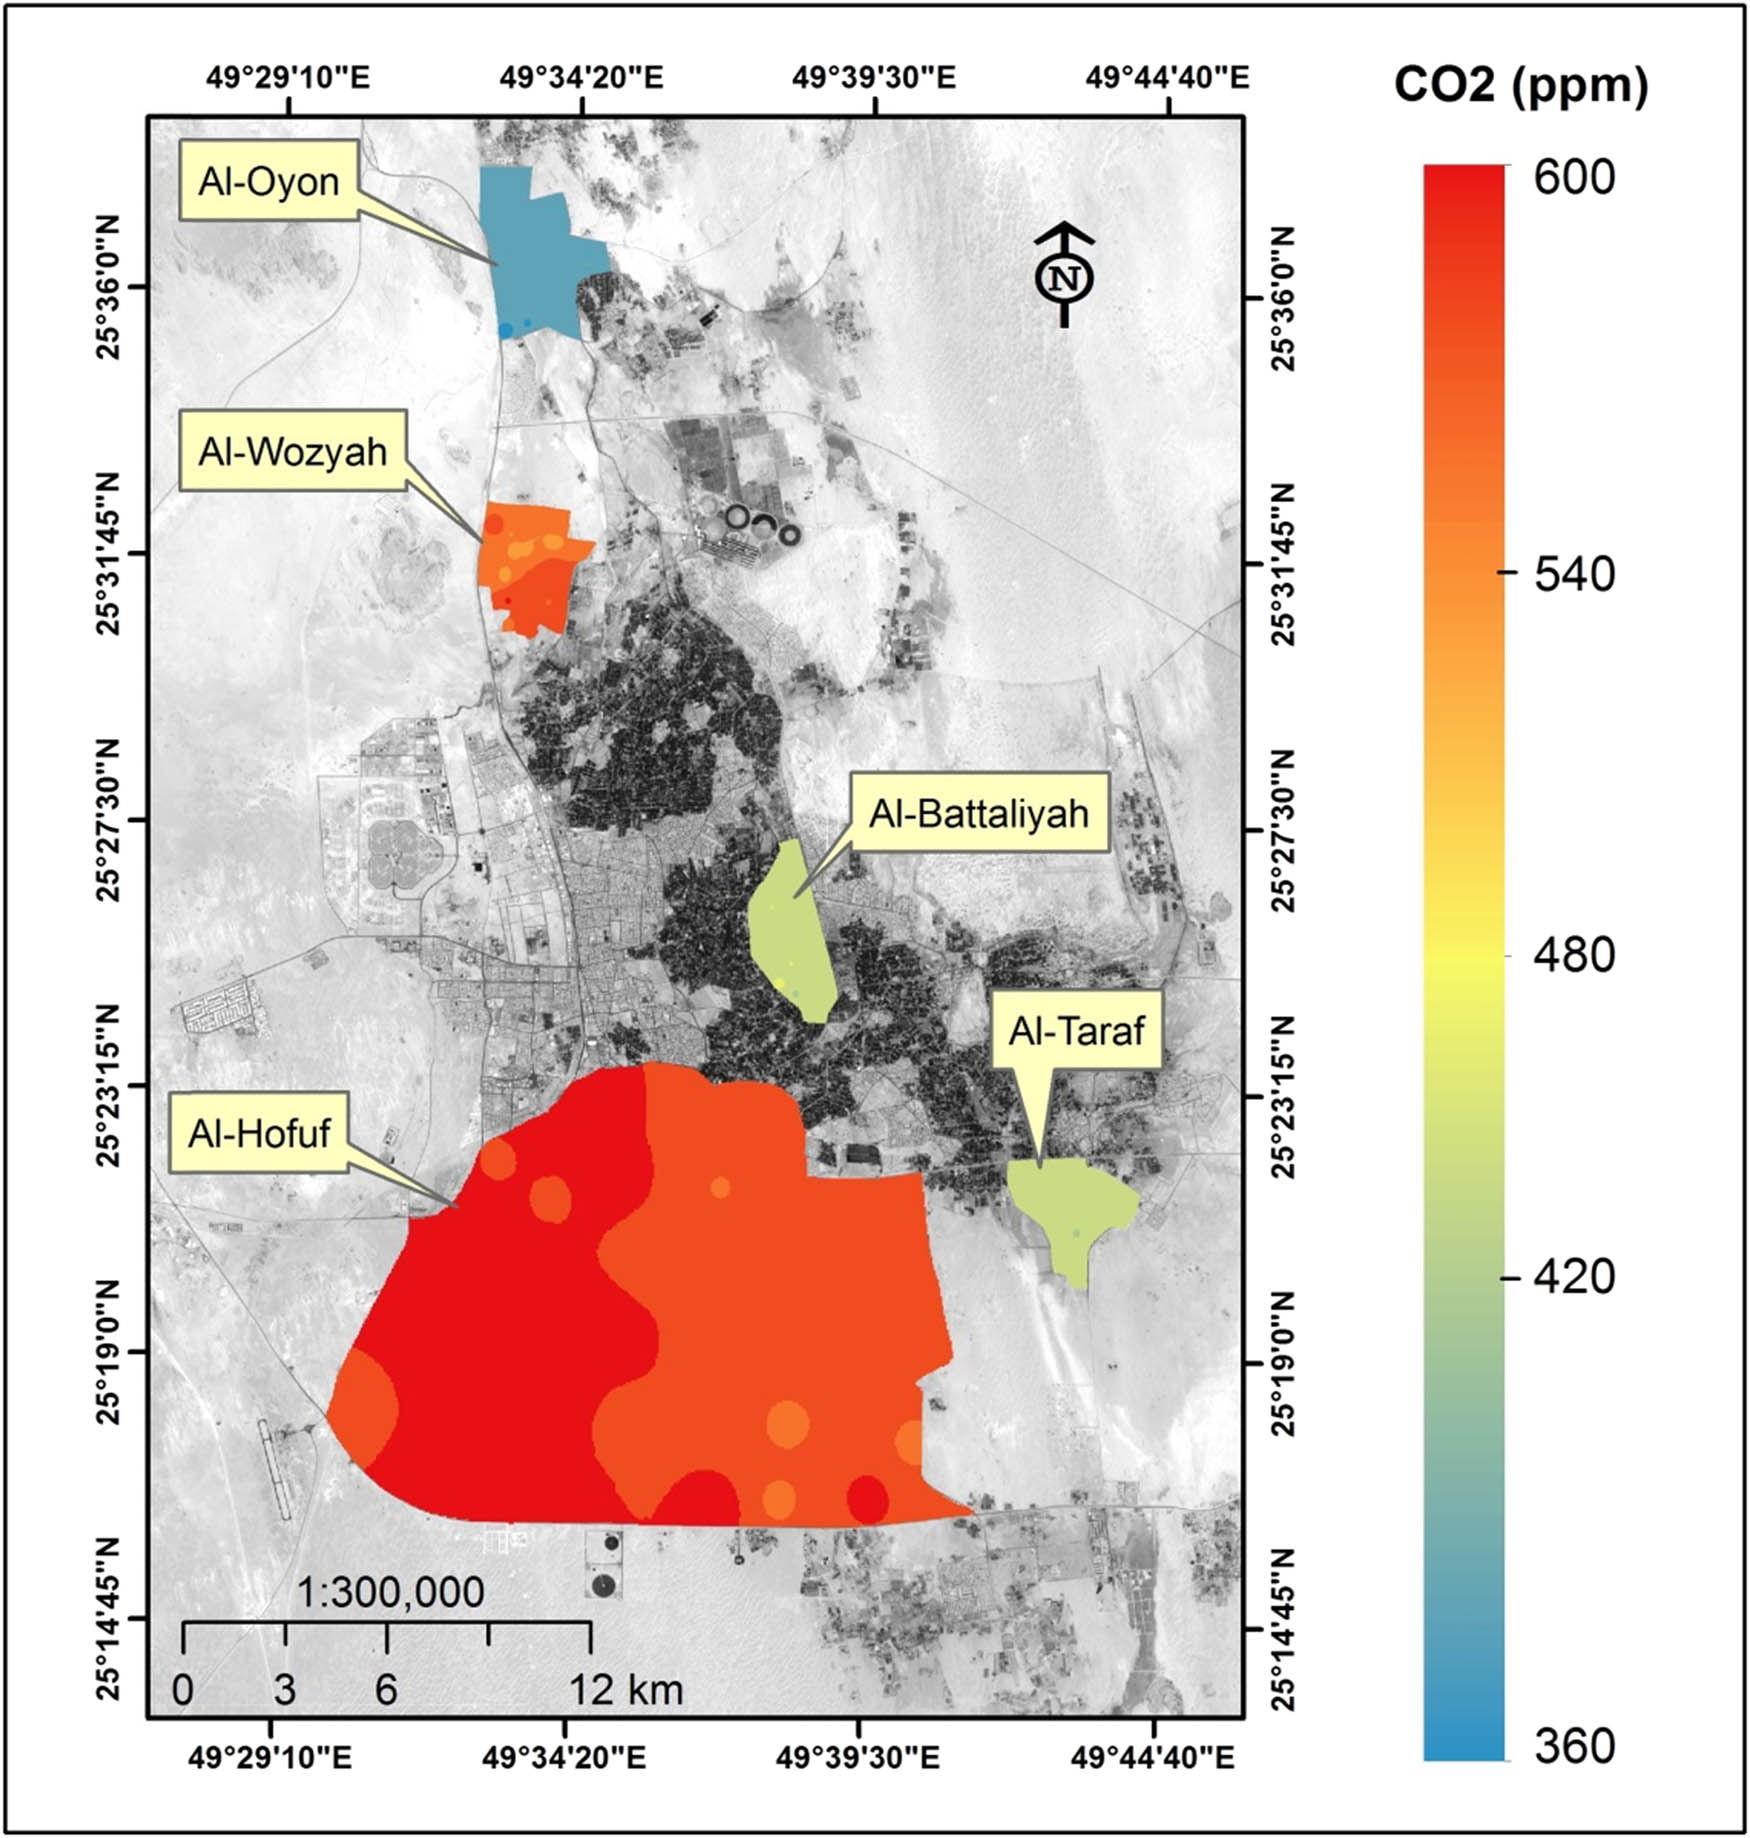
The spatial distribution of CO2 levels over the study sites.

Comparison of the CO2 level mean values in the different study sites.
Pairwise comparison of CO2 levels between the different study sites
| Friedman coefficient (X 2) = 2,732 | ||
|---|---|---|
| Degree of freedom (df) = 4 | ||
| Probability (P) < 0.001 | ||
| Sites pair | Statistic | P |
| Al-Oyon–Al-Battaliyah | 90.14* | <0.001 |
| Al-Oyon–Al-Taraf | 83.22* | <0.001 |
| Al-Oyon–Al-Wozyah | 174.73* | <0.001 |
| Al-Oyon–Al-Hofuf | 229.36* | <0.001 |
| Al-Battaliyah–Al-Taraf | 6.91ns | <0.001 |
| Al-Battaliyah–Al-Wozyah | 84.60* | <0.001 |
| Al-Battaliyah–Al-Hofuf | 139.23* | <0.001 |
| Al-Taraf–Al-Wozyah | 91.51* | <0.001 |
| Al-Taraf–Al-Hofuf | 146.14* | <0.001 |
| Al-Wozyah–Al-Hofuf | 54.63* | <0.001 |
* = Significant; ns = not significant.
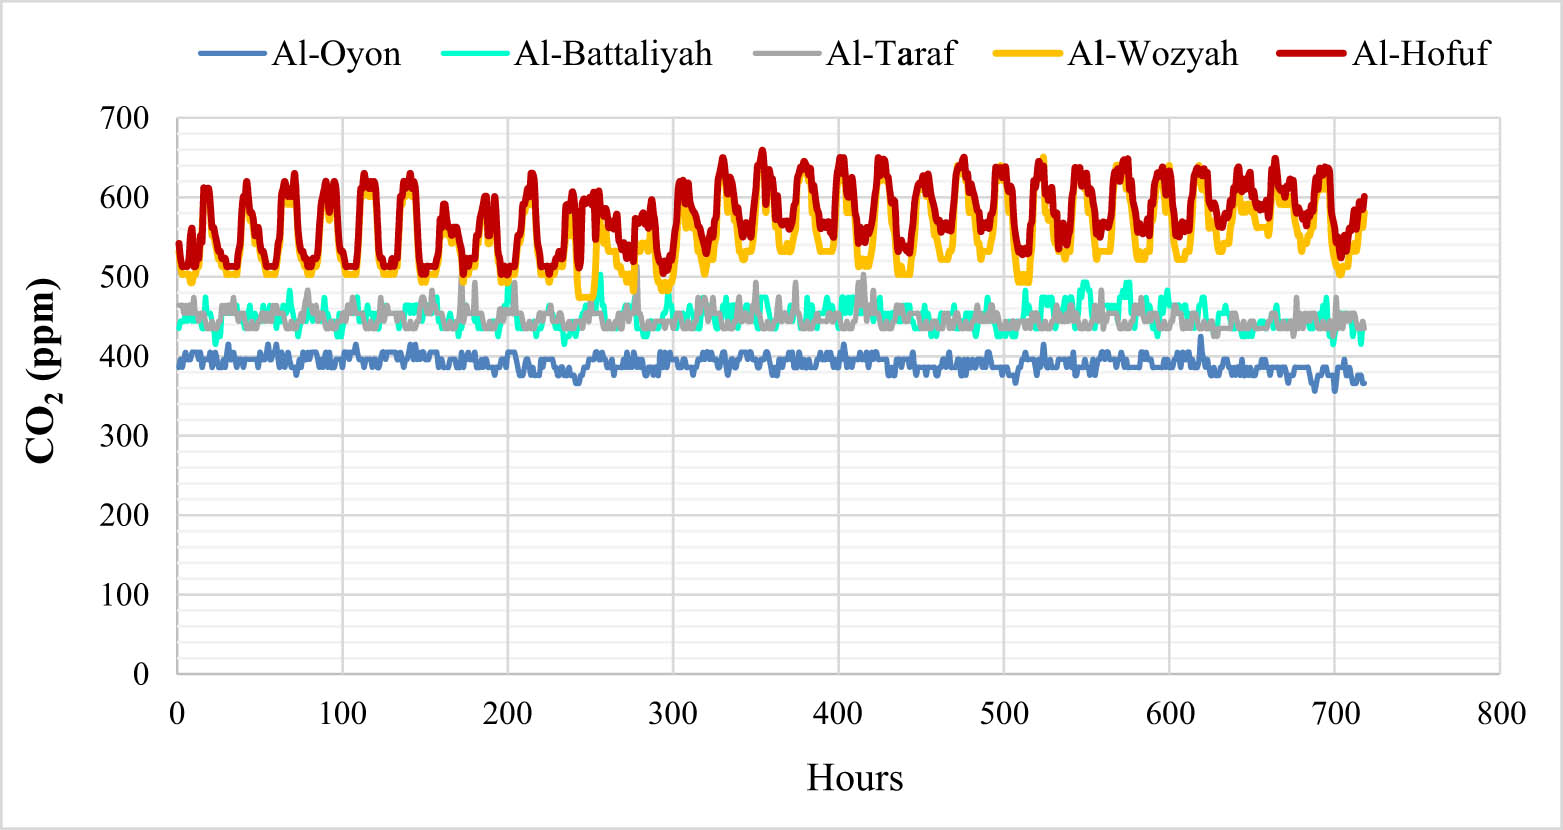
Hourly time series for the CO2 concentration in the different study sites.
The high concentration levels of the CO2 in Al-Hofuf can be attributed to large urban land domination compared to the other sites (Figure 2). The fuel combustion from the cars in Al-Hofuf and the absence of public transport make the situation worse due to the increasing number of private vehicles. In the urban cities of Saudi Arabia, about 92% of the populations depend on private transportation. However, only 32% of these cities are accessible and linked to public transport systems [65]. Also, the energy use in Al-Hofuf is high compared to the suburban areas of the Al-Ahsa district due to the increase in the human population. Therefore, urban areas act as the primary source of CO2 to the ambient air [66]. However, the ambient CO2 levels could affect the air quality by involving isoprene emission in the vegetated areas [67,68]. Bare lands were the dominant land-use system in Al-Hofuf; therefore, during the summertime in July, this condition might increase the rate of CO2 emissions due to the high-temperature degrees. Similar conditions of the vast bare lands can be observed in Al-Wozyah, which also showed high CO2 concentrations. Unlike Al-Hofuf, the Al-Oyon site covered large areas of urban and bare lands, but the concentration of CO2 in it was low. This is due to the less transportation movement in Al-Oyon, as it is considered a suburban area. Also, palm orchards and farms located in the southeast of Al-Oyon may contribute to reducing CO2 emissions. Urbanisation in arid and semiarid regions can significantly impact CO2 concentrations and emissions estimated for different LULC types [69,70]. The relatively low CO2 concentration in Al-Battaliyah and Al-Taraf might be due to the extensive vegetation covers extended in these sites. Urban vegetation can play a vital role in exchanging CO2 concentrations in cities due to plant photosynthesis [40]. Also, urban vegetation is a beneficial planning strategy to control the heat island and improve the energy efficiency of buildings in urban cities [71].
The spatial distribution of CO2 concentration in the study sites shows that its levels vary according to the areas occupied by the different LULC types (Figure 9). In Al-Oyon, the low values of CO2 concentration ranging from 377 to 382 ppm occurred in cropland and date palm land-use systems, while the high 386–392 ppm was associated with the bare and urban lands (Figure 9a). Most of the area in Al-Wozyah is covered by bare lands, which shows CO2 levels of 559–561 ppm compared to 570 ppm detected over the small area occupied by the urban land (Figure 9b). The high CO2 levels resulting from the bare and urban lands in Al-Wozyah have affected the amount of CO2 concentration that appeared over the date palm and cropland areas showing CO2 levels around 546 ppm. In Al-Battaliyah, the date palm was the dominant LULC system showing CO2 concentration levels of 446–452 ppm, followed by the cropland with 440–446 ppm, bare land with 453–458 ppm, and finally urban land with 458–464 ppm (Figure 9c). The domination of bare lands in Al-Hofuf resulted in CO2 levels of 560–576 ppm, while the vast areas occupied by the urban lands raised the CO2 levels to 580–594 ppm (Figure 9d). The CO2 concentration levels in Al-Taraf ranged from 441 to 445 ppm for the date palm and cropland systems, while it ranged between 447 and 449 ppm for the bare land and almost around 450 ppm for the urban land (Figure 9e).
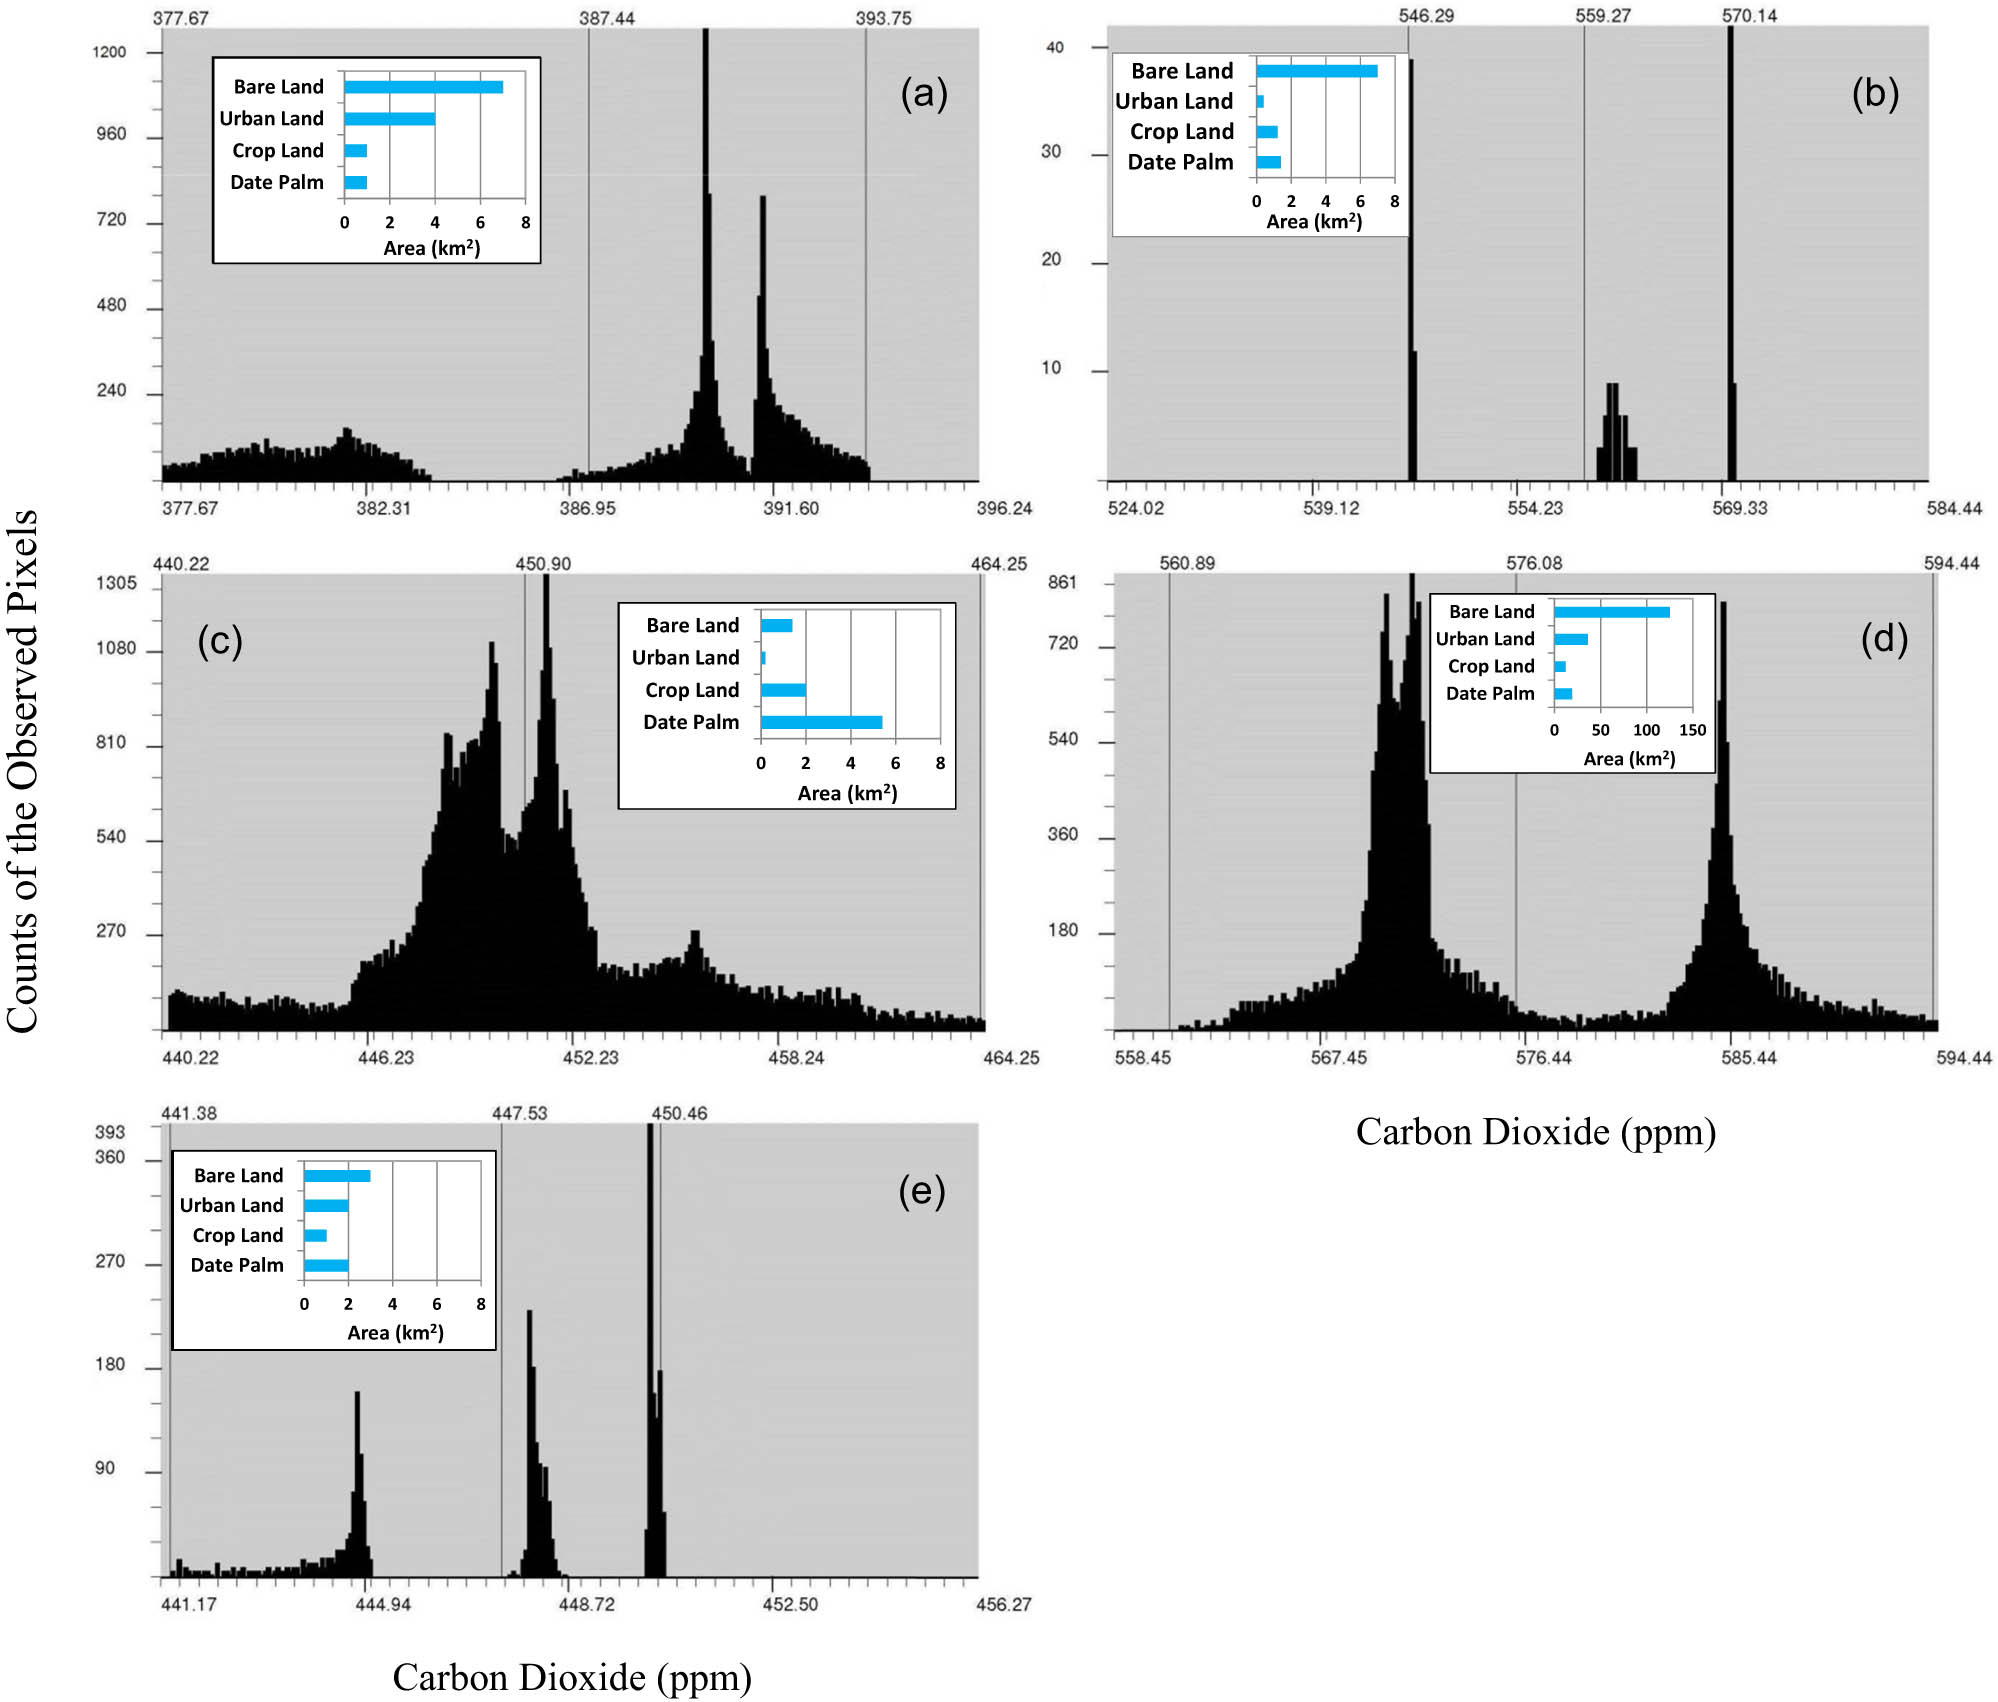
The spatial distribution of CO2 concentration over the different LULC types. (a) Al-Oyon, (b) Al-Wozyah, (c) Al-Battaliyah, (d) Al-Hofuf and (e) Al-Taraf.
The CO2 concentration mean values detected for the different LULC types in the study area showed it was 560, 535, 515, and 484 ppm for the urban land, bare land, cropland, and date palm, respectively. Thus, the increasing and decreasing of the CO2 levels across the different LULC types over the study sites (Figure 10) are mainly attributed to the movement of active winds during the summer, where its speed ranged between 5 and 8 km/h in the north and north-west direction of the study area [72]. Moreover, the urban atmospheric CO2 concentrations variation is expected in the Middle East region. For instance, in the Gaza City of Palestine, this variation ranged between 300 and 900 ppm showing higher levels during working days than at the weekend [73]. Therefore, vegetated areas can act as mitigation measure that reduce CO2 emissions and lower the air temperature depending on the wind speed and direction from one site to another. Nevertheless, Pataki et al. [74] have indicated the limited role of urban trees in reducing GHG emissions and pollution over vast areas and environmental conditions. However, urban trees are more useful for climate and pollution adaptation approaches than emission reduction. This is because of the limitation in spaces that constrain tree canopies compared to the amount of emissions.

The patterns of CO2 for the different LULC types within the study sites.
Agriculture and land-use change contribute to about 21% of the global GHG emission. Therefore, to achieve low CO2 levels, several measures can be applied. These include re-prioritising land-use systems in urban and rural areas, controlled irrigation, crop diversification, and cover crops [75]. However, land use draws attention to be used as a policy tool for carbon reduction and low-carbon planning [76]. This is because it has changed the Earth’s carbon cycle by influencing the natural carbon sources and sinks like cropland, grassland, and forests [77,78].
Vegetation has crucial environmental functions in urban areas since it removes pollutants [79]. Also, vegetation cover helps in reducing energy consumption in urban areas and hence improves their climate [80]. Therefore, appearing vegetation cover in the urban environment is essential for heat island mitigation in cities [81]. However, CO2 was the major driving factor for vegetation cover changes [82]. Moreover, the study area faces a lack of precipitation, which might be one of the main causes of CO2 concentration increase [83]. The relationship between urban form and CO2 emissions indicated that less complex cities have lower CO2 emissions, but dense cities have greater per capita CO2 emissions [84]. Also, socioeconomic factors of industrial structure, population density, and economic development level were the main drivers of CO2 emissions in urban form areas [85].
4 Conclusions
The world faces a continuous increase in atmospheric CO2 concentrations due to climate change and the consequences of land-use change. Therefore, continuous monitoring of CO2 concentrations in the air at regional and local scales will help drive global efforts to reduce CO2 emissions. In addition, site monitoring of CO2 will provide the local policymakers with the needed information to formulate policies and strategies that cut down the levels of CO2 in the atmosphere.
In this study, the CO2 concentrations in the air were monitored for 1 month during the summertime in July. The tested sites covered different LULC types of urban and suburban areas. The hourly recorded data of the CO2 showed significant variations between the study sites. For example, a maximum mean value of 577 ppm was detected in a site dominated by urban lands. However, the hourly recorded CO2 concentrations showed a maximum value of 659 ppm during the peak time of human transportation and movement. Nevertheless, the patterns of the CO2 levels showed significant variations across the different LULC types over the study sites.
The sensors and methodology used in this study provided valuable information about the CO2 concentrations and levels over a specific site. However, there is a real challenge in designing a sensor network capable of continuously detecting CO2 in large open space areas over a long time. In addition, modelling CO2 variation over time due to the LULC changes might help predict the best practices for land-use management that can reduce the CO2 levels in the atmosphere. Therefore, adequate management of agricultural lands and reducing CO2 emissions and pollution from crop and animal production will help preserve and enhance the air quality for most LULC types dominated in the study area.
Acknowledgments
The authors would like to thank the anonymous reviewers for their contribution to the improvement of the manuscript. Also, we would like to express our gratitude to Dr. Yousef Ahmed Alkhamis, the director of the Water Studies Center at King Faisal University, for his continuous support.
-
Funding information: This work was supported by the Deanship of Scientific Research, King Faisal University, Saudi Arabia (grant number NA000251).
-
Author contributions: A.O.A. set the concept and the methodology; A.O.A., K.B.T., and F.I.Z. carried out field data collection; K.B.T. performed software and formal analysis of the data, and writing the original draft of the manuscript; F.I.Z. did the review writing and editing of the manuscript and the work supervision. All authors have read and agreed to the published version of the manuscript.
-
Conflict of interest: Authors state no conflict of interest.
-
Data availability statement: The datasets generated during and/or analyzed during the current study are available from the corresponding author on reasonable request.
References
[1] Kuncoro CBD, Luo WJ, Selamet MR, Sri MN, Kurniawan AS, Kuan YD. Automatic wireless ambient air and weather condition monitoring system for outdoor environment monitoring applications. Sens Mater. 2020;32(1):337–56.10.18494/SAM.2020.2604Search in Google Scholar
[2] Qiu L, Liu X, Hao Y. Quantitative assessment of the role of doubled CO2 and associated climate change in the vegetation dynamics and hydrological cycle in the Sino-Mongolia arid and semi-arid region. Stoch Environ Res Risk Assess. 2017;31:785–97.10.1007/s00477-015-1205-3Search in Google Scholar
[3] Gao Y, Li X, Liu L, Jia R, Yang H, Li G, et al. Seasonal variation of carbon exchange from a revegetation area in a Chinese desert. Agric Meteorol. 2012;156:134–42.10.1016/j.agrformet.2012.01.007Search in Google Scholar
[4] Wang H, Li X, Xiao J, Ma M, Tan J, Wang X, et al. Carbon fluxes across alpine, oasis, and desert ecosystems in northwestern China: the importance of water availability. Sci Total Environ. 2019;697:133978.10.1016/j.scitotenv.2019.133978Search in Google Scholar PubMed
[5] Wang Y, Nakayama M, Watanabe K, Yagi M, Nishikawa M, Fukunaga M. The NDIR CO2 monitor with smart interface for global networking. IEEE Trans Instrum Meas. 2005;54:1634–9.10.1109/TIM.2005.851474Search in Google Scholar
[6] United Nation. World’s population increasingly urban with more than half living in urban areas. 2014 [cited 2014 July 10]. https://www.un.org/en/development/desa/news/population/world-urbanization-prospects-2014.html.Search in Google Scholar
[7] Asakawa T, Kanno N, Tonokura K. Diode laser detection of greenhouse gases in the near-infrared region by wavelength modulation spectroscopy: pressure dependence of the detection sensitivity. Sensors. 2010;10:4686–99.10.3390/s100504686Search in Google Scholar PubMed PubMed Central
[8] Bezyk Y, Oshurok D, Dorodnikov M, Sówka I. Evaluation of the CALPUFF model performance for the estimation of the urban ecosystem CO2 flux. Atmos Pollut Res. 2021;12:213–30.10.1016/j.apr.2020.12.013Search in Google Scholar
[9] Lawrence PJ, Chase TN. Investigating the climate impacts of global land cover change in the community climate system model. Int J Climatol. 2010;30:2066–87.10.1002/joc.2061Search in Google Scholar
[10] Ciais P, Gasser T, Paris J, Caldeira K, Raupach MR, Canadell J, et al. Attributing the increase in atmospheric CO2 to emitters and absorbers. Nat Clim Chang. 2013;3:926–30.10.1038/nclimate1942Search in Google Scholar
[11] Mahowald NM, Randerson JT, Lindsay K, Munoz E, Doney SC, Lawrence P, et al. Interactions between land use change and carbon cycle feedbacks. Glob Biogeochem Cycles. 2017;31:96–113.10.1002/2016GB005374Search in Google Scholar
[12] Hua W, Chen H, Suna S, Zhou L. Assessing climatic impacts of future land use and land cover change projected with the CanESM2 model. Int J Climatol. 2015;35:3661–7.10.1002/joc.4240Search in Google Scholar
[13] Tubiello F, Salvatore M, Ferrara AF, House J, Federici S, Rossi S, et al. The contribution of agriculture, forestry and other land use activities to global warming, 1990–2012. Glob Change Biol. 2015;21:2655–60.10.1111/gcb.12865Search in Google Scholar PubMed
[14] Szogs S, Arneth A, Anthoni P, Doelman JC, Humpenöder F, Popp A, et al. Impact of LULCC on the emission of BVOCs during the 21st century. Atmos Environ. 2017;165:73–87.10.1016/j.atmosenv.2017.06.025Search in Google Scholar
[15] Houghton RA. Balancing the global carbon budget. Annu Rev Earth Planet Sci. 2007;35:313–47.10.1146/annurev.earth.35.031306.140057Search in Google Scholar
[16] Liu Y, Wu C, Wang X, Jassal RS, Gonsamo A. Impacts of global change on peak vegetation growth and its timing in terrestrial ecosystems of the continental US. Glob Planet Change. 2021;207:103657.10.1016/j.gloplacha.2021.103657Search in Google Scholar
[17] Zhao ZQ, He BJ, Li LG, Wang HB, Darko A. Profile and concentric zonal analysis of relationships between land use/land cover and land surface temperature: case study of Shenyang, China. Energy Build. 2017;155:282–95.10.1016/j.enbuild.2017.09.046Search in Google Scholar
[18] Zhao Z, Sharifi A, Dong X, Shen L, He BJ. Spatial variability and temporal heterogeneity of surface urban heat island patterns and the suitability of local climate zones for land surface temperature characterization. Remote Sens. 2021;13:4338.10.3390/rs13214338Search in Google Scholar
[19] Yasuda T, Yonemura S, Tani A. Comparison of the characteristics of small commercial NDIR CO2 sensor models and development of a portable CO2 measurement device. Sensors. 2012;12:3641–55.10.3390/s120303641Search in Google Scholar PubMed PubMed Central
[20] Ramamurthy P, Pardyjak ER. Toward understanding the behavior of carbon dioxide and surface energy fluxes in the urbanized semi-arid Salt Lake Valley, Utah, USA. Atmos Environ. 2011;45:73–84.10.1016/j.atmosenv.2010.09.049Search in Google Scholar
[21] Pataki DE, Alig RJ, Fung AS, Golubiewski NE, Kennedy CA, Mcpherson EG, et al. Urban ecosystems and the North American carbon cycle. Glob Change Biol. 2006;12:2092–2102.10.1111/j.1365-2486.2006.01242.xSearch in Google Scholar
[22] Feng H, Zou B. Satellite-based separation of climatic and surface influences on global aerosol change. Int J Remote Sens. 2020;41(14):5443–56.10.1080/01431161.2020.1731934Search in Google Scholar
[23] Crawford B, Grimmond CSB, Christen A. Five years of carbon dioxide fluxes measurements in a highly vegetated suburban area. Atmos Environ. 2011;45(4):896–905.10.1016/j.atmosenv.2010.11.017Search in Google Scholar
[24] Pérez-Ruiz ER, Vivoni ER, Templeton NP. Urban land cover type determines the sensitivity of carbon dioxide fluxes to precipitation in Phoenix, Arizona. PLoS ONE. 2020;15(2):e0228537.10.1371/journal.pone.0228537Search in Google Scholar PubMed PubMed Central
[25] Ng BJL, Hutyra LR, Nguyen H, Cobb AR, Kai FM, Harvey C, et al. Carbon fluxes from an urban tropical grassland. Environ Pollut. 2015;203:227–34.10.1016/j.envpol.2014.06.009Search in Google Scholar PubMed
[26] Liu C, Liang Y, Zhao Y, Liu S, Huang C. Simulation and analysis of the effects of land use and climate change on carbon dynamics in the Wuhan city circle area. Int J Environ Res Public Health. 2021;18:11617.10.3390/ijerph182111617Search in Google Scholar PubMed PubMed Central
[27] Lee E, Zeng FW, Koster RD, Ott LE, Mahanama S, Weir B, et al. Impact of a regional U.S. drought on land and atmospheric carbon. J Geophys Res Biogeosci. 2020;125:e2019JG005599.10.1029/2019JG005599Search in Google Scholar
[28] Wu S, Mickley LJ, Kaplan JO, Jacob DJ. Impacts of changes in land use and land cover on atmospheric chemistry and air quality over the 21st century. Atmos Chem Phys. 2012;12:1597–609.10.5194/acp-12-1597-2012Search in Google Scholar
[29] Ward DS, Mahowald NM, Kloster S. Potential climate forcing of land use and land cover change. Atmos Chem Phys. 2014;14:12701–24.10.5194/acp-14-12701-2014Search in Google Scholar
[30] Hua W, Haishan H, Sun S, Zhou L. Assessing climatic impacts of future land use and land cover change projected with the CanESM2 model. Int J Climatol. 2015;35:3661–75.10.1002/joc.4240Search in Google Scholar
[31] Xi Y, Peng S, Ciais P, Guimberteau M, Li Y, Piao S, et al. Contributions of climate change, CO2, land-use change, and human activities to changes in river flow across 10 Chinese Basins. J Hydrometeorol. 2018;9:1900–914.10.1175/JHM-D-18-0005.1Search in Google Scholar
[32] Chadwick R, Ackerley D, Ogura T, Dommenget D. Separating the influences of land warming, the direct CO2 effect, the plant physiological effect, and SST warming on regional precipitation changes. J Geophys Res Atmos. 2019;124:624–40.10.1029/2018JD029423Search in Google Scholar
[33] Friedlingstein P, O’Sullivan M, Jones MW, Andrew RM, Hauck J, Olsen A, et al. Global Carbon Budget 2020. Earth Syst Sci Data. 2020;12:3269–340.10.5194/essd-12-3269-2020Search in Google Scholar
[34] Bhide A, Jagannath B, Tanak A, Willis R, Prasad S. CLIP. Carbon dioxide testing suitable for low power microelectronics and IOT interfaces using room temperature ionic liquid platform. Sci Rep. 2020;10:2557.10.1038/s41598-020-59525-ySearch in Google Scholar PubMed PubMed Central
[35] Fine GF, Cavanagh LM, Afonja A, Binions R. Metal oxide semi-conductor gas sensors in environmental monitoring. Sensors. 2010;10:5469–502.10.3390/s100605469Search in Google Scholar PubMed PubMed Central
[36] Jiao Z, Chen F, Su R, Huang X, Liu W, Liu J. Study on the characteristics of Ag doped CuO–BaTiO3 CO2 sensors. Sensors. 2002;2:366–73.10.3390/s20900366Search in Google Scholar
[37] Mandayo GG, Herrán J, Castro-Hurtado I, Castaño E. Performance of a CO2 impedimetric sensor prototype for air quality monitoring. Sensors. 2011;11:5047–57.10.3390/s110505047Search in Google Scholar PubMed PubMed Central
[38] Hannon A, Li J. Solid state electronic sensors for detection of carbon dioxide. Sensors. 2019;19:3848.10.3390/s19183848Search in Google Scholar PubMed PubMed Central
[39] Chu CS, Lo YL. Fiber-optic carbon dioxide sensor based on fluorinated xerogels doped with HPTS. Sens Actuators B Chem. 2008;129:120–5.10.1016/j.snb.2007.07.082Search in Google Scholar
[40] Martin CR, Zeng N, Karion A, Dickerson RR, Ren X, Turpie BN, et al. Evaluation and environmental correction of ambient CO2 measurements from a low-cost NDIR sensor. Atmos Meas Tech. 2017;10:2383–95.10.5194/amt-10-2383-2017Search in Google Scholar PubMed PubMed Central
[41] Brown SL, Goulsbra CS, Evans MG, Heat T, Shuttleworth E. Low cost CO2 sensing: a simple microcontroller approach with calibration and field use. HardwareX. 2020;8:e00136.10.1016/j.ohx.2020.e00136Search in Google Scholar PubMed PubMed Central
[42] Shusterman AA, Teige VE, Turner AJ, Newman C, Kim J, Cohen RC. The Berkeley atmospheric CO2 observation network: initial evaluation. Atmos Chem Phys. 2016;16:13449–63.10.5194/acp-16-13449-2016Search in Google Scholar
[43] Li W, Ciais P, Peng S, Yue C, Wang Y, Thurner M, et al. Land-use and land-cover change carbon emissions between 1901 and 2012 constrained by biomass observations. Biogeosciences. 2017;14:5053–67.10.5194/bg-14-5053-2017Search in Google Scholar
[44] Wang G, Han Q, de vries B. The multi-objective spatial optimization of urban land use based on low-carbon city planning. Ecol Indic. 2021;125:107540.10.1016/j.ecolind.2021.107540Search in Google Scholar
[45] Al-Taher AA. Estimation of potential evapotranspiration in Al-Hassa oasis, Saudi Arabia. GeoJournal. 1992;26(3):371–9.10.1007/BF02629817Search in Google Scholar
[46] Turk KGB, Aljughaiman AS. Land use/land cover assessment as related to soil and irrigation water salinity over an oasis in arid environment. Open Geosci. 2020;2:220–31.10.1515/geo-2020-0103Search in Google Scholar
[47] Ellis EA, Baerenklau KA, Marcos-Martínez R, Chávez E. Land use/land cover change dynamics and drivers in a low-grade marginal coffee growing region of Veracruz, Mexico. Agrofor Syst. 2010;80:61–84.10.1007/s10457-010-9339-2Search in Google Scholar
[48] Rahman MT, Aldosary AS, Mortoja MDG. Modeling future land cover changes and their effects on the land surface temperatures in the Saudi Arabian eastern coastal city of Dammam. Land. 2017;6:36.10.3390/land6020036Search in Google Scholar
[49] Abdallah S, Abdelmohemen M, Hemdan S, Ibrahem K. Assessment of land use/land cover changes induced by Jizan Dam, Saudi Arabia, and their effect on soil organic carbon. Arab J Geosci. 2019;12:350.10.1007/s12517-019-4474-1Search in Google Scholar
[50] Mundia CN, Aniya M. Dynamics of land use/cover changes and degradation of Nairobi city, Kenya. Land Degrad Dev. 2006;17:97–108.10.1002/ldr.702Search in Google Scholar
[51] Congalton RG, Green K. Assessing the accuracy of remotely sensed data, principles and practices. 3rd edn. Boca Raton, London, New York: CRC Press, Taylor & Francis Group; 2019.10.1201/9780429052729Search in Google Scholar
[52] Telaire 7001 Manufacturers Manual. 2014 [cited 2014 Oct]. https://www.onsetcomp.com/support/tech-note/telaire-7001-manufacturers-manual/.Search in Google Scholar
[53] Sheldon MR, Fillyaw MJ, Thompson WD. The use and interpretation of the Friedman test in the analysis of ordinal-scale data in repeated measures designs. Physiother Res Int. 1996;1(4):221–8.10.1002/pri.66Search in Google Scholar PubMed
[54] Pereira DG, Afonso A, Medeiros FM. Overview of Friedman’s test and post-hoc analysis. Commun Stat Simul Comput. 2015;44(10):2636–53.10.1080/03610918.2014.931971Search in Google Scholar
[55] Friedman M. A comparison of alternative tests of significance for the problem of m rankings. Ann Math Stat. 1940;11:86–92.10.1214/aoms/1177731944Search in Google Scholar
[56] Statistics Solutions. Friedman Test, Kendall’s W, Cochran’s Q: Significance Tests for More Than Two Dependent Samples. 2013 [cited 2013 Dec 21]. https://www.statisticssolutions.com/free-resources/directory-of-statistical analyses/significance-tests-for-more-than-two-dependent-samples-friedman-test-kendalls-w-cochrans-q/.Search in Google Scholar
[57] Zaiontz C Real Statistics Using Excel; 2020 [cited 2020 June 15]. www.real-statistics.com.Search in Google Scholar
[58] ArcGIS Help Library. 2013 [cited 2013 Sep 18]. http://desktop.arcgis.com/en/arcmap/latest/get-started/main/get-started-witharcmap.htm.Search in Google Scholar
[59] Hill T, Lewicki P. Statistics methods and applications. Tulsa, OK: StatSoft; 2007.Search in Google Scholar
[60] Baskauf SJ. Introduction to Biological Sciences Lab (BSCI 1510L) Excel Reference and Statistics Manual. Nashville, TN: Vanderbilt University; 2016 [cited 2016 April 12; updated 2020 Aug 24]. http://researchguides.library.vanderbilt.edu/bsci1510L.Search in Google Scholar
[61] Madugundu R, Al-Gaadi KA, Patil VC, Tola E. Detection of land use and land cover changes in dirab region of Saudi Arabia using remotely sensed imageries. Am J Environ Sci. 2014;10:8–18.10.3844/ajessp.2014.8.18Search in Google Scholar
[62] Al-Ahmadi F, Hames A. Comparison of four classification methods to extract land use and land cover from raw satellite images for some remote arid areas, kingdom of Saudi Arabia. J King Saud Univ Sci. 2009;20:167–9.10.4197/Ear.20-1.9Search in Google Scholar
[63] Pigliautile I, Marseglia G, Pisello AL. Investigation of CO2 variation and mapping through wearable sensing techniques for measuring pedestrians’ exposure in urban areas. Sustainability. 2020;12:3936.10.3390/su12093936Search in Google Scholar
[64] Buchholz RR, Paton-Walsh C, Griffith DWT, Kubistin D, Caldow C, Fisher JA, et al. Source and meteorological influences on air quality (CO, CH4 & CO2) at a Southern Hemisphere urban site. Atmos Environ. 2016;126:274–89.10.1016/j.atmosenv.2015.11.041Search in Google Scholar
[65] UN-Habitat. Saudi Arabia. 2022 [cited 2022 May 11]. https://unhabitat.org/saudi-arabia.Search in Google Scholar
[66] Bergeron O, Strachan IB. CO2 sources and sinks in urban and suburban areas of a northern mid-latitude city. Atmos Environ. 2011;45(8):564–1573.10.1016/j.atmosenv.2010.12.043Search in Google Scholar
[67] Wilkinson MJ, Monson RK, Trahan N, Lee S, Brown E, Jackson RB, et al. Leaf isoprene emission rate as a function of atmospheric CO2 concentration. Glob Change Biol. 2009;15:1189–200.10.1111/j.1365-2486.2008.01803.xSearch in Google Scholar
[68] Possell M, Hewitt CN. Isoprene emissions from plants are mediated by atmospheric CO2 concentrations. Glob Change Biol. 2011;17:1595–610.10.1111/j.1365-2486.2010.02306.xSearch in Google Scholar
[69] Koerner B, Klopatek J. Carbon fluxes and nitrogen availability along an urban–rural gradient in a desert landscape. Urban Ecosyst. 2010;13(1):1–21.10.1007/s11252-009-0105-zSearch in Google Scholar
[70] Song J, Wang ZH, Wang C. Biospheric and anthropogenic contributors to atmospheric CO2 variability in a residential neighborhood of Phoenix, Arizona. J Geophys Res Atmos. 2017;22(6):3317–29.10.1002/2016JD026267Search in Google Scholar
[71] Wang Y, Akbari H. The effects of street tree planting on urban heat island mitigation in Montreal. Sustain Cities Soc. 2016;122–8.10.1016/j.scs.2016.04.013Search in Google Scholar
[72] Alghannam AO, Al-Qahtnai MRA. Impact of vegetation cover on urban and rural areas of arid climates. Aust J Agric Eng. 2012;3(1):1–5.Search in Google Scholar
[73] Salem MZ, Almuzaini RF, Kishawi YS. The impact of road transport on CO2 atmospheric concentrations in Gaza city (Palestine), and urban vegetation as a mitigation measure. Pol J Environ Stud. 2017;26(5):2175–88.10.15244/pjoes/69445Search in Google Scholar
[74] Pataki DE, Alberti M, Cadenasso ML, Felson AJ, McDonnell MJ, Pincetl S, et al. Benefits and limits of urban tree planting for environmental and human health. Front Ecol Evol. 2021;9:603757.10.3389/fevo.2021.603757Search in Google Scholar
[75] Barnes D, Corwin S, Kaszynski K, Pankratz DM, McGuinty E Policy considerations for a low-carbon food and land-use system. Deloitte Global, 2021 [cited 2021 Nov 23]. https://www2.deloitte.com/global/en/pages/about-deloitte/articles/policy-considerations-for-low-carbon-food-and-land-use-system.html.Search in Google Scholar
[76] Zhang R, Matsushima K, Kobayashi K. Can land use planning help mitigate transport-related carbon emissions? A case of Changzhou. Land Use Policy. 2018;74:32–40.10.1016/j.landusepol.2017.04.025Search in Google Scholar
[77] Houghton RA, Hacker JL, Lawrence KT. The U.S. carbon budget: contributions from land-use change. Science. 1999;285:574–8.10.1126/science.285.5427.574Search in Google Scholar PubMed
[78] Caspersen JP, Pacala SW, Jenkins JC, Hurtt GC, Moorcroft PR, Birdsey RA. Contributions of land-use history to carbon accumulation in U.S. Science. 2000;290:1148–51.10.1126/science.290.5494.1148Search in Google Scholar PubMed
[79] Leung DY, Tsui JK, Chen F, Yip WK, Vrijmoed LL, Liu CH. Effects of urban vegetation on urban air quality. Landsc Res. 2011;36:173–88.10.1080/01426397.2010.547570Search in Google Scholar
[80] Liu Z, Brown RD, Zheng S, Jiang Y, Zhao L. Ani-depth analysis of the effect of trees on human energy fluxes. Urban Urban Green. 2020;50:126646.10.1016/j.ufug.2020.126646Search in Google Scholar
[81] Ferrini F, Fini A, Mori J, Gori A. Role of vegetation as a mitigating factor in the urban context. Sustainability. 2020;12:4247.10.3390/su12104247Search in Google Scholar
[82] Mu B, Zhao X, Wu D, Wang X, Zhao J, Wang H, et al. Vegetation cover change and its attribution in China from 2001 to 2018. Remote Sens. 2021;13:496.10.3390/rs13030496Search in Google Scholar
[83] Yin S, Wang X, Tani H, Zhang X, Zhong G, Sun Z, et al. Analyzing temporo-spatial changes and the distribution of the CO2 concentration in Australia from 2009 to 2016 by greenhouse gas monitoring satellites. Atmos Environ. 2018;192:1–12.10.1016/j.atmosenv.2018.08.043Search in Google Scholar
[84] Makido Y, Dhakal S, Yamagata Y. Relationship between urban form and CO2 emissions: evidence from fifty Japanese cities. Urban Clim. 2012;2:55–67.10.1016/j.uclim.2012.10.006Search in Google Scholar
[85] Guo R, Leng H, Yuan Q, Song S. Impact of urban form on CO2 emissions under different socioeconomic factors: evidence from 132 small and medium-sized cities in China. Land. 2022;11:713.10.3390/land11050713Search in Google Scholar
© 2023 the author(s), published by De Gruyter
This work is licensed under the Creative Commons Attribution 4.0 International License.
Articles in the same Issue
- Biomedical Sciences
- Systemic investigation of inetetamab in combination with small molecules to treat HER2-overexpressing breast and gastric cancers
- Immunosuppressive treatment for idiopathic membranous nephropathy: An updated network meta-analysis
- Identifying two pathogenic variants in a patient with pigmented paravenous retinochoroidal atrophy
- Effects of phytoestrogens combined with cold stress on sperm parameters and testicular proteomics in rats
- A case of pulmonary embolism with bad warfarin anticoagulant effects caused by E. coli infection
- Neutrophilia with subclinical Cushing’s disease: A case report and literature review
- Isoimperatorin alleviates lipopolysaccharide-induced periodontitis by downregulating ERK1/2 and NF-κB pathways
- Immunoregulation of synovial macrophages for the treatment of osteoarthritis
- Novel CPLANE1 c.8948dupT (p.P2984Tfs*7) variant in a child patient with Joubert syndrome
- Antiphospholipid antibodies and the risk of thrombosis in myeloproliferative neoplasms
- Immunological responses of septic rats to combination therapy with thymosin α1 and vitamin C
- High glucose and high lipid induced mitochondrial dysfunction in JEG-3 cells through oxidative stress
- Pharmacological inhibition of the ubiquitin-specific protease 8 effectively suppresses glioblastoma cell growth
- Levocarnitine regulates the growth of angiotensin II-induced myocardial fibrosis cells via TIMP-1
- Age-related changes in peripheral T-cell subpopulations in elderly individuals: An observational study
- Single-cell transcription analysis reveals the tumor origin and heterogeneity of human bilateral renal clear cell carcinoma
- Identification of iron metabolism-related genes as diagnostic signatures in sepsis by blood transcriptomic analysis
- Long noncoding RNA ACART knockdown decreases 3T3-L1 preadipocyte proliferation and differentiation
- Surgery, adjuvant immunotherapy plus chemotherapy and radiotherapy for primary malignant melanoma of the parotid gland (PGMM): A case report
- Dosimetry comparison with helical tomotherapy, volumetric modulated arc therapy, and intensity-modulated radiotherapy for grade II gliomas: A single‑institution case series
- Soy isoflavone reduces LPS-induced acute lung injury via increasing aquaporin 1 and aquaporin 5 in rats
- Refractory hypokalemia with sexual dysplasia and infertility caused by 17α-hydroxylase deficiency and triple X syndrome: A case report
- Meta-analysis of cancer risk among end stage renal disease undergoing maintenance dialysis
- 6-Phosphogluconate dehydrogenase inhibition arrests growth and induces apoptosis in gastric cancer via AMPK activation and oxidative stress
- Experimental study on the optimization of ANM33 release in foam cells
- Primary retroperitoneal angiosarcoma: A case report
- Metabolomic analysis-identified 2-hydroxybutyric acid might be a key metabolite of severe preeclampsia
- Malignant pleural effusion diagnosis and therapy
- Effect of spaceflight on the phenotype and proteome of Escherichia coli
- Comparison of immunotherapy combined with stereotactic radiotherapy and targeted therapy for patients with brain metastases: A systemic review and meta-analysis
- Activation of hypermethylated P2RY1 mitigates gastric cancer by promoting apoptosis and inhibiting proliferation
- Association between the VEGFR-2 -604T/C polymorphism (rs2071559) and type 2 diabetic retinopathy
- The role of IL-31 and IL-34 in the diagnosis and treatment of chronic periodontitis
- Triple-negative mouse breast cancer initiating cells show high expression of beta1 integrin and increased malignant features
- mNGS facilitates the accurate diagnosis and antibiotic treatment of suspicious critical CNS infection in real practice: A retrospective study
- The apatinib and pemetrexed combination has antitumor and antiangiogenic effects against NSCLC
- Radiotherapy for primary thyroid adenoid cystic carcinoma
- Design and functional preliminary investigation of recombinant antigen EgG1Y162–EgG1Y162 against Echinococcus granulosus
- Effects of losartan in patients with NAFLD: A meta-analysis of randomized controlled trial
- Bibliometric analysis of METTL3: Current perspectives, highlights, and trending topics
- Performance comparison of three scaling algorithms in NMR-based metabolomics analysis
- PI3K/AKT/mTOR pathway and its related molecules participate in PROK1 silence-induced anti-tumor effects on pancreatic cancer
- The altered expression of cytoskeletal and synaptic remodeling proteins during epilepsy
- Effects of pegylated recombinant human granulocyte colony-stimulating factor on lymphocytes and white blood cells of patients with malignant tumor
- Prostatitis as initial manifestation of Chlamydia psittaci pneumonia diagnosed by metagenome next-generation sequencing: A case report
- NUDT21 relieves sevoflurane-induced neurological damage in rats by down-regulating LIMK2
- Association of interleukin-10 rs1800896, rs1800872, and interleukin-6 rs1800795 polymorphisms with squamous cell carcinoma risk: A meta-analysis
- Exosomal HBV-DNA for diagnosis and treatment monitoring of chronic hepatitis B
- Shear stress leads to the dysfunction of endothelial cells through the Cav-1-mediated KLF2/eNOS/ERK signaling pathway under physiological conditions
- Interaction between the PI3K/AKT pathway and mitochondrial autophagy in macrophages and the leukocyte count in rats with LPS-induced pulmonary infection
- Meta-analysis of the rs231775 locus polymorphism in the CTLA-4 gene and the susceptibility to Graves’ disease in children
- Cloning, subcellular localization and expression of phosphate transporter gene HvPT6 of hulless barley
- Coptisine mitigates diabetic nephropathy via repressing the NRLP3 inflammasome
- Significant elevated CXCL14 and decreased IL-39 levels in patients with tuberculosis
- Whole-exome sequencing applications in prenatal diagnosis of fetal bowel dilatation
- Gemella morbillorum infective endocarditis: A case report and literature review
- An unusual ectopic thymoma clonal evolution analysis: A case report
- Severe cumulative skin toxicity during toripalimab combined with vemurafenib following toripalimab alone
- Detection of V. vulnificus septic shock with ARDS using mNGS
- Novel rare genetic variants of familial and sporadic pulmonary atresia identified by whole-exome sequencing
- The influence and mechanistic action of sperm DNA fragmentation index on the outcomes of assisted reproduction technology
- Novel compound heterozygous mutations in TELO2 in an infant with You-Hoover-Fong syndrome: A case report and literature review
- ctDNA as a prognostic biomarker in resectable CLM: Systematic review and meta-analysis
- Diagnosis of primary amoebic meningoencephalitis by metagenomic next-generation sequencing: A case report
- Phylogenetic analysis of promoter regions of human Dolichol kinase (DOLK) and orthologous genes using bioinformatics tools
- Collagen changes in rabbit conjunctiva after conjunctival crosslinking
- Effects of NM23 transfection of human gastric carcinoma cells in mice
- Oral nifedipine and phytosterol, intravenous nicardipine, and oral nifedipine only: Three-arm, retrospective, cohort study for management of severe preeclampsia
- Case report of hepatic retiform hemangioendothelioma: A rare tumor treated with ultrasound-guided microwave ablation
- Curcumin induces apoptosis in human hepatocellular carcinoma cells by decreasing the expression of STAT3/VEGF/HIF-1α signaling
- Rare presentation of double-clonal Waldenström macroglobulinemia with pulmonary embolism: A case report
- Giant duplication of the transverse colon in an adult: A case report and literature review
- Ectopic thyroid tissue in the breast: A case report
- SDR16C5 promotes proliferation and migration and inhibits apoptosis in pancreatic cancer
- Vaginal metastasis from breast cancer: A case report
- Screening of the best time window for MSC transplantation to treat acute myocardial infarction with SDF-1α antibody-loaded targeted ultrasonic microbubbles: An in vivo study in miniswine
- Inhibition of TAZ impairs the migration ability of melanoma cells
- Molecular complexity analysis of the diagnosis of Gitelman syndrome in China
- Effects of maternal calcium and protein intake on the development and bone metabolism of offspring mice
- Identification of winter wheat pests and diseases based on improved convolutional neural network
- Ultra-multiplex PCR technique to guide treatment of Aspergillus-infected aortic valve prostheses
- Virtual high-throughput screening: Potential inhibitors targeting aminopeptidase N (CD13) and PIKfyve for SARS-CoV-2
- Immune checkpoint inhibitors in cancer patients with COVID-19
- Utility of methylene blue mixed with autologous blood in preoperative localization of pulmonary nodules and masses
- Integrated analysis of the microbiome and transcriptome in stomach adenocarcinoma
- Berberine suppressed sarcopenia insulin resistance through SIRT1-mediated mitophagy
- DUSP2 inhibits the progression of lupus nephritis in mice by regulating the STAT3 pathway
- Lung abscess by Fusobacterium nucleatum and Streptococcus spp. co-infection by mNGS: A case series
- Genetic alterations of KRAS and TP53 in intrahepatic cholangiocarcinoma associated with poor prognosis
- Granulomatous polyangiitis involving the fourth ventricle: Report of a rare case and a literature review
- Studying infant mortality: A demographic analysis based on data mining models
- Metaplastic breast carcinoma with osseous differentiation: A report of a rare case and literature review
- Protein Z modulates the metastasis of lung adenocarcinoma cells
- Inhibition of pyroptosis and apoptosis by capsaicin protects against LPS-induced acute kidney injury through TRPV1/UCP2 axis in vitro
- TAK-242, a toll-like receptor 4 antagonist, against brain injury by alleviates autophagy and inflammation in rats
- Primary mediastinum Ewing’s sarcoma with pleural effusion: A case report and literature review
- Association of ADRB2 gene polymorphisms and intestinal microbiota in Chinese Han adolescents
- Tanshinone IIA alleviates chondrocyte apoptosis and extracellular matrix degeneration by inhibiting ferroptosis
- Study on the cytokines related to SARS-Cov-2 in testicular cells and the interaction network between cells based on scRNA-seq data
- Effect of periostin on bone metabolic and autophagy factors during tooth eruption in mice
- HP1 induces ferroptosis of renal tubular epithelial cells through NRF2 pathway in diabetic nephropathy
- Intravaginal estrogen management in postmenopausal patients with vaginal squamous intraepithelial lesions along with CO2 laser ablation: A retrospective study
- Hepatocellular carcinoma cell differentiation trajectory predicts immunotherapy, potential therapeutic drugs, and prognosis of patients
- Effects of physical exercise on biomarkers of oxidative stress in healthy subjects: A meta-analysis of randomized controlled trials
- Identification of lysosome-related genes in connection with prognosis and immune cell infiltration for drug candidates in head and neck cancer
- Development of an instrument-free and low-cost ELISA dot-blot test to detect antibodies against SARS-CoV-2
- Research progress on gas signal molecular therapy for Parkinson’s disease
- Adiponectin inhibits TGF-β1-induced skin fibroblast proliferation and phenotype transformation via the p38 MAPK signaling pathway
- The G protein-coupled receptor-related gene signatures for predicting prognosis and immunotherapy response in bladder urothelial carcinoma
- α-Fetoprotein contributes to the malignant biological properties of AFP-producing gastric cancer
- CXCL12/CXCR4/CXCR7 axis in placenta tissues of patients with placenta previa
- Association between thyroid stimulating hormone levels and papillary thyroid cancer risk: A meta-analysis
- Significance of sTREM-1 and sST2 combined diagnosis for sepsis detection and prognosis prediction
- Diagnostic value of serum neuroactive substances in the acute exacerbation of chronic obstructive pulmonary disease complicated with depression
- Research progress of AMP-activated protein kinase and cardiac aging
- TRIM29 knockdown prevented the colon cancer progression through decreasing the ubiquitination levels of KRT5
- Cross-talk between gut microbiota and liver steatosis: Complications and therapeutic target
- Metastasis from small cell lung cancer to ovary: A case report
- The early diagnosis and pathogenic mechanisms of sepsis-related acute kidney injury
- The effect of NK cell therapy on sepsis secondary to lung cancer: A case report
- Erianin alleviates collagen-induced arthritis in mice by inhibiting Th17 cell differentiation
- Loss of ACOX1 in clear cell renal cell carcinoma and its correlation with clinical features
- Signalling pathways in the osteogenic differentiation of periodontal ligament stem cells
- Crosstalk between lactic acid and immune regulation and its value in the diagnosis and treatment of liver failure
- Clinicopathological features and differential diagnosis of gastric pleomorphic giant cell carcinoma
- Traumatic brain injury and rTMS-ERPs: Case report and literature review
- Extracellular fibrin promotes non-small cell lung cancer progression through integrin β1/PTEN/AKT signaling
- Knockdown of DLK4 inhibits non-small cell lung cancer tumor growth by downregulating CKS2
- The co-expression pattern of VEGFR-2 with indicators related to proliferation, apoptosis, and differentiation of anagen hair follicles
- Inflammation-related signaling pathways in tendinopathy
- CD4+ T cell count in HIV/TB co-infection and co-occurrence with HL: Case report and literature review
- Clinical analysis of severe Chlamydia psittaci pneumonia: Case series study
- Bioinformatics analysis to identify potential biomarkers for the pulmonary artery hypertension associated with the basement membrane
- Influence of MTHFR polymorphism, alone or in combination with smoking and alcohol consumption, on cancer susceptibility
- Catharanthus roseus (L.) G. Don counteracts the ampicillin resistance in multiple antibiotic-resistant Staphylococcus aureus by downregulation of PBP2a synthesis
- Combination of a bronchogenic cyst in the thoracic spinal canal with chronic myelocytic leukemia
- Bacterial lipoprotein plays an important role in the macrophage autophagy and apoptosis induced by Salmonella typhimurium and Staphylococcus aureus
- TCL1A+ B cells predict prognosis in triple-negative breast cancer through integrative analysis of single-cell and bulk transcriptomic data
- Ezrin promotes esophageal squamous cell carcinoma progression via the Hippo signaling pathway
- Ferroptosis: A potential target of macrophages in plaque vulnerability
- Predicting pediatric Crohn's disease based on six mRNA-constructed risk signature using comprehensive bioinformatic approaches
- Applications of genetic code expansion and photosensitive UAAs in studying membrane proteins
- HK2 contributes to the proliferation, migration, and invasion of diffuse large B-cell lymphoma cells by enhancing the ERK1/2 signaling pathway
- IL-17 in osteoarthritis: A narrative review
- Circadian cycle and neuroinflammation
- Probiotic management and inflammatory factors as a novel treatment in cirrhosis: A systematic review and meta-analysis
- Hemorrhagic meningioma with pulmonary metastasis: Case report and literature review
- SPOP regulates the expression profiles and alternative splicing events in human hepatocytes
- Knockdown of SETD5 inhibited glycolysis and tumor growth in gastric cancer cells by down-regulating Akt signaling pathway
- PTX3 promotes IVIG resistance-induced endothelial injury in Kawasaki disease by regulating the NF-κB pathway
- Pancreatic ectopic thyroid tissue: A case report and analysis of literature
- The prognostic impact of body mass index on female breast cancer patients in underdeveloped regions of northern China differs by menopause status and tumor molecular subtype
- Report on a case of liver-originating malignant melanoma of unknown primary
- Case report: Herbal treatment of neutropenic enterocolitis after chemotherapy for breast cancer
- The fibroblast growth factor–Klotho axis at molecular level
- Characterization of amiodarone action on currents in hERG-T618 gain-of-function mutations
- A case report of diagnosis and dynamic monitoring of Listeria monocytogenes meningitis with NGS
- Effect of autologous platelet-rich plasma on new bone formation and viability of a Marburg bone graft
- Small breast epithelial mucin as a useful prognostic marker for breast cancer patients
- Continuous non-adherent culture promotes transdifferentiation of human adipose-derived stem cells into retinal lineage
- Nrf3 alleviates oxidative stress and promotes the survival of colon cancer cells by activating AKT/BCL-2 signal pathway
- Favorable response to surufatinib in a patient with necrolytic migratory erythema: A case report
- Case report of atypical undernutrition of hypoproteinemia type
- Down-regulation of COL1A1 inhibits tumor-associated fibroblast activation and mediates matrix remodeling in the tumor microenvironment of breast cancer
- Sarcoma protein kinase inhibition alleviates liver fibrosis by promoting hepatic stellate cells ferroptosis
- Research progress of serum eosinophil in chronic obstructive pulmonary disease and asthma
- Clinicopathological characteristics of co-existing or mixed colorectal cancer and neuroendocrine tumor: Report of five cases
- Role of menopausal hormone therapy in the prevention of postmenopausal osteoporosis
- Precisional detection of lymph node metastasis using tFCM in colorectal cancer
- Advances in diagnosis and treatment of perimenopausal syndrome
- A study of forensic genetics: ITO index distribution and kinship judgment between two individuals
- Acute lupus pneumonitis resembling miliary tuberculosis: A case-based review
- Plasma levels of CD36 and glutathione as biomarkers for ruptured intracranial aneurysm
- Fractalkine modulates pulmonary angiogenesis and tube formation by modulating CX3CR1 and growth factors in PVECs
- Novel risk prediction models for deep vein thrombosis after thoracotomy and thoracoscopic lung cancer resections, involving coagulation and immune function
- Exploring the diagnostic markers of essential tremor: A study based on machine learning algorithms
- Evaluation of effects of small-incision approach treatment on proximal tibia fracture by deep learning algorithm-based magnetic resonance imaging
- An online diagnosis method for cancer lesions based on intelligent imaging analysis
- Medical imaging in rheumatoid arthritis: A review on deep learning approach
- Predictive analytics in smart healthcare for child mortality prediction using a machine learning approach
- Utility of neutrophil–lymphocyte ratio and platelet–lymphocyte ratio in predicting acute-on-chronic liver failure survival
- A biomedical decision support system for meta-analysis of bilateral upper-limb training in stroke patients with hemiplegia
- TNF-α and IL-8 levels are positively correlated with hypobaric hypoxic pulmonary hypertension and pulmonary vascular remodeling in rats
- Stochastic gradient descent optimisation for convolutional neural network for medical image segmentation
- Comparison of the prognostic value of four different critical illness scores in patients with sepsis-induced coagulopathy
- Application and teaching of computer molecular simulation embedded technology and artificial intelligence in drug research and development
- Hepatobiliary surgery based on intelligent image segmentation technology
- Value of brain injury-related indicators based on neural network in the diagnosis of neonatal hypoxic-ischemic encephalopathy
- Analysis of early diagnosis methods for asymmetric dementia in brain MR images based on genetic medical technology
- Early diagnosis for the onset of peri-implantitis based on artificial neural network
- Clinical significance of the detection of serum IgG4 and IgG4/IgG ratio in patients with thyroid-associated ophthalmopathy
- Forecast of pain degree of lumbar disc herniation based on back propagation neural network
- SPA-UNet: A liver tumor segmentation network based on fused multi-scale features
- Systematic evaluation of clinical efficacy of CYP1B1 gene polymorphism in EGFR mutant non-small cell lung cancer observed by medical image
- Rehabilitation effect of intelligent rehabilitation training system on hemiplegic limb spasms after stroke
- A novel approach for minimising anti-aliasing effects in EEG data acquisition
- ErbB4 promotes M2 activation of macrophages in idiopathic pulmonary fibrosis
- Clinical role of CYP1B1 gene polymorphism in prediction of postoperative chemotherapy efficacy in NSCLC based on individualized health model
- Lung nodule segmentation via semi-residual multi-resolution neural networks
- Evaluation of brain nerve function in ICU patients with Delirium by deep learning algorithm-based resting state MRI
- A data mining technique for detecting malignant mesothelioma cancer using multiple regression analysis
- Markov model combined with MR diffusion tensor imaging for predicting the onset of Alzheimer’s disease
- Effectiveness of the treatment of depression associated with cancer and neuroimaging changes in depression-related brain regions in patients treated with the mediator-deuterium acupuncture method
- Molecular mechanism of colorectal cancer and screening of molecular markers based on bioinformatics analysis
- Monitoring and evaluation of anesthesia depth status data based on neuroscience
- Exploring the conformational dynamics and thermodynamics of EGFR S768I and G719X + S768I mutations in non-small cell lung cancer: An in silico approaches
- Optimised feature selection-driven convolutional neural network using gray level co-occurrence matrix for detection of cervical cancer
- Incidence of different pressure patterns of spinal cerebellar ataxia and analysis of imaging and genetic diagnosis
- Pathogenic bacteria and treatment resistance in older cardiovascular disease patients with lung infection and risk prediction model
- Adoption value of support vector machine algorithm-based computed tomography imaging in the diagnosis of secondary pulmonary fungal infections in patients with malignant hematological disorders
- From slides to insights: Harnessing deep learning for prognostic survival prediction in human colorectal cancer histology
- Ecology and Environmental Science
- Monitoring of hourly carbon dioxide concentration under different land use types in arid ecosystem
- Comparing the differences of prokaryotic microbial community between pit walls and bottom from Chinese liquor revealed by 16S rRNA gene sequencing
- Effects of cadmium stress on fruits germination and growth of two herbage species
- Bamboo charcoal affects soil properties and bacterial community in tea plantations
- Optimization of biogas potential using kinetic models, response surface methodology, and instrumental evidence for biodegradation of tannery fleshings during anaerobic digestion
- Understory vegetation diversity patterns of Platycladus orientalis and Pinus elliottii communities in Central and Southern China
- Studies on macrofungi diversity and discovery of new species of Abortiporus from Baotianman World Biosphere Reserve
- Food Science
- Effect of berrycactus fruit (Myrtillocactus geometrizans) on glutamate, glutamine, and GABA levels in the frontal cortex of rats fed with a high-fat diet
- Guesstimate of thymoquinone diversity in Nigella sativa L. genotypes and elite varieties collected from Indian states using HPTLC technique
- Analysis of bacterial community structure of Fuzhuan tea with different processing techniques
- Untargeted metabolomics reveals sour jujube kernel benefiting the nutritional value and flavor of Morchella esculenta
- Mycobiota in Slovak wine grapes: A case study from the small Carpathians wine region
- Elemental analysis of Fadogia ancylantha leaves used as a nutraceutical in Mashonaland West Province, Zimbabwe
- Microbiological transglutaminase: Biotechnological application in the food industry
- Influence of solvent-free extraction of fish oil from catfish (Clarias magur) heads using a Taguchi orthogonal array design: A qualitative and quantitative approach
- Chromatographic analysis of the chemical composition and anticancer activities of Curcuma longa extract cultivated in Palestine
- The potential for the use of leghemoglobin and plant ferritin as sources of iron
- Investigating the association between dietary patterns and glycemic control among children and adolescents with T1DM
- Bioengineering and Biotechnology
- Biocompatibility and osteointegration capability of β-TCP manufactured by stereolithography 3D printing: In vitro study
- Clinical characteristics and the prognosis of diabetic foot in Tibet: A single center, retrospective study
- Agriculture
- Biofertilizer and NPSB fertilizer application effects on nodulation and productivity of common bean (Phaseolus vulgaris L.) at Sodo Zuria, Southern Ethiopia
- On correlation between canopy vegetation and growth indexes of maize varieties with different nitrogen efficiencies
- Exopolysaccharides from Pseudomonas tolaasii inhibit the growth of Pleurotus ostreatus mycelia
- A transcriptomic evaluation of the mechanism of programmed cell death of the replaceable bud in Chinese chestnut
- Melatonin enhances salt tolerance in sorghum by modulating photosynthetic performance, osmoregulation, antioxidant defense, and ion homeostasis
- Effects of plant density on alfalfa (Medicago sativa L.) seed yield in western Heilongjiang areas
- Identification of rice leaf diseases and deficiency disorders using a novel DeepBatch technique
- Artificial intelligence and internet of things oriented sustainable precision farming: Towards modern agriculture
- Animal Sciences
- Effect of ketogenic diet on exercise tolerance and transcriptome of gastrocnemius in mice
- Combined analysis of mRNA–miRNA from testis tissue in Tibetan sheep with different FecB genotypes
- Isolation, identification, and drug resistance of a partially isolated bacterium from the gill of Siniperca chuatsi
- Tracking behavioral changes of confined sows from the first mating to the third parity
- The sequencing of the key genes and end products in the TLR4 signaling pathway from the kidney of Rana dybowskii exposed to Aeromonas hydrophila
- Development of a new candidate vaccine against piglet diarrhea caused by Escherichia coli
- Plant Sciences
- Crown and diameter structure of pure Pinus massoniana Lamb. forest in Hunan province, China
- Genetic evaluation and germplasm identification analysis on ITS2, trnL-F, and psbA-trnH of alfalfa varieties germplasm resources
- Tissue culture and rapid propagation technology for Gentiana rhodantha
- Effects of cadmium on the synthesis of active ingredients in Salvia miltiorrhiza
- Cloning and expression analysis of VrNAC13 gene in mung bean
- Chlorate-induced molecular floral transition revealed by transcriptomes
- Effects of warming and drought on growth and development of soybean in Hailun region
- Effects of different light conditions on transient expression and biomass in Nicotiana benthamiana leaves
- Comparative analysis of the rhizosphere microbiome and medicinally active ingredients of Atractylodes lancea from different geographical origins
- Distinguish Dianthus species or varieties based on chloroplast genomes
- Comparative transcriptomes reveal molecular mechanisms of apple blossoms of different tolerance genotypes to chilling injury
- Study on fresh processing key technology and quality influence of Cut Ophiopogonis Radix based on multi-index evaluation
- An advanced approach for fig leaf disease detection and classification: Leveraging image processing and enhanced support vector machine methodology
- Erratum
- Erratum to “Protein Z modulates the metastasis of lung adenocarcinoma cells”
- Erratum to “BRCA1 subcellular localization regulated by PI3K signaling pathway in triple-negative breast cancer MDA-MB-231 cells and hormone-sensitive T47D cells”
- Retraction
- Retraction to “Protocatechuic acid attenuates cerebral aneurysm formation and progression by inhibiting TNF-alpha/Nrf-2/NF-kB-mediated inflammatory mechanisms in experimental rats”