Understory vegetation diversity patterns of Platycladus orientalis and Pinus elliottii communities in Central and Southern China
-
Nan Deng


Abstract
As a vital component of arbor forests, understory vegetation serves as an essential buffer zone for storing carbon due to its strong capacity for community regeneration. This study aimed to identify the diversity pattern and construction mechanism of Platycladus orientalis and Pinus elliottii understory vegetation based on large-scale sample surveys. The Bayesian Information Criterion value of species abundance distribution (SAD) indicated that the Zipf and Zipf–Mandelbrot models were the best-fitting models. The SAD and gambin fitting results suggested that the Pi. elliottii community had a more balanced structure, with most species being relatively abundant. The multiple regression tree model detected four and six indicator species in P. orientalis and Pi. elliottii communities, respectively. The α-diversity index increased with a rise in altitude and showed a wavy curve with latitude. Linear regression between the β diversity and environmental and geographic distance indicated that the P. orientalis and Pi. elliottii understory communities tended to be dominated by different ecological processes. The partition of β diversity indicated that both communities were dominated by turnover processes, which were caused by environmental classification or spatial constraints. This study helped to understand the diversity maintenance in the P. orientalis and Pi. elliottii understory vegetation communities, and will benefit for diversity restoration and conservation of pure conifer forests.
1 Introduction
Unsustainable timber harvesting and deforestation have become a major global concern and reduced the forest ecosystems. The world’s forest area has been declining annually over the last 25 years [1,2]. The area of primitive forests has decreased sharply in many regions such as the Amazon Basin [3,4]. According to the UN report, a total of 420 million hectares of forests have been deforested globally since 1990, i.e., trees have been cut down and forest land converted to agriculture or infrastructure. In the last few decades, timber production and clear forest areas to be used for crops and grazing were the main objectives of forest management in China, where the forest cover is less than 13% before 1990. The multiple ecosystem services of forests have gained increasing attention, such as greenhouse gas emissions, and changes in the hydrological cycle [5–7] and protection of forests and afforestation are being carried out globally. China has undergone large-scale afforestation following prior deforestation. The planted forest area accounted for 8.0 × 10⁷ ha in 2018, and the forest coverage reached 23% in 2022. China has made remarkable achievements in forest restoration, and a quarter of the world’s new green space came from China between 2000 and 2017 [8]. The artificial forest has significant ecological benefits, but some ecological threats have emerged, such as biodiversity losses and changes to nutrient exchange, land degradation, invasion of alien species, and low forest quality [9–12]. Coniferous trees are widespread among afforestation species because of their tall and straight tree trunks. These trunks are versatile, serving as valuable resources for construction, vehicles, ships, and sleepers, as well as high-quality raw materials for papermaking and civil industry. Implementing the “ecological forests” policy has led to the protection of many areas to provide ecological services, constituting a crucial forest biodiversity repository. These protected forests rely on ecological succession to restore the structural and functional complexity, and allow natural disturbance dynamics, providing an example of passive rewilding [13]. Woody plant species encroachment does not universally degrade ecosystems [5,6,14,15] but rather expedites the recovery of understory shrub and herbaceous species and even imperiled avian species [16–18]. Understory vegetation is a vital component of forests and serves as an essential buffer for mitigating climate change due to its strong capacity for carbon accumulation [19,20]. The diversity pattern of understory vegetation not only reflects the structure and developmental stage but also reveals its dynamic adaptation to the environment [21].
Understanding biodiversity patterns and the mechanisms involved in their formation can contribute to sustainable and effective biodiversity conservation. The abundance of each species in an assemblage depends on several ecological characteristics [22]. The species abundance distribution (SAD) characterizes the proportional abundance of species in an ecological community and was proposed to be used to verify the mechanism underlying species assembly rules. The comparison of SAD models is often used to detect disturbance and damage to the ecosystem, explain resource allocation and interspecific associations among species, and so forth [16–18]. Biodiversity is usually divided into α and β diversities, with α diversity representing the number and evenness of species [23] and β diversity reflecting the species composition among communities on spatial or temporal scales [24]. α diversity is usually studied because it is easy to observe, and the spatial and temporal influences are ignored [25]. β diversity may reflect the dynamic of biodiversity patterns better than simple measures of α-diversity alone [26]. The niche and neutral theories are the two major theories that explain diversity gradients. Niche theory emphasizes the importance of the environment, and neutral theory holds that community dynamics is a random process. Moreover, dispersal limitations are considered to play an essential role in the community structure [27]. Comparing different aspects of diversity at different scales may be necessary to identify ecological processes [27].
The study areas were located in Central and Southern China, dominated by mountains and hills, forming a highly heterogeneous habitat unit and diversity pattern. The pure Platycladus orientalis and Pinus elliottii understory vegetation communities are the two typical afforestation species in the mountainous areas. However, the structure and underlying mechanisms governing the diversity of understory vegetation in these two forests remain unanswered. In this study, our objective was to (1) detect and compare the diversity patterns of the two understory vegetation communities, assessing the resilience of diversity structures and (2) reveal the community construction mechanism by β diversity to evaluate the further impacts of pure forest plantations on forest ecological succession.
2 Materials and methods
2.1 Data sources
The forest survey data were obtained from the forest fixed-area sample plot investigation database of Hunan ecological forests (updated in 2019), which contained 683 fixed-area sample plots distributed in subtropical areas. The plot size was 25 m (vertically to the contour line) × 40 m (parallel to the contour line). In each plot, trees with a DBH (diameter at breast height) exceeding 5 cm were measured. Additionally, five small shrub subplots (2 × 2 m2) were established within the plot to assess the characteristics of the understory plant community, plants below 5 m are recorded, each data of subplot are aggregated to represent the overall plot. Within these subplots, data including species composition and the number of shrubs were recorded. Stand dynamics factors, such as density canopy, slope position, and altitude for each plot, were also measured. For this study, the sites of pure P. orientalis (L.) Franco (15 plots) and Pi. elliottii Englem (18 plots) were selected from the database (Figure 1), with the majority of these plots representing plantation sites. Bioclimatic variables are considered as biologically meaningful variables, which are often used in species distribution modeling, and related ecological modeling techniques. For this study, 19 bioclimatic variables for each site were retrieved from the world climate database at the 30 s spatial resolution (WorldClim: http://www.worldclim.org/) (Table S1). The 19 bioclimatic and stand dynamics factors are selected as environment factors, which are used in multiple regression tree (MRT) and testing of β diversity.
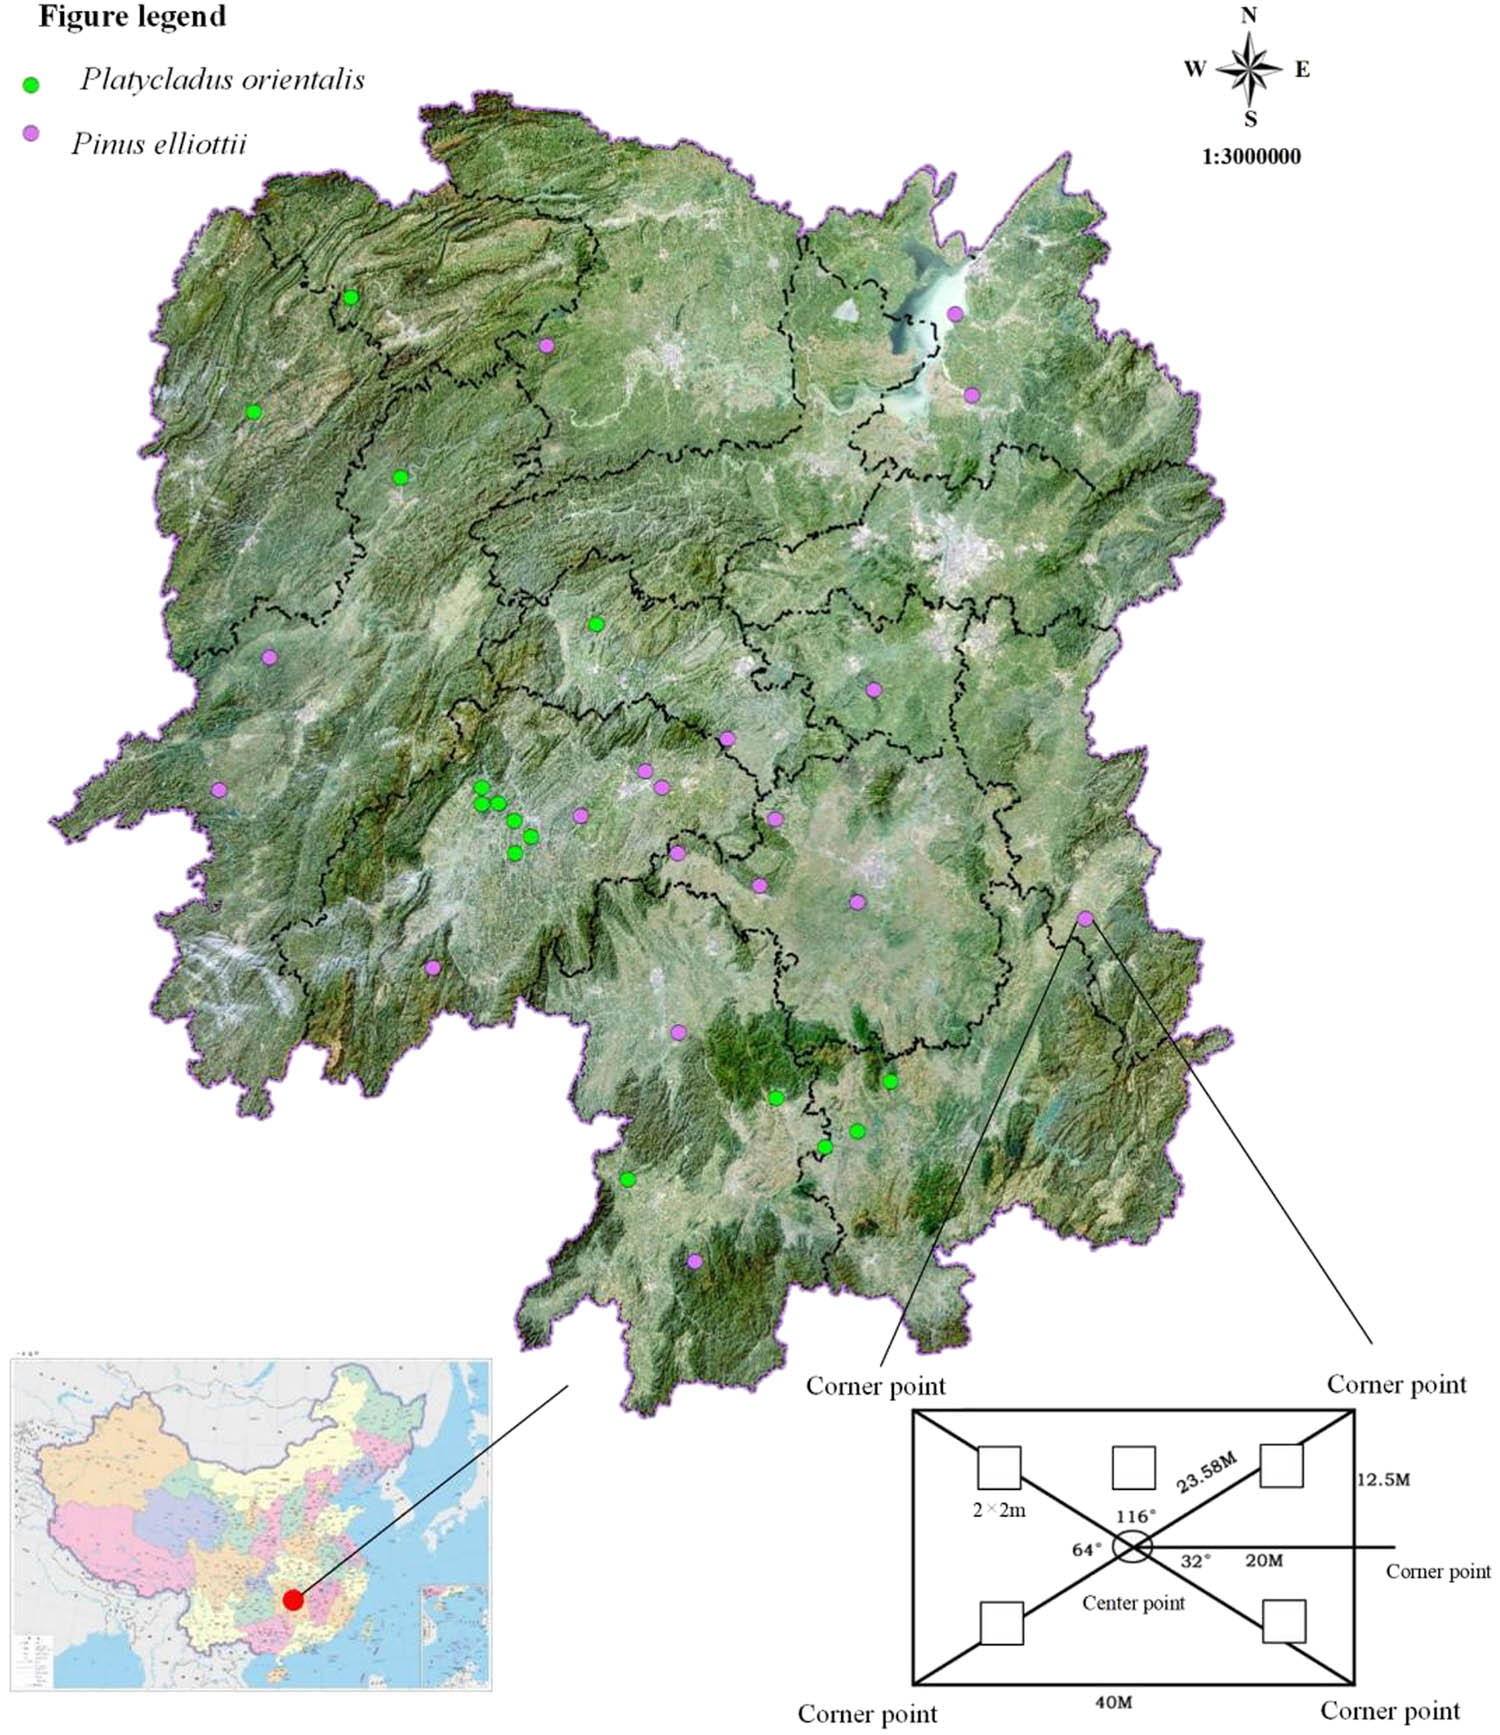
Study area and plot distribution.
2.2 Species diversity and fitting of SAD
The understory vegetation α diversity was assessed using the most commonly used diversity indices: richness, Shannon entropy, and Pielou’s evenness. SAD displayed logarithmic species abundances versus species rank to analyze types of abundance distributions. This study used five SAD modes, Brokenstick, Zipf, Log-normal, Niche preemption, and Zipf–Mandelbrot. The Zipf–Mandelbrot model fits the community structure through two parameters, beta and gamma. Gamma takes low values in highly organized systems with complex interactions among species, beta represents the potential diversity of the environment or niche diversification, taking higher values when the environment provides room for more alternatives [22]. The Akaike Information Criterion (AIC) and Bayesian Information Criterion (BIC) were used to evaluate models, and the Kolmogorov–Smirnov (K–S) test was used to test the models. The gambin model combined the γ distribution with a binomial sampling method, and a single free parameter (α) characterized the distribution shape [28]. We fitted the unimodal, bimodal, and trimodal versions of the gambin model to the diversity data, and then evaluated three models using the BIC. The analysis was conducted using the R package “vegan” and “sads.”
2.3 Species diversity and fitting of SAD
A regional species pool comprises all species available to colonize a focal site. Assessing variation in the size and composition of regional species pools is a way to include the potential influence of large-scale processes into analyses of community assembly [29]. Three models were used for predicting diversity potential in the study area: Chao [30,31], Jackknife, and Bootstrap [32]. The richness of each site was also estimated using the Chao and ACE models [30,31]. However, the probability of occurrence of each species in each site was calculated using the Beal smoothing model [33].
In the field of applied ecology, managers are often needed to predict plant communities by evaluating regional environmental types or finding species’ habitat preferences. The MRT model was used to explore the relationship between species composition and gradient of environmental factors though the R package “mvpart.” The indicator species analysis (ISA) is an effective method to determine the response of species to the environment, and is calculated according to the species distribution among groups. The indicator value indices of species were calculated, and the indicator value ranged from 0 to 1, with the higher value showing the better indicator [34]. The co-occurrence network was built to study the interactions between species based on the Jaccard similarity matrix, and different modules (species sets with high symbiotic frequency) and their internal associations were detected. The co-occurrence network analysis was conducted using the R package “igraph.”
2.4 Detection of driving factors in community construction
Dissimilarities among communities result from two different processes: turnover and nestedness [35,36]. In this study, dissimilarity coefficients were separated into turnover and nestedness components belonging to the Podani family [37]. In this study, the triple values of replacement, richness difference, and similarity corresponding to a specific point were graphically represented in a triangular graph. The envfit permutation function from the “vegan” package was used to detect significant affect factors. Subsequently, the trend curves of the selected factors were added to the canonical correspondence analysis (CCA) to analyze the species distribution pattern. The analysis helped assess important impact factors affecting the plant community.
3 Results
3.1 Fitting of SAD
A total of 159 species were identified in two communities, with 82 in P. orientalis communities and 101 in Pi. elliottii communities. The altitude of the P. orientalis and Pi. elliottii plots ranged from 190 to 476 m and from 33 to 1,450 m, respectively, the stand density ranged from 280 to 3,350 and from 350 to 4,060/hm2, respectively. The SAD fitting results of the five models are shown in Figure 2 and Table 1. The K–S test results suggested that the P value of all SAD models were below 0.05, thereby proving that the rank abundance of the communities followed both the logseries and Log-normal-like-shaped distributions. The Zipf and Zipf–Mandelbrot models had the lowest AIC and BIC indexes, indicating the best-fitting effect. The parameter of Zipf–Mandelbrot was selected for SAD analysis due to the applicability of the model parameters. For parameter 2, the P. orientalis community had the highest value (0.64), followed by the Pi. elliottii community (0.69), and the whole community had the lowest value (0.72). The results indicated that the organizational structure of the Pi. elliottii community was more balanced than that of the P. orientalis community. For parameter 3, the Pi. elliottii community had the highest value (2.96), followed by the whole community (1.34), and the P. orientalis community had the lowest value (0.35). This suggested that the dominance of the dominant species of Pi. elliottii was stronger than that of the P. orientalis community.

Fitting plots of different SAD models. (a)–(c) The whole, P. orientalis, and Pi. elliottii communities, respectively.
Fitting results of the five SAD models, parameters 1–3 represent c, gamma, and beta, respectively
| Model | M1 | M2 | M3 | M4 | M5 |
|---|---|---|---|---|---|
| Type | Whole community | ||||
| Parameter 1 | — | 0.016807 | 0.36805 | 0.063238 | 0.09347 |
| Parameter 2 | — | — | 0.7712 | −0.62369 | −0.71619 |
| Parameter 3 | — | — | — | — | 1.3424 |
| Deviance | 90.6565 | 62.2572 | 32.5307 | 10.0231 | 8.4317 |
| AIC | 465.0752 | 438.6759 | 410.9494 | 388.4418 | 388.8504 |
| BIC | 465.0752 | 441.7448 | 417.0872 | 394.5796 | 398.0571 |
| P value of K–S test | 1.06 × 10⁻¹⁰ | 1.02 × 10⁻⁹ | 1.09 × 10⁻⁹ | 4.64 × 10⁻¹² | 4.64 × 10⁻⁹ |
| Type | P. orientalis community | ||||
| Parameter 1 | — | 0.028164 | 0.29719 | 0.079832 | 0.090943 |
| Parameter 2 | — | — | 0.66489 | −0.60374 | −0.63913 |
| Parameter 3 | — | — | — | — | 0.35302 |
| Deviance | 49.9958 | 28.0698 | 16.9759 | 5.4005 | 5.3006 |
| AIC | 236.0687 | 216.1428 | 207.0488 | 195.4734 | 197.3735 |
| BIC | 236.0687 | 218.5495 | 211.8622 | 200.2868 | 204.5937 |
| P value of K–S test | 8.36 × 10⁻⁹ | 2.32 × 10⁻⁷ | 1.71 × 10⁻⁷ | 1.95 × 10⁻⁶ | 4.18 × 10⁻⁶ |
| Type | Pi. elliottii community | ||||
| Parameter 1 | — | 0.02187 | 0.35288 | 0.057734 | 0.11386 |
| Parameter 2 | — | — | 0.59455 | −0.52523 | −0.69361 |
| Parameter 3 | — | — | — | — | 2.9623 |
| Deviance | 56.4835 | 20.4808 | 12.9996 | 6.3117 | 4.5878 |
| AIC | 290.1138 | 256.1111 | 250.6299 | 243.942 | 244.2181 |
| BIC | 290.1138 | 258.7262 | 255.8602 | 249.1723 | 252.0635 |
| P value of K–S test | 3.74 × 10⁻⁸ | 9.38 × 10⁻⁷ | 9.64 × 10⁻⁸ | 1.23 × 10⁻⁹ | 2.21 × 10⁻⁶ |
Additionally, the SAD was fitted by unimodal, bimodal, and trimodal gambin models. The unimodal gambin model was found to be the best-fitting model (Table 2). The parameter α was 0.43, 0.36, and 0.93 for the whole community, P. orientalis community, and Pi. elliottii community, respectively. A higher value of α indicated a strong restriction on diffusion, making it more likely for many rare species to disappear or become extinct within the community. The higher α index of Pi. elliottii indicated the Log-normal-like SADs in this community, suggesting a weak diffusion limit in P. orientalis community and that the individuals of the community are mostly immigrants.
Fitting results of the gambin models
| Models | Whole community | P. orientalis community | Pi. elliottii community |
|---|---|---|---|
| Unimodal | 303.47 | 130.55 | 168.73 |
| Trimodal | 306.22 | 133.02 | 171.80 |
| Bimodal | 310.88 | 136.00 | 175.09 |
| α value | 0.4294 | 0.3555 | 0.9255 |
3.2 Co-occurrence network and indicator species
Three (Chao, Jackknife, and Bootstrap) models were used to estimate the richness potential of the two communities (Table 3). The richness predicted by the Chao model was the highest, followed by that predicted by the Jackknife model. The Pi. elliottii community had a bigger species pool. The probability of each species’ occurrence plot was also predicted using the Beal smoothing model (Figure S1). The co-occurrence network of the whole community is shown in Figure 3a. A total of 40 modules were detected; the modularity of the network was 0.81, indicating a close intermodule connection (Table 4).
Prediction results of the species pool
| Predicted species richness | P. orientalis community | Pi. elliottii community | ||
|---|---|---|---|---|
| Value | Variance | Value | Variance | |
| Observed species richness | 82 | — | 101 | — |
| Chao model | 381 | 144.79 | 257 | 57.66 |
| Jackknife model | 140 | 18.62 | 165 | 21.99 |
| Bootstrap model | 105 | 7.74 | 127 | 10.54 |
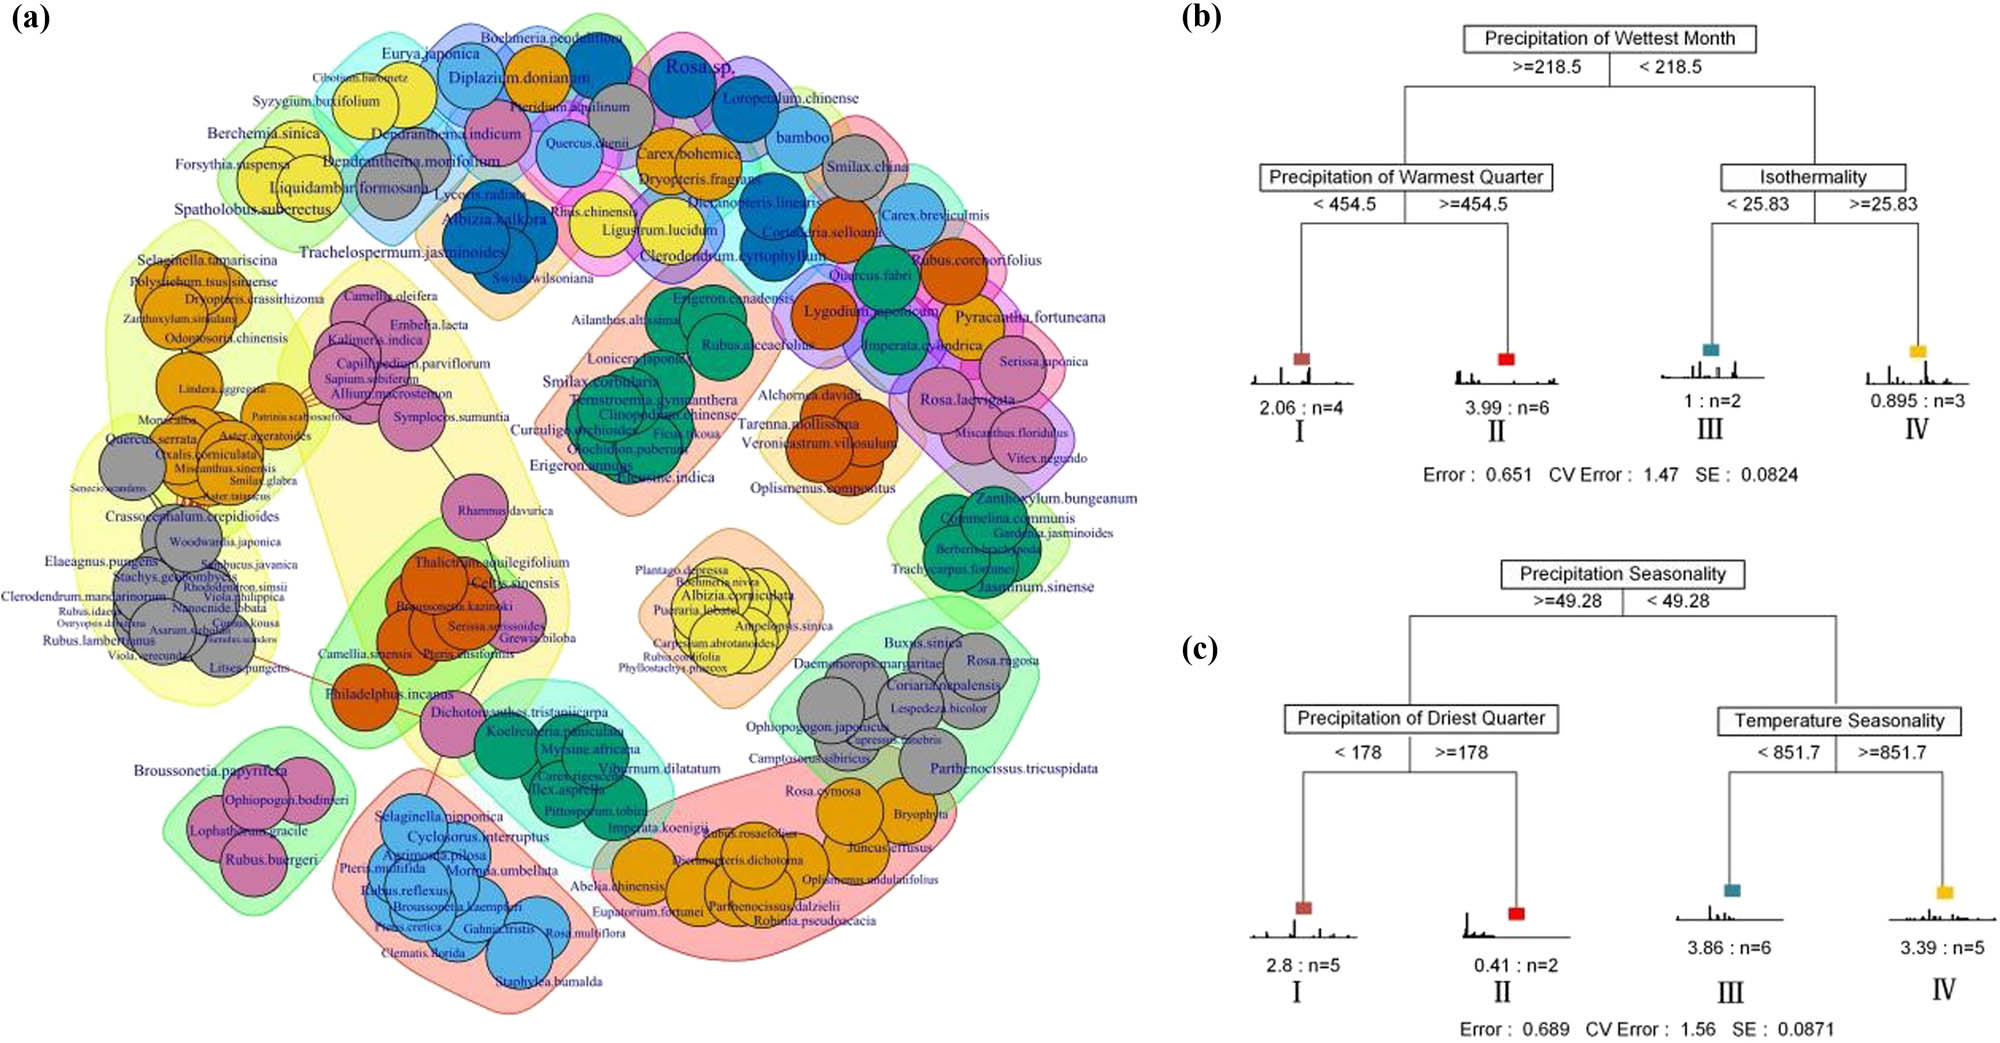
Co-occurrence network (a), and multiple regression tree for classifying P. orientalis (b)/Pi. elliottii (c). Different colors in the network represent different modules, the black line indicates the association within the module and the red line indicates the connection between the modules.
Indicator species in each subgroup
| Type | Species | Subgroup | Indicator value | P value |
|---|---|---|---|---|
| P. orientalis | Rosa laevigata | I | 0.79 | 0.036 |
| Serissa japonica | IV | 0.75 | 0.004 | |
| Juncus effusus | 1.0 | 0.002 | ||
| Oplismenus undulatifolius | 0.67 | 0.036 | ||
| Pi. elliottii | Pteridium aquilinum | I | 0.82 | 0.001 |
| Dryopteris fragrans | II | 0.94 | 0.013 | |
| Carex bohemica | 0.93 | 0.007 | ||
| Symplocos sumuntia | 0.48 | 0.048 | ||
| Ophiopogon bodinieri | 0.45 | 0.045 | ||
| Loropetalum chinense | III | 0.64 | 0.042 |
Based on the results of the MRT model, the P. orientalis and Pi. elliottii communities were divided into four subgroups using three environmental factors (Figure 3b and c). The site of the P. orientalis community was divided by precipitation of the wettest month (threshold value = 218.5 mm), followed by precipitation of the warmest quarter (threshold value = 454.5 mm), and then isothermality (threshold value = 25.83). The site of the Pi. elliottii community was divided by precipitation seasonality (threshold value = 49.28 mm), followed by precipitation of the driest quarter (threshold value = 178 mm), and then temperature seasonality (threshold value = 851.7). In the subgroups, the bars in the chart represented the distribution frequency of the species, which served as an indicator of their sensitivity to the habitat gradient. The Monte Carlo test was used to test the significance (0.05) of each species. Four species were identified as indicator species in the P. orientalis community: Rosa laevigata was identified from subgroup I, and Serissa japonica, Juncus effusus, and Oplismenus undulatifolius from subgroup IV. Six species were identified as indicator species in the Pi. elliottii community: Pteridium aquilinum was identified from subgroup I; Dryopteris fragrans, Carex bohemica, Symplocos sumuntia, and Ophiopogon bodinieri from subgroup II; and Loropetalum chinense from subgroup III (Table 5).
Envift permutation function of the whole plant community and environmental factors
| Factor | CCA1 | CCA2 | r 2 | P (>r) |
|---|---|---|---|---|
| Stand density | 0.90814 | −0.41866 | 0.0893 | 0.259 |
| Altitude | −0.87534 | −0.4835 | 0.1585 | 0.117 |
| Tree coverage | 0.20138 | −0.97951 | 0.2734 | 0.014 |
| Bio 1 | 0.98241 | 0.18671 | 0.2144 | 0.074 |
| Bio 2 | 0.9496 | −0.31346 | 0.0655 | 0.408 |
| Bio 3 | 0.39917 | −0.91688 | 0.1192 | 0.174 |
| Bio 4 | 0.40891 | 0.91258 | 0.1292 | 0.16 |
| Bio 5 | 0.92058 | 0.39056 | 0.1343 | 0.146 |
| Bio 6 | 0.99812 | −0.06129 | 0.2137 | 0.059 |
| Bio 7 | 0.57383 | 0.81898 | 0.0858 | 0.301 |
| Bio 8 | 0.9664 | 0.25703 | 0.3993 | 0.007 |
| Bio 9 | 0.90533 | −0.42471 | 0.0587 | 0.487 |
| Bio 10 | 0.90813 | 0.41869 | 0.1784 | 0.095 |
| Bio 11 | 0.99999 | −0.00333 | 0.273 | 0.029 |
| Bio 12 | −0.02045 | −0.99979 | 0.0704 | 0.364 |
| Bio 13 | 0.47377 | −0.88065 | 0.1411 | 0.128 |
| Bio 14 | −0.88446 | −0.46661 | 0.0505 | 0.505 |
| Bio 15 | 0.93792 | −0.34685 | 0.0964 | 0.252 |
| Bio 16 | 0.41508 | −0.90978 | 0.1336 | 0.128 |
| Bio 17 | −0.96026 | −0.2791 | 0.0987 | 0.256 |
| Bio 18 | 0.83912 | −0.54395 | 0.0224 | 0.731 |
| Bio 19 | −0.76197 | −0.64761 | 0.0663 | 0.404 |
The bold values indicated the significant of 0.05%.
3.3 Distribution pattern of α and β diversities
The regression between the two diversity indexes of the whole community and altitude is presented in Figure 4a. The diversity index increased with a rise in the altitude, and then decreased. The regression between the diversity index and the latitude showed a wavy curve (Figure 4b).

Variation in the diversity index along the altitude (a) and latitude (b) gradients.
The linear regression between the β diversity and environmental/geographic distance showed that the species composition of the P. orientalis community showed a positive correlation with the environmental/geographic distance, indicating that both neutral effect and habitat filtering influenced the community establishment. The species composition of Pi. elliottii showed a negative correlation with the geographic distance and a positive correlation with the environmental distance, indicating that habitat filtering affected the community establishment (Figure 5).

Variation in β diversity with environmental (yellow)/geographic distance (blue). (a) and (b) P. orientalis community; (c) and (d) Pi. elliottii community.
The β diversity was further partitioned into total replacement diversity and total richness difference diversity. The results indicated that the turnover processes dominated the dissimilarity of these community compositions. The turnover processes accounted for 33.7, 29.8, and 29.2% (community) of β diversity in the whole, P. orientalis, and Pi. elliottii communities, respectively. The nestedness had a low proportion of 13.5, 18.4, and 18.9% in the whole, P. orientalis, and Pi. elliottii communities, respectively. In triangular plots (Figure 6a–c), each point represented a pair of plots. Its position was determined by a triplet of values from the similarity, turnover, and nestedness matrixes. The graphs in the figure show that most of the points were distributed along the left edge. Additionally, the mean points along the turnover axis were more than 0.5 (0.674, 0.651, and 0.654). This indicated that the among-site variation was dominated by turnover, confirming the aforementioned values.

Triangular plots of the relationships among the pairs of plots and CCA analysis. (a–c) Triangular plots of the whole, P. orientalis, and Pi. elliottii communities, respectively. The large central dot in triangular plots is the centroid of the points, and the smaller dots represent the mean values of the similarity, turnover, and nestedness components. (d) CCA analysis of the whole community; red, green, and blue lines represent the trend curve of tree coverage, mean temperature of the wettest quarter, and mean temperature of the coldest quarter, respectively.
The assessment of environmental factors on the whole plant community (Table 6) revealed that the tree coverage (r 2 = 0.27, P < 0.05), mean temperature of the wettest quarter (Bio8, i 2 = 0.40, P < 0.05), and mean temperature of the coldest quarter (Bio11, r 2 = 0.27, P < 0.05) were the important factors affecting the distribution pattern of plants. Then, the trend curves of the three factors were added into the CCA analysis (Figure 6d). These species had significant distribution patterns; some species, such as Ternstroemia gymnanthera, Smilax corbularia, Erigeron annuus, and Ficus tikoua, were distributed in the highly similar habitats.
Envift permutation function of the whole plant community and environmental factors
| Factor | CCA1 | CCA2 | r 2 | P (>r) |
|---|---|---|---|---|
| Stand density | 0.90814 | −0.41866 | 0.0893 | 0.259 |
| Altitude | −0.87534 | −0.4835 | 0.1585 | 0.117 |
| Tree coverage | 0.20138 | −0.97951 | 0.2734 | 0.014 |
| Bio 1 | 0.98241 | 0.18671 | 0.2144 | 0.074 |
| Bio 2 | 0.9496 | −0.31346 | 0.0655 | 0.408 |
| Bio 3 | 0.39917 | −0.91688 | 0.1192 | 0.174 |
| Bio 4 | 0.40891 | 0.91258 | 0.1292 | 0.16 |
| Bio 5 | 0.92058 | 0.39056 | 0.1343 | 0.146 |
| Bio 6 | 0.99812 | −0.06129 | 0.2137 | 0.059 |
| Bio 7 | 0.57383 | 0.81898 | 0.0858 | 0.301 |
| Bio 8 | 0.9664 | 0.25703 | 0.3993 | 0.007 |
| Bio 9 | 0.90533 | −0.42471 | 0.0587 | 0.487 |
| Bio 10 | 0.90813 | 0.41869 | 0.1784 | 0.095 |
| Bio 11 | 0.99999 | −0.00333 | 0.273 | 0.029 |
| Bio 12 | −0.02045 | −0.99979 | 0.0704 | 0.364 |
| Bio 13 | 0.47377 | −0.88065 | 0.1411 | 0.128 |
| Bio 14 | −0.88446 | −0.46661 | 0.0505 | 0.505 |
| Bio 15 | 0.93792 | −0.34685 | 0.0964 | 0.252 |
| Bio 16 | 0.41508 | −0.90978 | 0.1336 | 0.128 |
| Bio 17 | −0.96026 | −0.2791 | 0.0987 | 0.256 |
| Bio 18 | 0.83912 | −0.54395 | 0.0224 | 0.731 |
| Bio 19 | −0.76197 | −0.64761 | 0.0663 | 0.404 |
4 Discussion
In this study, five SAD models were all accepted in both P. orientalis and Pi. elliottii shrub communities, indicating that different ecological processes coexisted and were not mutually exclusive. Most previous studies of SAD fitting focused on finding the best‐fitting model or tested a particular theory or model [38,39]. The fitting analysis of various models had great significance in assessing how different SAD properties changed across ecological gradients [26,27]. The different SAD models indicated that the two communities were homogeneous with a long history. The fitting results indicated that the SAD followed multiple rules, indicating that the community formation was affected by both random and deterministic processes [40,41]. The Zipf–Mandelbrot model was selected as the best-fitting model, which support hypotheses about underlying processes linking the requirements of various species with probabilities of encountering optimal growth conditions in the environment [40], indicating that deterministic processes may dominate. The comparison of two parameters indicated that the P. orientalis community had an unstable structure compared with the Pi. elliottii community, indicating that the Pi. elliottii understory community was easier to restore to the original state under disturbance. Compared with the Pi. elliottii community, the frequent immigration events led to a complex structure with a large number of rare species in P. orientalis community, indicating that the communities were in the stage of restoration succession, and niche overlap were common in these communities. We speculated that the reason was that the P. orientalis community had limited resources and space caused by the high resource requirements of the species, which was strongly resistant to drought, cold, diseases, and long lifespans [42]. The Pi. elliottii community can support more individuals, reducing the competitive interactions among species requiring a similar resource [43].
In this study, the understory communities of P. orientalis and Pi. elliottii across different scales (α and β) were integrated for the first time to fully understand the influence of pure P. orientalis and Pi. elliottii afforestation. The distribution pattern of two α indexes showed a unimodal curve along with altitude, consistent with the intermediate disturbance hypothesis and the niche-assembly hypothesis [44–46]. However, the irregular wave curve of α index could be attributed to the complex terrain of the study area, which was dominated by mountains and hills; these results were similar to those of other studies [47–49]. Environmental filtering and neutral processes often occur simultaneously and play different roles in different scale and ecosystem types [50,51]. Neutral processes may be dominant in species-rich communities, while environmental filtering may be dominant in communities with relatively few species (such as temperate forests) [52,53]. The linear regression between the β diversity and environmental/geographic distance indicated different construction mechanisms between P. orientalis and Pi. elliottii understory vegetation diversity. The understory vegetation of Pi. elliottii tended to be dominated by habitat filter, while that of P. orientalis tended to be dominated by both neutral processes and habitat filter. Species diffusion is one of the main stochastic processes, which is often measured by geographic distance [54]. The mantel test results indicated more frequent species diffusion events in P. orientalis communities. The partition of β diversity indicated that both communities were dominated by turnover processes, which were caused by environmental classification or spatial constraints. This suggested that maintaining habitat heterogeneity was essential in improving the understory vegetation diversity of pure P. orientalis and Pi. elliottii [55].
Previous studies showed that the turnover components often were dominant under natural conditions. Nestedness components appeared to be more evident in habitats with strong anthropogenic disturbance or habitats with considerable differences in species richness, such as island habitats [56–58]. In this study area, the ecological forest was protected and the forest management activities were strictly restricted, which might be one of the reasons for the spatial turnover dominance in β diversity.
5 Conclusions
This study reported the biodiversity patterns of the pure P. orientalis and Pi. elliottii understory vegetation communities in Central and Southern China for the first time. Five models were used to fit the SAD, which revealed its ecological process. MRT and ISA identified the domain factors and indicator species of each community. The analysis of β diversity indicated the different construction mechanisms between P. orientalis and Pi. elliottii understory vegetation diversity. Both communities were dominated by the turnover process, which reflected their formation history. Nevertheless, this study helped to understand the ecological process of diversity maintenance in the P. orientalis and Pi. elliottii understory vegetation communities, verifying the protective effect of ecological forest policy and thus providing theoretical guidance in the restoration process of the shrub diversity.
Acknowledgements
The authors wish to thank anonymous reviewers for their constructive reviews.
-
Funding information: This study was supported by the program: characteristics of spatial structure and effects on leaf functional traits in low-efficiency forests of Masson pine (Pinus massoniana) (XLKY202210) and Evaluation of ecological condition and carbon neutral contribution strategy of state-owned forest farms in Hunan Province (BH2022A005).
-
Author contributions: Research conceptualization: Y.X.T. and N.D.; methodology and analysis: Q.A.S.; and writing and editing: N.D. and C.X.L. All authors have read and agreed to the published version of the manuscript.
-
Conflict of interest: Authors state no conflict of interest.
-
Data availability statement: The datasets generated during and/or analyzed during the current study are available from the corresponding author on reasonable request.
References
[1] Hoang NT, Kanemoto K. Mapping the deforestation footprint of nations reveals growing threat to tropical forests. Nat Ecol Evolution. 2021;5:845–53.10.1038/s41559-021-01417-zSearch in Google Scholar PubMed
[2] FAO U. N. Global Forest Resources Assessment 2015: How Are the World’s Forests Changing?. Rome: FAO Interdepartmental Working Group; 2016.Search in Google Scholar
[3] Qin Y, Xiao XM, Dong JW, Zhang Y, Wu XC, Shimabukuro EY, et al. Improved estimates of forest cover and loss in the Brazilian Amazon in 2000–2017. Nat Sustain. 2019;2:764–72.10.1038/s41893-019-0336-9Search in Google Scholar
[4] Sabatini FM, Burrascano S, Keeton WS, Levers C, Lindner M, Pötzschner F, et al. Where are Europe’s last primary forests? Divers Distrib. 2018;24:1426–39.10.1111/ddi.12778Search in Google Scholar
[5] Giam XL. Global biodiversity loss from tropical deforestation. Proc Natl Acad Sci USA. 2017;114:5775–7.10.1073/pnas.1706264114Search in Google Scholar PubMed PubMed Central
[6] D’Almeida C, Vörösmarty CJ, Hurtt GC, Marengo JA, Dingman SL, Keim BD. The effects of deforestation on the hydrological cycle in Amazonia: a review on scale and resolution. Int J Climatol. 2007;27:633–47.10.1002/joc.1475Search in Google Scholar
[7] Houghton RA. The annual net flux of carbon to the atmosphere from changes in land use 1850–1990*. Tellus B. 1999;51:298–313.10.1034/j.1600-0889.1999.00013.xSearch in Google Scholar
[8] Fan BM, Dong Y. Percentage of forest cover in different historic periods of China. J Beijing For Univ. 2001;23:60–5.Search in Google Scholar
[9] Li X, Li Y, Zhang J, Peng S, Chen Y, Cao Y. The effects of forest thinning on understory diversity in China: a meta‐analysis. Land Degrad Dev. 2020;31:1225–40.10.1002/ldr.3540Search in Google Scholar
[10] Zhou L, Cai L, He Z, Wang R, Wu P, Ma X. Thinning increases understory diversity and biomass, and improves soil properties without decreasing growth of Chinese fir in southern China. Environ Sci Pollut Res Int. 2016;23:24135–50.10.1007/s11356-016-7624-ySearch in Google Scholar PubMed
[11] Zhou X, Zhu HG, Wen YG, Goodale UM, Li XQ, You YM, et al. Effects of understory management on trade-offs and synergies between biomass carbon stock, plant diversity and timber production in eucalyptus plantations. For Ecol Manag. 2017;410:164–73.10.1016/j.foreco.2017.11.015Search in Google Scholar
[12] Wen Y, Ye D, Chen F, Liu SR, Liang HW. The changes of understory plant diversity in continuous cropping system of Eucalyptus plantations, South China. J For Res. 2010;15:252–8.10.1007/s10310-010-0179-8Search in Google Scholar
[13] Perino A, Pereira HM, Navarro LM, Fernández N, Bullock JM, Ceaușu S, et al. Rewilding complex ecosystems. Science. 2019;364:eaav5570.10.1126/science.aav5570Search in Google Scholar PubMed
[14] Monaco TA, Gunnell KL. Understory vegetation change following woodland reduction varies by plant community type and seeding status: a region-wide assessment of ecological benefits and risks. Plants. 2020;9:1113.10.3390/plants9091113Search in Google Scholar PubMed PubMed Central
[15] Eldridge DJ, Bowker MA, Maestre FT, Roger E, Reynolds JF, Whitford WG. Impacts of shrub encroachment on ecosystem structure and functioning: towards a global synthesis. Ecol Lett. 2011;14:709–22.10.1111/j.1461-0248.2011.01630.xSearch in Google Scholar PubMed PubMed Central
[16] Davies KW, Bates JD, Boyd CS. Postwildfire seeding to restore native vegetation and limit exotic annuals: an evaluation in juniper-dominated sagebrush steppe. Restor Ecol. 2019;27:120–7.10.1111/rec.12848Search in Google Scholar
[17] Farzan S, Young DJN, Dedrick AG, Hamilton M, Porse EC, Coates PS, et al. Western juniper management: assessing strategies for improving greater sage-grouse habitat and rangeland productivity. Environ Manag. 2015;56:675–83.10.1007/s00267-015-0521-1Search in Google Scholar PubMed PubMed Central
[18] Miller RF, Ratchford J, Roundy BA, Tausch RJ, Hulet A, Chambers J. Response of conifer-encroached shrublands in the Great Basin to prescribed fire and mechanical treatments. Rangel Ecol Manag. 2014;67:468–81.10.2111/REM-D-13-00003.1Search in Google Scholar
[19] Jin Y, Liu C, Qian SS, Luo Y, Zhou R, Tang J, et al. Large-scale patterns of understory biomass and its allocation across China’s forests. Sci Total Environ. 2022;804:150169.10.1016/j.scitotenv.2021.150169Search in Google Scholar PubMed
[20] Landuyt D, De Lombaerde E, Perring MP, Hertzog LR, Ampoorter E, Maes SL, et al. The functional role of temperate forest understory vegetation in a changing world. Global Change Biol. 2019;25:3625–41.10.1111/gcb.14756Search in Google Scholar PubMed
[21] Zhang YX, Liu TR, Guo JP, Tan ZJ, Dong W, Wang HH. Changes in the understory diversity of secondary Pinus tabulaeformis forests are the result of stand density and soil properties. Global Ecol Conserv. 2021;28:e01628.10.1016/j.gecco.2021.e01628Search in Google Scholar
[22] Spatharis S, Tsirtsis G. Zipf–Mandelbrot model behavior in marine eutrophication: two way fitting on field and simulated phytoplankton assemblages. Hydrobiologia. 2013;714:191–9.10.1007/s10750-013-1536-3Search in Google Scholar
[23] Mason NWH, de Bello F. Functional diversity: a tool for answering challenging ecological questions. J Veg Sci. 2013;24:777–80.10.1111/jvs.12097Search in Google Scholar
[24] Wang C, Cheng H, Wang S, Mei W, Du DL. Plant community and the influence of plant taxonomic diversity on community stability and invasibility: a case study based on Solidago canadensis L. Sci Total Environ. 2021;768:144518.10.1016/j.scitotenv.2020.144518Search in Google Scholar PubMed
[25] Qiao X, Geng Y, Zhang C, Han Z, Zhang Z, Zhao X, et al. Spatial asynchrony matters more than alpha stability in stabilizing ecosystem productivity in a large temperate forest region. Global Ecol Biogeogr. 2022;31:1133–46.10.1111/geb.13488Search in Google Scholar
[26] Matthews TJ, Borges PAV, de Azevedo EB, Whittaker RJ. A biogeographical perspective on species abundance distributions: recent advances and opportunities for future research. J Biogeogr. 2017;44:1705–10.10.1111/jbi.13008Search in Google Scholar
[27] Ulrich W, Kusumoto B, Shiono T, Kubota Y. Climatic and geographic correlates of global forest tree species–abundance distributions and community evenness. J Veg Sci. 2016;27:295–305.10.1111/jvs.12346Search in Google Scholar
[28] Ugland KI, Lambshead PJD, McGill B, Gray JS, O’Dea N, Ladle RJ, et al. Modelling dimensionality in species abundance distributions: description and evaluation of the Gambin model. Evol Ecol Res. 2007;9:313–24.Search in Google Scholar
[29] Cornell HV, Harrison SP. What are species pools and when are they important? Annu Rev Ecol Evol Syst. 2014;45:45–57.10.1146/annurev-ecolsys-120213-091759Search in Google Scholar
[30] Chiu CH, Wang YT, Walther BA, Chao A. An improved nonparametric lower bound of species richness via a modified Good-Turing frequency formula. Biometrics. 2014;70:671–82.10.1111/biom.12200Search in Google Scholar PubMed
[31] Chao A. Estimating the population size for capture-recapture data with unequal catchability. Biometrics. 1987;43:783–91.10.2307/2531532Search in Google Scholar
[32] Smith EP, Belle GV. Nonparametric estimation of species richness. Biometrics. 1984;40:119–29.10.2307/2530750Search in Google Scholar
[33] De Cáceres M, Legendre P, Valencia R, Cao M, Chang L, Chuyong G, et al. The variation of tree beta-diversity across a global network of forest plots. Global Ecol Biogeogr. 2012;21:1191–202.10.1111/j.1466-8238.2012.00770.xSearch in Google Scholar
[34] Cacere MD, Legendre P, Moretti M. Improving indicator species analysis by combining groups of sites. Oikos. 2010;42:679–98.Search in Google Scholar
[35] Lennon JJ, Koleff P, Greenwood JJD, Gaston KJ. The geographical structure of British bird distributions: diversity, spatial turnover and scale. J Anim Ecol. 2001;70:966–79.10.1046/j.0021-8790.2001.00563.xSearch in Google Scholar
[36] Harrison S, Ross SJ, Lawton JH. Beta-diversity on geographic gradients in Britain. J Anim Ecol. 1992;61:151–8.10.2307/5518Search in Google Scholar
[37] Legendre P. Interpreting the replacement and richness difference components of beta diversity. Global Ecol Biogeogr. 2014;23:1324–34. 10.1111/geb.12207 Search in Google Scholar
[38] Ulrich W, Ollik M, Ugland KI. A meta-analysis of species-abundance distributions. Oikos. 2010;119:1149–55.10.1111/j.1600-0706.2009.18236.xSearch in Google Scholar
[39] Igor V, Banavar JR, Hubbell SP, Martian A. Neutral theory and relative species abundance in ecology. Nature. 2003;424:1035–7.10.1038/nature01883Search in Google Scholar PubMed
[40] Barange M, Campos B. Models of species abundance: a critique of and an alternative to the dynamics model. Mar Ecol Prog Ser. 1991;69:293–8.10.3354/meps069293Search in Google Scholar
[41] MacArthur RH. On the relative abundance of bird species. Proc Natl Acad Sci USA. 1957;43:293–5.10.1073/pnas.43.3.293Search in Google Scholar PubMed PubMed Central
[42] Chang EM, Tian YX, Wang CY, Deng N, Jiang ZP, Liu CX. Exploring the Phylogeography of ancient Platycladus orientalis in China by specific-locus amplified fragment sequencing. Int J Mol Sci. 2019;20:3871.10.3390/ijms20163871Search in Google Scholar PubMed PubMed Central
[43] Weiher E, Freund D, Bunton T, Stefanski A, Lee T, Bentivenga S. Advances, challenges and a developing synthesis of ecological community assembly theory. Philos Trans R Soc Lond. 2011;366:2403–13.10.1098/rstb.2011.0056Search in Google Scholar PubMed PubMed Central
[44] Mayor SJ, Cahill JF Jr, He F, Solymos P, Boutin S. Regional boreal biodiversity peaks at intermediate human disturbance. Nat Commun. 2012;3:1142.10.1038/ncomms2145Search in Google Scholar PubMed
[45] Oommen MA, Shanker K. Elevational species richness patterns emerge from multiple local mechanisms in Himalayan woody plants. Ecology. 2005;86:3039–47.10.1890/04-1837Search in Google Scholar
[46] Connell J. Diversity in tropical rain forests and coral reefs-high diversity of trees and corals is maintained only in a non-equilibrium state. Science. 1978;199:1302–10.10.1126/science.199.4335.1302Search in Google Scholar PubMed
[47] Deng N, Song Q, Ma F, Tian Y. Patterns and driving factors of diversity in the shrub community in Central and Southern China. Forests. 2022;13:1090.10.3390/f13071090Search in Google Scholar
[48] Syfert M, Brummitt N, Coomes D, Bystriakova N, Smith M. Inferring diversity patterns along an elevation gradient from stacked SDMs: a case study on Mesoamerican ferns. Environ Earth Sci. 2018;16:e00433.10.1016/j.gecco.2018.e00433Search in Google Scholar
[49] Zhang J, Zhang M, Mian R. Effects of elevation and disturbance gradients on forest diversity in the Wulingshan Nature Reserve, North China. Environ Earth Sci. 2016;75:904.10.1007/s12665-016-5734-ySearch in Google Scholar
[50] Tuomisto H, Ruokolainen K, Yli-Halla M. Dispersal, environment, and floristic variation of western Amazonian forests. Science. 2003;299:241–44.10.1126/science.1078037Search in Google Scholar PubMed
[51] Legendre P, Gallagher ED. Ecologically meaningful transformations for ordination of species data. Oecologia. 2001;129:271–80.10.1007/s004420100716Search in Google Scholar PubMed
[52] Chave J. Neutral theory and community ecology. Ecol Lett. 2004;7:241–53.10.1111/j.1461-0248.2003.00566.xSearch in Google Scholar
[53] Tilman D. Niche tradeoffs, neutrality, and community structure: a stochastic theory of resource competition, invasion, and community assembly. Proc Natl Acad Sci. 2004;101:10854–61.10.1073/pnas.0403458101Search in Google Scholar PubMed PubMed Central
[54] Blundo C, González-Espinosa M, Malizia LR. Relative contribution of niche and neutral processes on tree species turnover across scales in seasonal forests of NW Argentina. Plant Ecol. 2016;217:359–68.10.1007/s11258-016-0577-xSearch in Google Scholar
[55] Zheng J, Arif M, He XR, Liu XL, Li CX. Distinguishing the mechanisms driving multifaceted plant diversity in subtropical reservoir riparian zones. Front Plant Sci. 2023;14:1138368.10.3389/fpls.2023.1138368Search in Google Scholar PubMed PubMed Central
[56] Leprieur F, Tedesco P, Hugueny B, Beauchard O, Dürr H, Brosse S, et al. Partitioning global patterns of freshwater fish beta diversity reveals contrasting signatures of past climate changes. Ecol Lett. 2011;14:325–34.10.1111/j.1461-0248.2011.01589.xSearch in Google Scholar PubMed
[57] Si X, Baselga A, Ding P, Machado RB. Revealing betadiversity patterns of breeding bird and lizard communities on inundated land-bridge islands by separating the turnover and nestedness components. PLoS One. 2015;10:e0127692.10.1371/journal.pone.0127692Search in Google Scholar PubMed PubMed Central
[58] Gutiérrez-Cánovas C, Millán A, Velasco J, Vaughan IP, Ormerod SJ. Contrasting effects of natural and anthropogenic stressors on beta diversity in river organisms. Global Ecol Biogeogr. 2013;22:796–805.10.1111/geb.12060Search in Google Scholar
© 2023 the author(s), published by De Gruyter
This work is licensed under the Creative Commons Attribution 4.0 International License.
Articles in the same Issue
- Biomedical Sciences
- Systemic investigation of inetetamab in combination with small molecules to treat HER2-overexpressing breast and gastric cancers
- Immunosuppressive treatment for idiopathic membranous nephropathy: An updated network meta-analysis
- Identifying two pathogenic variants in a patient with pigmented paravenous retinochoroidal atrophy
- Effects of phytoestrogens combined with cold stress on sperm parameters and testicular proteomics in rats
- A case of pulmonary embolism with bad warfarin anticoagulant effects caused by E. coli infection
- Neutrophilia with subclinical Cushing’s disease: A case report and literature review
- Isoimperatorin alleviates lipopolysaccharide-induced periodontitis by downregulating ERK1/2 and NF-κB pathways
- Immunoregulation of synovial macrophages for the treatment of osteoarthritis
- Novel CPLANE1 c.8948dupT (p.P2984Tfs*7) variant in a child patient with Joubert syndrome
- Antiphospholipid antibodies and the risk of thrombosis in myeloproliferative neoplasms
- Immunological responses of septic rats to combination therapy with thymosin α1 and vitamin C
- High glucose and high lipid induced mitochondrial dysfunction in JEG-3 cells through oxidative stress
- Pharmacological inhibition of the ubiquitin-specific protease 8 effectively suppresses glioblastoma cell growth
- Levocarnitine regulates the growth of angiotensin II-induced myocardial fibrosis cells via TIMP-1
- Age-related changes in peripheral T-cell subpopulations in elderly individuals: An observational study
- Single-cell transcription analysis reveals the tumor origin and heterogeneity of human bilateral renal clear cell carcinoma
- Identification of iron metabolism-related genes as diagnostic signatures in sepsis by blood transcriptomic analysis
- Long noncoding RNA ACART knockdown decreases 3T3-L1 preadipocyte proliferation and differentiation
- Surgery, adjuvant immunotherapy plus chemotherapy and radiotherapy for primary malignant melanoma of the parotid gland (PGMM): A case report
- Dosimetry comparison with helical tomotherapy, volumetric modulated arc therapy, and intensity-modulated radiotherapy for grade II gliomas: A single‑institution case series
- Soy isoflavone reduces LPS-induced acute lung injury via increasing aquaporin 1 and aquaporin 5 in rats
- Refractory hypokalemia with sexual dysplasia and infertility caused by 17α-hydroxylase deficiency and triple X syndrome: A case report
- Meta-analysis of cancer risk among end stage renal disease undergoing maintenance dialysis
- 6-Phosphogluconate dehydrogenase inhibition arrests growth and induces apoptosis in gastric cancer via AMPK activation and oxidative stress
- Experimental study on the optimization of ANM33 release in foam cells
- Primary retroperitoneal angiosarcoma: A case report
- Metabolomic analysis-identified 2-hydroxybutyric acid might be a key metabolite of severe preeclampsia
- Malignant pleural effusion diagnosis and therapy
- Effect of spaceflight on the phenotype and proteome of Escherichia coli
- Comparison of immunotherapy combined with stereotactic radiotherapy and targeted therapy for patients with brain metastases: A systemic review and meta-analysis
- Activation of hypermethylated P2RY1 mitigates gastric cancer by promoting apoptosis and inhibiting proliferation
- Association between the VEGFR-2 -604T/C polymorphism (rs2071559) and type 2 diabetic retinopathy
- The role of IL-31 and IL-34 in the diagnosis and treatment of chronic periodontitis
- Triple-negative mouse breast cancer initiating cells show high expression of beta1 integrin and increased malignant features
- mNGS facilitates the accurate diagnosis and antibiotic treatment of suspicious critical CNS infection in real practice: A retrospective study
- The apatinib and pemetrexed combination has antitumor and antiangiogenic effects against NSCLC
- Radiotherapy for primary thyroid adenoid cystic carcinoma
- Design and functional preliminary investigation of recombinant antigen EgG1Y162–EgG1Y162 against Echinococcus granulosus
- Effects of losartan in patients with NAFLD: A meta-analysis of randomized controlled trial
- Bibliometric analysis of METTL3: Current perspectives, highlights, and trending topics
- Performance comparison of three scaling algorithms in NMR-based metabolomics analysis
- PI3K/AKT/mTOR pathway and its related molecules participate in PROK1 silence-induced anti-tumor effects on pancreatic cancer
- The altered expression of cytoskeletal and synaptic remodeling proteins during epilepsy
- Effects of pegylated recombinant human granulocyte colony-stimulating factor on lymphocytes and white blood cells of patients with malignant tumor
- Prostatitis as initial manifestation of Chlamydia psittaci pneumonia diagnosed by metagenome next-generation sequencing: A case report
- NUDT21 relieves sevoflurane-induced neurological damage in rats by down-regulating LIMK2
- Association of interleukin-10 rs1800896, rs1800872, and interleukin-6 rs1800795 polymorphisms with squamous cell carcinoma risk: A meta-analysis
- Exosomal HBV-DNA for diagnosis and treatment monitoring of chronic hepatitis B
- Shear stress leads to the dysfunction of endothelial cells through the Cav-1-mediated KLF2/eNOS/ERK signaling pathway under physiological conditions
- Interaction between the PI3K/AKT pathway and mitochondrial autophagy in macrophages and the leukocyte count in rats with LPS-induced pulmonary infection
- Meta-analysis of the rs231775 locus polymorphism in the CTLA-4 gene and the susceptibility to Graves’ disease in children
- Cloning, subcellular localization and expression of phosphate transporter gene HvPT6 of hulless barley
- Coptisine mitigates diabetic nephropathy via repressing the NRLP3 inflammasome
- Significant elevated CXCL14 and decreased IL-39 levels in patients with tuberculosis
- Whole-exome sequencing applications in prenatal diagnosis of fetal bowel dilatation
- Gemella morbillorum infective endocarditis: A case report and literature review
- An unusual ectopic thymoma clonal evolution analysis: A case report
- Severe cumulative skin toxicity during toripalimab combined with vemurafenib following toripalimab alone
- Detection of V. vulnificus septic shock with ARDS using mNGS
- Novel rare genetic variants of familial and sporadic pulmonary atresia identified by whole-exome sequencing
- The influence and mechanistic action of sperm DNA fragmentation index on the outcomes of assisted reproduction technology
- Novel compound heterozygous mutations in TELO2 in an infant with You-Hoover-Fong syndrome: A case report and literature review
- ctDNA as a prognostic biomarker in resectable CLM: Systematic review and meta-analysis
- Diagnosis of primary amoebic meningoencephalitis by metagenomic next-generation sequencing: A case report
- Phylogenetic analysis of promoter regions of human Dolichol kinase (DOLK) and orthologous genes using bioinformatics tools
- Collagen changes in rabbit conjunctiva after conjunctival crosslinking
- Effects of NM23 transfection of human gastric carcinoma cells in mice
- Oral nifedipine and phytosterol, intravenous nicardipine, and oral nifedipine only: Three-arm, retrospective, cohort study for management of severe preeclampsia
- Case report of hepatic retiform hemangioendothelioma: A rare tumor treated with ultrasound-guided microwave ablation
- Curcumin induces apoptosis in human hepatocellular carcinoma cells by decreasing the expression of STAT3/VEGF/HIF-1α signaling
- Rare presentation of double-clonal Waldenström macroglobulinemia with pulmonary embolism: A case report
- Giant duplication of the transverse colon in an adult: A case report and literature review
- Ectopic thyroid tissue in the breast: A case report
- SDR16C5 promotes proliferation and migration and inhibits apoptosis in pancreatic cancer
- Vaginal metastasis from breast cancer: A case report
- Screening of the best time window for MSC transplantation to treat acute myocardial infarction with SDF-1α antibody-loaded targeted ultrasonic microbubbles: An in vivo study in miniswine
- Inhibition of TAZ impairs the migration ability of melanoma cells
- Molecular complexity analysis of the diagnosis of Gitelman syndrome in China
- Effects of maternal calcium and protein intake on the development and bone metabolism of offspring mice
- Identification of winter wheat pests and diseases based on improved convolutional neural network
- Ultra-multiplex PCR technique to guide treatment of Aspergillus-infected aortic valve prostheses
- Virtual high-throughput screening: Potential inhibitors targeting aminopeptidase N (CD13) and PIKfyve for SARS-CoV-2
- Immune checkpoint inhibitors in cancer patients with COVID-19
- Utility of methylene blue mixed with autologous blood in preoperative localization of pulmonary nodules and masses
- Integrated analysis of the microbiome and transcriptome in stomach adenocarcinoma
- Berberine suppressed sarcopenia insulin resistance through SIRT1-mediated mitophagy
- DUSP2 inhibits the progression of lupus nephritis in mice by regulating the STAT3 pathway
- Lung abscess by Fusobacterium nucleatum and Streptococcus spp. co-infection by mNGS: A case series
- Genetic alterations of KRAS and TP53 in intrahepatic cholangiocarcinoma associated with poor prognosis
- Granulomatous polyangiitis involving the fourth ventricle: Report of a rare case and a literature review
- Studying infant mortality: A demographic analysis based on data mining models
- Metaplastic breast carcinoma with osseous differentiation: A report of a rare case and literature review
- Protein Z modulates the metastasis of lung adenocarcinoma cells
- Inhibition of pyroptosis and apoptosis by capsaicin protects against LPS-induced acute kidney injury through TRPV1/UCP2 axis in vitro
- TAK-242, a toll-like receptor 4 antagonist, against brain injury by alleviates autophagy and inflammation in rats
- Primary mediastinum Ewing’s sarcoma with pleural effusion: A case report and literature review
- Association of ADRB2 gene polymorphisms and intestinal microbiota in Chinese Han adolescents
- Tanshinone IIA alleviates chondrocyte apoptosis and extracellular matrix degeneration by inhibiting ferroptosis
- Study on the cytokines related to SARS-Cov-2 in testicular cells and the interaction network between cells based on scRNA-seq data
- Effect of periostin on bone metabolic and autophagy factors during tooth eruption in mice
- HP1 induces ferroptosis of renal tubular epithelial cells through NRF2 pathway in diabetic nephropathy
- Intravaginal estrogen management in postmenopausal patients with vaginal squamous intraepithelial lesions along with CO2 laser ablation: A retrospective study
- Hepatocellular carcinoma cell differentiation trajectory predicts immunotherapy, potential therapeutic drugs, and prognosis of patients
- Effects of physical exercise on biomarkers of oxidative stress in healthy subjects: A meta-analysis of randomized controlled trials
- Identification of lysosome-related genes in connection with prognosis and immune cell infiltration for drug candidates in head and neck cancer
- Development of an instrument-free and low-cost ELISA dot-blot test to detect antibodies against SARS-CoV-2
- Research progress on gas signal molecular therapy for Parkinson’s disease
- Adiponectin inhibits TGF-β1-induced skin fibroblast proliferation and phenotype transformation via the p38 MAPK signaling pathway
- The G protein-coupled receptor-related gene signatures for predicting prognosis and immunotherapy response in bladder urothelial carcinoma
- α-Fetoprotein contributes to the malignant biological properties of AFP-producing gastric cancer
- CXCL12/CXCR4/CXCR7 axis in placenta tissues of patients with placenta previa
- Association between thyroid stimulating hormone levels and papillary thyroid cancer risk: A meta-analysis
- Significance of sTREM-1 and sST2 combined diagnosis for sepsis detection and prognosis prediction
- Diagnostic value of serum neuroactive substances in the acute exacerbation of chronic obstructive pulmonary disease complicated with depression
- Research progress of AMP-activated protein kinase and cardiac aging
- TRIM29 knockdown prevented the colon cancer progression through decreasing the ubiquitination levels of KRT5
- Cross-talk between gut microbiota and liver steatosis: Complications and therapeutic target
- Metastasis from small cell lung cancer to ovary: A case report
- The early diagnosis and pathogenic mechanisms of sepsis-related acute kidney injury
- The effect of NK cell therapy on sepsis secondary to lung cancer: A case report
- Erianin alleviates collagen-induced arthritis in mice by inhibiting Th17 cell differentiation
- Loss of ACOX1 in clear cell renal cell carcinoma and its correlation with clinical features
- Signalling pathways in the osteogenic differentiation of periodontal ligament stem cells
- Crosstalk between lactic acid and immune regulation and its value in the diagnosis and treatment of liver failure
- Clinicopathological features and differential diagnosis of gastric pleomorphic giant cell carcinoma
- Traumatic brain injury and rTMS-ERPs: Case report and literature review
- Extracellular fibrin promotes non-small cell lung cancer progression through integrin β1/PTEN/AKT signaling
- Knockdown of DLK4 inhibits non-small cell lung cancer tumor growth by downregulating CKS2
- The co-expression pattern of VEGFR-2 with indicators related to proliferation, apoptosis, and differentiation of anagen hair follicles
- Inflammation-related signaling pathways in tendinopathy
- CD4+ T cell count in HIV/TB co-infection and co-occurrence with HL: Case report and literature review
- Clinical analysis of severe Chlamydia psittaci pneumonia: Case series study
- Bioinformatics analysis to identify potential biomarkers for the pulmonary artery hypertension associated with the basement membrane
- Influence of MTHFR polymorphism, alone or in combination with smoking and alcohol consumption, on cancer susceptibility
- Catharanthus roseus (L.) G. Don counteracts the ampicillin resistance in multiple antibiotic-resistant Staphylococcus aureus by downregulation of PBP2a synthesis
- Combination of a bronchogenic cyst in the thoracic spinal canal with chronic myelocytic leukemia
- Bacterial lipoprotein plays an important role in the macrophage autophagy and apoptosis induced by Salmonella typhimurium and Staphylococcus aureus
- TCL1A+ B cells predict prognosis in triple-negative breast cancer through integrative analysis of single-cell and bulk transcriptomic data
- Ezrin promotes esophageal squamous cell carcinoma progression via the Hippo signaling pathway
- Ferroptosis: A potential target of macrophages in plaque vulnerability
- Predicting pediatric Crohn's disease based on six mRNA-constructed risk signature using comprehensive bioinformatic approaches
- Applications of genetic code expansion and photosensitive UAAs in studying membrane proteins
- HK2 contributes to the proliferation, migration, and invasion of diffuse large B-cell lymphoma cells by enhancing the ERK1/2 signaling pathway
- IL-17 in osteoarthritis: A narrative review
- Circadian cycle and neuroinflammation
- Probiotic management and inflammatory factors as a novel treatment in cirrhosis: A systematic review and meta-analysis
- Hemorrhagic meningioma with pulmonary metastasis: Case report and literature review
- SPOP regulates the expression profiles and alternative splicing events in human hepatocytes
- Knockdown of SETD5 inhibited glycolysis and tumor growth in gastric cancer cells by down-regulating Akt signaling pathway
- PTX3 promotes IVIG resistance-induced endothelial injury in Kawasaki disease by regulating the NF-κB pathway
- Pancreatic ectopic thyroid tissue: A case report and analysis of literature
- The prognostic impact of body mass index on female breast cancer patients in underdeveloped regions of northern China differs by menopause status and tumor molecular subtype
- Report on a case of liver-originating malignant melanoma of unknown primary
- Case report: Herbal treatment of neutropenic enterocolitis after chemotherapy for breast cancer
- The fibroblast growth factor–Klotho axis at molecular level
- Characterization of amiodarone action on currents in hERG-T618 gain-of-function mutations
- A case report of diagnosis and dynamic monitoring of Listeria monocytogenes meningitis with NGS
- Effect of autologous platelet-rich plasma on new bone formation and viability of a Marburg bone graft
- Small breast epithelial mucin as a useful prognostic marker for breast cancer patients
- Continuous non-adherent culture promotes transdifferentiation of human adipose-derived stem cells into retinal lineage
- Nrf3 alleviates oxidative stress and promotes the survival of colon cancer cells by activating AKT/BCL-2 signal pathway
- Favorable response to surufatinib in a patient with necrolytic migratory erythema: A case report
- Case report of atypical undernutrition of hypoproteinemia type
- Down-regulation of COL1A1 inhibits tumor-associated fibroblast activation and mediates matrix remodeling in the tumor microenvironment of breast cancer
- Sarcoma protein kinase inhibition alleviates liver fibrosis by promoting hepatic stellate cells ferroptosis
- Research progress of serum eosinophil in chronic obstructive pulmonary disease and asthma
- Clinicopathological characteristics of co-existing or mixed colorectal cancer and neuroendocrine tumor: Report of five cases
- Role of menopausal hormone therapy in the prevention of postmenopausal osteoporosis
- Precisional detection of lymph node metastasis using tFCM in colorectal cancer
- Advances in diagnosis and treatment of perimenopausal syndrome
- A study of forensic genetics: ITO index distribution and kinship judgment between two individuals
- Acute lupus pneumonitis resembling miliary tuberculosis: A case-based review
- Plasma levels of CD36 and glutathione as biomarkers for ruptured intracranial aneurysm
- Fractalkine modulates pulmonary angiogenesis and tube formation by modulating CX3CR1 and growth factors in PVECs
- Novel risk prediction models for deep vein thrombosis after thoracotomy and thoracoscopic lung cancer resections, involving coagulation and immune function
- Exploring the diagnostic markers of essential tremor: A study based on machine learning algorithms
- Evaluation of effects of small-incision approach treatment on proximal tibia fracture by deep learning algorithm-based magnetic resonance imaging
- An online diagnosis method for cancer lesions based on intelligent imaging analysis
- Medical imaging in rheumatoid arthritis: A review on deep learning approach
- Predictive analytics in smart healthcare for child mortality prediction using a machine learning approach
- Utility of neutrophil–lymphocyte ratio and platelet–lymphocyte ratio in predicting acute-on-chronic liver failure survival
- A biomedical decision support system for meta-analysis of bilateral upper-limb training in stroke patients with hemiplegia
- TNF-α and IL-8 levels are positively correlated with hypobaric hypoxic pulmonary hypertension and pulmonary vascular remodeling in rats
- Stochastic gradient descent optimisation for convolutional neural network for medical image segmentation
- Comparison of the prognostic value of four different critical illness scores in patients with sepsis-induced coagulopathy
- Application and teaching of computer molecular simulation embedded technology and artificial intelligence in drug research and development
- Hepatobiliary surgery based on intelligent image segmentation technology
- Value of brain injury-related indicators based on neural network in the diagnosis of neonatal hypoxic-ischemic encephalopathy
- Analysis of early diagnosis methods for asymmetric dementia in brain MR images based on genetic medical technology
- Early diagnosis for the onset of peri-implantitis based on artificial neural network
- Clinical significance of the detection of serum IgG4 and IgG4/IgG ratio in patients with thyroid-associated ophthalmopathy
- Forecast of pain degree of lumbar disc herniation based on back propagation neural network
- SPA-UNet: A liver tumor segmentation network based on fused multi-scale features
- Systematic evaluation of clinical efficacy of CYP1B1 gene polymorphism in EGFR mutant non-small cell lung cancer observed by medical image
- Rehabilitation effect of intelligent rehabilitation training system on hemiplegic limb spasms after stroke
- A novel approach for minimising anti-aliasing effects in EEG data acquisition
- ErbB4 promotes M2 activation of macrophages in idiopathic pulmonary fibrosis
- Clinical role of CYP1B1 gene polymorphism in prediction of postoperative chemotherapy efficacy in NSCLC based on individualized health model
- Lung nodule segmentation via semi-residual multi-resolution neural networks
- Evaluation of brain nerve function in ICU patients with Delirium by deep learning algorithm-based resting state MRI
- A data mining technique for detecting malignant mesothelioma cancer using multiple regression analysis
- Markov model combined with MR diffusion tensor imaging for predicting the onset of Alzheimer’s disease
- Effectiveness of the treatment of depression associated with cancer and neuroimaging changes in depression-related brain regions in patients treated with the mediator-deuterium acupuncture method
- Molecular mechanism of colorectal cancer and screening of molecular markers based on bioinformatics analysis
- Monitoring and evaluation of anesthesia depth status data based on neuroscience
- Exploring the conformational dynamics and thermodynamics of EGFR S768I and G719X + S768I mutations in non-small cell lung cancer: An in silico approaches
- Optimised feature selection-driven convolutional neural network using gray level co-occurrence matrix for detection of cervical cancer
- Incidence of different pressure patterns of spinal cerebellar ataxia and analysis of imaging and genetic diagnosis
- Pathogenic bacteria and treatment resistance in older cardiovascular disease patients with lung infection and risk prediction model
- Adoption value of support vector machine algorithm-based computed tomography imaging in the diagnosis of secondary pulmonary fungal infections in patients with malignant hematological disorders
- From slides to insights: Harnessing deep learning for prognostic survival prediction in human colorectal cancer histology
- Ecology and Environmental Science
- Monitoring of hourly carbon dioxide concentration under different land use types in arid ecosystem
- Comparing the differences of prokaryotic microbial community between pit walls and bottom from Chinese liquor revealed by 16S rRNA gene sequencing
- Effects of cadmium stress on fruits germination and growth of two herbage species
- Bamboo charcoal affects soil properties and bacterial community in tea plantations
- Optimization of biogas potential using kinetic models, response surface methodology, and instrumental evidence for biodegradation of tannery fleshings during anaerobic digestion
- Understory vegetation diversity patterns of Platycladus orientalis and Pinus elliottii communities in Central and Southern China
- Studies on macrofungi diversity and discovery of new species of Abortiporus from Baotianman World Biosphere Reserve
- Food Science
- Effect of berrycactus fruit (Myrtillocactus geometrizans) on glutamate, glutamine, and GABA levels in the frontal cortex of rats fed with a high-fat diet
- Guesstimate of thymoquinone diversity in Nigella sativa L. genotypes and elite varieties collected from Indian states using HPTLC technique
- Analysis of bacterial community structure of Fuzhuan tea with different processing techniques
- Untargeted metabolomics reveals sour jujube kernel benefiting the nutritional value and flavor of Morchella esculenta
- Mycobiota in Slovak wine grapes: A case study from the small Carpathians wine region
- Elemental analysis of Fadogia ancylantha leaves used as a nutraceutical in Mashonaland West Province, Zimbabwe
- Microbiological transglutaminase: Biotechnological application in the food industry
- Influence of solvent-free extraction of fish oil from catfish (Clarias magur) heads using a Taguchi orthogonal array design: A qualitative and quantitative approach
- Chromatographic analysis of the chemical composition and anticancer activities of Curcuma longa extract cultivated in Palestine
- The potential for the use of leghemoglobin and plant ferritin as sources of iron
- Investigating the association between dietary patterns and glycemic control among children and adolescents with T1DM
- Bioengineering and Biotechnology
- Biocompatibility and osteointegration capability of β-TCP manufactured by stereolithography 3D printing: In vitro study
- Clinical characteristics and the prognosis of diabetic foot in Tibet: A single center, retrospective study
- Agriculture
- Biofertilizer and NPSB fertilizer application effects on nodulation and productivity of common bean (Phaseolus vulgaris L.) at Sodo Zuria, Southern Ethiopia
- On correlation between canopy vegetation and growth indexes of maize varieties with different nitrogen efficiencies
- Exopolysaccharides from Pseudomonas tolaasii inhibit the growth of Pleurotus ostreatus mycelia
- A transcriptomic evaluation of the mechanism of programmed cell death of the replaceable bud in Chinese chestnut
- Melatonin enhances salt tolerance in sorghum by modulating photosynthetic performance, osmoregulation, antioxidant defense, and ion homeostasis
- Effects of plant density on alfalfa (Medicago sativa L.) seed yield in western Heilongjiang areas
- Identification of rice leaf diseases and deficiency disorders using a novel DeepBatch technique
- Artificial intelligence and internet of things oriented sustainable precision farming: Towards modern agriculture
- Animal Sciences
- Effect of ketogenic diet on exercise tolerance and transcriptome of gastrocnemius in mice
- Combined analysis of mRNA–miRNA from testis tissue in Tibetan sheep with different FecB genotypes
- Isolation, identification, and drug resistance of a partially isolated bacterium from the gill of Siniperca chuatsi
- Tracking behavioral changes of confined sows from the first mating to the third parity
- The sequencing of the key genes and end products in the TLR4 signaling pathway from the kidney of Rana dybowskii exposed to Aeromonas hydrophila
- Development of a new candidate vaccine against piglet diarrhea caused by Escherichia coli
- Plant Sciences
- Crown and diameter structure of pure Pinus massoniana Lamb. forest in Hunan province, China
- Genetic evaluation and germplasm identification analysis on ITS2, trnL-F, and psbA-trnH of alfalfa varieties germplasm resources
- Tissue culture and rapid propagation technology for Gentiana rhodantha
- Effects of cadmium on the synthesis of active ingredients in Salvia miltiorrhiza
- Cloning and expression analysis of VrNAC13 gene in mung bean
- Chlorate-induced molecular floral transition revealed by transcriptomes
- Effects of warming and drought on growth and development of soybean in Hailun region
- Effects of different light conditions on transient expression and biomass in Nicotiana benthamiana leaves
- Comparative analysis of the rhizosphere microbiome and medicinally active ingredients of Atractylodes lancea from different geographical origins
- Distinguish Dianthus species or varieties based on chloroplast genomes
- Comparative transcriptomes reveal molecular mechanisms of apple blossoms of different tolerance genotypes to chilling injury
- Study on fresh processing key technology and quality influence of Cut Ophiopogonis Radix based on multi-index evaluation
- An advanced approach for fig leaf disease detection and classification: Leveraging image processing and enhanced support vector machine methodology
- Erratum
- Erratum to “Protein Z modulates the metastasis of lung adenocarcinoma cells”
- Erratum to “BRCA1 subcellular localization regulated by PI3K signaling pathway in triple-negative breast cancer MDA-MB-231 cells and hormone-sensitive T47D cells”
- Retraction
- Retraction to “Protocatechuic acid attenuates cerebral aneurysm formation and progression by inhibiting TNF-alpha/Nrf-2/NF-kB-mediated inflammatory mechanisms in experimental rats”