Identification of rice leaf diseases and deficiency disorders using a novel DeepBatch technique
-
Mayuri Sharma
 ,
Jyotismita Talukdar
,
Jyotismita Talukdar

Abstract
Rice is one of the most widely consumed foods all over the world. Various diseases and deficiency disorders impact the rice crop’s growth, thereby hampering the rice yield. Therefore, proper crop monitoring is very important for the early diagnosis of diseases or deficiency disorders. Diagnosis of diseases and disorders requires specialized manpower, which is not scalable and accessible to all farmers. To address this issue, machine learning and deep learning (DL)-driven automated systems are designed, which may help the farmers in diagnosing disease/deficiency disorders in crops so that proper care can be taken on time. Various studies have used transfer learning (TL) models in the recent past. In recent studies, further improvement in rice disease and deficiency disorder diagnosis system performance is achieved by performing the ensemble of various TL models. However, in all these DL-based studies, the segmentation of the region of interest is not done beforehand and the infected-region extraction is left for the DL model to handle automatically. Therefore, this article proposes a novel framework for the diagnosis of rice-infected leaves based on DL-based segmentation with bitwise logical AND operation and DL-based classification. The rice diseases covered in this study are bacterial leaf blight, brown spot, and leaf smut. The rice nutrient deficiencies like nitrogen (N), phosphorous (P), and potassium (K) were also included. The results of the experiment conducted on these datasets showed that the performance of DeepBatch was significantly improved as compared to the conventional technique.
1 Introduction
The world’s population is growing day by day and will tend to increase at higher rates in the near future. The world's population has increased from 2.5 to 7.7 billion between 1950 and 2019. According to the 2019 UN report, it is predicted that the world’s population would increase by 10, 26, and 42% in the periods of 2019–2030, 2019–2050, and 2019–2100, respectively. The growing population will lead to higher food consumption which in turn will increase food demand and require supply. Asia, the world’s largest continent, relies heavily on rice as its staple food. Between 1961 and 2019, the world’s rice production increased from 215 to 755 million tonnes. Global rice yield increased from 1.86 to 4.66 tonnes per hectare between 1961 and 2019 [1,2,3]. As the population has grown, so have the rice production and its yield. In this manner, the rate of growth in rice yield and production must be sustained over the subsequent decades so that poverty, hunger, undernourishment, food security, etc., do not reach the critical point of failure. However, disease and nutrient deficiency disorders in rice plants act as hindrances to rice growth and yield. Numerous catastrophic diseases that affect rice plants are caused by fungi, bacteria, viruses, and lack of nutrients. Some of the common diseases and nutrient deficiencies in rice plants are shown in Figure 1. Bacterial leaf blight (BLB) disease alone can cause up to 50% yield losses worldwide. Rice yields can also be significantly impacted by some diseases like brown spot (BS) and leaf smut (LSm). One of the most common diseases affecting rice is BS, caused by Drechsleraoryzae. BS lesions are often curved, brown in color, and surrounded by a yellow rim. There had previously been evidence of up to 90% of yield losses, which contributed to the Bengal Famine during the 1940s. In Asia, the disease causes yield reductions between 6 and 90% [4,5]. Another disease found in the rice plant is Lsm, which is caused by Entylomaoryzae. This disease causes small, darkened patches on the undersides of the leaves. Since it does not significantly reduce the yield, it is regarded as a minor disease. However, severe LSm accelerates the drying of the leaves prematurely, so this disease cannot be ignored. In addition, rice plants also suffer from disorders due to deficiencies of macro/micronutrients like nitrogen (N), phosphorous (P), potassium (K), calcium (Ca), and magnesium (Mg). Rice crops with low NPK levels are investigated more. Lack of P and K in rice crops causes stunted root growth, drought, restricts photosynthesis and makes the plant more susceptible to diseases.
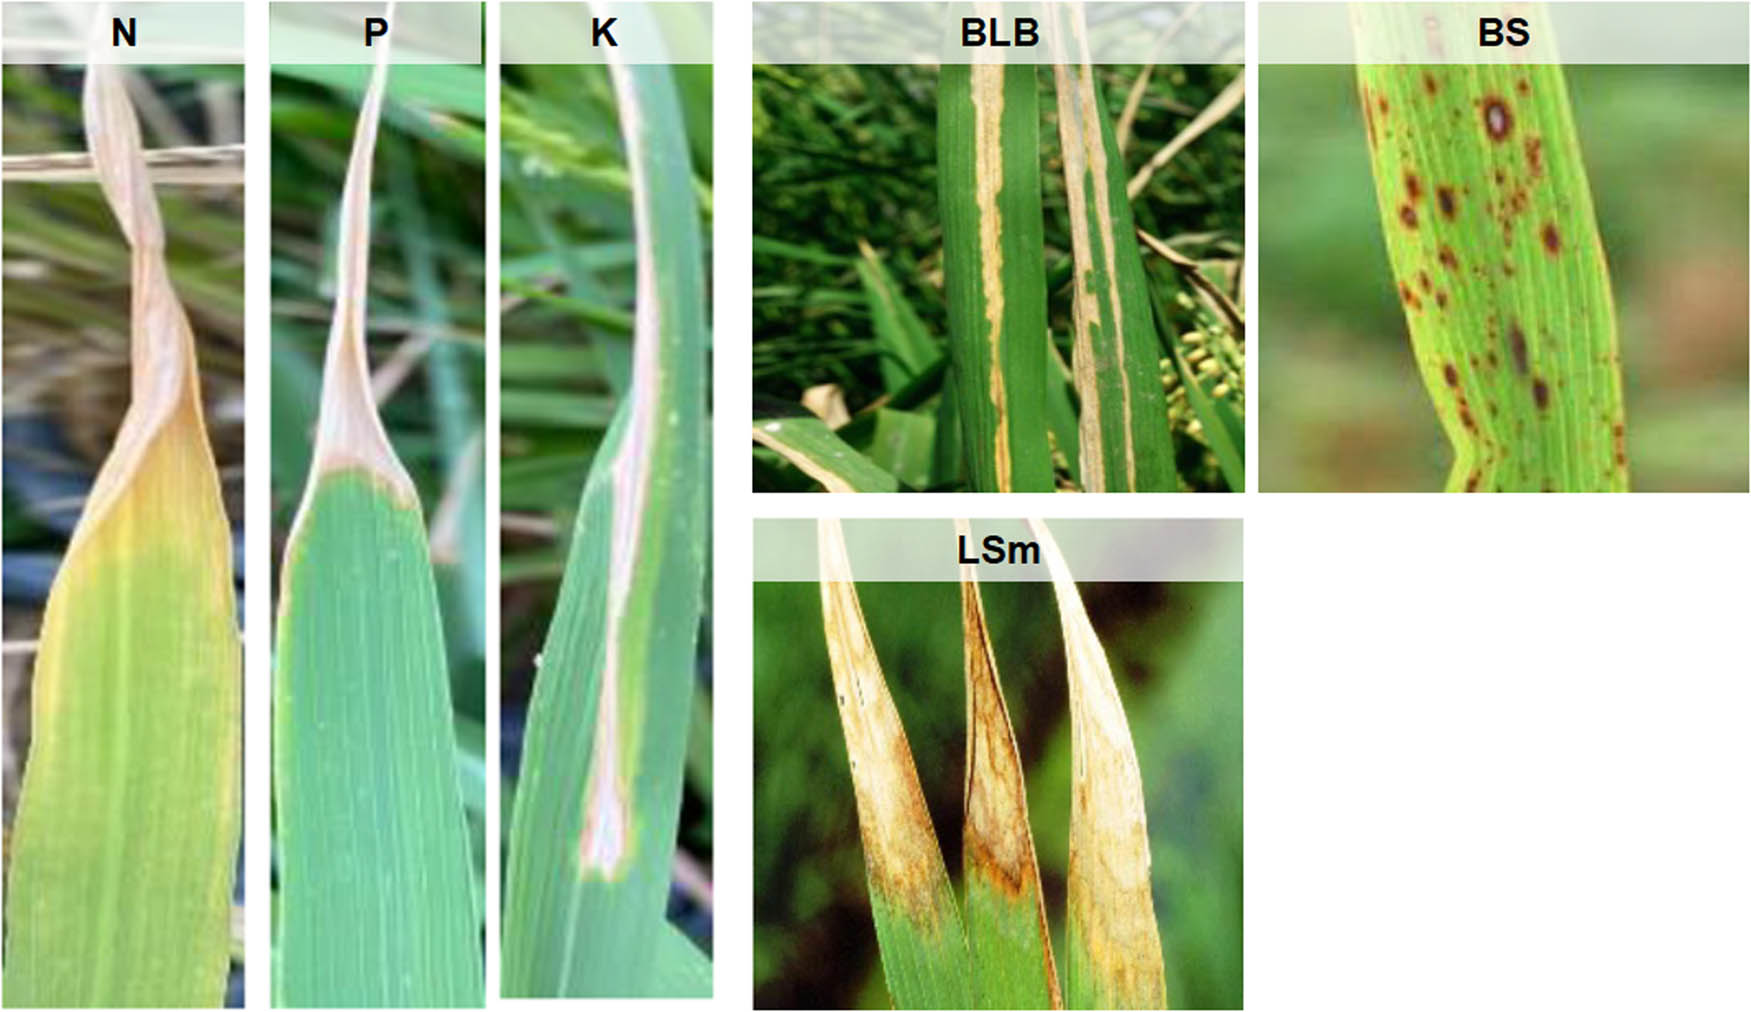
Some common diseases and nutrient deficiency disorders found in rice plants.
N deficiency reduces the protein and chlorophyll content of rice, lowers yields, and slows the growth of crops [6]. Furthermore, it is now simpler to access and analyze data on these specific contaminations. This is because there is already a lot of data on these common contaminations found in rice crops [1,7,8]. This study, therefore, provides a diagnosis of the three common diseases (BLB, BS, and LSm) and three common nutrient deficiencies (N, P, and K) found in rice plants.
A diagnostic method is necessary for the early detection of rice disease, which can reduce the likelihood of crop loss and increase productivity. The conventional intervention for controlling rice diseases like chemical control, biological control, etc., must be carried out before the plants become adversely affected, which can be accomplished by carefully monitoring the crop. Therefore, there is a need for effective solutions, which can be used to preserve rice growth and yield from diseases and pests [5,8,9]. One such solution is precision agriculture, which essentially involves the application of advanced technology, software tools, and intelligent embedded devices in agriculture. To better regulate and enhance farming practices, the data collected from the deployed sensors are processed and analyzed using machine learning (ML) and deep learning (DL) algorithms. Recently, ML has emerged as a useful technique for the early diagnosis of rice diseases and deficiency disorders. Most research on rice disease diagnosis using RGB images of rice leaves focuses either on classifying disease classes or segmenting the region of interest (ROI). With enormous data, rice disease diagnosis can be done without physical examination of defects in all plants in a dispersed farm. The implementation of ML with IoT tools spread interest in the research for the development of computer systems to assist farmers. For the analysis of rice diseases, computer systems using technologies, viz. spectroscopy based on reflectance, electrical, Fourier transform, and chlorophyll fluorescence, have already proven useful for rice disease diagnosis. Traditional ML models like support vector machines (SVMs), self-organizing models, decision trees, neural networks (NN), clustering techniques, and thresholding are used for infected area segmentation, rice disease classification, and disease recognition. The diagnosis accuracies of these models have been improved by the implementation of DL and ensemble learning models [10,11,12].
In recent days, transfer learning (TL) models are becoming more prominent [13,14,15,16,17]. When tested on field data of 24 rice diseases, VGG16 and GoogleNet accurately predicted the diseases with accuracy rates of 91–92% [18]. TL models such as InceptionV3, EfficientNet, and VGG19 made an accurate prediction in the range of 94–96.08% on a smaller number of rice diseases [16,18,19,20,21]. The use of Mask RCNN on six on-field disease images improved the rice disease diagnostic accuracy of Faster RCNN (70.96%), which was further boosted to 79.19% by Yolov3. Faster RCNN made an 85.4% accurate prediction using only 3 on-field rice diseases, while Mask RCNN boosted this prediction accuracy by 2.05% [22,23,24,25]. With the help of CNN’s super-resolution and classification layers, a dataset on rice disease that was compiled through online and field research showed a disease prediction accuracy of 93.257% [26]. Diagnostic accuracy on public or on-field datasets, or a mix of both, ranged from 94.07 to 98.63% when the inception module was included in TL models like DenseNet and MobileNet. DNN optimized by the Jaya optimization algorithm (DNN_JOA) and the big bang–big crunch–CNN are some more hybrid models [12,27,28]. The recognition accuracy of TL models would increase if high-quality data are provided. Therefore, enhancement of the rice leaf disease image data based on GAN and super-resolution is also given importance to obtain high-quality data [25,29]. The development of ML approaches led to the use of ensemble learning for crop disease diagnosis prediction, locating nutrients, and determining crop yield [8,30,31]. The best result for diagnosing six rice diseases in rice plants using ensemble voting applied to DL-based models was 91%. SegNet segmentation followed by RideSpider Water Wave-based Deep Recurrent Neural Network (Deep RNN) was found to detect rice diseases with the highest accuracy of 90.5% [28].
The commonly used detection method for nutrient deficiency disorder in rice leaves is the regression model. Various color and vegetation indices were computed using color channels. The nitrogen status of a particular rice cultivar was assessed using the Kawashima index where the coefficient of determination between the derived indices and the reference soil plant analysis development (SPAD) value was 0.56. It is also crucial to remember that in a few investigations incorporating nitrogen, chlorophyll SPAD values were the objective variable rather than nutritional content [32,33]. The normalized difference index, canopy cover, and raw values from the red channel were used as inputs in the model for the estimation of the nitrogen state in rice. The coefficient of determination between the proposed model and the nitrogen accumulation ranged from 0.75 to 0.83 [34]. In order to estimate the nitrogen content of a single rice variety, normalized green and red channels were obtained from RGB images and sent as inputs to a quadratic model, with an average prediction accuracy of 75% [35]. When image features including G−R, G + R, and canopy cover were employed separately to build exponential models for nitrogen content in two rice varieties, the coefficient of determination was found in the range of 0.90–0.95 [36]. Eleven different nutrient deficiency disorders in rice plant leaves were detected using pre-trained CNN models, of which NasNet-large and DenseNet121 had the highest detection accuracy of 97.44 and 96.25%, respectively [37]. Pre-trained CNN models were merged with SVM to predict four levels of N insufficiency in rice with the best result being 99.84% [38].With the best prediction result of 100%, ensemble averaging of TL models diagnosed the nutritional deficiencies in rice plants. The same work was tested using a weighted-average ensemble of TL models, which gave an accuracy of 98.33% [8,39].
Figure 2 shows the various DL frameworks used in rice disease/deficiency disorder classification using image data. From the literature, it is obvious that DL-based algorithms outperform traditional ML algorithms in the case of rice disease diagnostic systems.

DL framework applied in rice disease classification using image data.
In our previous studies [5,8,40], we built diagnostic systems with various ML/DL techniques. We used various feature selection techniques as well as the ensembling of various classifiers to increase the performance of the system designed. However, effective segmentation may further improve the performance of such DL-based models. Therefore, we propose a DeepBatch (DL-based) diagnostic system where infected rice regions will be extracted and will be fetched to a DL-based classifier.
The main goal of this work is to assist the agricultural expert with a second opinion for the analysis of rice images infected due to the presence of pathogens and nutrient deficiencies to improve the diagnosis. Effective segmentation of the contaminated area in rice leaves can improve the performance of the classification system while constructing a rice disease and deficiency disorder diagnosis system. The current method for designing the diagnostic system has a segmentation module which is based on dilated convolutions and a pre-trained model followed by a TL-based classification module.
2 Methodology
The DeepBatch presented in this work consists mainly of two modules, and both are designed using various DL architectures. Together, these architectures can enable precise segmentation and classification of rice-infected leaf images. The flowchart of the complete system for rice disease and deficiency disorder diagnosis is shown in Figure 3.

Flowchart of the complete system for disease and deficiency disorder diagnosis in rice leaves.
The datasets used in this study were retrieved from the Kaggle repository [38] and UCI ML [41] repository. The images of the input rice disease and deficiency disorders were resized and enhanced. In order to label the infected areas of the images, ground truth masks were created. After creating annotations and extracting masks of the rice leaf images, a dataset was created in the ratio of 70:30 for performing the segmentation of rice diseases. Then DL segmentation architectures were applied to this newly created dataset. The segmentation method was assessed using the following metrics: dice loss, dice coefficient, accuracy, precision, and recall.
The infected portion, omitting the background and the healthy leaf region, was obtained by bitwise multiplying the RGB images and their corresponding predicted masks. Once the segmentation was completed, the properly segmented images were considered for the classification process. The 60 and 20% occurrences of the outputs of the bitwise multiplication were used for training and validation for each classification algorithm, respectively. The remaining 20% of the instances were utilized during testing. TL architectural ensembles (binary, ternary, quaternary, and pentanary) were also proposed, and their results include the infected region’s class and the classifiers’ performance scores.
2.1 Data preparation
2.1.1 Image acquisition
We selected two datasets that were sizable enough to offer useful information but not so large that it becomes difficult to annotate contaminated areas. The datasets include the relevant nutrient deficiencies like N, P, and K as well as rice diseases, including BLB, BS, and LSm. Moreover, we were looking for a dataset that could be easily accessed, either through a public repository or by directly contacting the owner of the data. Therefore, the Kaggle and UCI ML datasets were chosen.
As far as law or ethics are concerned, the selected datasets may be used for research purposes without restriction. The acquired dataset contains 120 diseased rice leaf images, which include BLB, BS, and LSm varieties. The images’ resolutions vary from 301 × 71 to 3,081 × 897 pixels. The images were taken in a field in the Shertha village of Gujarat, India, using a 12.3 megapixel NIKON D90 digital SLR camera during the winter season. This dataset has 120 images in the .jpeg format, including 40 images of each disease [41].
The Kaggle rice nutrient deficiency images consist of three types of deficiencies, namely nitrogen (N), phosphorous (P), and potassium (K). There are 440, 333, and 383 images in each of these classes. All the images are of varying resolutions [8]. A snapshot of the image dataset of rice diseases and deficiency disorders used in this study is shown in Figure 4.
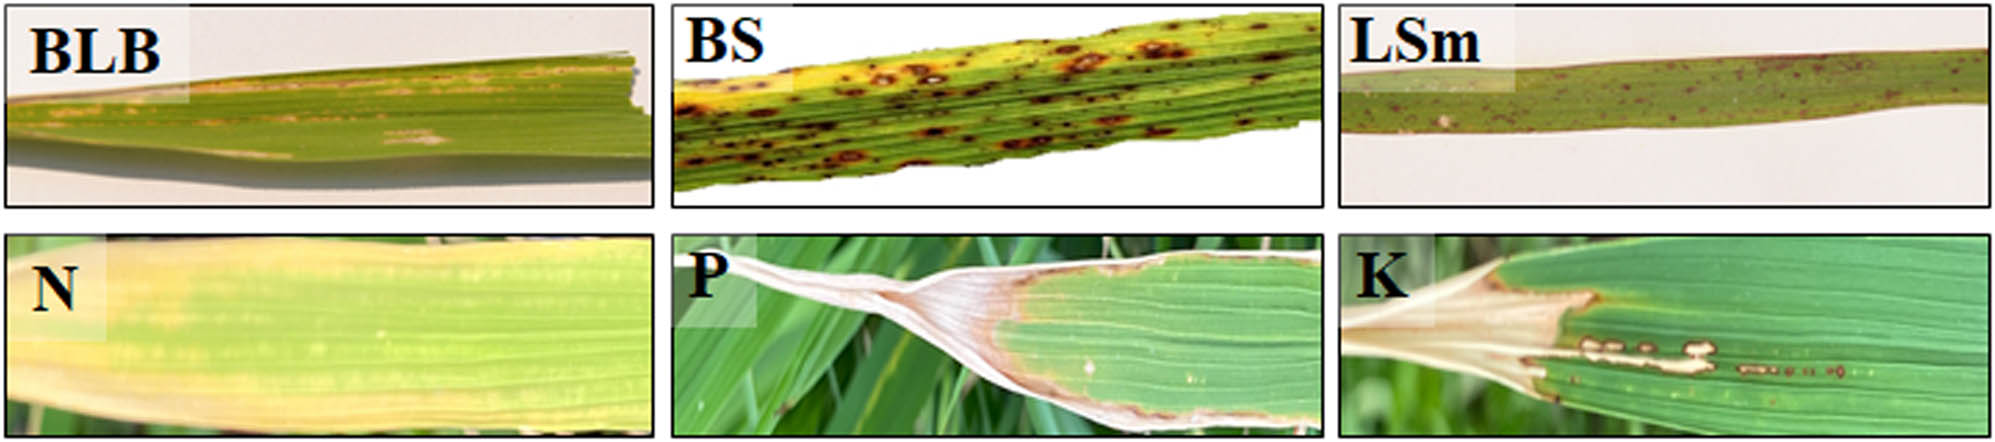
Examples of images from rice diseases and deficiency disorder datasets.
2.1.2 Image pre-processing and rice disease/deficiency disorder annotation
In order to extract multiple disease zones from a single image of a rice leaf, the images of the dataset were clipped. They were then scaled down to 512 × 512 pixels in resolution. After clipping and resizing, a total of 255 rice disease images were obtained. Similarly, 1,156 rice deficiency disorder images were obtained. The clipping and resizing approach used in this study is shown in Algorithm 1. No ground truth segmentation masks were present in the rice datasets. In order to evaluate the task of segmentation, the positions and categories of infected patches in the rice images were labeled using the VIA annotation tool.
| Algorithm 1: Algorithm to obtain resized clipped images |
|---|
| Input: f1 = path_to_dataset |
| Output: resized_image |
| For all_images in f1 do |
| box = clipping_size |
| image_crop = file_i.crop(box) |
| resized_image = image_crop.resize((512,512)) |
| resized_image.save(file_i) |
| End |
The rice-diseased regions were manually refined using a polygonal form. All annotations containing shape and region properties were extracted into a .json file, which contains the name and polygon points along (x, y) coordinates [42]. The ground truth (mask) images were then obtained from the labeled json file as shown in Figure 5.

Flowchart of extracting mask images from a labeled json file: (a) main program and (b) save to dictionary function.
These extracted masks were then subjected to grayscale conversion. To increase the data samples, augmentation techniques like rotation, flip, shear, shift, and zoom were applied to the training and validation images and their corresponding masks. The augmentation parameters are given in Table 1.
Augmentation techniques applied in the current study
| Augmentation techniques | Range/mode |
|---|---|
| Rotation | 0.2 |
| Width shift | 0.05 |
| Height shift | 0.05 |
| Shear | 0.05 |
| Zoom | [0.5, 1] |
| Horizontal flip | Random |
| Fill | Nearest newly created pixels |
2.2 Rice-infected region extraction
The first module of DeepBatch framework for extracting infected regions from rice images is illustrated in Figure 6. The rice disease and deficiency disorder images were processed separately. These images were divided into training-validation and testing sets in the ratio 70:30, and they were manually labeled to extract the infected regions. The labeled file provided the mask images, which were then converted into grayscale. Augmentation on RGB images and their corresponding grayscale masks resulted in more than 30,000 images and masks, for both datasets. These images were then passed through the DL segmentation models of DeepBatch.
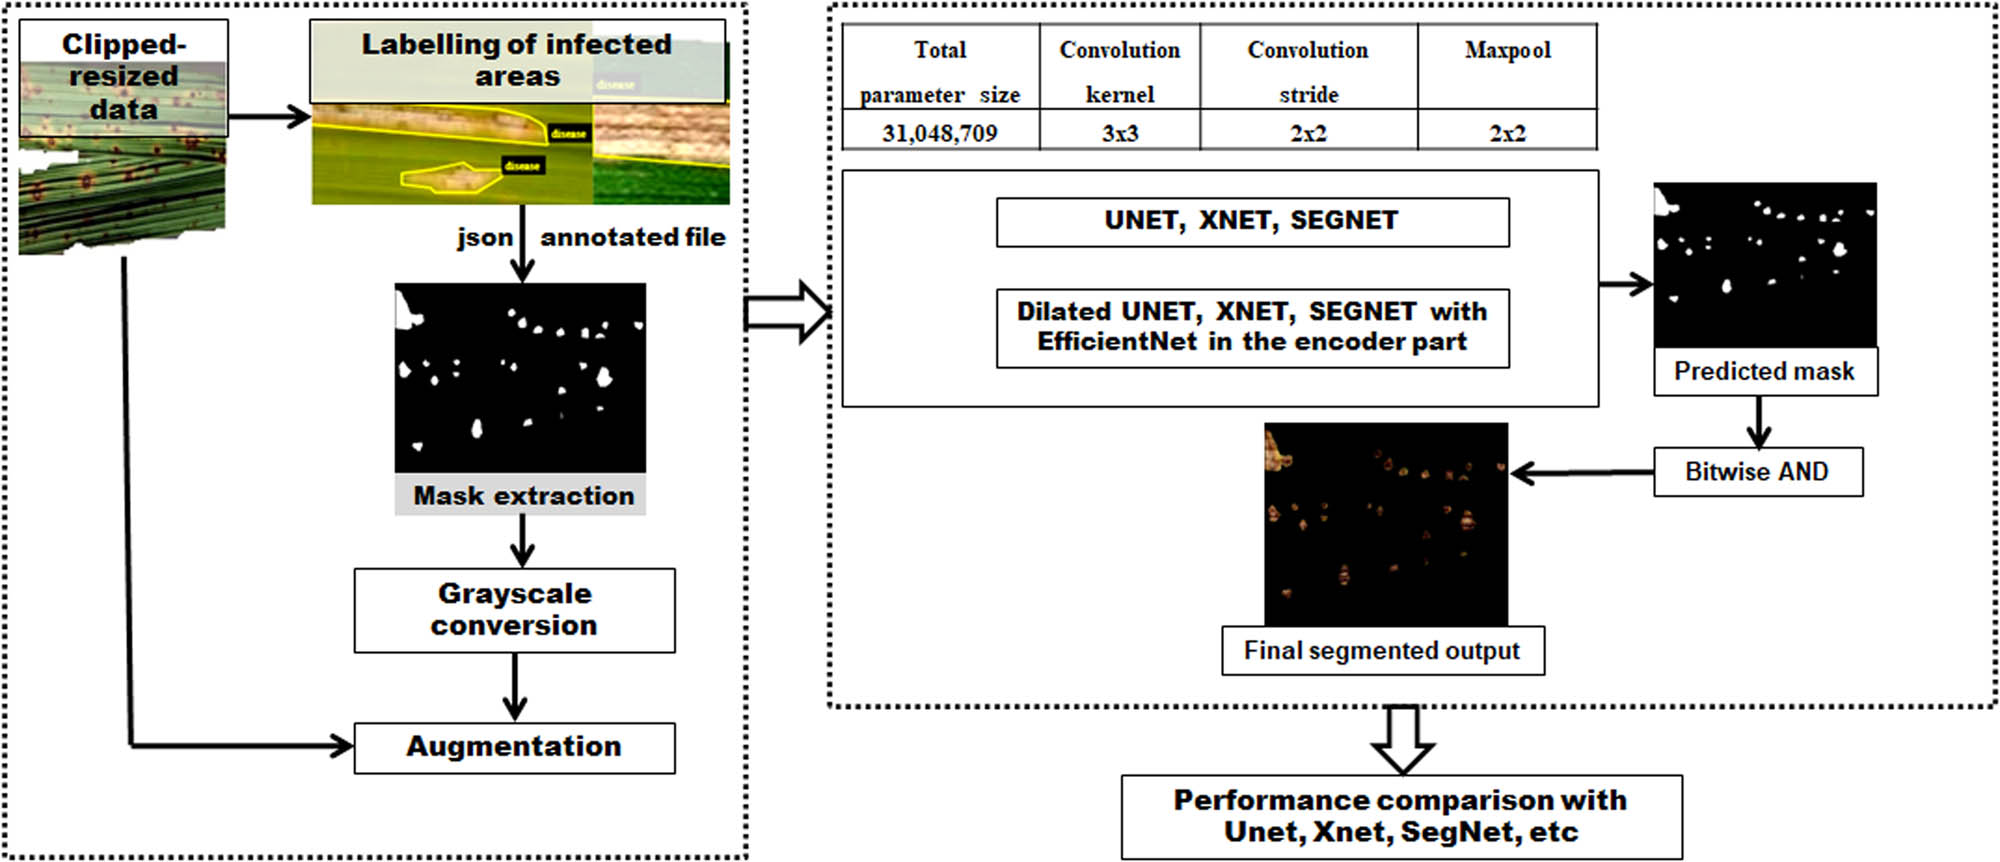
The rice disease DL segmentation framework implemented in this study.
Dilated convolution has been observed to cover maximum input coverage in the classification of images, time series data, sound, etc. [43,44,45]. Therefore, dilated-based enhancements of XNet, SegNet, and UNet-based architectures were introduced for segmenting the infected rice images. In other words, in order to cover more information from the output obtained with every convolution operation, dilation convolution and pre-trained DL model were introduced in the encoder section of the three DL segmentation models. The dropout layers were used to prevent overfitting [46,47,48,49,50]. The modifications done to the existing models are shown in Figure 7. The DL segmentation models were trained for 50 epochs with an adaptive moment estimation (Adam) optimizer whose learning rate was set to 0.001. The dice loss function was used since our datasets contain imbalanced class proportions.

Structure diagrams of encoder blocks of the modified DL segmentation models.
The weights were saved only if there was an improvement in validation loss. The models were executed utilizing GPU with a batch size of 32. The dilation rate used in the present work was r = 2. The detailed model layer size used during training is shown in Table 2.
Layer size of the deep segmentation models used in the current work
| Layer | Modified DL segmentation models | ||
|---|---|---|---|
| U-Net | XNet | SegNet | |
| Input | 512 × 512 × 3 | 512 × 512 × 3 | 512 × 512 × 3 |
| Convolution kernel | 3 × 3 | 3 × 3 | 3 × 3 |
| Convolution stride | 2 × 2 | 2 × 2 | 3 × 3 |
| Dilation | 2 | 2 | 2 |
| Maxpool | 2 × 2 | 2 × 2 | 2 × 2 |
| Convolution filter | 2 × 2 | 2 × 2 | 3 × 3 |
| Dropout | 0.5 | 0.5 | 0.2 |
2.2.1 UNet and modified UNet
Contracting and extracting pathways are present in U-Net. In the portion of the extracting path, the image size is restored to its original size after being reduced to half in the contracting path. The modified version of U-Net used in the current study has an intermediate layer with two dilated convolutional layers and a dropout of 0.5. The contracting path started with EfficientNetB4 (pre-trained on ImageNet). The image was upsampled and joined with the appropriate image from the contracting path during the extraction process. The upsampling block included convolutional, merging, and upsampling layers. This block was repeated four times before the addition of a convolution layer. The output activation function of the last convolution layer was sigmoid [47,48].
2.2.2 SegNet and modified SegNet
The EfficientNetB4 model was pre-trained on ImageNet data as the first layer of the encoding structure. Its output was received as input by two layers of regularized (0.2) maxpooled convolutions. In the second layer of encoding, regularized convolutions were used. In the decoder, upsampling of convolution layers along with regularized convolutions was applied. The decoder had access to the low-level features created by the encoder layers [46].
2.2.3 XNet and modified XNet
The encoder–decoder-based XNet was observed to be first used in the medical field for X-ray image segmentation. Encoder contains several sequences of convolutional layers for feature extraction and a maxpooling layer to downsample the image. In the modified XNet used in this study, the encoder part of XNet was dilated with a dilation rate of 2 and a dropout probability of 0.5. EfficientNetB4 was included in the encoder path, which was trained on the ImageNet dataset. The convolutional layer followed by maxpooling was repeated three times. Next, layer flattening was performed through two convolution layers. Decoder performed the upsampling to create segmented masks of input BLB images. In the current work, the decoder contained upsampling block which had the upsampling layer and convolutional layer, followed by concatenation. The output of the last activation from the encoder and the output of the present activation of upsampling block were concatenated. This upsampling block was repeated twice after which maxpooled normal convolution and layer flattening were performed. For getting the final segmented mask, the sigmoid activation function was used after three blocks of upsampling [48].
The segments consisted of the predicted binary masks for the infected regions in rice images. The OpenCV image processing library was used to obtain the intersected pixels in both image and its respective predicted mask. The pixels of the RGB images were overlaid over the corresponding predicted masks and a logical bitwise AND operation was performed. The pixels that are common to every image and its mask were considered. The remaining pixels (background and healthy leaf sections) were left out. Hence, the bitwise AND operation would produce the segmented infected region only (in RGB format).
2.3 DL rice disease/deficiency disorder classification
The final segments for the rice disease and deficiency disorder were produced by the bitwise AND operation [51]. The properly segmented images were then chosen for feeding into the DL classification system. The resolutions of images were resized to 300 × 300 pixels. Training, testing, and validation sets were created from the images in the following proportions: 60:20:20. The common dataset split of 60:20:20 is a guideline used in the literature [17]. So, we have chosen a split that is suitable for our dataset’s specific needs. The techniques and parameters mentioned in Algorithm 2 were used to augment both datasets. Five TL models, MobileNetV2, InceptionResNetV2, Xception, DenseNet201, and VGG19, were then trained and tested on the datasets. The models were accurately trained using the categorical cross-entropy loss function and the Adam optimizer [5,8].
| Algorithm 2: Algorithm to resize and augment images |
|---|
| Input: f1 = Path_to_dataset |
| Output: final_image |
| For all_images in f1 do |
| final_image = file_i.resize(300,300) |
| final_image.flip_left_right(0.7) |
| final_image.rotate(0.6, 23, 25) |
| final_image.skew(0.8, 0.8) |
| final_image.zoom(probability = 1.0, min_factor = 1.0, max_factor = 1.6) |
| final_image.sample(403) |
| End |
The highest-performing TL models among them were combined to create ensemble classifiers. All the classifiers were assessed using performance measures such as a confusion matrix, precision, recall, F1-score, and accuracy to choose the optimal model for rice disease diagnosis [8,15,16,17]. A comparison was also done on the results of rice disease classification with/without applying the DeepBatch method. The classification module for rice disease diagnosis is shown in Figure 8.

The rice disease DL classification framework implemented in this study.
2.3.1 TL architectures
Different industries, including gaming, healthcare, agriculture, autonomous driving, etc., use TL designs extensively. In the current study, the classification of segmented rice disease and deficiency disorders was done using pre-trained models such as VGG19, Xception, DenseNet201, InceptionResNetV2, and MobileNetV2.
InceptionResNetV2 accepts RGB images with 299 × 299 resolution. The first layer consists of a 3 × 3 convolutional layer with 32 filters, a batch normalization layer, and a ReLU activation function. Inception-ResNet-A and Inception-ResNet-B blocks are then stacked after this layer’s output. A reduction block, which combines convolutional and pooling layers, then processes the output.
Following the reduction block, there is a stack of Inception-ResNet-C blocks with various filter sizes. A global average pooling layer processes the output by averaging each feature map across the output’s spatial dimensions. A fully connected layer is then applied to the output of the global average pooling layer, followed by a softmax activation function [5,8]. In this study, InceptionResNetV2’s initial 156 layers are frozen throughout training. The global average pooling layer, dense layer with a ReLU activation, 50% drop out, and dense layer with a softmax activation make up the classification layer.
The NN architecture VGG19 has 19 layers. An RGB image with a resolution of 224 × 224 serves as VGG19’s input. A batch normalization layer and a ReLU activation function are placed after the first layer (a 3 × 3 convolutional layer with 64 filters). The output of this layer is then subjected to a series of 2–4 3 × 3 filter-sized convolutional layers, followed by a max pooling layer. The output is processed by fully connected layers after the convolutional layers and max pooling layers. A final softmax activation function, which generates a probability distribution over the classes, comes after the fully connected layers [5,8,52]. In this study, the last 20 layers of VGG19 are frozen throughout training. The global average pooling layer, a dense layer with a ReLU activation, 50% dropout, and a dense layer with a softmax activation make up the classification layer.
An NN architecture called XceptionNet accepts RGB images up to 299 × 299 pixels as input. A batch normalization layer and a ReLU activation function are placed after the first layer of a 3 × 3 convolutional layer with 32 filters. The next section consists of a stack of convolutional blocks, each of which combines batch normalization layers, ReLU activation functions, and depthwise separable convolutions. The output is processed by a global average pooling layer after the convolutional blocks, which calculates the average of each feature map across the spatial dimensions of the output [5,8,53]. In this study, the last 20 layers of XceptionNet are frozen throughout training. The global average pooling layer, a dense layer with a ReLU activation, 50% dropout, and a dense layer with a softmax activation make up the classification layer.
DenseNet201 accepts RGB images with 224 × 224 resolution as input. The first layer is a 7 × 7 convolutional layer with 64 filters followed by a 3 × 3 maximum pooling layer. A string of dense blocks, each containing a number of convolutional layers with varying filter sizes, is then applied to the output of the pooling layer. A global average pooling layer follows the dense blocks and averages each feature map across the output’s spatial dimensions. A fully connected layer with a number of classes and a softmax activation function follows the output of the global average pooling layer [5,8]. In this study, the last 20 layers of DenseNet201 are frozen throughout training. The global average pooling layer, a dense layer with a ReLU activation, 50% dropout, and a dense layer with a softmax activation make up the classification layer.
An NN architecture called MobileNetV2 accepts RGB images of 224 × 224 as input. There are 32 filters, a batch normalization layer, and a ReLU activation function in the top layer. A batch normalization layer, a depthwise separable convolution, and a ReLU activation function are all present in each of the 16 residual bottleneck blocks that follow this layer. The gradient signal is transmitted from the output to the input by employing skip connections to connect the remaining bottleneck blocks. Following residual bottleneck blocks, the output is processed by a global average pooling layer. The average of each feature map is calculated across the output spatial dimensions by this layer. A feature vector is generated by this layer, and it will be used for the targeted task [5,8,52]. In this study, the last 20 layers of MobileNetV2 are frozen throughout training.
These models were trained for 50 epochs with a batch size of 32 to ensure that proper learning takes place. The optimal number of epochs for each TL model was tracked using the early stopping method. Overfitting was avoided by a 50% dropout rate.
2.3.2 TL ensemble architectures
The four base TL models’ predicted probabilities were combined in the current study using ensemble averaging. These four base learners were used to create various binary, ternary, and quaternary ensemble classifier combinations. As shown in Figure 9, the test set of the dataset was used to calculate the prediction probabilities generated by each combination of classifiers.

Flowchart of TL ensemble averaging implemented in this study.
2.4 Performance assessment
The metrics used for analyzing DL segmentation were dice coefficient, dice loss, precision, and recall. In the classification part of DeepBatch, precision, recall, F1-score, and accuracy were used to evaluate each classification model.
2.4.1 Dice coefficient
The Dice coefficient, a similarity statistic, is utilized to evaluate the effectiveness of image segmentation models. For determining the Dice coefficient, the predicted and ground truth masks of a binary image are compared.
Masks are binary images that contain only the ROIs and set everything else to zero. Dice coefficients are used to determine the accuracy of segmentation in the model. These coefficients determine the overlap between the predicted masks and the actual masks. Dice coefficients, which range from 0 to 1, determine whether the predicted and ground truth masks completely overlap or not. The dice coefficient is calculated as the ratio of the twice-intersection area and the total area between the input mask and the predicted mask [43,54].
2.4.2 Dice loss
ML models for image segmentation are trained using dice loss functions. It is derived from the Dice coefficient, a similarity statistic used to evaluate image segmentation performance. A dice loss is a quantitative measure of the difference between a predicted mask and an actual mask based on the Dice coefficient. Calculated as 1 minus the Dice coefficient, the dice loss represents the degree of similarity between the predicted and actual masks. Therefore, the objective of the model is to minimize the Dice loss by increasing the Dice coefficient and maximizing segmentation accuracy [43,54].
2.4.3 Recall and precision
Performance measures such as recall and precision are used to assess the accuracy of a classification model. To generate both metrics, a confusion matrix is used, which lists the total number of true positives, false positives, true negatives, and false negatives. Referred to as sensitivity, recall measures the percentage of accurate positive predictions among all real positive cases. A high recall score indicates that a significant portion of the positive examples was accurately predicted by the model. A high recall score, for instance, indicates that the model correctly detects the majority of diseases in agricultural crops. Precision is the percentage of correctly predicted classes that are positive cases. A high precision score suggests that the model is producing fewer false-positive predictions. For example, of all crops predicted to have blight disease, the precision score gives us the number of crops actually infected with blight [5,8].
2.4.4 F1-score and accuracy
ML uses F1-score and accuracy to evaluate the effectiveness of classification models. The confusion matrix, a table that lists the total number of true positives, false positives, true negatives, and false negatives, is used to calculate them. Accuracy is defined as the ratio of correct predictions made by the model to total predictions. Accuracy is beneficial in situations where there are roughly equal number of positive and negative cases. When classes are unbalanced, it may be difficult to measure accuracy. For example, in crop disease diagnosis, the model may have a high accuracy score, yet be useless as a diagnostic tool if it predicts that all crops are negative [5,8,40,52,55,56,57,58,59].
3 Results
The training and the validation of various learning models were carried out using GPU available in the Google Colab platform. Sections 3.1 and 3.2 explain the results obtained from the two stages of DeepBatch considered in this study.
3.1 Results of module 1 of DeepBatch
The DL segmentation framework using the modified versions of U-Net, XNet, and SegNet was used to extract infected regions in 255 rice leaf disease images and 1,156 rice deficiency disorder images. Considering the results of extracting regions infected with rice diseases, it was observed that the optimal loss value of the modified UNet segmentation changed from 0.8 to 0.22 after 50 epochs. Similarly, the optimal loss value of the modified SegNet segmentation changed from 0.86 to 0.26.
From Table 3, it was observed that Dilated U-EfficientNet performed better than the rest in terms of dice loss, dice coefficient, and recall. Both UNet and dilated Seg-EfficienNet had validation losses of 0.8 after 50 epochs, which were determined to be worse than those of the other models. So, in order to conduct further comparisons, these segmentation models were ignored.
Quantitative evaluation for extracting diseased regions in the rice leaf (module 1)
| Models | Dice loss | Dice coefficient | Precision | Recall | Accuracy |
|---|---|---|---|---|---|
| UNet | 0.8584 | 0.1416 | 0.7587 | 0.8947 | 0.9828 |
| XNet | 0.2267 | 0.7733 | 0.8723 | 0.7358 | 0.9840 |
| SegNet | 0.3588 | 0.6412 | 0.5364 | 0.8691 | 0.9600 |
| Modified SegNet | 0.8636 | 0.1364 | 0.0769 | 0.7905 | 0.5801 |
| Modified XNet | 0.2241 | 0.7759 | 0.8600 | 0.7564 | 0.9846 |
| Modified UNet | 0.2234 | 0.7766 | 0.8876 | 0.7112 | 0.9836 |
In the remaining models, a pattern of validation loss across 50 epochs was seen. Figure 10 shows the loss function curves while extracting rice disease regions using DL segmentation models. It was found that although the validation loss for XNet, Dilated X-EfficientNet, and Dilated U-EfficientNet after 50 epochs was found to be 0.2, frequent fluctuations were seen in the cases of XNet and Dilated X-EfficientNet. As a result, Dilated U-EfficientNet and SegNet-EfficientNet, with a precision of 88.76 and 88.65%, respectively, were identified as the best models to obtain segmented regions of rice diseases.

Validation loss curves during the extraction of rice-diseased regions using DL segmentation.
Figure 11 shows the behavior of the DL architectures for extracting regions with rice nutrient deficiency disorders. Table 4 shows the quantitative results of extracting deficiency disorder regions. It was found that although the optimal loss for SegNet and Dilated U-EfficientNet after 50 epochs was found to be between 0.2 and 0.4, frequent fluctuations were observed. Hence, these models were ignored along with the modified SegNet. The values of the loss function at each epoch showed that all the models except XNet and modified XNet suffered from very high overfitting. This overfitting got reduced to a large extent in XNet and modified XNet.

Validation loss curves during the extraction of rice deficiency disorder regions using DL segmentation.
Quantitative results of extracting rice deficiency disorder regions using DL segmentation (module 1)
| Models | Dice loss | Dice coefficient | Precision | Recall |
|---|---|---|---|---|
| UNet | 0.0866 | 0.9134 | 0.9702 | 0.9673 |
| XNet | 0.0373 | 0.9627 | 0.9587 | 0.9717 |
| SegNet | 0.4034 | 0.5966 | 0.9913 | 0.4535 |
| Modified UNet | 0.0820 | 0.9180 | 0.9747 | 0.9697 |
| Modified XNet | 0.0363 | 0.9638 | 0.9490 | 0.9829 |
| Modified SegNet | 0.8636 | 0.1364 | 0.0769 | 0.7905 |
The average loss in the latter was decreased by 0.0004, which was considered the best model of the six DL models. The optimal loss value of the modified XNet segmentation model changed from 0.2310 to 0.0362 throughout 50 epochs.
The qualitative results for the DL segmentation of infected rice leaves (disease and deficiency disorders) in the rice-infected region extraction module of the DeepBatch framework are shown in Figure 12, where the white/yellow color indicates an infected region. In contrast, the black/purple color indicates a non-infected region. According to qualitative evaluation, a relative similarity is observed between the regions labeled by humans and those inferred by the best DL segmentation architecture. The refined segment obtained by applying bitwise logical AND operation on the images and their predicted masks is given attention in the next stage of DeepBatch. Finally, the predicted masks of rice diseases produced by dilated U-EfficientNet were considered as they showed the best performance. The predicted masks along with their respective RGB images underwent bitwise AND operation. In comparison with the human annotations, the ability of the best DL segmentation architecture to separate background pixels within infected regions is shown by the dice coefficient curves.

Extraction of the rice-infected region showing the input images, human annotation, mask produced by DL infected region extraction framework, and the refined segmented region.
It was seen that the optimal dice value of the segmentation results reached 0.77 and 0.96 while extracting regions infected by disease and deficiency disorders, respectively, in rice leaves. Figure 13 shows the dice curves of DeepBatch module 1.

Dice coefficients for segmenting (a) rice diseases and (b) rice deficiency disorders.
3.2 Results of module 2 of DeepBatch
The Google Colab platform’s GPU was used to perform the training and validation of several learning models for classifying the segmented regions using DeepBatch. The segmented rice-infected images obtained from DeepBatch module 1 were processed using five TL models, i.e., MobileNetV2, InceptionResNetV2, Xception, DenseNet201, and VGG19. The ensemble versions of the top TL models which were considered are shown in Table 5 along with their performance measures. Considering the rice disease dataset, the accuracy scores of all these models were in the range of 49.67–94.33. The performance of InceptionResNetV2 with 94.33% accuracy was the highest as compared to other TL models.
Quantitative results of rice disease and deficiency disorder classification after applying DeepBatch showing precision (P), recall (R), F1, and accuracy (A) scores
| Models | Rice disease | Rice nutrient deficiency disorder | ||||||
|---|---|---|---|---|---|---|---|---|
| P | R | F1 | A | P | R | F1 | A | |
| TL0: InceptionResNetV2 | 94.33 | 94.33 | 94.33 | 94.21 | 93.67 | 92.67 | 92.67 | 92.67 |
| TL1: VGG19 | 92.33 | 92.33 | 92 | 92.16 | 86 | 83 | 82 | 83 |
| TL2: XceptionNet | 93.33 | 93 | 93 | 93.31 | 85.67 | 78 | 77.33 | 78 |
| TL3: DenseNet201 | 94 | 93 | 93.33 | 93.22 | 88 | 85 | 85 | 85 |
| TL4: MobileNetV2 | 79 | 53.67 | 49.67 | 53.59 | 77 | 48.67 | 44.33 | 48.67 |
| EM2.0: InceptionResNetV2 + DenseNet201 | 93.33 | 96 | 96 | 96.20 | 94 | 93.33 | 93.33 | 93.33 |
| EM2.1: InceptionResNetV2 + VGG19 | 94.67 | 94.67 | 94.67 | 94.47 | 92.67 | 92 | 92 | 92 |
| EM2.2: InceptionResNetV2 + XceptionNet | 95.67 | 95.67 | 95.67 | 95.62 | 94 | 93.33 | 93.33 | 93.33 |
| EM2.3: XceptionNet + VGG19 | 95 | 94.67 | 95 | 94.72 | 89.67 | 88 | 87.67 | 88 |
| EM2.4: DenseNet201 + VGG19 | 95.67 | 95.67 | 96 | 95.70 | 86.33 | 85.33 | 85 | 85.33 |
| EM2.5: DenseNet201 + XceptionNet | 94.67 | 95 | 94.67 | 94.79 | 91.33 | 89.33 | 89.67 | 89.33 |
| EM3.0: EM2.2 + VGG19 | 96.33 | 96.33 | 96.33 | 96.28 | 92.33 | 91.33 | 91 | 91.33 |
| EM3.1: EM2.2 + DenseNet201 | 97 | 96.67 | 97 | 96.94 | 94.67 | 94 | 93.67 | 94 |
| EM3.2: EM2.3 + DenseNet201 | 96 | 95.67 | 96 | 95.62 | 90.67 | 90 | 89.67 | 90 |
| EM3.3: EM2.5 + DenseNet201 | 96 | 96.33 | 96.33 | 96.20 | 90.67 | 90 | 89.67 | 90 |
| EM4.0: EM2.2 + VGG19 + DenseNet201 | 96.67 | 96.67 | 96.67 | 96.61 | 93.33 | 92.67 | 92.33 | 92.67 |
Figure 14 presents the confusion matrices of the TL and ensemble methods for the segmented input, which shows both the classification and misclassification information. Using the confusion matrices, it has been noticed that BLB and BS showed the least and highest diagnostic accuracies, respectively. MobileNet misclassified BLB and LS in most cases. Only 1 BS sample and 7 samples of BS were misdiagnosed as BLB or LS by DenseNet201 and Xception, respectively. For the remaining models, InceptionResNetV2 and VGG19, BS was more properly classified than BLB and BS.

Confusion matrix of all TL and ensemble learning models for classifying the segmented disease in rice.
According to Table 5, the classification accuracies of binary and ternary ensemble TL classifiers for the segmented rice disease images ranged from 94.47 to 96.2% and 95.62 to 96.94%, respectively, with EM3.1 outperforming the competition with an accuracy of 96.94%.
With an accuracy of 94.47%, EM2.1 underperformed all other binary and ternary ensemble TL models. EM2.1 and EM2.4 identified less number of BS samples (377 of 403 samples). Of all the binary ensemble models, the highest number of BLB, BS, and LS samples was classified by EM2.5, EM2.4, and EM2.0, respectively. Of the ternary models, the highest number of BS samples was classified by EM3.0 and EM3.3. Similarly, EM3.0 and EM3.1 correctly classified the BLB samples in most of the cases, whereas the highest number of 394 LS samples was classified by EM3.1. The accuracy of the quaternary ensemble model was 96.61%.
Considering the rice deficiency disorder dataset, the accuracy scores of all TL models were in the range of 48.67–92.67%. The performance of InceptionResNetV2 with 92.67% accuracy was the highest as compared to other TL models. Figure 15 presents the confusion matrices of the TL and ensemble methods for the segmented rice deficiency disorders, which shows both the classification and misclassification information. Using the confusion matrices, it has been noticed that P and K showed overall good diagnostic accuracy in all the TL models. InceptionResNetV2 and VGG19 classified all N samples correctly, whereas N was misclassified in most of the cases by MobileNetV2 and XceptionNet. Although 11 N samples and 12 K samples were misclassified by DenseNet201, all P samples were correctly diagnosed. According to Table 5, the classification accuracies of binary and ternary ensemble TL classifiers for the segmented rice deficiency disorder images ranged from 85.33 to 93.33% and 90 to 94%, respectively, with EM3.2 outperforming the competition with an accuracy of 94%.

Confusion matrix of all TL models for classifying the segmented deficiency disorders in rice.
With an accuracy of 85.33%, EM2.5 underperformed all other binary and ternary ensemble TL models. The binary and ternary ensemble models were able to identify the N and P samples in most of the cases, Of the binary ensembling models, the highest number of N samples was classified by EM2.1, EM2.2, and EM2.3, whereas the highest number of P samples was classified by EM 2.0 and EM2.2. EM 2.0 had also classified the highest number of K samples. Of the ternary models, the highest number of N samples was classified by EM3.0 and EM3.1. Similarly, EM3.1, EM3.2, and EM3.3 correctly classified the P samples, whereas the highest number of 41 K samples was classified by EM3.1.
4 Discussion
The use of ML to assist agricultural experts has been widely explored using publicly available/on-field datasets. However, these approaches suffer from a lack of effective features and make it challenging to apply in real environments. Some studies [41,60] have used image processing, segmentation techniques, and data mining to separate the infected portion from rice leaves and applied SVM with a Gaussian kernel to classify these diseases. The results showed that more effective features need to be extracted for ML rice disease classification. As a result, DL algorithms have been favored by most researchers nowadays to independently extract features. TL architectures were found to work better than SVM and CNNs because they prevent the model from becoming saturated with huge data or deeper networks [61]. The ensemble of TL architectures enhanced the accuracy of diagnosing rice disease and deficiency disorders [5,8,62]. However, the goal of the present study is to enhance it further by using a novel framework based on DL algorithms. As compared to other ML/DL methodologies, the present framework has the ability to analyze more features during the diagnostic process and extract critical information from images of both disease and deficiency disorders in rice. The detection of infected regions is based on masks provided by researchers and ensures maximum overlapping between predicted masks and ground truth masks. A direct quantitative comparison with all the related works is of less relevance due to the different datasets and objectives used in these studies.
Tables 6 and 7 organize a quantitative comparison with related works that have used the same datasets.
Comparison of the DeepBatch model with the related works using the same rice disease dataset
| Study | Objective | Rice dataset | Best performance (%) | |
|---|---|---|---|---|
| DC | A | |||
| Kanuparthi et al. [62] | Classification of rice diseases by a ternary ensemble of TL models | UCI BLB, BS, and LSm diseases | _ | 96.42 |
| Das and Sengupta [60] | Rice disease detection and classification using image processing and data mining | UCI BLB, BS, and LSm diseases | _ | 95 |
| Patidar et al. [61] | Detection and classification of rice diseases using Deep ResNet | UCI BLB, BS, and LSm diseases | _ | 95.83 |
| Prajapati et al. [41] | Detection and classification of rice diseases using global feature + SVM (Gaussian kernel) | UCI BLB, BS, and LSm diseases | _ | 73.33 |
| DeepBatch (present work) | Segmentation of infected rice regions with a pre-trained model and dilated convolution in encoder Classification of segments by ensemble of TL models | UCI BLB, BS, and LSm diseases | 77.66 | 96.94 |
Comparison of the DeepBatch model with the related works using the same rice deficiency dataset
| Study | Objective | Rice dataset | Best performance (%) | |
|---|---|---|---|---|
| DC | A | |||
| Sharma et al. [8] | Classification of rice NPK deficiencies using an ensemble of TL models | Kaggle NPK deficiency | _ | 91.33 |
| DeepBatch (present work) | Segmentation of infected rice regions with a pre-trained model and dilated convolution in encoder Classification of segments by ensemble of TL models | Kaggle NPK deficiency | 96.38 | 94 |
Considering the rice disease dataset, it is inferred from module 1 of DeepBatch that UNet performed the worst segmentation of rice disease regions with a loss of 0.8584. The low loss and high accuracy in modified UNet showed the ideal case of generating very less errors in creating rice disease masks. According to module 2 of DeepBatch, the individual TL, binary, ternary, and quaternary ensemble classifiers had average accuracies of 85.29, 95.25, 96.26, and 96.61%, respectively. The quaternary ensemble model EM4.0 showed 96.61% accuracy [63,64,65].
The classification accuracy of the ensemble TL models for the entire experiment was in the range of 94.47–96.94%, whereas individual TL [66–69] models showed an accuracy of 53.59–94.21%, which confirms the superiority of the ensemble approach [60,70–73]. On applying the DeepBatch method, the validation accuracies of the TL models increased after 50 epochs. Average accuracies for the DeepBatch rice disease diagnosis employing TL models and ensemble models were 85.29 and 95.74%, respectively. DeepBatch has increased the efficiency of TL models and ensemble models by 6.098 and 1.99%, respectively.
Considering rice deficiency disorders, it is inferred from module 1 of DeepBatch that modified XNet performed the best in segmenting regions infected with rice deficiency disorders. In module 2 of DeepBatch, it is observed that the individual TL, binary, and ternary ensemble classifiers [74–78] had average accuracies of 77.468, 90.22, and 91.33%, respectively. The quaternary ensemble model EM4.0 showed 92.67% accuracy. The classification accuracy of the ensemble TL models for the entire experiment was in the range of 85.33–94%, whereas individual TL models showed an accuracy of 48.67–92.67%, which confirms the superiority of the ensemble approach. It is clear from Table 8 that DeepBatch has increased the efficiency of diagnosing both disease and deficiency disorders in rice images. Thus, the proposed method is best fit for rice disease/deficiency disorders diagnosis as it is based on a fusion of segmentation and classification approach using various ensemble of TL models [79–82].
Mean accuracies (in %) of the best TL models and their ensembles
| Without DeepBatch | With DeepBatch | |||
|---|---|---|---|---|
| Models | Rice disease | Rice NPK deficiency disorder | Rice disease | Rice NPK deficiency disorder |
| TL models | 79.2 | 82.92 | 93.23 | 84.67 |
| Ensemble models | 93.75 | 88.69 | 95.74 | 90.85 |
It is important to be aware of the limitations and biases of this study. In this study, only a few rice diseases and deficiency disorders were considered. All diseases and nutrient deficiencies must be considered for the system to be appropriate for real-world implementation. Additionally, this study only took a few DL segmentation models into account [83–85]. The performance of other DL models, such as variants of UNet, is not investigated in this work. In addition, the datasets considered are benchmark data collected from a particular region [86–88]. Therefore, the experimental result obtained may not be generalized to rice variants, which are being produced in other parts of the world. Furthermore, the study relies only on the image data for the diagnosis, ignoring the fact that multiple other symptoms could have been missed out by image data.
5 Conclusion
The DeepBatch methodology proposed in the current study makes use of DL-based segmentation and DL-based classification frameworks. The DL segmentation framework receives pre-processed images of the rice disease together with the corresponding masks. In order to predict the masks of the infected rice parts, the DL segmentation framework used modified versions of UNet, XNet, and SegNet. Bitwise multiplication was used to extract only the contaminated segment, leaving out the background and healthy sections. The DL classification framework receives these improved segmented images as inputs. For identifying diseases in rice plants, the second framework included both ensemble and TL architectures, which were carried out using five TL architectures: InceptionResNetV2, VGG19, Xception, DenseNet201, and MobileNet. The use of Xception, DenseNet201, InceptionResNetV2, and VGG19 produced 11 ensemble models. When compared to individual TL models, the ensembled models’ performance was significantly better. Overall, it is observed that after applying the DeepBatch approach, the average accuracy of the TL models increased in both rice diseases and deficiency disorder images. The experiment demonstrates how the combination of various DL frameworks may be useful to design a rice disease/deficiency disorder diagnostic system. Future studies may concentrate on identifying disease and nutrient deficiency disorders in rice from a larger study region.
-
Funding information: Authors state no funding involved.
-
Author contributions: Conceptualization: Kumar CJ; investigation: Sharma M, Kumar CJ; methodology: Sharma M, Kumar CJ; project administration: Kumar CJ, Talukdar J, Sharma A, Dhiman G, Singh TP; visualization: Sharma M; writing – original draft, Sharma M; writing – review & editing: Kumar CJ, Talukdar J, Dhiman G, Singh TP, Sharma A.
-
Conflict of interest: Authors state no conflict of interest.
-
Data availability statement: The three different types of diseased rice leaf images that were utilized in this experiment are accessible at the following links provided as follows: https://www.kaggle.com/datasets/vbookshelf/rice-leafdiseases, https://www.kaggle.com/guy007/nutrientdeficiencysymptomsinrice. The datasets generated during and/or analyzed during the current study are available from the corresponding author on reasonable request.
References
[1] Bin Rahman AR, Zhang J. Trends in rice research: 2030 and beyond. Food Energy Secur. 2023 Mar;12(2):e390.10.1002/fes3.390Search in Google Scholar
[2] United Nations, Department of Economic and Social Affairs Population Division. World Population Prospects: The 2019 Revision, Methodology of the United Nations Population Estimates and Projections, Methodology of the United Nations Population Estimates and Projections. 2019. 61 p.Search in Google Scholar
[3] Fao.org. The state of food security and nutrition in the world 2021; c2023 [cited 2023 March 02]. https://www.fao.org/state-of-food-security-nutrition/2021.Search in Google Scholar
[4] Mau YS, Ndiwa A, Oematan S. Brown spot disease severity, yield and yield loss relationships in pigmented upland rice cultivars from East Nusa Tenggara, Indonesia. Biodiversitas. 2020 Mar 25;21(4):1625–34.10.13057/biodiv/d210443Search in Google Scholar
[5] Sharma M, Kumar CJ, Deka A. Early diagnosis of rice plant disease using machine learning techniques. Arch Phytopathol Pflanzenschutz. 2022 Feb 3;55(3):259–83.10.1080/03235408.2021.2015866Search in Google Scholar
[6] Zhao X, Wang S, Wen T, Xu J, Huang B, Yan S, et al. On correlation between canopy vegetation and growth indexes of maize varieties with different nitrogen efficiencies. Open Life Sci. 2023 Mar 23;18(1):20220566.10.1515/biol-2022-0566Search in Google Scholar PubMed PubMed Central
[7] Food and Agriculture Organization of the United Nations. OECD-FAO Agricultural Outlook 2021–2030; 2021 Apr 27. p. 163–77.Search in Google Scholar
[8] Sharma M, Nath K, Sharma RK, Kumar CJ, Chaudhary A. Ensemble averaging of transfer learning models for identification of nutritional deficiency in rice plant. Electronics. 2022 Jan 4;11(1):148.10.3390/electronics11010148Search in Google Scholar
[9] Nayak S, Samanta S, Sengupta C, Swain SS. Rice crop loss due to major pathogens and the potential of endophytic microbes for their control and management. J Appl Biol Biotechnol. 2021 Sep 1;9(5):166–75.Search in Google Scholar
[10] Bhuyan BP, Tomar R, Singh TP, Cherif AR. Crop type prediction: A statistical and machine learning approach. Sustainability. 2022 Dec 28;15(1):481.10.3390/su15010481Search in Google Scholar
[11] Phadikar S, Sil J, Das AK. Classification of rice leaf diseases based on morphological changes. Int J Inf. Electron Eng. 2012 May;2(3):460–3.10.7763/IJIEE.2012.V2.137Search in Google Scholar
[12] Rahman CR, Arko PS, Ali ME, Khan MA, Apon SH, Nowrin F, et al. Identification and recognition of rice diseases and pests using convolutional neural networks. Biosyst Eng. 2020 Jun 1;194:112–20.10.1016/j.biosystemseng.2020.03.020Search in Google Scholar
[13] Ramesh S, Vydeki D. Recognition and classification of paddy leaf diseases using Optimized Deep Neural network with Jaya algorithm. Inf Proc Agric. 2020 Jun 1;7(2):249–60.10.1016/j.inpa.2019.09.002Search in Google Scholar
[14] Rao DS, Kavya N, Kumar SN, Venkat LY, Kumar NP. Detection and classification of rice leaf diseases using deep learning. Int J Adv Sci Tech. 2020;29(03):5868–74.Search in Google Scholar
[15] Rathore NP, Prasad L. Automatic rice plant disease recognition and identification using convolutional neural network. J Crit Rev. 2020;7(15):6076–86.Search in Google Scholar
[16] Mohapatra D, Das N. A precise model for accurate rice disease diagnosis: a transfer learning approach. In: Chakraborty S, editor. Proceedings of the Indian National Science Academy. Springer; 2023 Jan 4. p. 162–71.10.1007/s43538-022-00149-3Search in Google Scholar
[17] Simhadri CG, Kondaveeti HK. Automatic recognition of rice leaf diseases using transfer learning. Agronomy. 2023 Mar 23;13(4):961.10.3390/agronomy13040961Search in Google Scholar
[18] Yakkundimath R, Saunshi G, Anami B, Palaiah S. Classification of rice diseases using convolutional neural network models. J Inst Eng (India): B. 2022 Aug;103(4):1047–59.10.1007/s40031-021-00704-4Search in Google Scholar
[19] Latif G, Abdelhamid SE, Mallouhy RE, Alghazo J, Kazimi ZA. Deep learning utilization in agriculture: Detection of rice plant diseases using an improved CNN model. Plants. 2022 Aug 28;11(17):2230.10.3390/plants11172230Search in Google Scholar PubMed PubMed Central
[20] Sinha K, Ghoshal D, Bhunia N. Rice leaf disease classification using transfer learning. In: Mallick PK, Bhoi AK, Barsocchi P, de Albuquerque VHC, editors. Cognitive Informatics and Soft Computing. Singapore: Springer; 2022. p. 467–75.10.1007/978-981-16-8763-1_38Search in Google Scholar
[21] Jenipher VN, Radhika S. An automated system for detecting rice crop disease using CNN inception V3 transfer learning algorithm. 2nd International Conference on Artificial Intelligence and Smart Energy (ICAIS); 2022 Feb 23–25. Coimbatore, India: IEEE; 2022.10.1109/ICAIS53314.2022.9742999Search in Google Scholar
[22] Anandhan K, Singh AS. Detection of paddy crops diseases and early diagnosis using faster regional convolutional neural networks. International Conference on Advance Computing and Innovative Technologies in Engineering (ICACITE); 2021 Mar 4–5. Greater Noida, India: IEEE; 2021.10.1109/ICACITE51222.2021.9404759Search in Google Scholar
[23] Temniranrat P, Kiratiratanapruk K, Kitvimonrat A, Sinthupinyo W, Patarapuwadol S. A system for automatic rice disease detection from rice paddy images serviced via a Chatbot. Comput Electron Agric. 2021 Jun 1;185:106156.10.1016/j.compag.2021.106156Search in Google Scholar
[24] Kiratiratanapruk K, Temniranrat P, Kitvimonrat A, Sinthupinyo W, Patarapuwadol S. Using deep learning techniques to detect rice diseases from images of rice fields. In: Fujita H, Fournier-Viger P, Ali M, Sasaki J, editors. Trends in Artificial Intelligence Theory and Applications. Cham: Springer; 2020. p. 225–37.10.1007/978-3-030-55789-8_20Search in Google Scholar
[25] Sathya K, Rajalakshmi M. RDA-CNN: Enhanced Super resolution method for rice plant disease classification. Comput Syst Sci Eng. 2022 Jul 1;42(1):33–47.10.32604/csse.2022.022206Search in Google Scholar
[26] Chen J, Chen W, Zeb A, Yang S, Zhang D. Lightweight inception networks for the recognition and detection of rice plant diseases. IEEE Sens J. 2022 Jun 16;22(14):14628–38.10.1109/JSEN.2022.3182304Search in Google Scholar
[27] Sharma R, Singh A. Big bang–big crunch-CNN: an optimized approach towards rice crop protection and disease detection. Arch Phytopathol Pflanzenschutz. 2022 Jan 20;55(2):143–61.10.1080/03235408.2021.2003054Search in Google Scholar
[28] Daniya T, Vigneshwari S. Deep neural network for disease detection in rice plant using the texture and deep features. Comput J. 2022 Jul;65(7):1812–25.10.1093/comjnl/bxab022Search in Google Scholar
[29] Zhang Z, Gao Q, Liu L, He Y. A high-quality rice leaf disease image data augmentation method based on a dual GAN. IEEE Access. 2023 Mar 1;11:21176–91.10.1109/ACCESS.2023.3251098Search in Google Scholar
[30] Yoosefzadeh-Najafabadi M, Earl HJ, Tulpan D, Sulik J, Eskandari M. Application of machine learning algorithms in plant breeding: predicting yield from hyperspectral reflectance in soybean. Front Plant Sci. 2021 Jan 12;11:624273.10.3389/fpls.2020.624273Search in Google Scholar PubMed PubMed Central
[31] Satpathi A, Setiya P, Das B, Nain AS, Jha PK, Singh S, et al. Comparative analysis of statistical and machine learning techniques for rice yield forecasting for Chhattisgarh, India. Sustainability. 2023 Feb 3;15(3):2786.10.3390/su15032786Search in Google Scholar
[32] Saberioon MM, Amin MS, Aimrun W, Gholizadeh A, Anuar AA. Assessment of colour indices derived from conventional digital camera for determining nitrogen status in rice plants. J Food Agric Environ. 2013 Apr;11(2):655–62.Search in Google Scholar
[33] Yuan Y, Chen L, Li M, Wu N, Wan L, Wang S. Diagnosis of nitrogen nutrition of rice based on image processing of visible light. International conference on functional-structural plant growth modeling, simulation, visualization and applications (FSPMA); 2016 Nov 7–11. Qingdao, China: IEEE; 2017.10.1109/FSPMA.2016.7818311Search in Google Scholar
[34] Lee KJ, Lee BW. Estimation of rice growth and nitrogen nutrition status using color digital camera image analysis. Eur J Agron. 2013 Jul 1;48:57–65.10.1016/j.eja.2013.02.011Search in Google Scholar
[35] Tewari VK, Arudra AK, Kumar SP, Pandey V, Chandel NS. Estimation of plant nitrogen content using digital image processing. Agric Eng Int: CIGR J. 2013;15(2):78–86.Search in Google Scholar
[36] Wang Y, Wang D, Zhang G, Wang J. Estimating nitrogen status of rice using the image segmentation of GR thresholding method. Field Crops Res. 2013 Aug 1;149:33–9.10.1016/j.fcr.2013.04.007Search in Google Scholar
[37] Xu X, Li W, Duan Q. Transfer learning and SE-ResNet152 networks-based for small-scale unbalanced fish species identification. Comput Electron Agric. 2021 Jan 1;180:105878.10.1016/j.compag.2020.105878Search in Google Scholar
[38] Sethy PK, Barpanda NK, Rath AK, Behera SK. Nitrogen deficiency prediction of rice crop based on convolutional neural network. J Ambient Intell Humaniz Comput. 2020 Nov;11:5703–11.10.1007/s12652-020-01938-8Search in Google Scholar
[39] Talukder MS, Sarkar AK. Nutrients deficiency diagnosis of rice crop by weighted average ensemble learning. Smart Agric Technol. 2023 Aug 1;4:100155.10.1016/j.atech.2022.100155Search in Google Scholar
[40] Howard AG, Zhu M, Chen B, Kalenichenko D, Wang W, Weyand T, et al. Mobilenets: Efficient convolutional neural networks for mobile vision applications. arXiv: 1704.04861 [Preprint]; https://arxiv.org/abs/1704.04861. 2017 [cited 2023 Feb 26].Search in Google Scholar
[41] Prajapati HB, Shah JP, Dabhi VK. Detection and classification of rice plant diseases. Intell Decis Technol. 2017 Jan 1;11(3):357–73.10.3233/IDT-170301Search in Google Scholar
[42] Crisnapati PN, Maneetham D. RIFIS: A novel rice field sidewalk detection dataset for walk-behind hand tractor. Data. 2022 Sep 25;7(10):135.10.3390/data7100135Search in Google Scholar
[43] Zhang X, Feng X, Xiao P, He G, Zhu L. Segmentation quality evaluation using region-based precision and recall measures for remote sensing images. ISPRS J Photogramm Remote Sens. 2015 Apr 1;102:73–84.10.1016/j.isprsjprs.2015.01.009Search in Google Scholar
[44] Yazdanbakhsh O, Dick S. Multivariate time series classification using dilated convolutional neural network. arXiv:1905.01697 [Preprint]; 2019 [cited 2023 March 9] https://arxiv.org/abs/1905.01697.Search in Google Scholar
[45] Zhang X, Wang J, Cheng N, Xiao J. Mdcnn-sid: Multi-scale dilated convolution network for singer identification. International Joint Conference on Neural Networks (IJCNN); 2022 Jul 18. Padua, Italy: IEEE; 2022.10.1109/IJCNN55064.2022.9892338Search in Google Scholar
[46] Ronneberger O, Fischer P, Brox T. U-net: Convolutional networks for biomedical image segmentation. In: Navab N, Hornegger J, Wells W, Frangi A, editors. Medical Image Computing and Computer-Assisted Intervention–MICCAI. Cham: Springer; 2015. p. 234–41.10.1007/978-3-319-24574-4_28Search in Google Scholar
[47] Bhattacharjee A, Murugan R, Goel T, Soni B. Semantic segmentation of lungs using a modified U-Net architecture through limited computed tomography images. Advanced Communication Technologies and Signal Processing (ACTS); 2021 Dec 15. Rourkela, India: IEEE; 2022.10.1109/ACTS53447.2021.9708190Search in Google Scholar
[48] Bullock J, Cuesta-Lázaro C, Quera-Bofarull A. XNet: a convolutional neural network (CNN) implementation for medical x-ray image segmentation suitable for small datasets. In: Barjor G, Andrzej K, editors. Proceedings of the Medical Imaging 2019: Biomedical Applications in Molecular, Structural, and Functional Imaging 2019 Feb 16–21. California, United States: SPIE; 2019. p. 453–63.10.1117/12.2512451Search in Google Scholar
[49] Hussain M, Kaassamani S, Auguste T, Boutu W, Gauthier D, Kholodtsova M, et al. Spectral control of high order harmonics through non-linear propagation effects. Appl Phys Lett. 2021 Aug 16;119(7):071101.10.1063/5.0053152Search in Google Scholar
[50] Haraty RA, Mansour N, Zeitunlian H. Metaheuristic algorithm for state-based software testing. Appl Artif Intell. 2018 Apr 5;32(2):197–213.10.1080/08839514.2018.1451222Search in Google Scholar
[51] Ghosh A, Kumar H, Sastry PS. Robust loss functions under label noise for deep neural networks. Proceedings of the AAAI conference on artificial intelligence; 2017 Feb 4–9. California, USA: ACM; 2017.10.1609/aaai.v31i1.10894Search in Google Scholar
[52] Nour C, Takche J. A general result about inner regularization of sets. J Convex Anal. 2020;27(3):943–58.Search in Google Scholar
[53] Chollet F. Xception: Deep learning with depthwise separable convolutions. Proceedings of the IEEE conference on computer vision and pattern recognition; 2017 July 21–26. Honolulu, HI, USA: IEEE; 2017.10.1109/CVPR.2017.195Search in Google Scholar
[54] Zenkl R, Timofte R, Kirchgessner N, Roth L, Hund A, Van Gool L, et al. Outdoor plant segmentation with deep learning for high-throughput field phenotyping on a diverse wheat dataset. Front Plant Sci. 2022 Jan 4;12:774068.10.3389/fpls.2021.774068Search in Google Scholar PubMed PubMed Central
[55] Tarhini A, Harfouche A, De Marco M. Artificial intelligence-based digital transformation for sustainable societies: the prevailing effect of COVID-19 crises. J Assoc Inf Syst. 2022;14(2):1.10.17705/1pais.14201Search in Google Scholar
[56] Chicha E, Bouna BA, Nassar M, Chbeir R, Haraty RA, Oussalah M, et al. A user-centric mechanism for sequentially releasing graph datasets under blowfish privacy. ACM Trans Internet Technol. 2021 Feb 17;21(1):1–25.10.1145/3431501Search in Google Scholar
[57] Mourad A, Tout H, Wahab OA, Otrok H, Dbouk T. Ad hoc vehicular fog enabling cooperative low-latency intrusion detection. IEEE Internet Things J. 2020 Jul;8(2):829–43.10.1109/JIOT.2020.3008488Search in Google Scholar
[58] AbdulRahman S, Tout H, Mourad A, Talhi C. FedMCCS: Multicriteria client selection model for optimal IoT federated learning. IEEE Internet Things J. 2020 Oct;8(6):4723–35.10.1109/JIOT.2020.3028742Search in Google Scholar
[59] Rahman SA, Tout H, Talhi C, Mourad A. Internet of things intrusion detection: Centralized, on-device, or federated learning? IEEE Netw. 2020 Sep;34(6):310–7.10.1109/MNET.011.2000286Search in Google Scholar
[60] Das S, Sengupta S. Feature Extraction and Disease Prediction from Paddy Crops Using Data Mining Techniques. In: Das A, Nayak J, Naik B, Dutta S, Pelusi D, editors. Computational Intelligence in Pattern Recognition. Singapore: Springer; 2020. p. 155–63.10.1007/978-981-15-2449-3_13Search in Google Scholar
[61] Patidar S, Pandey A, Shirish BA, Sriram A. Rice plant disease detection and classification using deep residual learning. In: Bhattacharjee A, Borgohain S, Soni B, Verma G, Gao XZ, editors. Machine Learning, Image Processing, Network Security and Data Sciences. MIND 2020. Singapore: Springer; 2020. p. 278–93.10.1007/978-981-15-6315-7_23Search in Google Scholar
[62] Kanuparthi P, Bejgam V, Viswanatham VM. A novel approach of ensembling the transfer learning methods for rice plant disease detection and classification. Webology. 2021 Dec 1;18(2):439–48.10.14704/WEB/V18I2/WEB18331Search in Google Scholar
[63] Talukdar J, Gogoi DK, Singh TP. A comparative assessment of most widely used machine learning classifiers for analysing and classifying autism spectrum disorder in toddlers and adolescents. Health Care Anal. 2023 Nov;3:100178.10.1016/j.health.2023.100178Search in Google Scholar
[64] Talukdar J, Singh TP. Early prediction of cardiovascular disease using artificial neural network. Paladyn, J Behav Robot. 2023 Feb;14(1):20220107.10.1515/pjbr-2022-0107Search in Google Scholar
[65] Bouri E, Gupta R, Wang S. Nonlinear contagion between stock and real estate markets: International evidence from a local Gaussian correlation approach. Int J Finance Econ. 2022 Apr;27(2):2089–109.10.1002/ijfe.2261Search in Google Scholar
[66] Khabbaz M, Assi C, Sharafeddine S. Multihop V2U path availability analysis in UAV-assisted vehicular networks. IEEE Internet Things J. 2021 Jan 4;8(13):10745–54.10.1109/JIOT.2020.3049018Search in Google Scholar
[67] Sorkhoh I, Ebrahimi D, Assi C, Sharafeddine S, Khabbaz M. An infrastructure-assisted workload scheduling for computational resources exploitation in the fog-enabled vehicular network. IEEE Internet Things J. 2020 Feb 20;7(6):5021–32.10.1109/JIOT.2020.2975496Search in Google Scholar
[68] Arafeh M, El Barachi M, Mourad A, Belqasmi F. A blockchain based architecture for the detection of fake sensing in mobile crowdsensing. 4th International Conference on Smart and Sustainable Technologies (SpliTech); 2019 Jun 18–21. Split, Croatia: IEEE; 2019.10.23919/SpliTech.2019.8783092Search in Google Scholar
[69] Haraty RA, Boukhari B, Kaddoura S. An effective hash-based assessment and recovery algorithm for healthcare systems. Arab J Sci Eng. 2022;47:1523–36.10.1007/s13369-021-06009-4Search in Google Scholar
[70] Yunis M, Markarian C, El-Kassar AN. A conceptual model for sustainable adoption of ehealth: Role of digital transformation culture and healthcare provider’s readiness. Proceedings of the IMCIC; 2020.Search in Google Scholar
[71] Helwan A, Ma’aitah MK, Uzelaltinbulat S, Altobel MZ, Darwish M. Gaze prediction based on convolutional neural network. In: Al-Emran M, Al-Sharafi MA, Al-Kabi MN, Shaalan K, editors. Lecture Notes in Networks and Systems. ICETIS 2021: Proceedings of International Conference on Emerging Technologies and Intelligent System; 2021 Apr 5. Cham: Springer; 2021. p. 215–24.10.1007/978-3-030-85990-9_18Search in Google Scholar
[72] Gerges F, Shih F, Azar D. Automated diagnosis of acne and rosacea using convolution neural networks. 4th International Conference on Artificial Intelligence and Pattern Recognition; 2021 Sep 24–26. Xiamen, China. New York: ACM; 2022.10.1145/3488933.3488993Search in Google Scholar
[73] Abbas N, Nasser Y, Shehab M, Sharafeddine S. Attack-specific feature selection for anomaly detection in software-defined networks. 3rd IEEE Middle East and North Africa Communications Conference (menacomm); Dec 3–5. Agadir Morocco: IEEE; 2002.Search in Google Scholar
[74] Tarhini A, Danach K, Harfouche A. Swarm intelligence-based hyper-heuristic for the vehicle routing problem with prioritized customers. Ann Oper Res. 2022 Jan;308:549–70.10.1007/s10479-020-03625-5Search in Google Scholar
[75] Manjusha OT. Global domination in Fuzzy graphs using Strong arcs. J Fuzzy Ext Appl. 2023 Mar;4(1):8–17.10.28919/cpr-pajm/1-9Search in Google Scholar
[76] Mollaei M. Fuzzy metric topology space and manifold. J Fuzzy Ext Appl. 2023 Mar;4(1):18–27.Search in Google Scholar
[77] Kalayathankal SJ, George MM, Smarandache F. On some related concepts n-cylindrical fuzzy neutrosophic topological spaces. J Fuzzy Ext Appl. 2023 Mar;4(1):40–51.Search in Google Scholar
[78] Belhadj B. Fuzzy simple linear regression using Gaussian membership functions minimization problem. J Fuzzy Ext Appl. 2022 Oct 22;3(4):279–89.Search in Google Scholar
[79] Smarandache F. Soft set product extended to hypersoft set and indetermsoft set cartesian product extended to indetermhypersoft set. J Fuzzy Ext Appl. 2022 Oct;3(4):313–6.Search in Google Scholar
[80] Nandi G, Das A. An efficient link prediction technique in social networks based on node neighborhoods. Int J Adv Comput Sci Appl. 2018;9(6):257–66.10.14569/IJACSA.2018.090637Search in Google Scholar
[81] Pawar S, Talukdar J. Sugarcane leaf disease detection. Int Res J Eng Technol. 2019 Apr;6(4):1–10.Search in Google Scholar
[82] Sharma RK, Issac B, Kalita HK. Intrusion detection and response system inspired by the defense mechanism of plants. IEEE Access. 2019 Apr 22;7:52427–39.10.1109/ACCESS.2019.2912114Search in Google Scholar
[83] Bhadra S, Kumar CJ. Enhancing the efficacy of depression detection system using optimal feature selection from EHR. Comput Methods Biomech Biomed Eng. 2023 Feb 18;26(2):1–15.10.1080/10255842.2023.2181660Search in Google Scholar PubMed
[84] Sharma M, Kumar CJ. Improving rice disease diagnosis using ensemble transfer learning techniques. Int J Artif Intell Tools. 2022 Dec 28;31(08):2250040.10.1142/S0218213022500403Search in Google Scholar
[85] Kumar CJ, Das PR. The diagnosis of ASD using multiple machine learning techniques. Int J Dev Disabil. 2022 Nov 2;68(6):973–83.10.1080/20473869.2021.1933730Search in Google Scholar PubMed PubMed Central
[86] Bhadra S, Kumar CJ. An insight into diagnosis of depression using machine learning techniques: a systematic review. Curr Med Res Opin. 2022 May 4;38(5):749–71.10.1080/03007995.2022.2038487Search in Google Scholar PubMed
[87] Sharma M, Kumar CJ, Deka A. Land cover classification: a comparative analysis of clustering techniques using Sentinel-2 data. Int J Sustain Agric. 2021;7(4):321–42.10.1504/IJSAMI.2021.122008Search in Google Scholar
[88] Kumar CJ, Das PR, Hazarika A. Autism spectrum disorder diagnosis and machine learning: a review. Int J Med Eng Inform. 2022;14(6):512–27.10.1504/IJMEI.2022.126522Search in Google Scholar
© 2023 the author(s), published by De Gruyter
This work is licensed under the Creative Commons Attribution 4.0 International License.
Articles in the same Issue
- Biomedical Sciences
- Systemic investigation of inetetamab in combination with small molecules to treat HER2-overexpressing breast and gastric cancers
- Immunosuppressive treatment for idiopathic membranous nephropathy: An updated network meta-analysis
- Identifying two pathogenic variants in a patient with pigmented paravenous retinochoroidal atrophy
- Effects of phytoestrogens combined with cold stress on sperm parameters and testicular proteomics in rats
- A case of pulmonary embolism with bad warfarin anticoagulant effects caused by E. coli infection
- Neutrophilia with subclinical Cushing’s disease: A case report and literature review
- Isoimperatorin alleviates lipopolysaccharide-induced periodontitis by downregulating ERK1/2 and NF-κB pathways
- Immunoregulation of synovial macrophages for the treatment of osteoarthritis
- Novel CPLANE1 c.8948dupT (p.P2984Tfs*7) variant in a child patient with Joubert syndrome
- Antiphospholipid antibodies and the risk of thrombosis in myeloproliferative neoplasms
- Immunological responses of septic rats to combination therapy with thymosin α1 and vitamin C
- High glucose and high lipid induced mitochondrial dysfunction in JEG-3 cells through oxidative stress
- Pharmacological inhibition of the ubiquitin-specific protease 8 effectively suppresses glioblastoma cell growth
- Levocarnitine regulates the growth of angiotensin II-induced myocardial fibrosis cells via TIMP-1
- Age-related changes in peripheral T-cell subpopulations in elderly individuals: An observational study
- Single-cell transcription analysis reveals the tumor origin and heterogeneity of human bilateral renal clear cell carcinoma
- Identification of iron metabolism-related genes as diagnostic signatures in sepsis by blood transcriptomic analysis
- Long noncoding RNA ACART knockdown decreases 3T3-L1 preadipocyte proliferation and differentiation
- Surgery, adjuvant immunotherapy plus chemotherapy and radiotherapy for primary malignant melanoma of the parotid gland (PGMM): A case report
- Dosimetry comparison with helical tomotherapy, volumetric modulated arc therapy, and intensity-modulated radiotherapy for grade II gliomas: A single‑institution case series
- Soy isoflavone reduces LPS-induced acute lung injury via increasing aquaporin 1 and aquaporin 5 in rats
- Refractory hypokalemia with sexual dysplasia and infertility caused by 17α-hydroxylase deficiency and triple X syndrome: A case report
- Meta-analysis of cancer risk among end stage renal disease undergoing maintenance dialysis
- 6-Phosphogluconate dehydrogenase inhibition arrests growth and induces apoptosis in gastric cancer via AMPK activation and oxidative stress
- Experimental study on the optimization of ANM33 release in foam cells
- Primary retroperitoneal angiosarcoma: A case report
- Metabolomic analysis-identified 2-hydroxybutyric acid might be a key metabolite of severe preeclampsia
- Malignant pleural effusion diagnosis and therapy
- Effect of spaceflight on the phenotype and proteome of Escherichia coli
- Comparison of immunotherapy combined with stereotactic radiotherapy and targeted therapy for patients with brain metastases: A systemic review and meta-analysis
- Activation of hypermethylated P2RY1 mitigates gastric cancer by promoting apoptosis and inhibiting proliferation
- Association between the VEGFR-2 -604T/C polymorphism (rs2071559) and type 2 diabetic retinopathy
- The role of IL-31 and IL-34 in the diagnosis and treatment of chronic periodontitis
- Triple-negative mouse breast cancer initiating cells show high expression of beta1 integrin and increased malignant features
- mNGS facilitates the accurate diagnosis and antibiotic treatment of suspicious critical CNS infection in real practice: A retrospective study
- The apatinib and pemetrexed combination has antitumor and antiangiogenic effects against NSCLC
- Radiotherapy for primary thyroid adenoid cystic carcinoma
- Design and functional preliminary investigation of recombinant antigen EgG1Y162–EgG1Y162 against Echinococcus granulosus
- Effects of losartan in patients with NAFLD: A meta-analysis of randomized controlled trial
- Bibliometric analysis of METTL3: Current perspectives, highlights, and trending topics
- Performance comparison of three scaling algorithms in NMR-based metabolomics analysis
- PI3K/AKT/mTOR pathway and its related molecules participate in PROK1 silence-induced anti-tumor effects on pancreatic cancer
- The altered expression of cytoskeletal and synaptic remodeling proteins during epilepsy
- Effects of pegylated recombinant human granulocyte colony-stimulating factor on lymphocytes and white blood cells of patients with malignant tumor
- Prostatitis as initial manifestation of Chlamydia psittaci pneumonia diagnosed by metagenome next-generation sequencing: A case report
- NUDT21 relieves sevoflurane-induced neurological damage in rats by down-regulating LIMK2
- Association of interleukin-10 rs1800896, rs1800872, and interleukin-6 rs1800795 polymorphisms with squamous cell carcinoma risk: A meta-analysis
- Exosomal HBV-DNA for diagnosis and treatment monitoring of chronic hepatitis B
- Shear stress leads to the dysfunction of endothelial cells through the Cav-1-mediated KLF2/eNOS/ERK signaling pathway under physiological conditions
- Interaction between the PI3K/AKT pathway and mitochondrial autophagy in macrophages and the leukocyte count in rats with LPS-induced pulmonary infection
- Meta-analysis of the rs231775 locus polymorphism in the CTLA-4 gene and the susceptibility to Graves’ disease in children
- Cloning, subcellular localization and expression of phosphate transporter gene HvPT6 of hulless barley
- Coptisine mitigates diabetic nephropathy via repressing the NRLP3 inflammasome
- Significant elevated CXCL14 and decreased IL-39 levels in patients with tuberculosis
- Whole-exome sequencing applications in prenatal diagnosis of fetal bowel dilatation
- Gemella morbillorum infective endocarditis: A case report and literature review
- An unusual ectopic thymoma clonal evolution analysis: A case report
- Severe cumulative skin toxicity during toripalimab combined with vemurafenib following toripalimab alone
- Detection of V. vulnificus septic shock with ARDS using mNGS
- Novel rare genetic variants of familial and sporadic pulmonary atresia identified by whole-exome sequencing
- The influence and mechanistic action of sperm DNA fragmentation index on the outcomes of assisted reproduction technology
- Novel compound heterozygous mutations in TELO2 in an infant with You-Hoover-Fong syndrome: A case report and literature review
- ctDNA as a prognostic biomarker in resectable CLM: Systematic review and meta-analysis
- Diagnosis of primary amoebic meningoencephalitis by metagenomic next-generation sequencing: A case report
- Phylogenetic analysis of promoter regions of human Dolichol kinase (DOLK) and orthologous genes using bioinformatics tools
- Collagen changes in rabbit conjunctiva after conjunctival crosslinking
- Effects of NM23 transfection of human gastric carcinoma cells in mice
- Oral nifedipine and phytosterol, intravenous nicardipine, and oral nifedipine only: Three-arm, retrospective, cohort study for management of severe preeclampsia
- Case report of hepatic retiform hemangioendothelioma: A rare tumor treated with ultrasound-guided microwave ablation
- Curcumin induces apoptosis in human hepatocellular carcinoma cells by decreasing the expression of STAT3/VEGF/HIF-1α signaling
- Rare presentation of double-clonal Waldenström macroglobulinemia with pulmonary embolism: A case report
- Giant duplication of the transverse colon in an adult: A case report and literature review
- Ectopic thyroid tissue in the breast: A case report
- SDR16C5 promotes proliferation and migration and inhibits apoptosis in pancreatic cancer
- Vaginal metastasis from breast cancer: A case report
- Screening of the best time window for MSC transplantation to treat acute myocardial infarction with SDF-1α antibody-loaded targeted ultrasonic microbubbles: An in vivo study in miniswine
- Inhibition of TAZ impairs the migration ability of melanoma cells
- Molecular complexity analysis of the diagnosis of Gitelman syndrome in China
- Effects of maternal calcium and protein intake on the development and bone metabolism of offspring mice
- Identification of winter wheat pests and diseases based on improved convolutional neural network
- Ultra-multiplex PCR technique to guide treatment of Aspergillus-infected aortic valve prostheses
- Virtual high-throughput screening: Potential inhibitors targeting aminopeptidase N (CD13) and PIKfyve for SARS-CoV-2
- Immune checkpoint inhibitors in cancer patients with COVID-19
- Utility of methylene blue mixed with autologous blood in preoperative localization of pulmonary nodules and masses
- Integrated analysis of the microbiome and transcriptome in stomach adenocarcinoma
- Berberine suppressed sarcopenia insulin resistance through SIRT1-mediated mitophagy
- DUSP2 inhibits the progression of lupus nephritis in mice by regulating the STAT3 pathway
- Lung abscess by Fusobacterium nucleatum and Streptococcus spp. co-infection by mNGS: A case series
- Genetic alterations of KRAS and TP53 in intrahepatic cholangiocarcinoma associated with poor prognosis
- Granulomatous polyangiitis involving the fourth ventricle: Report of a rare case and a literature review
- Studying infant mortality: A demographic analysis based on data mining models
- Metaplastic breast carcinoma with osseous differentiation: A report of a rare case and literature review
- Protein Z modulates the metastasis of lung adenocarcinoma cells
- Inhibition of pyroptosis and apoptosis by capsaicin protects against LPS-induced acute kidney injury through TRPV1/UCP2 axis in vitro
- TAK-242, a toll-like receptor 4 antagonist, against brain injury by alleviates autophagy and inflammation in rats
- Primary mediastinum Ewing’s sarcoma with pleural effusion: A case report and literature review
- Association of ADRB2 gene polymorphisms and intestinal microbiota in Chinese Han adolescents
- Tanshinone IIA alleviates chondrocyte apoptosis and extracellular matrix degeneration by inhibiting ferroptosis
- Study on the cytokines related to SARS-Cov-2 in testicular cells and the interaction network between cells based on scRNA-seq data
- Effect of periostin on bone metabolic and autophagy factors during tooth eruption in mice
- HP1 induces ferroptosis of renal tubular epithelial cells through NRF2 pathway in diabetic nephropathy
- Intravaginal estrogen management in postmenopausal patients with vaginal squamous intraepithelial lesions along with CO2 laser ablation: A retrospective study
- Hepatocellular carcinoma cell differentiation trajectory predicts immunotherapy, potential therapeutic drugs, and prognosis of patients
- Effects of physical exercise on biomarkers of oxidative stress in healthy subjects: A meta-analysis of randomized controlled trials
- Identification of lysosome-related genes in connection with prognosis and immune cell infiltration for drug candidates in head and neck cancer
- Development of an instrument-free and low-cost ELISA dot-blot test to detect antibodies against SARS-CoV-2
- Research progress on gas signal molecular therapy for Parkinson’s disease
- Adiponectin inhibits TGF-β1-induced skin fibroblast proliferation and phenotype transformation via the p38 MAPK signaling pathway
- The G protein-coupled receptor-related gene signatures for predicting prognosis and immunotherapy response in bladder urothelial carcinoma
- α-Fetoprotein contributes to the malignant biological properties of AFP-producing gastric cancer
- CXCL12/CXCR4/CXCR7 axis in placenta tissues of patients with placenta previa
- Association between thyroid stimulating hormone levels and papillary thyroid cancer risk: A meta-analysis
- Significance of sTREM-1 and sST2 combined diagnosis for sepsis detection and prognosis prediction
- Diagnostic value of serum neuroactive substances in the acute exacerbation of chronic obstructive pulmonary disease complicated with depression
- Research progress of AMP-activated protein kinase and cardiac aging
- TRIM29 knockdown prevented the colon cancer progression through decreasing the ubiquitination levels of KRT5
- Cross-talk between gut microbiota and liver steatosis: Complications and therapeutic target
- Metastasis from small cell lung cancer to ovary: A case report
- The early diagnosis and pathogenic mechanisms of sepsis-related acute kidney injury
- The effect of NK cell therapy on sepsis secondary to lung cancer: A case report
- Erianin alleviates collagen-induced arthritis in mice by inhibiting Th17 cell differentiation
- Loss of ACOX1 in clear cell renal cell carcinoma and its correlation with clinical features
- Signalling pathways in the osteogenic differentiation of periodontal ligament stem cells
- Crosstalk between lactic acid and immune regulation and its value in the diagnosis and treatment of liver failure
- Clinicopathological features and differential diagnosis of gastric pleomorphic giant cell carcinoma
- Traumatic brain injury and rTMS-ERPs: Case report and literature review
- Extracellular fibrin promotes non-small cell lung cancer progression through integrin β1/PTEN/AKT signaling
- Knockdown of DLK4 inhibits non-small cell lung cancer tumor growth by downregulating CKS2
- The co-expression pattern of VEGFR-2 with indicators related to proliferation, apoptosis, and differentiation of anagen hair follicles
- Inflammation-related signaling pathways in tendinopathy
- CD4+ T cell count in HIV/TB co-infection and co-occurrence with HL: Case report and literature review
- Clinical analysis of severe Chlamydia psittaci pneumonia: Case series study
- Bioinformatics analysis to identify potential biomarkers for the pulmonary artery hypertension associated with the basement membrane
- Influence of MTHFR polymorphism, alone or in combination with smoking and alcohol consumption, on cancer susceptibility
- Catharanthus roseus (L.) G. Don counteracts the ampicillin resistance in multiple antibiotic-resistant Staphylococcus aureus by downregulation of PBP2a synthesis
- Combination of a bronchogenic cyst in the thoracic spinal canal with chronic myelocytic leukemia
- Bacterial lipoprotein plays an important role in the macrophage autophagy and apoptosis induced by Salmonella typhimurium and Staphylococcus aureus
- TCL1A+ B cells predict prognosis in triple-negative breast cancer through integrative analysis of single-cell and bulk transcriptomic data
- Ezrin promotes esophageal squamous cell carcinoma progression via the Hippo signaling pathway
- Ferroptosis: A potential target of macrophages in plaque vulnerability
- Predicting pediatric Crohn's disease based on six mRNA-constructed risk signature using comprehensive bioinformatic approaches
- Applications of genetic code expansion and photosensitive UAAs in studying membrane proteins
- HK2 contributes to the proliferation, migration, and invasion of diffuse large B-cell lymphoma cells by enhancing the ERK1/2 signaling pathway
- IL-17 in osteoarthritis: A narrative review
- Circadian cycle and neuroinflammation
- Probiotic management and inflammatory factors as a novel treatment in cirrhosis: A systematic review and meta-analysis
- Hemorrhagic meningioma with pulmonary metastasis: Case report and literature review
- SPOP regulates the expression profiles and alternative splicing events in human hepatocytes
- Knockdown of SETD5 inhibited glycolysis and tumor growth in gastric cancer cells by down-regulating Akt signaling pathway
- PTX3 promotes IVIG resistance-induced endothelial injury in Kawasaki disease by regulating the NF-κB pathway
- Pancreatic ectopic thyroid tissue: A case report and analysis of literature
- The prognostic impact of body mass index on female breast cancer patients in underdeveloped regions of northern China differs by menopause status and tumor molecular subtype
- Report on a case of liver-originating malignant melanoma of unknown primary
- Case report: Herbal treatment of neutropenic enterocolitis after chemotherapy for breast cancer
- The fibroblast growth factor–Klotho axis at molecular level
- Characterization of amiodarone action on currents in hERG-T618 gain-of-function mutations
- A case report of diagnosis and dynamic monitoring of Listeria monocytogenes meningitis with NGS
- Effect of autologous platelet-rich plasma on new bone formation and viability of a Marburg bone graft
- Small breast epithelial mucin as a useful prognostic marker for breast cancer patients
- Continuous non-adherent culture promotes transdifferentiation of human adipose-derived stem cells into retinal lineage
- Nrf3 alleviates oxidative stress and promotes the survival of colon cancer cells by activating AKT/BCL-2 signal pathway
- Favorable response to surufatinib in a patient with necrolytic migratory erythema: A case report
- Case report of atypical undernutrition of hypoproteinemia type
- Down-regulation of COL1A1 inhibits tumor-associated fibroblast activation and mediates matrix remodeling in the tumor microenvironment of breast cancer
- Sarcoma protein kinase inhibition alleviates liver fibrosis by promoting hepatic stellate cells ferroptosis
- Research progress of serum eosinophil in chronic obstructive pulmonary disease and asthma
- Clinicopathological characteristics of co-existing or mixed colorectal cancer and neuroendocrine tumor: Report of five cases
- Role of menopausal hormone therapy in the prevention of postmenopausal osteoporosis
- Precisional detection of lymph node metastasis using tFCM in colorectal cancer
- Advances in diagnosis and treatment of perimenopausal syndrome
- A study of forensic genetics: ITO index distribution and kinship judgment between two individuals
- Acute lupus pneumonitis resembling miliary tuberculosis: A case-based review
- Plasma levels of CD36 and glutathione as biomarkers for ruptured intracranial aneurysm
- Fractalkine modulates pulmonary angiogenesis and tube formation by modulating CX3CR1 and growth factors in PVECs
- Novel risk prediction models for deep vein thrombosis after thoracotomy and thoracoscopic lung cancer resections, involving coagulation and immune function
- Exploring the diagnostic markers of essential tremor: A study based on machine learning algorithms
- Evaluation of effects of small-incision approach treatment on proximal tibia fracture by deep learning algorithm-based magnetic resonance imaging
- An online diagnosis method for cancer lesions based on intelligent imaging analysis
- Medical imaging in rheumatoid arthritis: A review on deep learning approach
- Predictive analytics in smart healthcare for child mortality prediction using a machine learning approach
- Utility of neutrophil–lymphocyte ratio and platelet–lymphocyte ratio in predicting acute-on-chronic liver failure survival
- A biomedical decision support system for meta-analysis of bilateral upper-limb training in stroke patients with hemiplegia
- TNF-α and IL-8 levels are positively correlated with hypobaric hypoxic pulmonary hypertension and pulmonary vascular remodeling in rats
- Stochastic gradient descent optimisation for convolutional neural network for medical image segmentation
- Comparison of the prognostic value of four different critical illness scores in patients with sepsis-induced coagulopathy
- Application and teaching of computer molecular simulation embedded technology and artificial intelligence in drug research and development
- Hepatobiliary surgery based on intelligent image segmentation technology
- Value of brain injury-related indicators based on neural network in the diagnosis of neonatal hypoxic-ischemic encephalopathy
- Analysis of early diagnosis methods for asymmetric dementia in brain MR images based on genetic medical technology
- Early diagnosis for the onset of peri-implantitis based on artificial neural network
- Clinical significance of the detection of serum IgG4 and IgG4/IgG ratio in patients with thyroid-associated ophthalmopathy
- Forecast of pain degree of lumbar disc herniation based on back propagation neural network
- SPA-UNet: A liver tumor segmentation network based on fused multi-scale features
- Systematic evaluation of clinical efficacy of CYP1B1 gene polymorphism in EGFR mutant non-small cell lung cancer observed by medical image
- Rehabilitation effect of intelligent rehabilitation training system on hemiplegic limb spasms after stroke
- A novel approach for minimising anti-aliasing effects in EEG data acquisition
- ErbB4 promotes M2 activation of macrophages in idiopathic pulmonary fibrosis
- Clinical role of CYP1B1 gene polymorphism in prediction of postoperative chemotherapy efficacy in NSCLC based on individualized health model
- Lung nodule segmentation via semi-residual multi-resolution neural networks
- Evaluation of brain nerve function in ICU patients with Delirium by deep learning algorithm-based resting state MRI
- A data mining technique for detecting malignant mesothelioma cancer using multiple regression analysis
- Markov model combined with MR diffusion tensor imaging for predicting the onset of Alzheimer’s disease
- Effectiveness of the treatment of depression associated with cancer and neuroimaging changes in depression-related brain regions in patients treated with the mediator-deuterium acupuncture method
- Molecular mechanism of colorectal cancer and screening of molecular markers based on bioinformatics analysis
- Monitoring and evaluation of anesthesia depth status data based on neuroscience
- Exploring the conformational dynamics and thermodynamics of EGFR S768I and G719X + S768I mutations in non-small cell lung cancer: An in silico approaches
- Optimised feature selection-driven convolutional neural network using gray level co-occurrence matrix for detection of cervical cancer
- Incidence of different pressure patterns of spinal cerebellar ataxia and analysis of imaging and genetic diagnosis
- Pathogenic bacteria and treatment resistance in older cardiovascular disease patients with lung infection and risk prediction model
- Adoption value of support vector machine algorithm-based computed tomography imaging in the diagnosis of secondary pulmonary fungal infections in patients with malignant hematological disorders
- From slides to insights: Harnessing deep learning for prognostic survival prediction in human colorectal cancer histology
- Ecology and Environmental Science
- Monitoring of hourly carbon dioxide concentration under different land use types in arid ecosystem
- Comparing the differences of prokaryotic microbial community between pit walls and bottom from Chinese liquor revealed by 16S rRNA gene sequencing
- Effects of cadmium stress on fruits germination and growth of two herbage species
- Bamboo charcoal affects soil properties and bacterial community in tea plantations
- Optimization of biogas potential using kinetic models, response surface methodology, and instrumental evidence for biodegradation of tannery fleshings during anaerobic digestion
- Understory vegetation diversity patterns of Platycladus orientalis and Pinus elliottii communities in Central and Southern China
- Studies on macrofungi diversity and discovery of new species of Abortiporus from Baotianman World Biosphere Reserve
- Food Science
- Effect of berrycactus fruit (Myrtillocactus geometrizans) on glutamate, glutamine, and GABA levels in the frontal cortex of rats fed with a high-fat diet
- Guesstimate of thymoquinone diversity in Nigella sativa L. genotypes and elite varieties collected from Indian states using HPTLC technique
- Analysis of bacterial community structure of Fuzhuan tea with different processing techniques
- Untargeted metabolomics reveals sour jujube kernel benefiting the nutritional value and flavor of Morchella esculenta
- Mycobiota in Slovak wine grapes: A case study from the small Carpathians wine region
- Elemental analysis of Fadogia ancylantha leaves used as a nutraceutical in Mashonaland West Province, Zimbabwe
- Microbiological transglutaminase: Biotechnological application in the food industry
- Influence of solvent-free extraction of fish oil from catfish (Clarias magur) heads using a Taguchi orthogonal array design: A qualitative and quantitative approach
- Chromatographic analysis of the chemical composition and anticancer activities of Curcuma longa extract cultivated in Palestine
- The potential for the use of leghemoglobin and plant ferritin as sources of iron
- Investigating the association between dietary patterns and glycemic control among children and adolescents with T1DM
- Bioengineering and Biotechnology
- Biocompatibility and osteointegration capability of β-TCP manufactured by stereolithography 3D printing: In vitro study
- Clinical characteristics and the prognosis of diabetic foot in Tibet: A single center, retrospective study
- Agriculture
- Biofertilizer and NPSB fertilizer application effects on nodulation and productivity of common bean (Phaseolus vulgaris L.) at Sodo Zuria, Southern Ethiopia
- On correlation between canopy vegetation and growth indexes of maize varieties with different nitrogen efficiencies
- Exopolysaccharides from Pseudomonas tolaasii inhibit the growth of Pleurotus ostreatus mycelia
- A transcriptomic evaluation of the mechanism of programmed cell death of the replaceable bud in Chinese chestnut
- Melatonin enhances salt tolerance in sorghum by modulating photosynthetic performance, osmoregulation, antioxidant defense, and ion homeostasis
- Effects of plant density on alfalfa (Medicago sativa L.) seed yield in western Heilongjiang areas
- Identification of rice leaf diseases and deficiency disorders using a novel DeepBatch technique
- Artificial intelligence and internet of things oriented sustainable precision farming: Towards modern agriculture
- Animal Sciences
- Effect of ketogenic diet on exercise tolerance and transcriptome of gastrocnemius in mice
- Combined analysis of mRNA–miRNA from testis tissue in Tibetan sheep with different FecB genotypes
- Isolation, identification, and drug resistance of a partially isolated bacterium from the gill of Siniperca chuatsi
- Tracking behavioral changes of confined sows from the first mating to the third parity
- The sequencing of the key genes and end products in the TLR4 signaling pathway from the kidney of Rana dybowskii exposed to Aeromonas hydrophila
- Development of a new candidate vaccine against piglet diarrhea caused by Escherichia coli
- Plant Sciences
- Crown and diameter structure of pure Pinus massoniana Lamb. forest in Hunan province, China
- Genetic evaluation and germplasm identification analysis on ITS2, trnL-F, and psbA-trnH of alfalfa varieties germplasm resources
- Tissue culture and rapid propagation technology for Gentiana rhodantha
- Effects of cadmium on the synthesis of active ingredients in Salvia miltiorrhiza
- Cloning and expression analysis of VrNAC13 gene in mung bean
- Chlorate-induced molecular floral transition revealed by transcriptomes
- Effects of warming and drought on growth and development of soybean in Hailun region
- Effects of different light conditions on transient expression and biomass in Nicotiana benthamiana leaves
- Comparative analysis of the rhizosphere microbiome and medicinally active ingredients of Atractylodes lancea from different geographical origins
- Distinguish Dianthus species or varieties based on chloroplast genomes
- Comparative transcriptomes reveal molecular mechanisms of apple blossoms of different tolerance genotypes to chilling injury
- Study on fresh processing key technology and quality influence of Cut Ophiopogonis Radix based on multi-index evaluation
- An advanced approach for fig leaf disease detection and classification: Leveraging image processing and enhanced support vector machine methodology
- Erratum
- Erratum to “Protein Z modulates the metastasis of lung adenocarcinoma cells”
- Erratum to “BRCA1 subcellular localization regulated by PI3K signaling pathway in triple-negative breast cancer MDA-MB-231 cells and hormone-sensitive T47D cells”
- Retraction
- Retraction to “Protocatechuic acid attenuates cerebral aneurysm formation and progression by inhibiting TNF-alpha/Nrf-2/NF-kB-mediated inflammatory mechanisms in experimental rats”