Association of interleukin-10 rs1800896, rs1800872, and interleukin-6 rs1800795 polymorphisms with squamous cell carcinoma risk: A meta-analysis
-
Zhenxia Wei
 and
Xuanping Huang
and
Xuanping Huang

Abstract
The relationship between interleukin (IL)-10 and IL-6 gene polymorphisms and squamous cell carcinoma (SCC) has been demonstrated but with inconsistent conclusions. The aim of this study was to evaluate the potential associations of IL gene polymorphisms and the SCC risk. PubMed, Cochrane Library, Web of Science, China National Knowledge Infrastructure, China Biomedical Database, WanFang, and China Science and Technology Journal Database databases were searched for articles reporting the correlations of IL-10 and IL-6 gene polymorphisms with the SCC risk. Odds ratio and 95% confidence interval were calculated using Stata Version 11.2. Meta-regression, sensitivity, and publication bias were analyzed. False-positive reporting probability and Bayesian measure of the false-discovery probability were used to explore the credibility of the calculation. Twenty-three articles were included. The IL-10 rs1800872 polymorphism showed a significant correlation with the SCC risk in the overall analysis. Studies pooled by ethnicity revealed that the IL-10 rs1800872 polymorphism reduced the SCC risk in the Caucasian population. The results of this study suggest that the IL-10 rs1800872 polymorphism may confer a genetic susceptibility to SCC, particularly oral SCC, in Caucasians. However, the IL-10 rs1800896 or IL-6 rs1800795 polymorphism was not significantly associated with the SCC risk.
1 Introduction
Cancer is a leading cause of death worldwide. According to the 2019 World Health Organization estimates, cancer was the leading cause of death in 112 of 183 countries and may surpass cardiovascular disease as the leading cause of death in many countries [1]. Squamous cell carcinoma (SCC) is a malignant tumor that arises in tissues and organs covered by the squamous epithelium, including the skin, oral cavity, esophagus, cervix, vagina, bronchus, urinary bladder, and renal pelvis [2–4]. Currently, combination therapy is the most common treatment modality for SCC [5,6]. Regardless of the treatment modality, patients develop severe scarring, increasing their financial burden and mental stress [7–9]. Extensive epidemiological and molecular biology studies have shown that chronic inflammation, unhealthy lifestyle, viral infections, and many other risk factors increase the SCC risk [10–12]; however, the specific role of these factors in tumor development has not been elucidated.
Processes such as inflammatory cell infiltration and malignant cell metastasis are common in cancer. Cytokines might play a critical role in these processes. Interleukin (IL) is an immunomodulatory cytokine involved in cell proliferation and apoptosis that can promote tumor immune escape and accelerate the progression of malignant tumors by inhibiting the anti-tumor immune response in the tumor microenvironment [13]. T-helper cytokines are utilized by IL-10 to regulate the growth and differentiation of natural immune cells, keratinocytes, and endothelial cells and inhibit the activation and effector functions of T cells [14]. IL-6 can participate in the differentiation regulation of B cells and promote the release of antibodies by B cells. It can be produced and secreted by tumor cells, involved in the proliferation and differentiation of malignant tumor cells, and expressed at high levels in serum and tumor tissues of most cancers [15]. IL-10 and IL-6 genes are located on chromosomes 10 and 7, respectively, and polymorphic in the region where the gene begins transcription. In recent years, the relationship between IL-10 and IL-6 gene polymorphisms and cancer have attracted great attention. Gene polymorphisms are closely related to changes in the IL expression level, leading to the occurrence of many cancers. Gene polymorphisms in the IL-10 and IL-6 promoter regions might affect the expression of gene-encoded proteins associated with the risk and prognosis of SCC [16,17]. The correlations of IL-10 rs1800896(-1082) and rs1800872(-592) and IL-6 rs1800795(-174) promoter-region polymorphisms with the SCC risk have been extensively studied. The polymorphisms are located near the transcription factor binding site and related to the pathogenesis of SCC, including cervical SCC [18]. However, the study results have been inconclusive and inconsistent [19,20].
The advantage of meta-analyses is reduction in random errors through quantitative and comprehensive analyses of all eligible research data. To date, no studies have focused on the correlations of IL-10 or IL-6 gene polymorphisms with the SCC risk. Therefore, the aim of this meta-analysis was to clarify the correlations of the IL-10 rs1800896 and rs1800872 and IL-6 rs1800795 gene polymorphisms with the SCC risk, including subgroup analyses by ethnicity, control source, and cancer type. The risk assessment was expected to be more detailed and accurate compared to previous studies. At the same time to provide ideas for cancer prevention and clinical treatment.
2 Materials and methods
2.1 Literature search
We extracted articles reporting the correlations of IL-10 rs1800896 and rs1800872 and IL-6 rs1800795 gene polymorphisms with the SCC risk from PubMed, Cochrane Library, Web of Science, China National Knowledge Infrastructure, China Biomedical Database, WanFang, and China Science and Technology Journal Database databases. The search terms were (“Interleukin-10” OR “IL-10” OR “IL10”) (“Interleukin-6” OR “IL-6” OR “IL6”) AND (“squamous cell carcinoma” OR “squamous cancer” OR “squamous cell tumor”) AND (“polymorphism” OR “genetic polymorphism” OR “polymorphisms”). Moreover, references of relevant studies, including meta-analyses, were searched manually to screen more studies for inclusion. We limited our search to human studies and did not specify any minimum number of cases or controls required or the year of publication. Articles published in English or Chinese were likely to be included.
2.2 Inclusion and exclusion criteria
Inclusion criteria were (1) case–control study reporting the associations of rs1800896, rs1800872, and rs1800795 polymorphisms in the promoter regions of IL-10 and IL-6 genes with the SCC risk, (2) information available regarding the distribution of cases and controls, allowing calculation of the odds ratio (OR) with 95% confidence interval (CI), and (3) full text available without duplication. Exclusion criteria were (1) original study design other than case–control or study without genotype data, (2) cancer not specified as SCC, (3) case report, (4) non-human study, (5) review (including meta-analysis), and (6) duplicate or overlapping data.
2.3 Study design and extracted information
We extracted the following information: surname of the first author, date of publication, country, participants’ ethnicity (Asian, Caucasian, or mixed descent), control source (population-, or hospital-based), cancer type (e.g., oral SCC), sample sizes of case and control groups, and detailed data on the genetics and genotyping of case and control studies. Two investigators (Z.W. and X.S.) independently extracted information based on the constituted standards, and a third investigator (Q.H.) reviewed the information. Disagreements were resolved through a discussion among the three investigators, ensuring more accurate data extraction. Investigators selected studies by reviewing the abstracts and full text based on the aforementioned eligibility criteria. We manually searched the references in selected studies, including meta-analyses, to screen more studies for inclusion. Among similar studies, those with the largest sample size or most recent publication were selected.
2.4 Statistical analysis
The correlations of IL-10 rs1800896 and rs1800872 and IL-6 rs1800795 gene polymorphisms with the SCC risk were estimated using 95% CI and OR. The significance of OR was determined with the z-test. A p-value <0.05 was set to indicate statistical significance. The combined OR was evaluated using four genetic models, including homozygote comparison (GG/AA; CC/AA; CC/GG), heterozygote comparison (AG/AA; AC/AA; GC/GG), dominant (AG + GG/AA; AC + CC/AA; GC + CC/GG), and recessive (GG/AA + AG; CC/AA + AC; CC/GG + GC) models in IL-10 rs1800896 and rs1800872 and IL-6 rs1800795. Subgroup analyses were conducted by cancer type, ethnicity, and control source. I 2 statistics were used to evaluate the heterogeneity among studies. Studies were homogenous at I 2 < 50%, and the fixed-effects model was used to combine the OR and 95% CI; otherwise, the random-effects model was used.
The occurrence of publication bias was determined with Egger’s and Begg’s tests. Stata version 11.2 (Stata Corporation, College Station, TX) was used, with the significance level set as a bilateral α of 0.05. A p-value <0.05 was considered to indicate publication bias.
Three predefined sources of heterogeneity were detected using meta-regression analyses: publication year, ethnicity, and control source. The rationality of the meta-analysis results was checked with sensitivity analyses. Excluding one study each time and combining the remaining studies revealed no substantial changes in the corresponding combined OR; thus, our results were considered to be statistically robust. In addition, the false-positive reporting probability (FPRP) was evaluated. We confirmed a FPRP <0.2 and appointed prior probabilities of 0.25, 0.1, 0.01, 0.001, and 0.0001 to examine an OR of 1.5 associated with the SCC risk. The results were significant at FPRP <0.2 [21]. The Bayesian measure of false-discovery probability (BFDP) was estimated using Excel computed tables to evaluate the reliability of the statistically significant associations [22]. The results were significant at BFDP <0.8.
3 Results
3.1 Study characteristics
After applying the eligibility criteria, 222 articles were retrieved. After reading the titles and abstracts, 154 articles were excluded for reasons such as irrelevant study topic, meta-analysis or review design, and Greek language. After reviewing the full text of the remaining 67 articles, 44 articles without genotypic data of patients with SCC were excluded. Finally, 23 articles met all requirements for inclusion in this study. Figure 1 shows a flowchart of the study selection process.
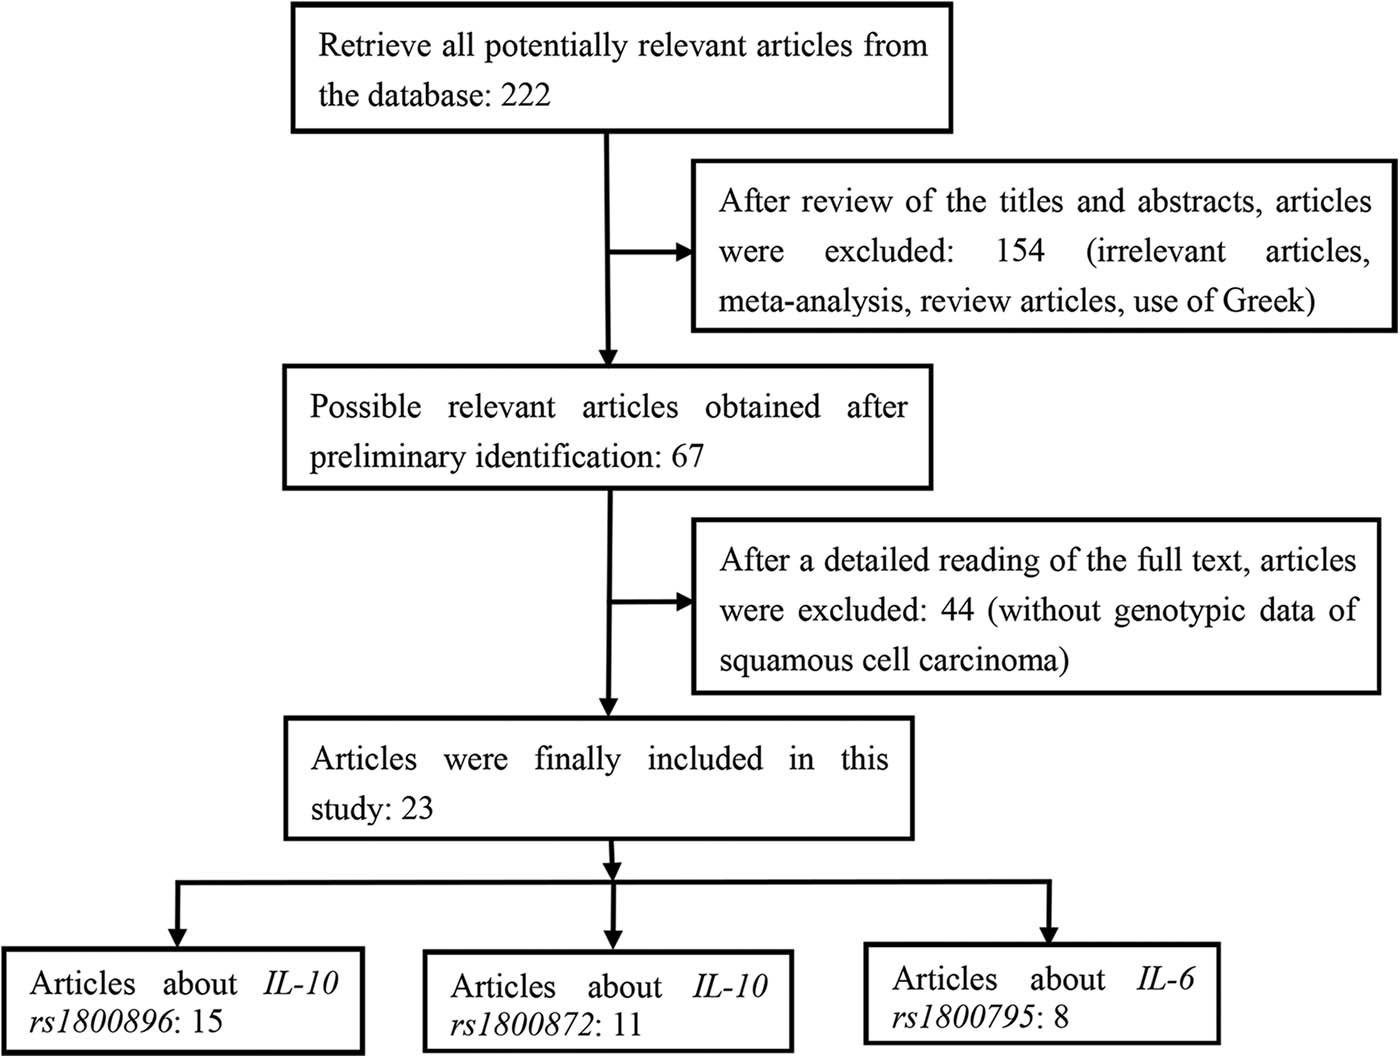
Whole flow diagram of the study selection process.
Fifteen studies, involving 3,311 cases and 4,756 controls, investigated the association of the IL-10 rs1800896 polymorphism with the SCC risk [16,19,20,23–34]. Eleven studies, involving 3,069 cases and 4,265 controls, investigated the association of the IL-10 rs1800872 polymorphism with the SCC risk [16,20,24,26,27,29,30,34–37]. Eight studies, involving 1,315 cases and 1,905 controls, investigated the association of the IL-6 rs1800795 polymorphism with the SCC risk [20,33,38–43]. Nine and six of the 15 included studies on IL-10 rs1800896 involved the Caucasian and Asian ethnicities, respectively. Control sources were hospital-based in six studies and population-based in nine studies. A total of six cancer types were reported. Oral and cervical SCC were reported in five and three articles, respectively. Lung, head and neck, laryngeal, and esophageal SCC were reported in one article each. Table 1 shows the characteristics of the included studies on IL-10 rs1800896.
Characteristics of included case–control studies on IL-10 rs1800896 polymorphism and squamous cell carcinoma
| No. | Author | Year | Ethnicity | Country | Cancer type | Source of control | Sample size of case | Sample size of control | Genotype distribution | MAF | Genotyping method | |||||
|---|---|---|---|---|---|---|---|---|---|---|---|---|---|---|---|---|
| Case | Control | |||||||||||||||
| AA | AG | GG | AA | AG | GG | |||||||||||
| 1 | Pasvenskaite et al. | 2021 | Caucsian | Lithuania | Laryngeal SCC | HB | 300 | 533 | 70 | 163 | 67 | 148 | 269 | 116 | 0.48 | PCR |
| 2 | Mao et al. | 2021 | Asian | China | Oral SCC | HB | 125 | 110 | 109 | 16 | 0 | 98 | 12 | 0 | 0.06 | PCR |
| 3 | Chen et al. | 2020 | Asian | China | Esophageal SCC | HB | 721 | 1,208 | 625 | 84 | 4 | 1,061 | 136 | 4 | 0.06 | PCR |
| 4 | Goud et al. | 2019 | Asian | Malaysia | Oral SCC | PB | 41 | 48 | 37 | 4 | 0 | 39 | 9 | 0 | 0.07 | PCR-RFLP |
| 5 | Sharma et al. | 2018 | Caucsian | India | Oral SCC | PB | 100 | 150 | 51 | 36 | 13 | 100 | 50 | 0 | 0.22 | PCR |
| 6 | Hussain et al. | 2016 | Caucsian | India | Oral SCC | HB | 232 | 221 | 69 | 158 | 5 | 127 | 93 | 1 | 0.29 | PCR-RFLP |
| 7 | Torres-Poveda et al. | 2016 | Caucsian | Mexico | Cervical SCC | PB | 200 | 200 | 121 | 70 | 9 | 110 | 78 | 12 | 0.24 | PCR |
| 8 | Zhou et al. | 2014 | Asian | China | Laryngeal SCC | PB | 146 | 119 | 115 | 26 | 5 | 107 | 11 | 1 | 0.09 | PCR-RFLP |
| 9 | Torres-Poveda et al. | 2012 | Caucsian | Mexico | Cervical SCC | HB | 204 | 166 | 125 | 66 | 13 | 92 | 62 | 12 | 0.24 | PCR |
| 10 | Jeong et al. | 2010 | Asian | Korea | Head and neck SCC | HB | 290 | 358 | 238 | 38 | 2 | 304 | 45 | 1 | 0.07 | PCR |
| 11 | Vairaktaris et al. | 2008 | Caucsian | Greece and Germany | Oral SCC | PB | 144 | 141 | 46 | 96 | 2 | 81 | 60 | 0 | 0.28 | PCR |
| 12 | Guo et al. | 2005 | Asian | China | Esophageal SCC | PB | 203 | 443 | 117 | 81 | 5 | 267 | 164 | 12 | 0.22 | PCR-RFLP |
| 13 | Zoodsma et al. | 2005 | Caucsian | Holland | Cervical SCC | PB | 512 | 606 | 121 | 242 | 149 | 130 | 307 | 169 | 0.47 | PCR |
| 14 | Seifart et al. | 2005 | Caucsian | Germany | Lung SCC | PB | 40 | 243 | 13 | 17 | 10 | 86 | 115 | 42 | 0.42 | PCR |
| 15 | El-Omar et al. | 2003 | Caucsian | United States | Esophageal SCC | PB | 53 | 210 | 16 | 28 | 9 | 59 | 103 | 48 | 0.47 | PCR-TaqMan |
Abbreviations: PB, population-based; HB, hospital-based; SCC, squamous cell carcinoma; MAF, minor allele frequency.
Seven and four of the 11 included studies on IL-10 rs1800872 involved the Caucasian and Asian populations, respectively. Control sources were population-based in six studies and hospital-based in five studies. A total of four cancer types were reported. Esophageal, cervical, oral, and lung SCC were reported in four, three, two, and two articles, respectively. Table 2 shows the characteristics of the included studies on IL-10 rs1800872.
Characteristics of included case–control studies on IL-10 rs1800872 polymorphism and squamous cell carcinoma
| No. | Author | Year | Ethnicity | Country | Cancer type | Source of control | Sample size of case | Sample size of control | Genotype distribution | MAF | Genotyping method | |||||
|---|---|---|---|---|---|---|---|---|---|---|---|---|---|---|---|---|
| Case | Control | |||||||||||||||
| AA | AC | CC | AA | AC | CC | |||||||||||
| 1 | Pasvenskaite et al. | 2021 | Caucsian | Lithuania | Laryngeal SCC | HB | 300 | 533 | 21 | 102 | 177 | 33 | 179 | 321 | 0.23 | PCR |
| 2 | Chen et al. | 2020 | Asian | China | Esophageal SCC | HB | 721 | 1,208 | 349 | 301 | 65 | 550 | 523 | 128 | 0.31 | PCR |
| 3 | Sharma et al. | 2018 | Caucsian | India | Oral SCC | PB | 100 | 150 | 25 | 54 | 21 | 18 | 88 | 44 | 0.47 | PCR |
| 4 | Torres-Poveda et al. | 2016 | Caucsian | Mexico | Cervical SCC | HB | 200 | 200 | 58 | 98 | 44 | 30 | 85 | 85 | 0.47 | PCR |
| 5 | Singh et al. | 2017 | Caucsian | India | Oral SCC | PB | 250 | 250 | 39 | 168 | 43 | 14 | 173 | 63 | 0.45 | PCR-RFLP |
| 6 | Zhou et al. | 2014 | Asian | China | Laryngeal SCC | PB | 146 | 119 | 63 | 70 | 13 | 64 | 39 | 16 | 0.32 | PCR-RFLP |
| 7 | Sun et al. | 2013 | Asian | China | Esophageal SCC | HB | 380 | 380 | 162 | 163 | 31 | 191 | 141 | 33 | 0.28 | PCR |
| 8 | Torres-Poveda et al. | 2012 | Caucsian | Mexico | Cervical SCC | HB | 204 | 166 | 49 | 105 | 50 | 30 | 70 | 66 | 0.45 | PCR |
| 9 | Wang et al. | 2006 | Asian | China | Esophageal SCC | PB | 203 | 443 | 95 | 88 | 20 | 182 | 196 | 65 | 0.35 | PCR-RFLP |
| 10 | Zoodsma et al. | 2005 | Caucsian | Holland | Cervical SCC | PB | 512 | 606 | 25 | 172 | 300 | 26 | 175 | 405 | 0.20 | PCR |
| 11 | El-Omar et al. | 2003 | Caucsian | United States | Esophageal SCC | PB | 53 | 210 | 3 | 15 | 35 | 13 | 70 | 127 | 0.22 | PCR-TaqMan |
Abbreviations: PB, population-based; HB, hospital-based; SCC, squamous cell carcinoma; MAF, minor allele frequency.
Six and two of the nine included studies on IL-6 rs1800795 involved the Caucasian and Asian populations, respectively. Control sources were population-based in six studies and hospital-based in two studies. A total of five cancer types were reported. Oral and laryngeal cancer were reported in three and two articles, respectively. Lung, cervical, and esophageal SCC were reported in article each. Table 3 shows the characteristics of the included studies on IL-6 rs1800795.
Characteristics of included case–control studies on IL-10 rs1800795 polymorphism and squamous cell carcinoma
| No. | Author | Year | Ethnicity | Country | Cancer type | Source of control | Sample size of case | Sample size of control | Genotype distribution | MAF | Genotyping method | |||||
|---|---|---|---|---|---|---|---|---|---|---|---|---|---|---|---|---|
| Case | Control | |||||||||||||||
| GG | GC | CC | GG | GC | CC | |||||||||||
| 1 | Pasvenskaite et al. | 2020 | Caucsian | Lithuania | Laryngeal SCC | HB | 352 | 538 | 69 | 182 | 102 | 132 | 261 | 145 | 0.47 | PCR |
| 2 | Candan Demiröz Abakay | 2020 | Caucsian | Turkey | Laryngeal SCC | PB | 80 | 50 | 38 | 31 | 11 | 29 | 15 | 5 | 0.30 | PCR |
| 3 | Fernández-Mateos et al. | 2019 | Caucsian | Spanish | Oral SCC | PB | 70 | 70 | 12 | 33 | 25 | 8 | 23 | 39 | 0.34 | PCR |
| 4 | Shi et al. | 2014 | Asian | China | Cervical SCC | HB | 418 | 518 | 131 | 201 | 86 | 181 | 259 | 78 | 0.42 | PCR-RFLP |
| 5 | Gaur et al. | 2011 | Asian | India | Oral SCC | PB | 140 | 120 | 98 | 35 | 7 | 65 | 41 | 14 | 0.23 | PCR-RFLP |
| 6 | Vairaktaris et al. | 2008 | Caucsian | Greece and Germany | Oral SCC | PB | 162 | 156 | 42 | 102 | 18 | 90 | 60 | 6 | 0.33 | PCR |
| 7 | Seifart et al. | 2005 | Caucsian | Germany | Lung SCC | PB | 40 | 243 | 17 | 19 | 4 | 90 | 107 | 46 | 0.40 | PCR |
| 8 | El-Omar et al. | 2003 | Caucsian | United States | Esophageal SCC | PB | 53 | 210 | 13 | 6 | 5 | 83 | 98 | 28 | 0.32 | PCR-TaqMan |
Abbreviations: PB, population-based; HB, hospital-based; SCC, squamous cell carcinoma; MAF, minor allele frequency.
3.2 Quantitative synthesis
Table 4 shows the relationship between the IL-10 rs1800896 gene polymorphism and the SCC risk. Data of 15 studies combined and analyzed according to four models revealed no significant association between the IL-10 rs1800896 gene polymorphism and the SCC risk (GG/AA: OR = 1.18, 95% CI: 0.96–1.45, p = 0.109; AG/AA: OR = 1.27, 95% CI: 0.99–1.61, p = 0.057; AG + GG/AA: OR = 1.27, 95% CI: 0.99–1.61, p = 0.057; GG/AA + AG: OR = 1.14, 95% CI: 0.96–1.35, p = 0.149; Figure 2). Subgroup analyses by ethnicity and control source revealed no significant correlation between the IL-10 rs800896 gene polymorphism and the SCC risk in any model. The subgroup analysis by cancer type revealed that the IL-10 rs1800896 gene polymorphism significantly increased the oral SCC risk in all four models (GG/AA: OR = 19.09, 95% CI: 4.48–81.45, p = 0.000; AG/AA: OR = 1.76, 95% CI: 1.05–2.95, p = 0.045; AG + GG/AA: OR = 1.94, 95% CI: 1.21–3.13, p = 0.006; GG/AA + AG: OR = 12.70, 95% CI: 3.09–52.16, p = 0.000). In addition, the IL-10 rs1800896 gene polymorphism increased the risk of laryngeal SCC (AG/AA: OR = 1.41, 95% CI: 1.04–1.93, p = 0.030), esophageal SCC (AG + GG/AA: OR = 0.48, 95% CI: 0.32–0.72, p = 0.000). Two gene models (AG/AA: I 2 = 74.10%, p = 0.000; AG + GG/AA: I 2 = 76.80%, p = 0.000). No positive results were found other than those aforementioned.
Stratified analyses of the IL-10 rs1800896 polymorphism on squamous cell carcinoma risk
| Comparative model | No. | Z | p | OR (95% CI) | Heterogeneity | Z | Begg's test | t | Egger's test | FPRP p-value | FPRP statistical power | FPRP prior probability | BEDP prior probability | ||||||||
|---|---|---|---|---|---|---|---|---|---|---|---|---|---|---|---|---|---|---|---|---|---|
| Heterogeneity chi-squared | p | I 2 | 0.25 | 0.10 | 0.01 | 0.001 | 0.0001 | 0.010 | 0.001 | 0.000 | |||||||||||
| GG/AA | |||||||||||||||||||||
| Overall | 15 | 1.60 | 0.109 | 1.182(0.963–1.451) | 20.09 | 0.065 | 40.30% | 2.99 | 0.003 | 2.78 | 0.018 | 0.110 | 0.989 | 0.250 | 0.500 | 0.917 | 0.991 | 0.999 | 0.994 | 0.999 | 1.000 |
| Ethnicity | |||||||||||||||||||||
| Caucasian | 9 | 0.72 | 0.470 | 1.166(0.769–1.769) | 17.35 | 0.027 | 53.90% | 1.56 | 0.118 | 2.04 | 0.080 | 0.470 | 0.882 | 0.615 | 0.828 | 0.981 | 0.998 | 1.000 | 0.996 | 1.000 | 1.000 |
| Asian | 6 | 1.25 | 0.212 | 1.571(0.773–3.191) | 1.99 | 0.575 | 0.00% | 1.02 | 0.308 | 3.09 | 0.091 | 0.212 | 0.449 | 0.586 | 0.809 | 0.979 | 0.998 | 1.000 | 0.991 | 0.999 | 1.000 |
| Source of control | |||||||||||||||||||||
| HB | 6 | 1.36 | 0.175 | 1.269(0.899–1.792) | 4.94 | 0.293 | 19.10% | 1.22 | 0.221 | 1.33 | 0.276 | 0.176 | 0.829 | 0.389 | 0.657 | 0.955 | 0.995 | 1.000 | 0.993 | 0.999 | 1.000 |
| PB | 9 | 0.71 | 0.477 | 1.214(0.711–2.073) | 14.52 | 0.043 | 51.80% | 1.86 | 0.063 | 2.21 | 0.069 | 0.477 | 0.781 | 0.647 | 0.846 | 0.984 | 0.998 | 1.000 | 0.995 | 0.999 | 1.000 |
| Cancer types | |||||||||||||||||||||
| Laryngeal SCC | 2 | 1.29 | 0.195 | 1.305(0.872–1.951) | 1.43 | 0.233 | 29.80% | 0.00 | 1.000 | . | . | 0.194 | 0.751 | 0.437 | 0.700 | 0.962 | 0.996 | 1.000 | 0.993 | 0.999 | 1.000 |
| Oral SCC | 5 | 3.98 | 0.000 | 19.093(4.475–81.451) | 1.17 | 0.556 | 0.00% | 0.00 | 1.000 | 0.44 | 0.734 | 0.000 | 0.000 | 0.408 | 0.674 | 0.958 | 0.996 | 1.000 | 0.873 | 0.986 | 1.000 |
| Cervical SCC | 3 | 0.74 | 0.459 | 0.896(0.670–1.199) | 0.54 | 0.765 | 0.00% | 1.04 | 0.296 | −3.59 | 0.173 | 0.460 | 0.977 | 0.586 | 0.809 | 0.979 | 0.998 | 1.000 | 0.997 | 1.000 | 1.000 |
| Esophageal SCC | 3 | 0.29 | 0.771 | 0.913(0.495–1.686) | 1.14 | 0.566 | 0.00% | 1.04 | 0.296 | 44.50 | 0.014 | 0.771 | 0.842 | 0.733 | 0.889 | 0.989 | 0.999 | 1.000 | 0.995 | 0.999 | 1.000 |
| Genotyping method | |||||||||||||||||||||
| PCR | 10 | 1.42 | 0.157 | 1.171(0.941–1.458) | 13.47 | 0.097 | 40.60% | 2.19 | 0.029 | 2.240 | 0.06 | 0.158 | 0.987 | 0.325 | 0.591 | 0.941 | 0.994 | 0.999 | 0.995 | 0.999 | 1.000 |
| PCR-RFLP | 4 | 1.29 | 0.199 | 2.670(0.597–11.936) | 4.38 | 0.112 | 54.30% | 1.04 | 0.296 | 4.690 | 0.134 | 0.199 | 0.225 | 0.726 | 0.888 | 0.989 | 0.999 | 1.000 | 0.989 | 0.999 | 1.000 |
| AG/AA | |||||||||||||||||||||
| Overall | 15 | 1.68 | 0.094 | 1.226(0.990–1.556) | 54.14 | 0.000 | 74.10% | 0.40 | 0.692 | 0.27 | 0.792 | 0.094 | 0.951 | 0.228 | 0.470 | 0.907 | 0.990 | 0.999 | 0.992 | 0.999 | 1.000 |
| Ethnicity | |||||||||||||||||||||
| Caucasian | 9 | 1.31 | 0.190 | 1.277(0.886–1.840) | 48.04 | 0.000 | 83.30% | 0.31 | 0.754 | 0.28 | 0.790 | 0.189 | 0.806 | 0.414 | 0.679 | 0.959 | 0.996 | 1.000 | 0.993 | 0.999 | 1.000 |
| Asian | 6 | 1.17 | 0.243 | 1.116(0.928–1.342) | 5.18 | 0.395 | 3.40% | 0.00 | 1.000 | 0.11 | 0.921 | 0.243 | 0.999 | 0.422 | 0.687 | 0.960 | 0.996 | 1.000 | 0.997 | 1.000 | 1.000 |
| Source of control | |||||||||||||||||||||
| HB | 6 | 1.23 | 0.220 | 1.282(0.862–1.905) | 27.41 | 0.000 | 81.80% | 0.00 | 1.000 | 0.01 | 0.991 | 0.219 | 0.781 | 0.457 | 0.716 | 0.965 | 0.996 | 1.000 | 0.993 | 0.999 | 1.000 |
| PB | 9 | 1.06 | 0.291 | 1.183(0.866–1.616) | 25.35 | 0.001 | 68.40% | 0.10 | 0.917 | 0.49 | 0.638 | 0.291 | 0.932 | 0.484 | 0.737 | 0.969 | 0.997 | 1.000 | 0.995 | 1.000 | 1.000 |
| Cancer types | |||||||||||||||||||||
| Laryngeal SCC | 2 | 2.17 | 0.030 | 1.414(1.035–1.931) | 1.64 | 0.201 | 39.00% | 0.00 | 1.000 | . | . | 0.029 | 0.645 | 0.120 | 0.291 | 0.818 | 0.978 | 0.998 | 0.976 | 0.998 | 1.000 |
| Oral SCC | 5 | 2.12 | 0.034 | 1.757(1.045–2.954) | 14.70 | 0.005 | 72.80% | 1.71 | 0.086 | −3.83 | 0.031 | 0.033 | 0.275 | 0.267 | 0.523 | 0.923 | 0.992 | 0.999 | 0.973 | 0.997 | 1.000 |
| Cervical SCC | 3 | 1.79 | 0.073 | 0.823(0.666–1.018) | 0.09 | 0.958 | 0.00% | 1.04 | 0.296 | −2.96 | 0.207 | 0.073 | 0.974 | 0.183 | 0.401 | 0.881 | 0.987 | 0.999 | 0.991 | 0.999 | 1.000 |
| Esophageal SCC | 3 | 0.65 | 0.513 | 1.073(0.869–1.325) | 0.14 | 0.932 | 0.00% | 0.00 | 1.000 | −0.36 | 0.782 | 0.513 | 0.999 | 0.606 | 0.822 | 0.981 | 0.988 | 1.000 | 0.998 | 1.000 | 1.000 |
| Genotyping method | |||||||||||||||||||||
| PCR | 10 | 0.98 | 0.325 | 1.119(0.894–1.400) | 23.43 | 0.005 | 61.60% | 0.89 | 0.371 | 0.79 | 0.455 | 0.325 | 0.995 | 0.495 | 0.746 | 0.970 | 0.997 | 1.000 | 0.997 | 1.000 | 1.000 |
| PCR-RFLP | 4 | 1.22 | 0.222 | 1.555(0.766–3.158) | 19.37 | 0.000 | 84.50% | −0.34 | 1.000 | −0.3 | 0.791 | 0.221 | 0.460 | 0.591 | 0.813 | 0.979 | 0.998 | 1.000 | 0.991 | 0.999 | 1.000 |
| AG+GG/AA | |||||||||||||||||||||
| Overall | 15 | 1.91 | 0.057 | 1.266(0.993–1.614) | 60.24 | 0.000 | 76.80% | 0.99 | 0.322 | 0.51 | 0.619 | 0.057 | 0.914 | 0.157 | 0.359 | 0.860 | 0.984 | 0.998 | 0.988 | 0.999 | 1.000 |
| Ethnicity | |||||||||||||||||||||
| Caucasian | 9 | 1.51 | 0.131 | 1.328(0.919–1.917) | 53.02 | 0.000 | 84.90% | 0.52 | 0.602 | 0.58 | 0.582 | 0.130 | 0.742 | 0.344 | 0.612 | 0.945 | 0.994 | 0.999 | 0.991 | 0.999 | 1.000 |
| Asian | 6 | 1.40 | 0.162 | 1.138(0.950–1.363) | 6.33 | 0.276 | 21.00% | 0.38 | 0.707 | 0.16 | 0.879 | 0.160 | 0.999 | 0.325 | 0.591 | 0.941 | 0.994 | 0.999 | 0.996 | 1.000 | 1.000 |
| Source of control | |||||||||||||||||||||
| HB | 6 | 1.27 | 0.204 | 1.291(0.870–1.916) | 28.60 | 0.000 | 82.50% | 0.00 | 1.000 | 0.08 | 0.940 | 0.205 | 0.772 | 0.443 | 0.705 | 0.963 | 0.996 | 1.000 | 0.993 | 0.999 | 1.000 |
| PB | 9 | 1.31 | 0.190 | 1.266(0.993–1.614) | 30.76 | 0.000 | 74.00% | 0.73 | 0.466 | 0.67 | 0.523 | 0.057 | 0.914 | 0.157 | 0.359 | 0.860 | 0.984 | 0.998 | 0.988 | 0.999 | 1.000 |
| Cancer types | |||||||||||||||||||||
| Laryngeal SCC | 2 | 0.25 | 0.802 | 1.202(0.286–5.053) | 12.77 | 0.000 | 92.20% | 0.00 | 1.000 | . | . | 0.802 | 0.619 | 0.795 | 0.921 | 0.992 | 0.999 | 1.000 | 0.992 | 0.999 | 1.000 |
| Oral SCC | 5 | 2.42 | 0.016 | 1.374(1.062–1.777) | 6.12 | 0.191 | 34.60% | 1.71 | 0.086 | −2.21 | 0.114 | 0.015 | 0.748 | 0.058 | 0.157 | 0.672 | 0.954 | 0.995 | 0.964 | 0.996 | 1.000 |
| Cervical SCC | 3 | 1.12 | 0.263 | 0.892(0.730–1.090) | 1.09 | 0.579 | 0.00% | 1.04 | 0.296 | 1.31 | 0.416 | 0.264 | 0.998 | 0.442 | 0.704 | 0.963 | 0.996 | 1.000 | 0.997 | 1.000 | 1.000 |
| Esophageal SCC | 3 | 3.58 | 0.000 | 0.482(0.323–0.719) | 5.29 | 0.071 | 62.20% | 1.04 | 0.296 | −4.80 | 0.131 | 0.000 | 0.056 | 0.018 | 0.053 | 0.381 | 0.861 | 0.984 | 0.505 | 0.911 | 0.999 |
| Genotyping method | |||||||||||||||||||||
| PCR | 10 | 1.32 | 0.187 | 1.171(0.926–1.481) | 27.73 | 0.001 | 67.50% | 1.79 | 0.074 | 1.11 | 0.3 | 0.187 | 0.981 | 0.365 | 0.633 | 0.950 | 0.995 | 0.999 | 0.995 | 1.000 | 1.000 |
| PCR-RFLP | 4 | 1.26 | 0.209 | 1.591(0.772–3.280) | 21.03 | 0.000 | 85.70% | −0.34 | 1.000 | −0.23 | 0.838 | 0.208 | 0.437 | 0.589 | 0.811 | 0.979 | 0.998 | 1.000 | 0.990 | 0.999 | 1.000 |
| GG/AA+AG | |||||||||||||||||||||
| Overall | 15 | 1.44 | 0.149 | 1.136(0.955–1.352) | 15.65 | 0.208 | 23.30% | 2.01 | 0.044 | 2.37 | 0.037 | 0.151 | 0.999 | 0.312 | 0.576 | 0.937 | 0.993 | 0.999 | 0.996 | 1.000 | 1.000 |
| Ethnicity | |||||||||||||||||||||
| Caucasian | 9 | 1.21 | 0.228 | 1.117(0.933–1.336) | 13.10 | 0.109 | 38.90% | 0.94 | 0.348 | 1.66 | 0.140 | 0.226 | 0.999 | 0.404 | 0.670 | 0.957 | 0.996 | 1.000 | 0.997 | 1.000 | 1.000 |
| Asian | 6 | 1.12 | 0.263 | 1.496(0.739–3.031) | 1.94 | 0.584 | 0.00% | 1.02 | 0.308 | 3.23 | 0.084 | 0.264 | 0.503 | 0.611 | 0.825 | 0.981 | 0.998 | 1.000 | 0.992 | 0.999 | 1.000 |
| Source of control | |||||||||||||||||||||
| HB | 6 | 0.60 | 0.548 | 1.096(0.813–1.476) | 3.08 | 0.545 | 0.00% | 1.22 | 0.221 | 2.15 | 0.121 | 0.546 | 0.981 | 0.626 | 0.834 | 0.982 | 0.998 | 1.000 | 0.997 | 1.000 | 1.000 |
| PB | 9 | 1.34 | 0.179 | 1.158(0.935–1.434) | 12.67 | 0.081 | 44.70% | 1.36 | 0.174 | 1.50 | 0.184 | 0.179 | 0.991 | 0.351 | 0.619 | 0.947 | 0.994 | 0.999 | 0.995 | 1.000 | 1.000 |
| Cancer types | |||||||||||||||||||||
| Laryngeal SCC | 2 | 0.48 | 0.633 | 1.085(0.777–1.514) | 1.58 | 0.209 | 36.50% | 0.00 | 1.000 | . | . | 0.631 | 0.972 | 0.661 | 0.854 | 0.985 | 0.998 | 1.000 | 0.997 | 1.000 | 1.000 |
| Oral SCC | 5 | 3.53 | 0.000 | 12.702(3.093–52.156) | 1.94 | 0.380 | 0.00% | 0.00 | 1.000 | 0.49 | 0.709 | 0.000 | 0.002 | 0.454 | 0.714 | 0.965 | 0.996 | 1.000 | 0.923 | 0.992 | 1.000 |
| Cervical SCC | 3 | 0.13 | 0.895 | 1.016(0.800–1.290) | 0.74 | 0.691 | 0.00% | 1.04 | 0.296 | −3.83 | 0.163 | 0.896 | 0.999 | 0.729 | 0.890 | 0.989 | 0.999 | 1.000 | 0.998 | 1.000 | 1.000 |
| Esophageal SCC | 3 | 0.51 | 0.610 | 0.863(0.489–1.521) | 1.21 | 0.545 | 0.00% | 1.04 | 0.296 | 5.60 | 0.112 | 0.610 | 0.814 | 0.692 | 0.871 | 0.987 | 0.999 | 1.000 | 0.995 | 0.999 | 1.000 |
| Genotyping method | |||||||||||||||||||||
| PCR | 10 | 1.45 | 0.148 | 1.145(0.953–1.376) | 1.88 | 0.209 | 26.50% | 1.15 | 0.251 | 2.13 | 0.071 | 0.148 | 0.998 | 0.309 | 0.573 | 0.937 | 0.993 | 0.999 | 0.995 | 1.000 | 1.000 |
| PCR-RFLP | 4 | 1.32 | 0.18 | 1.696(0.774–3.717) | 2.93 | 0.231 | 31.70% | 0.00 | 1.000 | 16.96 | 0.037 | 0.186 | 0.380 | 0.596 | 0.816 | 0.980 | 0.998 | 1.000 | 0.990 | 0.999 | 1.000 |
Abbreviations: OR, odds ratio; CI, confidence interval; PB, population-based; HB, hospital-based; SCC, squamous cell carcinoma; FPRP, false positive report probability; BFDP, Bayesian false discovery probability. The results in bold represented that there was statistically significant noteworthiness at 0.2 level by FPRP or 0.8 level by BFDP calculations.

Statistical relationship between IL-10 rs1800896 gene polymorphism and squamous cell carcinoma susceptibility in four models: (a) GG vs AA, (b) AG vs AA, (c) AG + GG vs AA, and (d) GG vs AA + AG. Abbreviations: OR: odds ratio; CI: confidence interval.
Table 5 summarizes the relationship between the IL-10 rs1800872 gene polymorphism and the SCC risk. The overall analysis revealed that the IL-10 rs1800872 gene polymorphism and the SCC risk were significantly associated in both models (CC/AA: OR = 0.59, 95% CI: 0.44–0.81, p = 0.001; CC/AA + AC: OR = 0.71, 95% CI: 0.59–0.86, p = 0.000; Figure 3). However, the IL-10 rs1800872 gene polymorphism and the SCC risk showed no significant association in the other two models (AC/AA: OR = 0.87, 95% CI: 0.69–1.11, p = 0.266; AC + CC/AA: OR = 0.78, 95% CI: 0.60–1.00, p = 0.050; Figure 3). The subgroup analysis by ethnicity revealed a significantly increased SCC risk in Caucasians in all models (CC/AA: OR = 0.48, 95% CI: 0.31–0.74, p = 0.001; AC/AA: OR = 0.68, 95% CI: 0.54–0.86, p = 0.001; AC + CC/A: OR = 0.58, 95% CI: 0.46–0.72, p = 0.000; CC/AA + AC: OR = 0.68, 95% CI: 0.52–0.89, p = 0.004). Similarly, Asians showed an increased risk (CC/AA + AC: OR = 0.80, 95% CI: 0.63–1.00, p = 0.049). The subgroup analysis by control source revealed a significantly increased SCC risk among population-based controls in both models (CC/AA: OR = 0.55, 95% CI: 0.41–0.73, p = 0.000; CC/AA + AC: OR = 0.73, 95% CI: 0.61–0.87, p = 0.000) and a significantly increased risk among hospital-based controls in only one model (CC/AA + AC: OR = 0.69, 95% CI: 0.48–0.98, p = 0.036). The subgroup analysis by cancer type revealed a significantly increased oral SCC risk (CC/AA: OR = 0.28, 95% CI: 0.17–0.49, p = 0.000; AC/AA: OR = 0.39, 95% CI: 0.24–0.62, p = 0.000; AC + CC/AA: OR = 0.36, 95% CI: 0.23–0.57, p = 0.000; CC/AA + AC: OR = 0.63, 95% CI: 0.44–0.89, p = 0.000). The risk of cervical SCC was also significantly increased (CC/AA: OR = 0.46, 95% CI: 0.25–0.84, p = 0.011; AC + CC/AA: OR = 0.62, 95% CI: 0.46–0.83, p = 0.001; CC/AA + AC: OR = 0.54, 95% CI: 0.35–0.83, p = 0.005). All gene models showed heterogeneity (CC/AA: I 2 = 61.40%, p = 0.002; AC/AA: I 2 = 65.10%, p = 0.001; AC + CC/AA: I 2 = 72.20%, p = 0.000; CC/AA + AC: I 2 = 51.80%, p = 0.023).
Stratified analyses of the IL-10 rs1800872 polymorphism on squamous cell carcinoma risk
| Comparative model | No. | Z | p | OR (95% CI) | Heterogeneity | Z | Begg's test | t | Egger's test | FPRP p-value | FPRP Statistical power | FPRP prior probability | BEDP prior probability | ||||||||
|---|---|---|---|---|---|---|---|---|---|---|---|---|---|---|---|---|---|---|---|---|---|
| Heterogeneity chi-squared | p | I 2 | 0.250 | 0.10 | 0.01 | 0.001 | 0.0001 | 0.01 | 0.001 | 0.000001 | |||||||||||
| CC/AA | |||||||||||||||||||||
| Overall | 11 | 3.34 | 0.001 | 0.595(0.438–0.807) | 27.83 | 0.002 | 61.40% | 0.93 | 0.350 | −0.83 | 0.428 | 0.001 | 0.232 | 0.011 | 0.032 | 0.264 | 0.783 | 0.973 | 0.677 | 0.955 | 1.000 |
| Ethnicity | |||||||||||||||||||||
| Caucasian | 7 | 3.35 | 0.001 | 0.481(0.314–0.738) | 16.55 | 0.011 | 63.80% | 0.00 | 1.000 | 0.14 | 0.895 | 0.001 | 0.068 | 0.035 | 0.097 | 0.541 | 0.923 | 0.992 | 0.676 | 0.955 | 1.000 |
| Asian | 4 | 1.77 | 0.076 | 0.807(0.636–1.023) | 2.57 | 0.462 | 0.00% | −0.34 | 1.000 | 0.01 | 0.991 | 0.076 | 0.943 | 0.196 | 0.422 | 0.889 | 0.988 | 0.999 | 0.991 | 0.999 | 1.000 |
| Source of control | |||||||||||||||||||||
| HB | 5 | 1.93 | 0.054 | 0.635(0.401–1.007) | 16.71 | 0.002 | 76.10% | 0.73 | 0.462 | −0.73 | 0.518 | 0.054 | 0.418 | 0.278 | 0.536 | 0.927 | 0.992 | 0.999 | 0.981 | 0.998 | 1.000 |
| PB | 6 | 4.12 | 0.000 | 0.550(0.413–0.730) | 9.85 | 0.080 | 49.20% | 0.38 | 0.707 | 0.14 | 0.895 | 0.000 | 0.091 | 0.001 | 0.003 | 0.036 | 0.276 | 0.792 | 0.114 | 0.566 | 0.992 |
| Cancer types | |||||||||||||||||||||
| Laryngeal SCC | 2 | 0.67 | 0.505 | 0.852(0.533–1.363) | 0.01 | 0.924 | 0.00% | 0.00 | 1.000 | – | – | 0.504 | 0.847 | 0.641 | 0.843 | 0.983 | 0.998 | 1.000 | 0.995 | 1.000 | 1.000 |
| Oral SCC | 2 | 4.61 | 0.000 | 0.284(0.167–0.485) | 0.38 | 0.538 | 0.00% | 0.00 | 1.000 | – | – | 0.000 | 0.001 | 0.013 | 0.039 | 0.310 | 0.819 | 0.978 | 0.040 | 0.298 | 0.977 |
| Cervical SCC | 3 | 2.54 | 0.011 | 0.458(0.250–0.836) | 6.60 | 0.037 | 69.70% | 0.00 | 1.000 | −0.15 | 0.906 | 0.011 | 0.111 | 0.229 | 0.472 | 0.908 | 0.990 | 0.999 | 0.945 | 0.994 | 1.000 |
| Esophageal SCC | 4 | 1.63 | 0.102 | 0.817(0.640–1.041) | 2.90 | 0.408 | 0.00% | −0.34 | 1.000 | 0.40 | 0.727 | 0.102 | 0.950 | 0.244 | 0.492 | 0.914 | 0.991 | 0.999 | 0.992 | 0.999 | 1.000 |
| Genotyping method | |||||||||||||||||||||
| PCR | 7 | 2.60 | 0.009 | 0.613(0.423–0.887) | 19.63 | 0.003 | 69.40% | 1.50 | 0.133 | −1.19 | 0.287 | 0.009 | 0.328 | 0.079 | 0.206 | 0.740 | 0.966 | 0.997 | 0.938 | 0.993 | 1.000 |
| PCR-RFLP | 3 | 2.1 | 0.036 | 0.490(0.252–0.953) | 5.54 | 0.063 | 63.90% | 0.00 | 1.000 | −0.07 | 0.953 | 0.035 | 0.182 | 0.369 | 0.637 | 0.951 | 0.995 | 0.999 | 0.974 | 0.997 | 1.000 |
| AC/AA | |||||||||||||||||||||
| Overall | 11 | 1.11 | 0.266 | 0.872(0.686–1.110) | 28.64 | 0.001 | 65.10% | 0.93 | 0.350 | −0.84 | 0.423 | 0.266 | 0.985 | 0.447 | 0.708 | 0.964 | 0.996 | 1.000 | 0.996 | 1.000 | 1.000 |
| Ethnicity | |||||||||||||||||||||
| Caucasian | 7 | 3.24 | 0.001 | 0.679(0.537–0.858) | 9.85 | 0.131 | 39.10% | 0.60 | 0.548 | −0.16 | 0.880 | 0.001 | 0.561 | 0.006 | 0.019 | 0.173 | 0.678 | 0.955 | 0.757 | 0.969 | 1.000 |
| Asian | 4 | 0.77 | 0.438 | 1.126(0.835–1.518) | 10.38 | 0.016 | 71.10% | 1.02 | 0.308 | 1.37 | 0.304 | 0.436 | 0.970 | 0.574 | 0.802 | 0.978 | 0.998 | 1.000 | 0.996 | 1.000 | 1.000 |
| Source of control | |||||||||||||||||||||
| HB | 5 | 0.43 | 0.670 | 0.946(0.734–1.220) | 8.51 | 0.075 | 53.00% | −0.24 | 1.000 | −0.37 | 0.736 | 0.669 | 0.996 | 0.668 | 0.858 | 0.985 | 0.999 | 1.000 | 0.998 | 1.000 | 1.000 |
| PB | 6 | 0.94 | 0.349 | 0.792(0.487–1.289) | 19.28 | 0.002 | 74.10% | 0.38 | 0.707 | −0.47 | 0.663 | 0.348 | 0.756 | 0.580 | 0.806 | 0.979 | 0.998 | 1.000 | 0.994 | 0.999 | 1.000 |
| Cancer types | |||||||||||||||||||||
| Laryngeal SCC | 2 | 0.73 | 0.463 | 1.298(0.647–2.603) | 3.07 | 0.080 | 67.40% | 0.00 | 1.000 | – | – | 0.463 | 0.658 | 0.678 | 0.863 | 0.986 | 0.999 | 1.000 | 0.993 | 0.999 | 1.000 |
| Oral SCC | 2 | 3.95 | 0.000 | 0.387(0.241–0.620) | 0.24 | 0.624 | 0.00% | 0.00 | 1.000 | – | – | 0.000 | 0.012 | 0.020 | 0.056 | 0.397 | 0.869 | 0.985 | 0.258 | 0.778 | 0.997 |
| Cervical SCC | 3 | 1.32 | 0.188 | 0.808(0.588–1.110) | 2.10 | 0.350 | 4.60% | 1.04 | 0.296 | 1.57 | 0.361 | 0.188 | 0.882 | 0.390 | 0.658 | 0.955 | 0.995 | 1.000 | 0.994 | 0.999 | 1.000 |
| Esophageal SCC | 4 | 0.15 | 0.878 | 0.988(0.852–1.146) | 5.54 | 0.136 | 45.80% | 0.34 | 0.734 | 0.21 | 0.850 | 0.873 | 1.000 | 0.724 | 0.887 | 0.989 | 0.999 | 1.000 | 0.999 | 1.000 | 1.000 |
| Genotyping method | |||||||||||||||||||||
| PCR | 7 | 0.94 | 0.347 | 0.889(0.695–1.137) | 13.24 | 0.039 | 54.70% | 0.60 | 0.548 | −0.92 | 0.402 | 0.348 | 0.989 | 0.514 | 0.760 | 0.972 | 0.997 | 1.000 | 0.997 | 1.000 | 1.000 |
| PCR-RFLP | 3 | 0.44 | 0.658 | 0.835(0.376–1.853) | 15.33 | 0.000 | 86.90% | 0.00 | 1.000 | −0.26 | 0.835 | 0.657 | 0.710 | 0.735 | 0.893 | 0.989 | 0.999 | 1.000 | 0.994 | 0.999 | 1.000 |
| AC+CC/AA | |||||||||||||||||||||
| Overall | 11 | 1.96 | 0.050 | 0.775(0.601–1.000) | 35.98 | 0.000 | 72.20% | 1.09 | 0.276 | −1.17 | 0.272 | 0.050 | 0.877 | 0.146 | 0.339 | 0.850 | 0.983 | 0.998 | 0.986 | 0.999 | 1.000 |
| Ethnicity | |||||||||||||||||||||
| Caucasian | 7 | 4.83 | 0.000 | 0.579(0.463–0.722) | 10.94 | 0.090 | 45.20% | 0.30 | 0.764 | 0.29 | 0.784 | 0.000 | 0.105 | 0.000 | 0.000 | 0.001 | 0.011 | 0.104 | 0.006 | 0.058 | 0.861 |
| Asian | 4 | 0.36 | 0.717 | 1.052(0.799–1.384) | 9.77 | 0.021 | 69.30% | 0.34 | 0.734 | 1.02 | 0.415 | 0.717 | 0.994 | 0.684 | 0.867 | 0.986 | 0.999 | 1.000 | 0.997 | 1.000 | 1.000 |
| Source of control | |||||||||||||||||||||
| HB | 5 | 1.17 | 0.241 | 0.822(0.592–1.141) | 15.91 | 0.003 | 74.90% | −0.24 | 1.000 | −0.78 | 0.495 | 0.241 | 0.895 | 0.447 | 0.708 | 0.964 | 0.996 | 1.000 | 0.995 | 0.999 | 1.000 |
| PB | 6 | 1.38 | 0.167 | 0.724(0.457–1.144) | 18.78 | 0.002 | 73.40% | 0.00 | 1.000 | −0.46 | 0.669 | 0.166 | 0.638 | 0.439 | 0.701 | 0.963 | 0.996 | 1.000 | 0.991 | 0.999 | 1.000 |
| Cancer types | |||||||||||||||||||||
| Laryngeal SCC | 2 | 0.60 | 0.548 | 1.182(0.685–2.041) | 2.15 | 0.143 | 53.50% | 0.00 | 1.000 | – | – | 0.549 | 0.804 | 0.972 | 0.860 | 0.985 | 0.999 | 1.000 | 0.995 | 0.999 | 1.000 |
| Oral SCC | 2 | 4.37 | 0.000 | 0.358(0.226–0.567) | 0.27 | 0.606 | 0.00% | 0.00 | 1.000 | – | – | 0.000 | 0.004 | 0.009 | 0.026 | 0.227 | 0.748 | 0.967 | 0.069 | 0.426 | 0.987 |
| Cervical SCC | 3 | 3.20 | 0.001 | 0.615(0.457–0.829) | 3.44 | 0.179 | 41.80% | 1.04 | 0.296 | 1.59 | 0.357 | 0.001 | 0.298 | 0.014 | 0.041 | 0.320 | 0.826 | 0.979 | 0.767 | 0.971 | 1.000 |
| Esophageal SCC | 4 | 0.20 | 0.843 | 0.975(0.762–1.249) | 6.44 | 0.092 | 53.40% | 0.34 | 0.734 | 0.30 | 0.793 | 0.841 | 0.999 | 0.716 | 0.883 | 0.988 | 0.999 | 1.000 | 0.998 | 1.000 | 1.000 |
| Genotyping method | |||||||||||||||||||||
| PCR | 7 | 1.78 | 0.076 | 0.767(0.573–1.028) | 21.01 | 0.002 | 71.40% | 0.60 | 0.548 | −1.37 | 0.229 | 0.075 | 0.826 | 0.216 | 0.453 | 0.901 | 0.989 | 0.999 | 0.989 | 0.999 | 1.000 |
| PCR-RFLP | 3 | 0.75 | 0.451 | 0.751(0.357–1.581) | 14.70 | 0.001 | 86.40% | 0.00 | 1.000 | −0.36 | 0.778 | 0.451 | 0.623 | 0.685 | 0.867 | 0.986 | 0.999 | 1.000 | 0.993 | 0.999 | 1.000 |
| CC/AA+AC | |||||||||||||||||||||
| Overall | 11 | 3.59 | 0.000 | 0.711(0.590–0.857) | 20.75 | 0.023 | 51.80% | 0.00 | 1.000 | −0.72 | 0.487 | 0.000 | 0.750 | 0.001 | 0.004 | 0.043 | 0.314 | 0.821 | 0.539 | 0.922 | 0.999 |
| Ethnicity | |||||||||||||||||||||
| Caucasian | 7 | 2.85 | 0.004 | 0.677(0.518–0.885) | 18.33 | 0.005 | 67.30% | 0.00 | 1.000 | −0.64 | 0.553 | 0.004 | 0.545 | 0.023 | 0.067 | 0.440 | 0.888 | 0.988 | 0.900 | 0.989 | 1.000 |
| Asian | 4 | 1.97 | 0.049 | 0.796(0.634–0.999) | 1.66 | 0.647 | 0.00% | 0.34 | 0.734 | −0.87 | 0.474 | 0.049 | 0.937 | 0.136 | 0.320 | 0.838 | 0.981 | 0.998 | 0.987 | 0.999 | 1.000 |
| Source of control | |||||||||||||||||||||
| HB | 5 | 2.09 | 0.036 | 0.687(0.484–0.976) | 16.55 | 0.002 | 75.80% | 0.24 | 0.806 | −1.15 | 0.332 | 0.036 | 0.567 | 0.161 | 0.365 | 0.863 | 0.985 | 0.998 | 0.978 | 0.998 | 1.000 |
| PB | 6 | 3.54 | 0.000 | 0.729(0.612–0.868) | 4.19 | 0.522 | 0.00% | 0.75 | 0.452 | −0.05 | 0.961 | 0.000 | 0.842 | 0.001 | 0.004 | 0.043 | 0.314 | 0.821 | 0.575 | 0.932 | 0.999 |
| Cancer types | |||||||||||||||||||||
| Laryngeal SCC | 2 | 0.73 | 0.463 | 0.904(0.690–1.184) | 0.95 | 0.329 | 0.00% | 0.00 | 1.000 | – | – | 0.463 | 0.987 | 0.585 | 0.809 | 0.979 | 0.998 | 1.000 | 0.997 | 1.000 | 1.000 |
| Oral SCC | 2 | 2.62 | 0.000 | 0.625(0.440–0.888) | 0.01 | 0.920 | 0.00% | 0.00 | 1.000 | – | – | 0.009 | 0.359 | 0.068 | 0.179 | 0.706 | 0.960 | 0.996 | 0.935 | 0.993 | 1.000 |
| Cervical SCC | 3 | 2.79 | 0.005 | 0.538(0.348–0.831) | 8.23 | 0.016 | 75.70% | 0.00 | 1.000 | −3.11 | 0.198 | 0.005 | 0.167 | 0.085 | 0.219 | 0.755 | 0.969 | 0.997 | 0.902 | 0.989 | 1.000 |
| Esophageal SCC | 4 | 1.34 | 0.181 | 0.860(0.689–1.073) | 2.91 | 0.406 | 0.00% | 0.34 | 0.734 | 0.48 | 0.678 | 0.182 | 0.988 | 0.355 | 0.623 | 0.948 | 0.995 | 0.999 | 0.995 | 1.000 | 1.000 |
| Genotyping method | |||||||||||||||||||||
| PCR | 7 | 2.93 | 0.003 | 0.700(0.551–0.888) | 16.81 | 0.01 | 64.30% | 0.30 | 0.764 | −1.10 | 0.321 | 0.003 | 0.656 | 0.015 | 0.043 | 0.332 | 0.834 | 0.980 | 0.883 | 0.987 | 1.000 |
| PCR-RFLP | 3 | 2.98 | 0.003 | 0.625(0.459–0.852) | 0.01 | 0.996 | 0.00% | 0.00 | 1.000 | 0.67 | 0.626 | 0.003 | 0.342 | 0.025 | 0.072 | 0.461 | 0.896 | 0.989 | 0.859 | 0.984 | 1.000 |
Abbreviations: OR, odds ratio; CI, confidence interval; PB, population-based; HB, hospital-based; SCC, squamous cell carcinoma; FPRP, false positive report probability; BFDP, Bayesian false discovery probability. The results in bold represented that there was statistically significant noteworthiness at 0.2 level by FPRP or 0.8 level by BFDP calculations.
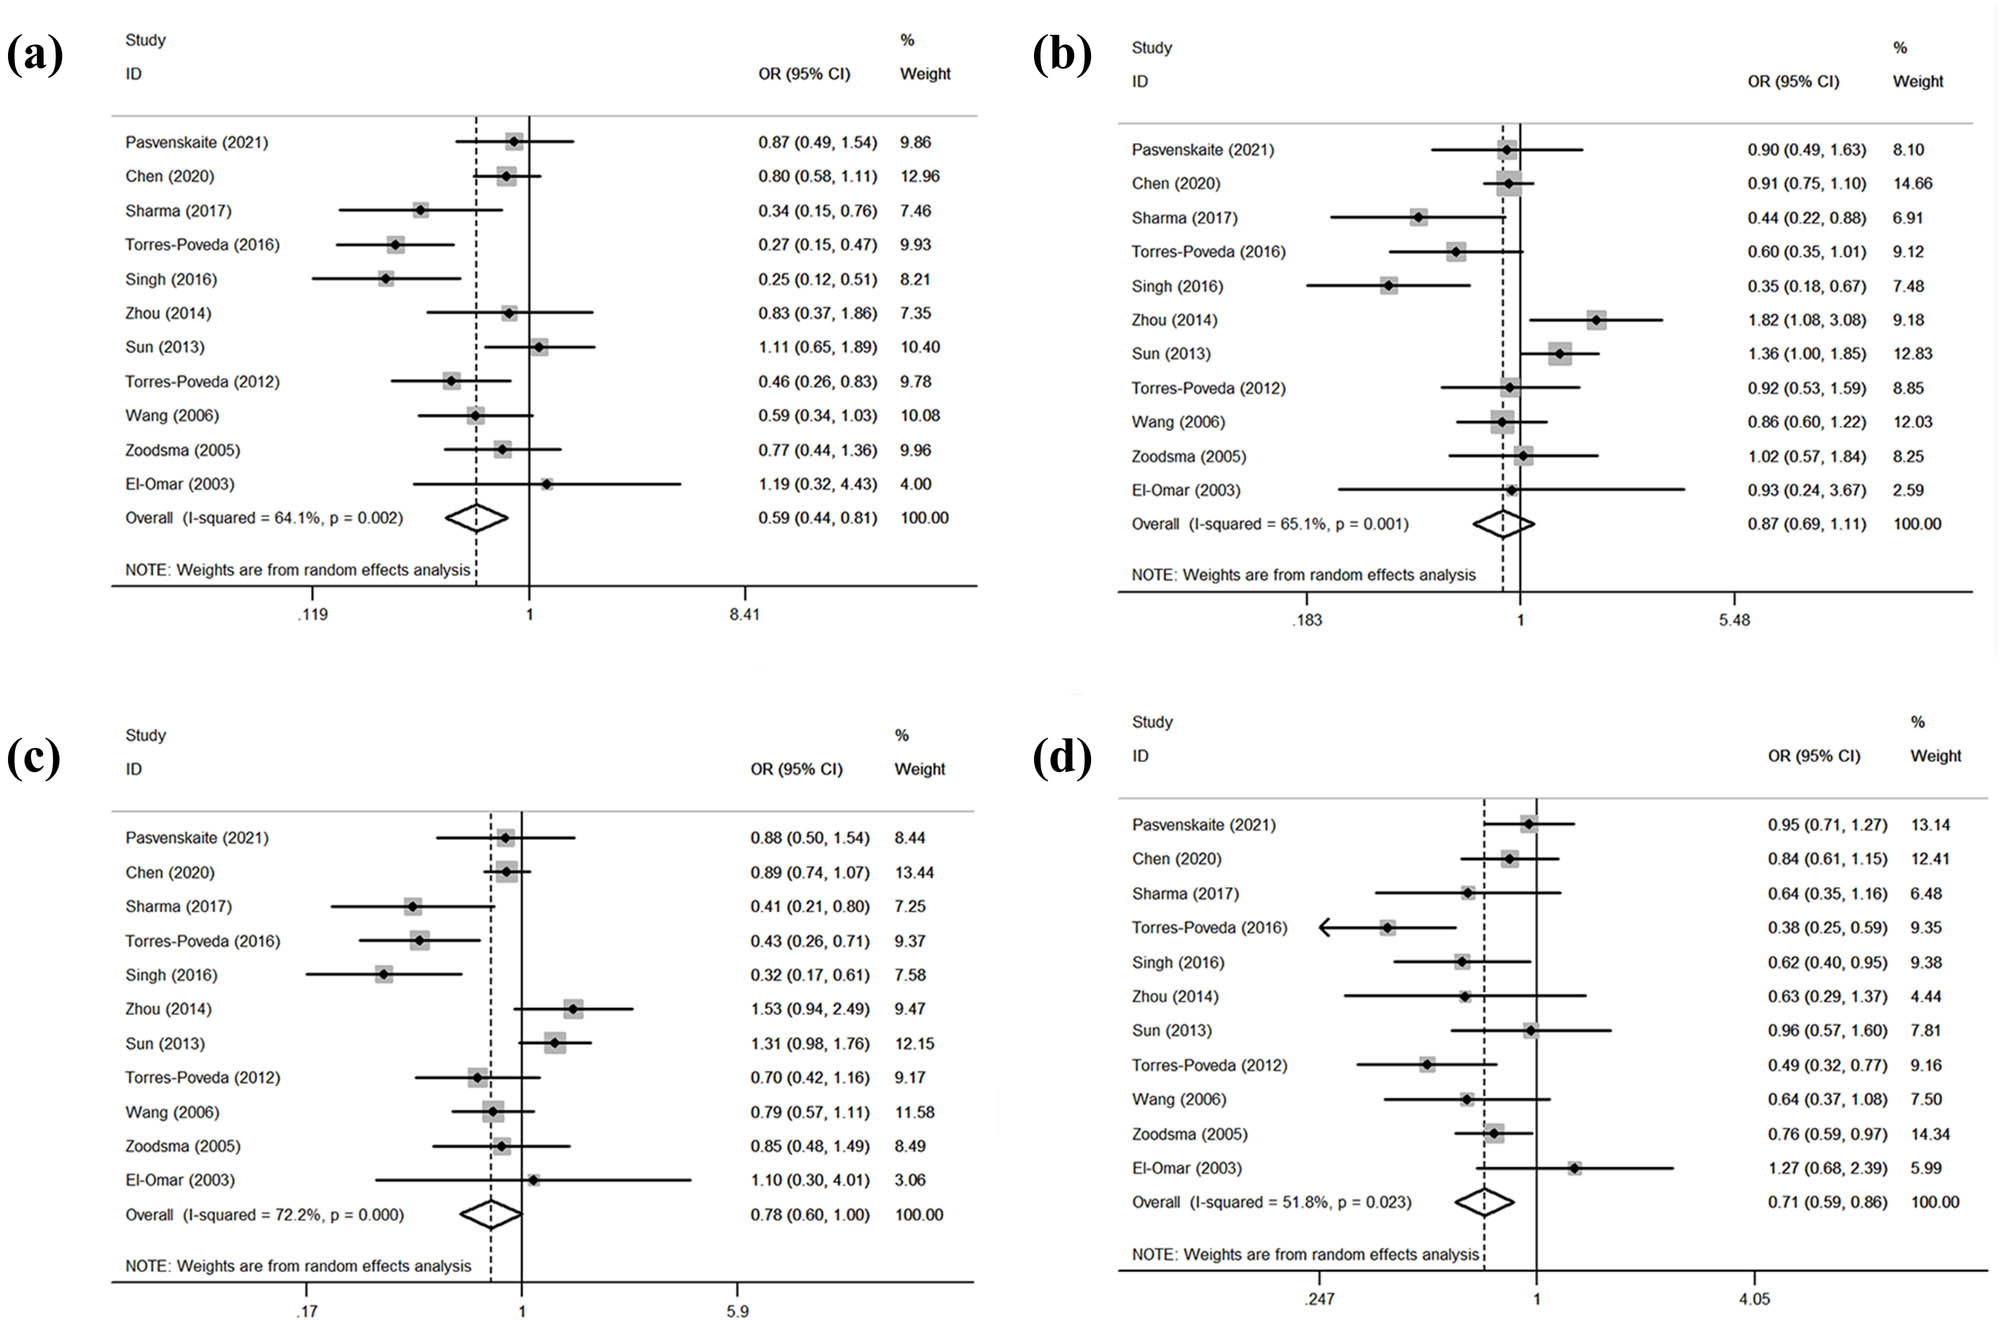
Statistical relationship between IL-10 rs1800872 gene polymorphism and squamous cell carcinoma susceptibility in four models: (a) CC vs AA, (b) AC vs AA, (c) AC + CC vs AA, and (d) CC vs AA + AC.
Table 6 shows the association between the IL-6 rs1800795 gene polymorphism and the SCC risk. The association between the IL-6 rs1800795 gene polymorphism and the SCC risk was explored in all models (CC/GG: OR = 1.11, 95% CI: 0.66–1.87, p = 0.702; GC/GG: OR = 1.13, 95% CI: 0.74–1.73, p = 0.58; GC + CC/GG: OR = 1.09, 95% CI: 0.70–1.70, p = 0.697; CC/GG + GC: OR = 1.01, 95% CI: 0.67–1.53, p = 0.958; Figure 4). The subgroup analysis by ethnicity showed no significant association in any model. The subgroup analysis by control source revealed a significantly increased risk among hospital-based controls in both models (CC/GG: OR = 1.43, 95% CI: 1.09–1.88, p = 0.009; GC + CC/GG: OR = 1.24, 95% CI: 1.01–1.53, p = 0.044). The subgroup analysis by cancer type revealed a significantly increased laryngeal SCC risk in one model (GC + CC/GG: OR = 1.38, 95% CI: 1.02–1.86, p = 0.035). All gene models showed heterogeneity (CC/GG: I 2 = 73.40%, p = 0.000; GC/GG: I 2 = 79.40%, p = 0.000; GC + CC/GG: I 2 = 83.40%, p = 0.000; CC/GG + GC: I 2 = 68.00%, p = 0.003). No other results were statistically significant.
Stratified analyses of the IL-6 rs1800795 polymorphism on squamous cell carcinoma risk
| Comparative model | No. | Z | p | OR (95% CI) | Heterogeneity | Z | Begg’s test | t | Egger’s test | FPRP p-value | FPRP statistical power | FPRP prior probability | BEDP prior probability | ||||||||
|---|---|---|---|---|---|---|---|---|---|---|---|---|---|---|---|---|---|---|---|---|---|
| Heterogeneity chi-squared | p | I 2 | 0.25 | 0.10 | 0.01 | 0.001 | 0.0001 | 0.01 | 0.001 | 0.000001 | |||||||||||
| CC/GG | |||||||||||||||||||||
| Overall | 8 | 0.38 | 0.702 | 1.107(0.657–1.867) | 26.31 | 0.000 | 73.40% | 0.12 | 0.902 | −0.75 | 0.479 | 0.703 | 0.873 | 0.707 | 0.879 | 0.988 | 0.999 | 1.000 | 0.995 | 1.000 | 1.000 |
| Ethnicity | |||||||||||||||||||||
| Caucasian | 6 | 0.61 | 0.54 | 1.244(0.619–2.497) | 17.88 | 0.003 | 72.00% | 0.00 | 1.000 | −0.2 | 0.849 | 0.539 | 0.701 | 0.698 | 0.874 | 0.987 | 0.999 | 1.000 | 0.994 | 0.999 | 1.000 |
| Asian | 2 | 0.36 | 0.717 | 0.759(0.171–3.368) | 8.39 | 0.004 | 88.10% | 0.00 | 1.000 | – | – | 0.717 | 0.568 | 0.791 | 0.919 | 0.992 | 0.999 | 1.000 | 0.992 | 0.999 | 1.000 |
| Source of control | |||||||||||||||||||||
| HB | 2 | 2.6 | 0.009 | 1.433(1.093–1.878) | 0.20 | 0.654 | 0.00% | 0.00 | 1.000 | – | – | 0.009 | 0.630 | 0.042 | 0.115 | 0.589 | 0.935 | 0.993 | 0.944 | 0.994 | 1.000 |
| PB | 6 | 0.08 | 0.938 | 0.963(0.374–2.479) | 23.75 | 0.000 | 78.90% | 0.75 | 0.452 | 0.07 | 0.944 | 0.938 | 0.777 | 0.784 | 0.916 | 0.992 | 0.999 | 1.000 | 0.993 | 0.999 | 1.000 |
| Cancer types | |||||||||||||||||||||
| Oral SCC | 3 | 0.03 | 0.974 | 0.969(0.150–6.274) | 21.24 | 0.000 | 90.60% | 0.00 | 1.000 | 0.13 | 0.916 | 0.974 | 0.653 | 0.817 | 0.931 | 0.993 | 0.999 | 1.000 | 0.991 | 0.999 | 1.000 |
| Laryngeal SCC | 2 | 1.71 | 0.087 | 1.377(0.955–1.985) | 0.13 | 0.723 | 0.00% | 0.00 | 1.000 | – | – | 0.086 | 0.677 | 0.277 | 0.535 | 0.927 | 0.992 | 0.999 | 0.988 | 0.999 | 1.000 |
| Genotyping method | |||||||||||||||||||||
| PCR | 5 | 0.54 | 0.587 | 1.258(0.549–2.884) | 17.81 | 0.001 | 77.50% | −0.24 | 1.000 | −0.15 | 0.892 | 0.587 | 0.661 | 0.727 | 0.889 | 0.989 | 0.999 | 1.000 | 0.993 | 0.999 | 1.000 |
| PCR-RFLP | 2 | 0.36 | 0.717 | 0.759(0.171–3.368) | 8.39 | 0.004 | 88.10% | 0.00 | 1.000 | – | – | 0.72 | 0.568 | 0.791 | 0.919 | 0.992 | 0.999 | 1.000 | 0.988 | 0.999 | 1.000 |
| GC/GG | |||||||||||||||||||||
| Overall | 8 | 0.55 | 0.584 | 1.127(0.735–1.730) | 34.02 | 0.000 | 79.40% | −0.12 | 1.000 | −0.48 | 0.647 | 0.585 | 0.904 | 0.660 | 0.853 | 0.985 | 0.998 | 1.000 | 0.996 | 1.000 | 1.000 |
| Ethnicity | |||||||||||||||||||||
| Caucasian | 6 | 0.87 | 0.386 | 1.282(0.731–2.250) | 22.44 | 0.000 | 77.70% | 0.38 | 0.707 | −0.93 | 0.404 | 0.387 | 0.708 | 0.621 | 0.831 | 0.982 | 0.998 | 1.000 | 0.994 | 0.999 | 1.000 |
| Asian | 2 | 0.65 | 0.516 | 0.814(0.438–1.514) | 4.06 | 0.044 | 75.30% | 0.00 | 1.000 | – | – | 0.516 | 0.736 | 0.678 | 0.863 | 0.986 | 0.999 | 1.000 | 0.994 | 0.999 | 1.000 |
| Source of control | |||||||||||||||||||||
| HB | 2 | 1.41 | 0.158 | 1.174(0.940–1.467) | 0.89 | 0.345 | 0.00% | 0.00 | 1.000 | – | – | 0.158 | 0.984 | 0.325 | 0.591 | 0.941 | 0.994 | 0.999 | 0.995 | 0.999 | 1.000 |
| PB | 6 | 0.15 | 0.880 | 1.059(0.503–2.230) | 32.88 | 0.00 | 84.80% | 0.00 | 1.000 | −1.14 | 0.319 | 0.880 | 0.820 | 0.763 | 0.906 | 0.990 | 0.999 | 1.000 | 0.997 | 1.000 | 1.000 |
| Cancer types | |||||||||||||||||||||
| Oral SCC | 3 | 0.36 | 0.718 | 1.276(0.339–4.807) | 25.62 | 0.00 | 92.20% | 0.00 | 1.000 | −0.38 | 0.769 | 0.719 | 0.594 | 0.784 | 0.916 | 0.992 | 0.999 | 1.000 | 0.992 | 0.999 | 1.000 |
| Laryngeal SCC | 2 | 1.95 | 0.051 | 1.371(0.998–1.884) | 0.15 | 0.702 | 0.00% | 0.00 | 1.000 | – | – | 0.052 | 0.710 | 0.179 | 0.396 | 0.878 | 0.986 | 0.999 | 0.984 | 0.998 | 1.000 |
| Genotyping method | |||||||||||||||||||||
| PCR | 5 | 1.63 | 0.103 | 1.554(0.915–2.640) | 15.12 | 0.004 | 73.50% | 0.24 | 0.806 | −0.33 | 0.763 | 0.103 | 0.448 | 0.408 | 0.674 | 0.958 | 0.996 | 1.000 | 0.987 | 0.999 | 1.000 |
| PCR-RFLP | 2 | 0.65 | 0.516 | 0.814(0.438–1.514) | 4.06 | 0.044 | 75.30% | 0.00 | 1.000 | – | – | 0.515 | 0.736 | 0.678 | 0.863 | 0.986 | 0.999 | 1.000 | 0.994 | 0.999 | 1.000 |
| GC + CC/GG | |||||||||||||||||||||
| Overall | 8 | 0.39 | 0.697 | 1.092(0.701–1.700) | 42.10 | 0.000 | 83.40% | 0.62 | 0.536 | −0.66 | 0.536 | 0.697 | 0.920 | 0.694 | 0.872 | 0.989 | 0.999 | 1.000 | 0.996 | 1.000 | 1.000 |
| Ethnicity | |||||||||||||||||||||
| Caucasian | 6 | 0.68 | 0.494 | 1.225(0.685–2.191) | 27.83 | 0.000 | 82.00% | 0.75 | 0.452 | −0.96 | 0.393 | 0.494 | 0.753 | 0.663 | 0.855 | 0.985 | 0.998 | 1.000 | 0.994 | 0.999 | 1.000 |
| Asian | 2 | 0.55 | 0.584 | 1.092(0.701–1.700) | 8.15 | 0.004 | 87.70% | 0.00 | 1.000 | – | – | 0.697 | 0.920 | 0.694 | 0.872 | 0.987 | 0.999 | 1.000 | 0.996 | 1.000 | 1.000 |
| Source of control | |||||||||||||||||||||
| HB | 2 | 2.01 | 0.044 | 1.241(1.006–1.532) | 0.35 | 0.556 | 0.00% | 0.00 | 1.000 | – | – | 0.045 | 0.961 | 0.122 | 0.294 | 0.821 | 0.979 | 0.998 | 0.987 | 0.999 | 1.000 |
| PB | 6 | 0.00 | 0.997 | 1.002(0.461–2.178) | 41.69 | 0.000 | 88.00% | 0.38 | 0.707 | −0.99 | 0.380 | 0.996 | 0.846 | 0.779 | 0.914 | 0.991 | 0.999 | 1.000 | 0.994 | 0.999 | 1.000 |
| Cancer types | |||||||||||||||||||||
| Oral SCC | 3 | 0.12 | 0.906 | 1.093(0.250–4.792) | 35.92 | 0.000 | 94.40% | 0.00 | 1.000 | −0.42 | 0.747 | 0.906 | 0.663 | 0.804 | 0.925 | 0.993 | 0.999 | 1.000 | 0.992 | 0.999 | 1.000 |
| Laryngeal SCC | 2 | 2.11 | 0.035 | 1.380(1.024–1.860) | 0.2 | 0.655 | 0.00% | 0.00 | 1.000 | – | – | 0.034 | 0.708 | 0.127 | 0.304 | 0.828 | 0.980 | 0.998 | 0.979 | 0.998 | 1.000 |
| Genotyping method | |||||||||||||||||||||
| PCR | 5 | 1.10 | 0.269 | 1.408(0.767–2.586) | 22.43 | 0.000 | 82.20% | 0.24 | 0.806 | −0.52 | 0.639 | 0.269 | 0.581 | 0.582 | 0.807 | 0.979 | 0.998 | 1.000 | 0.992 | 0.999 | 1.000 |
| PCR-RFLP | 2 | 0.55 | 0.584 | 0.794(0.348–1.811) | 8.15 | 0.004 | 87.70% | 0.00 | 1.000 | – | – | 0.583 | 0.661 | 0.726 | 0.888 | 0.989 | 0.999 | 1.000 | 0.993 | 0.999 | 1.000 |
| CC/GG + GC | |||||||||||||||||||||
| Overall | 8 | 0.05 | 0.958 | 1.011(0.667–1.532) | 21.84 | 0.003 | 68.00% | 0.12 | 0.902 | −0.60 | 0.570 | 0.959 | 0.969 | 0.748 | 0.899 | 0.990 | 0.999 | 1.000 | 0.996 | 1.000 | 1.000 |
| Ethnicity | |||||||||||||||||||||
| Caucasian | 6 | 0.19 | 0.846 | 1.055(0.614–1.811) | 14.49 | 0.013 | 65.50% | 0.00 | 1.000 | 0.07 | 0.945 | 0.846 | 0.899 | 0.738 | 0.894 | 0.989 | 0.999 | 1.000 | 0.995 | 1.000 | 1.000 |
| Asian | 2 | 0.30 | 0.765 | 0.825(0.233–2.921) | 6.48 | 0.011 | 84.60% | 0.00 | 1.000 | – | – | 0.766 | 0.629 | 0.785 | 0.916 | 0.992 | 0.999 | 1.000 | 0.992 | 0.999 | 1.000 |
| Source of control | |||||||||||||||||||||
| HB | 2 | 1.94 | 0.053 | 1.247(0.997–1.559) | 1.51 | 0.219 | 33.70% | 0.00 | 1.000 | – | – | 0.053 | 0.948 | 0.143 | 0.334 | 0.846 | 0.982 | 0.998 | 0.988 | 0.999 | 1.000 |
| PB | 6 | 0.29 | 0.769 | 0.899(0.441–1.832) | 16.70 | 0.005 | 70.10% | 0.75 | 0.452 | 1.12 | 0.327 | 0.769 | 0.795 | 0.744 | 0.897 | 0.990 | 0.999 | 1.000 | 0.994 | 0.999 | 1.000 |
| Cancer types | |||||||||||||||||||||
| Oral SCC | 3 | 0.35 | 0.728 | 0.802(0.232–2.774) | 12.71 | 0.002 | 84.30% | 1.04 | 0.296 | 0.66 | 0.629 | 0.727 | 0.615 | 0.780 | 0.914 | 0.992 | 0.999 | 1.000 | 0.992 | 0.999 | 1.000 |
| Laryngeal SCC | 2 | 0.77 | 0.441 | 1.120(0.839–1.494) | 0.17 | 0.683 | 0.00% | 0.00 | 1.000 | – | – | 0.441 | 0.977 | 0.575 | 0.802 | 0.978 | 0.998 | 1.000 | 0.997 | 1.000 | 1.000 |
| Genotyping method | |||||||||||||||||||||
| PCR | 5 | 0.06 | 0.951 | 0.981(0.531–1.813) | 13.62 | 0.009 | 70.60% | −0.24 | 1.000 | −0.13 | 0.9204 | 0.951 | 0.891 | 0.762 | 0.906 | 0.991 | 0.999 | 1.000 | 0.995 | 1.000 | 1.000 |
| PCR-RFLP | 2 | 0.3 | 0.765 | 0.825(0.233–2.921) | 6.48 | 0.011 | 84.60% | 0.00 | 1.000 | – | – | 0.765 | 0.629 | 0.785 | 0.916 | 0.992 | 0.999 | 1.000 | 0.992 | 0.999 | 1.000 |
Abbreviations: OR, odds ratio; CI, confidence interval; PB, population-based; HB, hospital-based; SCC, squamous cell carcinoma; FPRP, false positive report probability; BFDP, Bayesian false discovery probability. The results in bold represented that there was statistically significant noteworthiness at 0.2 level by FPRP or 0.8 level by BFDP calculations.
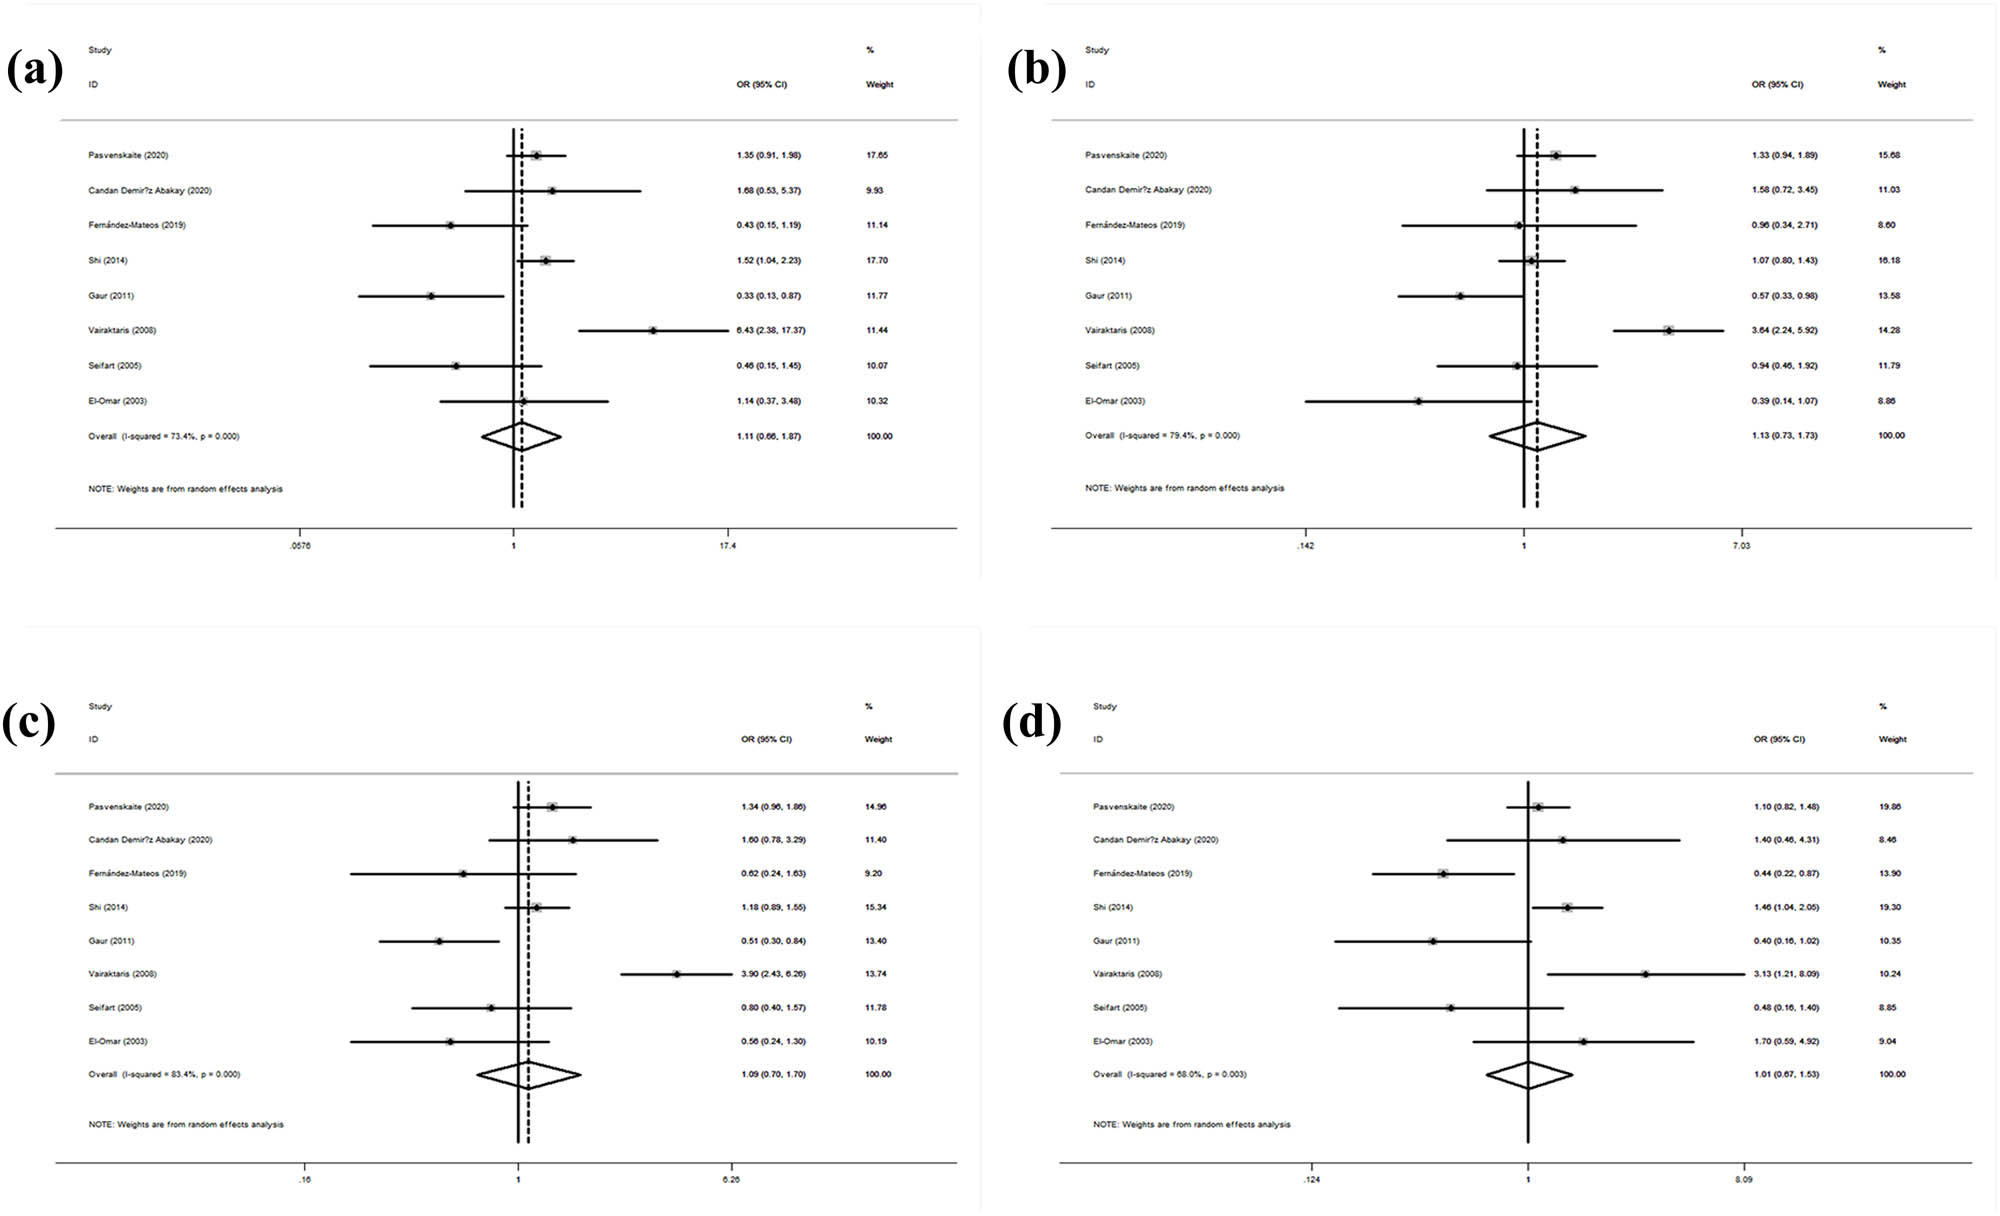
Statistical relationship between IL-10 rs1800795 gene polymorphism and squamous cell carcinoma susceptibility in four models: (a) CC vs GG, (b) GC vs GG, (c) GC + CC vs GG, and (d) CC vs GG + GC.
3.3 Publication bias
The funnel plot revealed no significant asymmetry in the IL-10 rs1800896 gene polymorphism in any model (Figure S1). However, Egger’s test revealed a publication bias in the IL-10 rs1800896 models (p = 0.018 for GG/AA; p = 0.037 for GG/AA + AG). IL-18 rs1800872 or IL-6 rs1800795 models showed no asymmetry in the funnel shape (Figures S2 and S3). In addition, Egger’s test revealed no publication bias in IL-10 1800872 or IL-6 rs1800795 models.
3.4 Sensitivity analysis
The sensitivity analysis revealed no significant changes in the combination OR corresponding to the IL-10 rs1800896 or rs1800872 or IL-6 rs1800795 gene polymorphism, proving our results to be statistically robust (Figures S4–S6). The meta-regression analysis showed that the publication year, ethnicity, or control source did not affect the stability of the combined results (Table S1).
3.5 FPRP and BFDP tests
Tables S2, S3, and S4 show the FPRPs of IL-10 rs1800896 and rs1800872 and IL-6 rs1800795 gene polymorphisms, respectively. At prior probabilities of 0.25 and 0.1, FPRP and BFDP test results showed statistically significant results in almost all models of rs1800896, rs1800872, and rs1800795 polymorphisms, with an OR of 1.5.
4 Discussion
SCC can be caused by exposure to carcinogens, such as sunlight, tobacco, alcohol, and viral infections. It shows a high percentage of somatic genetic mutations. All SCC cases have similar mutation patterns [44–46]. The relationship between the IL-10 and IL-6 gene polymorphisms and the SCC risk has been shown. Gene polymorphisms affect their messenger RNA (mRNA) and protein levels. The IL-6 rs1800795 polymorphism may affect the IL-6 mRNA expression. The G allele of the IL-6 rs1800795 promoter single-nucleotide polymorphism is associated with elevated IL-6 mRNA transcription levels after in vitro endotoxin or IL-1 stimulation [47]. The presence of a variant allele G in tumor tissue is positively associated with elevated IL-10 mRNA levels [48]. Wang et al. analyzed the same polymorphisms and reported significantly higher IL-10 mRNA levels in patients with non-small cell lung cancer with the non-ATA haplotype, showing the association of cytokine IL-10 expression levels with tumor progression [49]. Currently, no relevant reports have been published on the polymorphism of these three genes or proteins. They may indirectly affect the protein expression after affecting the mRNA expression. Associations of IL-10 and IL-6 gene polymorphisms and oral and cervical SCC risks have been frequently demonstrated in meta-analyses [50,51]. However, no meta-analysis has revealed an association of IL-10 or IL-6 gene polymorphisms with the SCC risk. Therefore, we re-examined the relationship between IL-10 and IL-6 gene polymorphisms and the SCC risk from a comprehensive and unified perspective to draw a more accurate conclusion.
We investigated the IL-10 rs1800896 gene polymorphism to find its relationship with the SCC risk. The overall analysis revealed no positive results. However, the subgroup analysis by cancer type revealed positive results, indicating that the IL-10 rs1800896 gene polymorphism was a risk factor for oral SCC. Li et al. [50] also conducted a study on the association of the IL-10 gene polymorphism and the oral cancer risk. They reported that the IL-10 rs1800896 polymorphism increased the risk of oral cancers, including non-SCC, in both dominant and recessive genetic models. Both present and previous studies showed that the IL-10 rs1800896 gene polymorphism increased the oral cancer risk. However, the present study investigated SCC, while previous studies did not differentiate SCC and non-SCC. In addition, the present subgroup analysis showed that other cancer types, such as cervical or esophageal SCC, showed no positive results. These results were consistent with those of Ni et al.’s meta-analysis of eight studies. Furthermore, the IL-10 rs1800896 gene polymorphism affects carcinoma of the uterine cervix [52]. However, the present results were inconsistent with the results of Li et al.’s meta-analysis of seven studies, which showed that the IL-10 rs1800896 gene polymorphism could increase the risk of esophageal cancer, possibly including non-SCC [53]. In the present study, the IL-10 rs1800896 polymorphism showed different impressions in diverse organs, probably because of the IL-10 rs1800896 gene polymorphisms in different parts of the body having different distributions in different cancer types. However, the exact mechanism remains unclear. The subgroup analyses did not include a sufficient sample size. Therefore, we should exercise caution in drawing conclusions. Future, large-scale studies should be conducted. No link between the IL-10 rs1800896 gene polymorphism and the SCC risk was found in hospital- or population-based models.
With the IL-10 rs1800872 gene polymorphism, the SCC risk was low, particularly in oral SCC. Subgroup analyses by ethnicity indicated that the IL-10 rs1800872 polymorphism might be a protective factor in the Caucasian population but a risk factor in the Asian population. The IL-10 rs1800872 gene polymorphism had different effects on the Caucasian and Asian populations. The reason might be that the proportion of the gene expression differed among ethnic groups. These differences may be derived from different genetic backgrounds and environmental exposures, such as the difference in minor allele frequencies in healthy controls among the Caucasian and Asian populations. Therefore, inconsistent associations indicate the possibility of differences in the magnitude of the IL-10 rs1800872 gene polymorphism contribution to the SCC risk across different genetic backgrounds and environmental exposures [54]. The subgroup analysis by cancer type showed no association between the IL-10 rs1800872 polymorphism and the esophageal SCC risk, broadly consistent with the included independent studies [20,24,36,37].
The IL-6 rs1800795 gene polymorphism and the SCC risk showed no association. However, the subgroup analysis by control source revealed that the presence of the IL-6 rs1800795 gene polymorphism increased the SCC risk among hospital-based controls but not among population-based controls. The possible reasons are as follows: (1) some studies included hospital-based controls, which could induce an inherent selection bias because the hospital population does not represent the general population and (2) hospital-based controls may have other diseases that affect the release of interleukins, affecting the present results. Thus, appropriate and representative control populations played roles in assessing the relationship between the gene polymorphism and the disease risk. We found inconsistent results for the same cancer among independent studies. One study showed that the CC genotype of IL-6 rs1800795 may be protective in patients with oral SCC [42]. Another study showed a seven-fold increased risk of oral SCC with the CC genotype [43]. The results of the two studies were directly opposite [42,43]; therefore, we performed a subgroup analysis by cancer type. However, the results showed no significant association between the IL-6 rs1800795 polymorphism and the oral SCC risk, consistent with previous meta-analysis results [55]. A previous meta-analysis of 11 studies conducted by Rezaei et al. also confirmed that the IL-6 rs1800795 gene polymorphism was not associated with the oral cancer risk. Thus, the strength of the association between the IL-6 rs1800795 gene polymorphism and the oral cancer risk could be evaluated using meta-analyses, and the results of this study were more accurate than those of each independent study. All studies that met the eligibility criteria were included in this study, but a larger sample size would increase the reliability of the conclusions.
This meta-analysis has some advantages. First, no studies on the association between the IL-10 rs1800896 and rs1800872 and IL-6 rs1800795 gene polymorphisms and the SCC risk have been reported. Second, this was the most comprehensive study on this topic, with sufficient statistical power. However, several limitations exist. First, many studies had to be excluded because they did not report the relevant cancer type or pathologically diagnosed SCC. Further, some studies had to be excluded because they did not report the proportion of SCC by genotype. Finally, the number of included studies was small. Future, large-scale studies are required to more accurately explain the association between the studied genotypes and the SCC risk. Second, we only included articles published in English or Chinese, which might lead to a language bias. The preponderance of Asians in the original data could also be a bias. Third, the pathogenesis of SCC was affected by various factors, such as environmental changes, diet, age, and sex, which were not accounted for because of the retrospective study design. Fourth, subgroup analyses included only a few studies, reducing the statistical efficiency. Finally, the statistical heterogeneity frequently existed between the IL-10 rs1800872 and IL-6 rs1800795 gene polymorphisms and the SCC risk during statistical calculations. This could be because of the small number of included studies and the considerable heterogeneity among studies. Therefore, caution should be exercised when drawing conclusions.
5 Conclusions
This meta-analysis showed that the IL-10 rs1800872 gene polymorphism reduced the SCC risk, particularly in Caucasians. However, no IL-10 rs1800896 or IL-6 rs1800795 polymorphism was correlated with the SCC risk. Considering the limitations of this study, further carefully designed, large-scale studies are required to evaluate the association of the IL-10 and IL-6 genetic polymorphisms with the SCC risk.
-
Funding information: This work was supported by the Guangxi Science and Technology Base and Talents Special Project (2021AC18031), Nanning Qingxiu District Science and Technology Plan (2021004), and Guangxi Medical and health-suitable technology development and popularization application project (S2021085).
-
Author contributions: The authors thank all the participants for their contributions to this study. Z.W. and X.S. collected the data. C.L. and X.H. checked the data. Q.H and Y.H. calculated the data. Z.W., X.S, C.L., and X.H. analyzed the data and wrote the manuscript. All authors read and approved the final manuscript.
-
Conflict of interest: Authors state no conflict of interest.
-
Data availability statement: The datasets generated and/or analyzed during the current study are available from the corresponding author on reasonable request.
References
[1] Bray F, Laversanne M, Weiderpass E, Soerjomataram I. The ever-increasing importance of cancer as a leading cause of premature death worldwide. Cancer. 2021;127(16):3029–30.10.1002/cncr.33587Search in Google Scholar PubMed
[2] Andersen AS, Koldjaer Sølling AS, Ovesen T, Rusan M. The interplay between HPV and host immunity in head and neck squamous cell carcinoma. Int J Cancer. 2014;134(12):2755–63.10.1002/ijc.28411Search in Google Scholar PubMed
[3] Houghton CR, Iversen T. Squamous cell carcinoma of the vagina: a clinical study of the location of the tumor. Gynecologic Oncol. 1982;13(3):365–72.10.1016/0090-8258(82)90075-0Search in Google Scholar PubMed
[4] Wong-You-Cheong JJ, Woodward PJ, Manning MA, Sesterhenn IA. From the archives of the AFIP: neoplasms of the urinary bladder: radiologic-pathologic correlation. Radiographics. 2006;26(2):553–80.10.1148/rg.262055172Search in Google Scholar PubMed
[5] Zhou N, Mitchell KG, Corsini EM, Truong VTT, Antonoff MB, Mehran RJ, et al. Analysis of trimodal and bimodal therapy in a selective-surgery paradigm for locally advanced oesophageal squamous cell carcinoma. Br J Surg. 2021;108(10):1207–15.10.1093/bjs/znab162Search in Google Scholar PubMed
[6] Luo H, Lu J, Bai Y, Mao T, Wang J, Fan Q, et al. Effect of camrelizumab vs placebo added to chemotherapy on survival and progression-free survival in patients with advanced or metastatic esophageal squamous cell carcinoma: the Escort-1st randomized clinical trial. JAMA. 2021;326(10):916–25.10.1001/jama.2021.12836Search in Google Scholar PubMed PubMed Central
[7] Ngcamphalala C, Ostensson E, Ginindza TG. The economic burden of cervical cancer in Eswatini: societal perspective. PLoS One. 2021;16(4):e0250113.10.1371/journal.pone.0250113Search in Google Scholar PubMed PubMed Central
[8] Hahn VS, Zhang KW, Sun L, Narayan V, Lenihan DJ, Ky B. Heart failure with targeted cancer therapies: mechanisms and cardioprotection. Circ Res. 2021;128(10):1576–93.10.1161/CIRCRESAHA.121.318223Search in Google Scholar PubMed PubMed Central
[9] Park T, Hwang M. Health care use and expenditures attributable to cancer: a population-based study. Res Soc Adm Pharm. 2021;17(7):1300–5.10.1016/j.sapharm.2020.09.017Search in Google Scholar PubMed
[10] Magnes T, Wagner S, Kiem D, Weiss L, Rinnerthaler G, Greil R, et al. Prognostic and predictive factors in advanced head and neck squamous cell carcinoma. Int J Mol Sci. 2021;22(9):4981.10.3390/ijms22094981Search in Google Scholar PubMed PubMed Central
[11] Chamoli A, Gosavi AS, Shirwadkar UP, Wangdale KV, Behera SK, Kurrey NK, et al. Overview of oral cavity squamous cell carcinoma: risk factors, mechanisms, and diagnostics. Oral Oncol. 2021;121:105451.10.1016/j.oraloncology.2021.105451Search in Google Scholar PubMed
[12] Yang X, Suo C, Zhang T, Yin X, Man J, Yuan Z, et al. A nomogram for screening esophageal squamous cell carcinoma based on environmental risk factors in a high-incidence area of China: a population-based case-control study. BMC Cancer. 2021;21(1):343.10.1186/s12885-021-08053-7Search in Google Scholar PubMed PubMed Central
[13] Mirlekar B. Tumor promoting roles of IL-10, TGF-beta, IL-4, and IL-35: Its implications in cancer immunotherapy. SAGE Open Med. 2022;10:1–15.10.1177/20503121211069012Search in Google Scholar PubMed PubMed Central
[14] Wei H, Li B, Sun A, Guo F. Interleukin-10 family cytokines immunobiology and structure. Adv Exp Med Biol. 2019;1172:79–96.10.1007/978-981-13-9367-9_4Search in Google Scholar PubMed
[15] Waldner MJ, Foersch S, Neurath MF. Interleukin-6 – a key regulator of colorectal cancer development. Int J Biol Sci. 2012;8(9):1248–53.10.7150/ijbs.4614Search in Google Scholar PubMed PubMed Central
[16] Pasvenskaite A, Liutkeviciene R, Gedvilaite G, Vilkeviciute A, Liutkevicius V, Uloza V. Impact of IL-10 promoter polymorphisms and il-10 serum levels on advanced laryngeal squamous cell carcinoma and survival rate. Cancer Genomics Proteom. 2021;18(1):53–65.10.21873/cgp.20241Search in Google Scholar PubMed PubMed Central
[17] Upadhyay R, Jain M, Kumar S, Ghoshal UC, Mittal B. Association of interleukin-6 (-174G > C) promoter polymorphism with risk of squamous cell esophageal cancer and tumor location: an exploratory study. Clin Immunol. 2008;128(2):199–204.10.1016/j.clim.2008.03.519Search in Google Scholar PubMed
[18] Datta A, Tuz Zahora F, Abdul Aziz M, Sarowar Uddin M, Ferdous M, Shalahuddin Millat M, et al. Association study of IL10 gene polymorphisms (rs1800872 and rs1800896) with cervical cancer in the Bangladeshi women. Int Immunopharmacol. 2020;89(Pt B):107091.10.1016/j.intimp.2020.107091Search in Google Scholar PubMed
[19] Guo W, Wang N, Wang YM, Li Y, Wen DG, Chen ZF, et al. Interleukin-10 -1082 promoter polymorphism is not associated with susceptibility to esophageal squamous cell carcinoma and gastric cardiac adenocarcinoma in a population of high-incidence region of north China. World J Gastroenterol. 2005;11(6):858–62.10.3748/wjg.v11.i6.858Search in Google Scholar PubMed PubMed Central
[20] El-Omar EM, Rabkin CS, Gammon MD, Vaughan TL, Risch HA, Schoenberg JB, et al. Increased risk of noncardia gastric cancer associated with proinflammatory cytokine gene polymorphisms. Gastroenterology. 2003;124(5):1193–201.10.1016/S0016-5085(03)00157-4Search in Google Scholar
[21] Dubben HH. Re: Assessing the probability that a positive report is false: an approach for molecular epidemiology studies. J Natl Cancer Inst. 2004;96(22):1722, author reply 1722–1723.10.1093/jnci/djh326Search in Google Scholar PubMed
[22] Wakefield J, Bayesian A. measure of the probability of false discovery in genetic epidemiology studies. Am J Hum Genet. 2007;81(2):208–27.10.1086/519024Search in Google Scholar PubMed PubMed Central
[23] Mao C, Li Z, Niu Y. The association between interleukin 10 gene promoter polymorphisms and oral squamous cell carcinoma risk. J Hubei Univ Med. 2021;40(6):566–70 + 577.Search in Google Scholar
[24] Chen S, Cao R, Liu C, Tang W, Kang M. Investigation of IL-4, IL-10, and HVEM polymorphisms with esophageal squamous cell carcinoma: a case–control study involving 1929 participants. Biosci Rep. 2020;40(8).10.1042/BSR20193895Search in Google Scholar PubMed PubMed Central
[25] Goud E, Malleedi S, Ramanathan A, Wong GR, Hwei Ern BT, Yean GY, et al. Association of interleukin-10 genotypes and oral cancer susceptibility in selected malaysian population: a case–control study. Asian Pac J Cancer Prev. 2019;20(3):935–41.10.31557/APJCP.2019.20.3.935Search in Google Scholar PubMed PubMed Central
[26] Sharma U, Singhal P, Bandil K, Kumar A, Bose S, Ahuja P, et al. Genetic variations of IL-10: identification of novel variations and evaluation of the impact of the SNPs/haplotype in the promoter region with the progression of oral squamous cell carcinoma in Indian population. Cytokine. 2018;103:99–108.10.1016/j.cyto.2017.09.016Search in Google Scholar PubMed
[27] Torres-Poveda K, Burguete-Garcia AI, Bahena-Roman M, Mendez-Martinez R, Zurita-Diaz MA, Lopez-Estrada G, et al. Risk allelic load in Th2 and Th3 cytokines genes as biomarker of susceptibility to HPV-16 positive cervical cancer: a case control study. BMC Cancer. 2016;16:330.10.1186/s12885-016-2364-4Search in Google Scholar PubMed PubMed Central
[28] Hussain SR, Ahmad MK, Mahdi AA, Naqvi H, Ahmad MW, Srivastava S, et al. Association of interleukin-10 (A1082G) gene polymorphism with oral squamous cell carcinoma in north Indian population. J Genet. 2016;95(2):249–55.10.1007/s12041-016-0626-1Search in Google Scholar PubMed
[29] Zhou J, Zhang D, Chen B, Li Q, Zhou L, Liu F, et al. Association of interleukin-10 promoter polymorphisms and corresponding plasma levels with susceptibility to laryngeal squamous cell carcinoma. Oncol Lett. 2014;7(5):1721–7.10.3892/ol.2014.1914Search in Google Scholar PubMed PubMed Central
[30] Torres-Poveda K, Burguete-García AI, Cruz M, Martínez-Nava GA, Bahena-Román M, Ortíz-Flores E, et al. The SNP at -592 of human IL-10 gene is associated with serum IL-10 levels and increased risk for human papillomavirus cervical lesion development. Infect Agents Cancer. 2012;7(1):32.10.1186/1750-9378-7-32Search in Google Scholar PubMed PubMed Central
[31] Jeong SW, Tae K, Lee SH, Kim KR, Park CW, Park BL, et al. Cox-2 and IL-10 polymorphisms and association with squamous cell carcinoma of the head and neck in a Korean sample. J Korean Med Sci. 2010;25(7):1024–8.10.3346/jkms.2010.25.7.1024Search in Google Scholar PubMed PubMed Central
[32] Vairaktaris E, Yapijakis C, Serefoglou Z, Derka S, Vassiliou S, Nkenke E, et al. The interleukin-10 (-1082A/G) polymorphism is strongly associated with increased risk for oral squamous cell carcinoma. Anticancer Res. 2008;28(1a):309–14.Search in Google Scholar
[33] Seifart C, Plagens A, Dempfle A, Clostermann U, Vogelmeier C, von Wichert P, et al. TNF-alpha, TNF-beta, IL-6, and IL-10 polymorphisms in patients with lung cancer. Dis Markers. 2005;21(3):157–65.10.1155/2005/707131Search in Google Scholar PubMed PubMed Central
[34] Zoodsma M, Nolte IM, Schipper M, Oosterom E, van der Steege G, de Vries EG, et al. Interleukin-10 and Fas polymorphisms and susceptibility for (pre)neoplastic cervical disease. Int J Gynecol Cancer. 2005;15(Suppl 3):282–90.10.1111/j.1525-1438.2005.00433.xSearch in Google Scholar PubMed
[35] Singh PK, Ahmad MK, Kumar V, Gupta R, Kohli M, Jain A, et al. Genetic polymorphism of interleukin-10 (-A592C) among oral cancer with squamous cell carcinoma. Arch Oral Biol. 2017;77:18–22.10.1016/j.archoralbio.2016.12.011Search in Google Scholar PubMed
[36] Sun JM, Li Q, Gu HY, Chen YJ, Wei JS, Zhu Q, et al. Interleukin 10 rs1800872 T > G polymorphism was associated with an increased risk of esophageal cancer in a Chinese population. Asian Pac J Cancer Prev. 2013;14(6):3443–7.10.7314/APJCP.2013.14.6.3443Search in Google Scholar PubMed
[37] Wang N, Guo W, Li Y, Wang YM, Wen DG, Chen ZF, et al. Relationship between interleukin-10 promoter polymorphisms and esophageal squamous cell carcinoma and gastric cardiac adenocarcinoma. Tumor. 2006;02:157–62.Search in Google Scholar
[38] Abakay CD, Pashazadeh M, Ardahanli E, Oral HB. Transforming growth factor-beta1 gene polymorphism as a potential risk factor in Turkish patients with laryngeal squamous cell carcinoma. J Cancer Res Ther. 2020;16(1):144–9.10.4103/jcrt.JCRT_598_19Search in Google Scholar PubMed
[39] Pasvenskaite A, Vilkeviciute A, Liutkeviciene R, Gedvilaite G, Liutkevicius V, Uloza V. Associations of IL6 rs1800795, BLK rs13277113, TIMP3 rs9621532, IL1RL1 rs1041973 and IL1RAP rs4624606 single gene polymorphisms with laryngeal squamous cell carcinoma. Gene. 2020;747:144700.10.1016/j.gene.2020.144700Search in Google Scholar PubMed
[40] Fernandez-Mateos J, Seijas-Tamayo R, Adansa Klain JC, Pastor Borgonon M, Perez-Ruiz E, Mesia R, et al. Genetic susceptibility in head and neck squamous cell carcinoma in a Spanish population. Cancers (Basel). 2019;11(4):493.10.3390/cancers11040493Search in Google Scholar PubMed PubMed Central
[41] Shi WJ, Liu H, Wu D, Tang ZH, Shen YC, Guo L. Stratification analysis and case–control study of relationships between interleukin-6 gene polymorphisms and cervical cancer risk in a Chinese population. Asian Pac J Cancer Prev. 2014;15(17):7357–62.10.7314/APJCP.2014.15.17.7357Search in Google Scholar
[42] Gaur P, Mittal M, Mohanti B, Das S. Functional variants of IL4 and IL6 genes and risk of tobacco-related oral carcinoma in high-risk Asian Indians. Oral Dis. 2011;17(7):720–6.10.1111/j.1601-0825.2011.01831.xSearch in Google Scholar PubMed
[43] Vairaktaris E, Yiannopoulos A, Vylliotis A, Yapijakis C, Derka S, Vassiliou S, et al. Strong association of interleukin-6 -174 G > C promoter polymorphism with increased risk of oral cancer. Int J Biol Markers. 2006;21(4):246–50.10.1177/172460080602100409Search in Google Scholar PubMed
[44] Campbell JD, Alexandrov A, Kim J, Wala J, Berger AH, Pedamallu CS, et al. Distinct patterns of somatic genome alterations in lung adenocarcinomas and squamous cell carcinomas. Nat Genet. 2016;48(6):607–16.10.1038/ng.3564Search in Google Scholar PubMed PubMed Central
[45] Hoadley KA, Yau C, Wolf DM, Cherniack AD, Tamborero D, Ng S, et al. Multiplatform analysis of 12 cancer types reveals molecular classification within and across tissues of origin. Cell. 2014;158(4):929–44.10.1016/j.cell.2014.06.049Search in Google Scholar PubMed PubMed Central
[46] Song Y, Li L, Ou Y, Gao Z, Li E, Li X, et al. Identification of genomic alterations in oesophageal squamous cell cancer. Nature. 2014;509(7498):91–5.10.1038/nature13176Search in Google Scholar PubMed
[47] Cacev T, Jokic M, Loncar B, Krizanac S, Kapitanovic S. Interleukin-6-174 G/C polymorphism is not associated with IL-6 expression and susceptibility to sporadic colon cancer. DNA Cell Biol. 2010;29(4):177–82.10.1089/dna.2009.0950Search in Google Scholar PubMed
[48] Miteva LD, Stanilov NS, Deliysky TS, Stanilova SA. Significance of -1082A/G polymorphism of IL10 gene for progression of colorectal cancer and IL-10 expression. Tumour Biol. 2014;35(12):12655–64.10.1007/s13277-014-2589-2Search in Google Scholar PubMed
[49] Wang YC, Sung WW, Wu TC, Wang L, Chien WP, Cheng YW, et al. Interleukin-10 haplotype may predict survival and relapse in resected non-small cell lung cancer. PLoS One. 2012;7(7):e39525.10.1371/journal.pone.0039525Search in Google Scholar PubMed PubMed Central
[50] Li F, Xu X, Xuan C, Chen WT. Association between interleukin-10 gene polymorphisms and risk of oral carcinoma: a meta-analysis. Histol Histopathol. 2020;35(11):1329–36.Search in Google Scholar
[51] Wang K, Jiao Z, Chen H, Liu X, Lu J, Liu X, et al. The association between rs1800872 polymorphism in interleukin-10 and risk of cervical cancer: a meta-analysis. Medicine. 2021;100(3):e23892.10.1097/MD.0000000000023892Search in Google Scholar PubMed PubMed Central
[52] Ni J, Ye Y, Teng F, Wu Q. Interleukin 10 polymorphisms and cervical cancer risk: a meta-analysis. Int J Gynecol Cancer. 2013;23(1):126–33.10.1097/IGC.0b013e318274b1a2Search in Google Scholar PubMed
[53] Li YF, Yang PZ, Li HF. Functional polymorphisms in the IL-10 gene with susceptibility to esophageal, nasopharyngeal, and oral cancers. Cancer Biomarkers Sect A Dis Markers. 2016;16(4):641–51.10.3233/CBM-160606Search in Google Scholar PubMed
[54] Mashhadiabbas F, Dastgheib SA, Hashemzehi A, Bahrololoomi Z, Asadian F, Neamatzadeh H, et al. Association of IL-10 -1082A > G, -819C > T, and -592C > A polymorphisms with susceptibility to chronic and aggressive periodontitis: a systematic review and meta-analysis. Inflamm Res. 2021;70(5):509–24.10.1007/s00011-021-01448-zSearch in Google Scholar PubMed
[55] Rezaei F, Mohammadi H, Heydari M, Sadeghi M, Mozaffari HR, Khavid A, et al. Association between IL-8 (-251T/A) and IL-6 (-174G/C) polymorphisms and oral cancer susceptibility: a systematic review and meta-analysis. Medicina (Kaunas, Lithuania). 2021;57(5):405.10.3390/medicina57050405Search in Google Scholar PubMed PubMed Central
© 2023 the author(s), published by De Gruyter
This work is licensed under the Creative Commons Attribution 4.0 International License.
Articles in the same Issue
- Biomedical Sciences
- Systemic investigation of inetetamab in combination with small molecules to treat HER2-overexpressing breast and gastric cancers
- Immunosuppressive treatment for idiopathic membranous nephropathy: An updated network meta-analysis
- Identifying two pathogenic variants in a patient with pigmented paravenous retinochoroidal atrophy
- Effects of phytoestrogens combined with cold stress on sperm parameters and testicular proteomics in rats
- A case of pulmonary embolism with bad warfarin anticoagulant effects caused by E. coli infection
- Neutrophilia with subclinical Cushing’s disease: A case report and literature review
- Isoimperatorin alleviates lipopolysaccharide-induced periodontitis by downregulating ERK1/2 and NF-κB pathways
- Immunoregulation of synovial macrophages for the treatment of osteoarthritis
- Novel CPLANE1 c.8948dupT (p.P2984Tfs*7) variant in a child patient with Joubert syndrome
- Antiphospholipid antibodies and the risk of thrombosis in myeloproliferative neoplasms
- Immunological responses of septic rats to combination therapy with thymosin α1 and vitamin C
- High glucose and high lipid induced mitochondrial dysfunction in JEG-3 cells through oxidative stress
- Pharmacological inhibition of the ubiquitin-specific protease 8 effectively suppresses glioblastoma cell growth
- Levocarnitine regulates the growth of angiotensin II-induced myocardial fibrosis cells via TIMP-1
- Age-related changes in peripheral T-cell subpopulations in elderly individuals: An observational study
- Single-cell transcription analysis reveals the tumor origin and heterogeneity of human bilateral renal clear cell carcinoma
- Identification of iron metabolism-related genes as diagnostic signatures in sepsis by blood transcriptomic analysis
- Long noncoding RNA ACART knockdown decreases 3T3-L1 preadipocyte proliferation and differentiation
- Surgery, adjuvant immunotherapy plus chemotherapy and radiotherapy for primary malignant melanoma of the parotid gland (PGMM): A case report
- Dosimetry comparison with helical tomotherapy, volumetric modulated arc therapy, and intensity-modulated radiotherapy for grade II gliomas: A single‑institution case series
- Soy isoflavone reduces LPS-induced acute lung injury via increasing aquaporin 1 and aquaporin 5 in rats
- Refractory hypokalemia with sexual dysplasia and infertility caused by 17α-hydroxylase deficiency and triple X syndrome: A case report
- Meta-analysis of cancer risk among end stage renal disease undergoing maintenance dialysis
- 6-Phosphogluconate dehydrogenase inhibition arrests growth and induces apoptosis in gastric cancer via AMPK activation and oxidative stress
- Experimental study on the optimization of ANM33 release in foam cells
- Primary retroperitoneal angiosarcoma: A case report
- Metabolomic analysis-identified 2-hydroxybutyric acid might be a key metabolite of severe preeclampsia
- Malignant pleural effusion diagnosis and therapy
- Effect of spaceflight on the phenotype and proteome of Escherichia coli
- Comparison of immunotherapy combined with stereotactic radiotherapy and targeted therapy for patients with brain metastases: A systemic review and meta-analysis
- Activation of hypermethylated P2RY1 mitigates gastric cancer by promoting apoptosis and inhibiting proliferation
- Association between the VEGFR-2 -604T/C polymorphism (rs2071559) and type 2 diabetic retinopathy
- The role of IL-31 and IL-34 in the diagnosis and treatment of chronic periodontitis
- Triple-negative mouse breast cancer initiating cells show high expression of beta1 integrin and increased malignant features
- mNGS facilitates the accurate diagnosis and antibiotic treatment of suspicious critical CNS infection in real practice: A retrospective study
- The apatinib and pemetrexed combination has antitumor and antiangiogenic effects against NSCLC
- Radiotherapy for primary thyroid adenoid cystic carcinoma
- Design and functional preliminary investigation of recombinant antigen EgG1Y162–EgG1Y162 against Echinococcus granulosus
- Effects of losartan in patients with NAFLD: A meta-analysis of randomized controlled trial
- Bibliometric analysis of METTL3: Current perspectives, highlights, and trending topics
- Performance comparison of three scaling algorithms in NMR-based metabolomics analysis
- PI3K/AKT/mTOR pathway and its related molecules participate in PROK1 silence-induced anti-tumor effects on pancreatic cancer
- The altered expression of cytoskeletal and synaptic remodeling proteins during epilepsy
- Effects of pegylated recombinant human granulocyte colony-stimulating factor on lymphocytes and white blood cells of patients with malignant tumor
- Prostatitis as initial manifestation of Chlamydia psittaci pneumonia diagnosed by metagenome next-generation sequencing: A case report
- NUDT21 relieves sevoflurane-induced neurological damage in rats by down-regulating LIMK2
- Association of interleukin-10 rs1800896, rs1800872, and interleukin-6 rs1800795 polymorphisms with squamous cell carcinoma risk: A meta-analysis
- Exosomal HBV-DNA for diagnosis and treatment monitoring of chronic hepatitis B
- Shear stress leads to the dysfunction of endothelial cells through the Cav-1-mediated KLF2/eNOS/ERK signaling pathway under physiological conditions
- Interaction between the PI3K/AKT pathway and mitochondrial autophagy in macrophages and the leukocyte count in rats with LPS-induced pulmonary infection
- Meta-analysis of the rs231775 locus polymorphism in the CTLA-4 gene and the susceptibility to Graves’ disease in children
- Cloning, subcellular localization and expression of phosphate transporter gene HvPT6 of hulless barley
- Coptisine mitigates diabetic nephropathy via repressing the NRLP3 inflammasome
- Significant elevated CXCL14 and decreased IL-39 levels in patients with tuberculosis
- Whole-exome sequencing applications in prenatal diagnosis of fetal bowel dilatation
- Gemella morbillorum infective endocarditis: A case report and literature review
- An unusual ectopic thymoma clonal evolution analysis: A case report
- Severe cumulative skin toxicity during toripalimab combined with vemurafenib following toripalimab alone
- Detection of V. vulnificus septic shock with ARDS using mNGS
- Novel rare genetic variants of familial and sporadic pulmonary atresia identified by whole-exome sequencing
- The influence and mechanistic action of sperm DNA fragmentation index on the outcomes of assisted reproduction technology
- Novel compound heterozygous mutations in TELO2 in an infant with You-Hoover-Fong syndrome: A case report and literature review
- ctDNA as a prognostic biomarker in resectable CLM: Systematic review and meta-analysis
- Diagnosis of primary amoebic meningoencephalitis by metagenomic next-generation sequencing: A case report
- Phylogenetic analysis of promoter regions of human Dolichol kinase (DOLK) and orthologous genes using bioinformatics tools
- Collagen changes in rabbit conjunctiva after conjunctival crosslinking
- Effects of NM23 transfection of human gastric carcinoma cells in mice
- Oral nifedipine and phytosterol, intravenous nicardipine, and oral nifedipine only: Three-arm, retrospective, cohort study for management of severe preeclampsia
- Case report of hepatic retiform hemangioendothelioma: A rare tumor treated with ultrasound-guided microwave ablation
- Curcumin induces apoptosis in human hepatocellular carcinoma cells by decreasing the expression of STAT3/VEGF/HIF-1α signaling
- Rare presentation of double-clonal Waldenström macroglobulinemia with pulmonary embolism: A case report
- Giant duplication of the transverse colon in an adult: A case report and literature review
- Ectopic thyroid tissue in the breast: A case report
- SDR16C5 promotes proliferation and migration and inhibits apoptosis in pancreatic cancer
- Vaginal metastasis from breast cancer: A case report
- Screening of the best time window for MSC transplantation to treat acute myocardial infarction with SDF-1α antibody-loaded targeted ultrasonic microbubbles: An in vivo study in miniswine
- Inhibition of TAZ impairs the migration ability of melanoma cells
- Molecular complexity analysis of the diagnosis of Gitelman syndrome in China
- Effects of maternal calcium and protein intake on the development and bone metabolism of offspring mice
- Identification of winter wheat pests and diseases based on improved convolutional neural network
- Ultra-multiplex PCR technique to guide treatment of Aspergillus-infected aortic valve prostheses
- Virtual high-throughput screening: Potential inhibitors targeting aminopeptidase N (CD13) and PIKfyve for SARS-CoV-2
- Immune checkpoint inhibitors in cancer patients with COVID-19
- Utility of methylene blue mixed with autologous blood in preoperative localization of pulmonary nodules and masses
- Integrated analysis of the microbiome and transcriptome in stomach adenocarcinoma
- Berberine suppressed sarcopenia insulin resistance through SIRT1-mediated mitophagy
- DUSP2 inhibits the progression of lupus nephritis in mice by regulating the STAT3 pathway
- Lung abscess by Fusobacterium nucleatum and Streptococcus spp. co-infection by mNGS: A case series
- Genetic alterations of KRAS and TP53 in intrahepatic cholangiocarcinoma associated with poor prognosis
- Granulomatous polyangiitis involving the fourth ventricle: Report of a rare case and a literature review
- Studying infant mortality: A demographic analysis based on data mining models
- Metaplastic breast carcinoma with osseous differentiation: A report of a rare case and literature review
- Protein Z modulates the metastasis of lung adenocarcinoma cells
- Inhibition of pyroptosis and apoptosis by capsaicin protects against LPS-induced acute kidney injury through TRPV1/UCP2 axis in vitro
- TAK-242, a toll-like receptor 4 antagonist, against brain injury by alleviates autophagy and inflammation in rats
- Primary mediastinum Ewing’s sarcoma with pleural effusion: A case report and literature review
- Association of ADRB2 gene polymorphisms and intestinal microbiota in Chinese Han adolescents
- Tanshinone IIA alleviates chondrocyte apoptosis and extracellular matrix degeneration by inhibiting ferroptosis
- Study on the cytokines related to SARS-Cov-2 in testicular cells and the interaction network between cells based on scRNA-seq data
- Effect of periostin on bone metabolic and autophagy factors during tooth eruption in mice
- HP1 induces ferroptosis of renal tubular epithelial cells through NRF2 pathway in diabetic nephropathy
- Intravaginal estrogen management in postmenopausal patients with vaginal squamous intraepithelial lesions along with CO2 laser ablation: A retrospective study
- Hepatocellular carcinoma cell differentiation trajectory predicts immunotherapy, potential therapeutic drugs, and prognosis of patients
- Effects of physical exercise on biomarkers of oxidative stress in healthy subjects: A meta-analysis of randomized controlled trials
- Identification of lysosome-related genes in connection with prognosis and immune cell infiltration for drug candidates in head and neck cancer
- Development of an instrument-free and low-cost ELISA dot-blot test to detect antibodies against SARS-CoV-2
- Research progress on gas signal molecular therapy for Parkinson’s disease
- Adiponectin inhibits TGF-β1-induced skin fibroblast proliferation and phenotype transformation via the p38 MAPK signaling pathway
- The G protein-coupled receptor-related gene signatures for predicting prognosis and immunotherapy response in bladder urothelial carcinoma
- α-Fetoprotein contributes to the malignant biological properties of AFP-producing gastric cancer
- CXCL12/CXCR4/CXCR7 axis in placenta tissues of patients with placenta previa
- Association between thyroid stimulating hormone levels and papillary thyroid cancer risk: A meta-analysis
- Significance of sTREM-1 and sST2 combined diagnosis for sepsis detection and prognosis prediction
- Diagnostic value of serum neuroactive substances in the acute exacerbation of chronic obstructive pulmonary disease complicated with depression
- Research progress of AMP-activated protein kinase and cardiac aging
- TRIM29 knockdown prevented the colon cancer progression through decreasing the ubiquitination levels of KRT5
- Cross-talk between gut microbiota and liver steatosis: Complications and therapeutic target
- Metastasis from small cell lung cancer to ovary: A case report
- The early diagnosis and pathogenic mechanisms of sepsis-related acute kidney injury
- The effect of NK cell therapy on sepsis secondary to lung cancer: A case report
- Erianin alleviates collagen-induced arthritis in mice by inhibiting Th17 cell differentiation
- Loss of ACOX1 in clear cell renal cell carcinoma and its correlation with clinical features
- Signalling pathways in the osteogenic differentiation of periodontal ligament stem cells
- Crosstalk between lactic acid and immune regulation and its value in the diagnosis and treatment of liver failure
- Clinicopathological features and differential diagnosis of gastric pleomorphic giant cell carcinoma
- Traumatic brain injury and rTMS-ERPs: Case report and literature review
- Extracellular fibrin promotes non-small cell lung cancer progression through integrin β1/PTEN/AKT signaling
- Knockdown of DLK4 inhibits non-small cell lung cancer tumor growth by downregulating CKS2
- The co-expression pattern of VEGFR-2 with indicators related to proliferation, apoptosis, and differentiation of anagen hair follicles
- Inflammation-related signaling pathways in tendinopathy
- CD4+ T cell count in HIV/TB co-infection and co-occurrence with HL: Case report and literature review
- Clinical analysis of severe Chlamydia psittaci pneumonia: Case series study
- Bioinformatics analysis to identify potential biomarkers for the pulmonary artery hypertension associated with the basement membrane
- Influence of MTHFR polymorphism, alone or in combination with smoking and alcohol consumption, on cancer susceptibility
- Catharanthus roseus (L.) G. Don counteracts the ampicillin resistance in multiple antibiotic-resistant Staphylococcus aureus by downregulation of PBP2a synthesis
- Combination of a bronchogenic cyst in the thoracic spinal canal with chronic myelocytic leukemia
- Bacterial lipoprotein plays an important role in the macrophage autophagy and apoptosis induced by Salmonella typhimurium and Staphylococcus aureus
- TCL1A+ B cells predict prognosis in triple-negative breast cancer through integrative analysis of single-cell and bulk transcriptomic data
- Ezrin promotes esophageal squamous cell carcinoma progression via the Hippo signaling pathway
- Ferroptosis: A potential target of macrophages in plaque vulnerability
- Predicting pediatric Crohn's disease based on six mRNA-constructed risk signature using comprehensive bioinformatic approaches
- Applications of genetic code expansion and photosensitive UAAs in studying membrane proteins
- HK2 contributes to the proliferation, migration, and invasion of diffuse large B-cell lymphoma cells by enhancing the ERK1/2 signaling pathway
- IL-17 in osteoarthritis: A narrative review
- Circadian cycle and neuroinflammation
- Probiotic management and inflammatory factors as a novel treatment in cirrhosis: A systematic review and meta-analysis
- Hemorrhagic meningioma with pulmonary metastasis: Case report and literature review
- SPOP regulates the expression profiles and alternative splicing events in human hepatocytes
- Knockdown of SETD5 inhibited glycolysis and tumor growth in gastric cancer cells by down-regulating Akt signaling pathway
- PTX3 promotes IVIG resistance-induced endothelial injury in Kawasaki disease by regulating the NF-κB pathway
- Pancreatic ectopic thyroid tissue: A case report and analysis of literature
- The prognostic impact of body mass index on female breast cancer patients in underdeveloped regions of northern China differs by menopause status and tumor molecular subtype
- Report on a case of liver-originating malignant melanoma of unknown primary
- Case report: Herbal treatment of neutropenic enterocolitis after chemotherapy for breast cancer
- The fibroblast growth factor–Klotho axis at molecular level
- Characterization of amiodarone action on currents in hERG-T618 gain-of-function mutations
- A case report of diagnosis and dynamic monitoring of Listeria monocytogenes meningitis with NGS
- Effect of autologous platelet-rich plasma on new bone formation and viability of a Marburg bone graft
- Small breast epithelial mucin as a useful prognostic marker for breast cancer patients
- Continuous non-adherent culture promotes transdifferentiation of human adipose-derived stem cells into retinal lineage
- Nrf3 alleviates oxidative stress and promotes the survival of colon cancer cells by activating AKT/BCL-2 signal pathway
- Favorable response to surufatinib in a patient with necrolytic migratory erythema: A case report
- Case report of atypical undernutrition of hypoproteinemia type
- Down-regulation of COL1A1 inhibits tumor-associated fibroblast activation and mediates matrix remodeling in the tumor microenvironment of breast cancer
- Sarcoma protein kinase inhibition alleviates liver fibrosis by promoting hepatic stellate cells ferroptosis
- Research progress of serum eosinophil in chronic obstructive pulmonary disease and asthma
- Clinicopathological characteristics of co-existing or mixed colorectal cancer and neuroendocrine tumor: Report of five cases
- Role of menopausal hormone therapy in the prevention of postmenopausal osteoporosis
- Precisional detection of lymph node metastasis using tFCM in colorectal cancer
- Advances in diagnosis and treatment of perimenopausal syndrome
- A study of forensic genetics: ITO index distribution and kinship judgment between two individuals
- Acute lupus pneumonitis resembling miliary tuberculosis: A case-based review
- Plasma levels of CD36 and glutathione as biomarkers for ruptured intracranial aneurysm
- Fractalkine modulates pulmonary angiogenesis and tube formation by modulating CX3CR1 and growth factors in PVECs
- Novel risk prediction models for deep vein thrombosis after thoracotomy and thoracoscopic lung cancer resections, involving coagulation and immune function
- Exploring the diagnostic markers of essential tremor: A study based on machine learning algorithms
- Evaluation of effects of small-incision approach treatment on proximal tibia fracture by deep learning algorithm-based magnetic resonance imaging
- An online diagnosis method for cancer lesions based on intelligent imaging analysis
- Medical imaging in rheumatoid arthritis: A review on deep learning approach
- Predictive analytics in smart healthcare for child mortality prediction using a machine learning approach
- Utility of neutrophil–lymphocyte ratio and platelet–lymphocyte ratio in predicting acute-on-chronic liver failure survival
- A biomedical decision support system for meta-analysis of bilateral upper-limb training in stroke patients with hemiplegia
- TNF-α and IL-8 levels are positively correlated with hypobaric hypoxic pulmonary hypertension and pulmonary vascular remodeling in rats
- Stochastic gradient descent optimisation for convolutional neural network for medical image segmentation
- Comparison of the prognostic value of four different critical illness scores in patients with sepsis-induced coagulopathy
- Application and teaching of computer molecular simulation embedded technology and artificial intelligence in drug research and development
- Hepatobiliary surgery based on intelligent image segmentation technology
- Value of brain injury-related indicators based on neural network in the diagnosis of neonatal hypoxic-ischemic encephalopathy
- Analysis of early diagnosis methods for asymmetric dementia in brain MR images based on genetic medical technology
- Early diagnosis for the onset of peri-implantitis based on artificial neural network
- Clinical significance of the detection of serum IgG4 and IgG4/IgG ratio in patients with thyroid-associated ophthalmopathy
- Forecast of pain degree of lumbar disc herniation based on back propagation neural network
- SPA-UNet: A liver tumor segmentation network based on fused multi-scale features
- Systematic evaluation of clinical efficacy of CYP1B1 gene polymorphism in EGFR mutant non-small cell lung cancer observed by medical image
- Rehabilitation effect of intelligent rehabilitation training system on hemiplegic limb spasms after stroke
- A novel approach for minimising anti-aliasing effects in EEG data acquisition
- ErbB4 promotes M2 activation of macrophages in idiopathic pulmonary fibrosis
- Clinical role of CYP1B1 gene polymorphism in prediction of postoperative chemotherapy efficacy in NSCLC based on individualized health model
- Lung nodule segmentation via semi-residual multi-resolution neural networks
- Evaluation of brain nerve function in ICU patients with Delirium by deep learning algorithm-based resting state MRI
- A data mining technique for detecting malignant mesothelioma cancer using multiple regression analysis
- Markov model combined with MR diffusion tensor imaging for predicting the onset of Alzheimer’s disease
- Effectiveness of the treatment of depression associated with cancer and neuroimaging changes in depression-related brain regions in patients treated with the mediator-deuterium acupuncture method
- Molecular mechanism of colorectal cancer and screening of molecular markers based on bioinformatics analysis
- Monitoring and evaluation of anesthesia depth status data based on neuroscience
- Exploring the conformational dynamics and thermodynamics of EGFR S768I and G719X + S768I mutations in non-small cell lung cancer: An in silico approaches
- Optimised feature selection-driven convolutional neural network using gray level co-occurrence matrix for detection of cervical cancer
- Incidence of different pressure patterns of spinal cerebellar ataxia and analysis of imaging and genetic diagnosis
- Pathogenic bacteria and treatment resistance in older cardiovascular disease patients with lung infection and risk prediction model
- Adoption value of support vector machine algorithm-based computed tomography imaging in the diagnosis of secondary pulmonary fungal infections in patients with malignant hematological disorders
- From slides to insights: Harnessing deep learning for prognostic survival prediction in human colorectal cancer histology
- Ecology and Environmental Science
- Monitoring of hourly carbon dioxide concentration under different land use types in arid ecosystem
- Comparing the differences of prokaryotic microbial community between pit walls and bottom from Chinese liquor revealed by 16S rRNA gene sequencing
- Effects of cadmium stress on fruits germination and growth of two herbage species
- Bamboo charcoal affects soil properties and bacterial community in tea plantations
- Optimization of biogas potential using kinetic models, response surface methodology, and instrumental evidence for biodegradation of tannery fleshings during anaerobic digestion
- Understory vegetation diversity patterns of Platycladus orientalis and Pinus elliottii communities in Central and Southern China
- Studies on macrofungi diversity and discovery of new species of Abortiporus from Baotianman World Biosphere Reserve
- Food Science
- Effect of berrycactus fruit (Myrtillocactus geometrizans) on glutamate, glutamine, and GABA levels in the frontal cortex of rats fed with a high-fat diet
- Guesstimate of thymoquinone diversity in Nigella sativa L. genotypes and elite varieties collected from Indian states using HPTLC technique
- Analysis of bacterial community structure of Fuzhuan tea with different processing techniques
- Untargeted metabolomics reveals sour jujube kernel benefiting the nutritional value and flavor of Morchella esculenta
- Mycobiota in Slovak wine grapes: A case study from the small Carpathians wine region
- Elemental analysis of Fadogia ancylantha leaves used as a nutraceutical in Mashonaland West Province, Zimbabwe
- Microbiological transglutaminase: Biotechnological application in the food industry
- Influence of solvent-free extraction of fish oil from catfish (Clarias magur) heads using a Taguchi orthogonal array design: A qualitative and quantitative approach
- Chromatographic analysis of the chemical composition and anticancer activities of Curcuma longa extract cultivated in Palestine
- The potential for the use of leghemoglobin and plant ferritin as sources of iron
- Investigating the association between dietary patterns and glycemic control among children and adolescents with T1DM
- Bioengineering and Biotechnology
- Biocompatibility and osteointegration capability of β-TCP manufactured by stereolithography 3D printing: In vitro study
- Clinical characteristics and the prognosis of diabetic foot in Tibet: A single center, retrospective study
- Agriculture
- Biofertilizer and NPSB fertilizer application effects on nodulation and productivity of common bean (Phaseolus vulgaris L.) at Sodo Zuria, Southern Ethiopia
- On correlation between canopy vegetation and growth indexes of maize varieties with different nitrogen efficiencies
- Exopolysaccharides from Pseudomonas tolaasii inhibit the growth of Pleurotus ostreatus mycelia
- A transcriptomic evaluation of the mechanism of programmed cell death of the replaceable bud in Chinese chestnut
- Melatonin enhances salt tolerance in sorghum by modulating photosynthetic performance, osmoregulation, antioxidant defense, and ion homeostasis
- Effects of plant density on alfalfa (Medicago sativa L.) seed yield in western Heilongjiang areas
- Identification of rice leaf diseases and deficiency disorders using a novel DeepBatch technique
- Artificial intelligence and internet of things oriented sustainable precision farming: Towards modern agriculture
- Animal Sciences
- Effect of ketogenic diet on exercise tolerance and transcriptome of gastrocnemius in mice
- Combined analysis of mRNA–miRNA from testis tissue in Tibetan sheep with different FecB genotypes
- Isolation, identification, and drug resistance of a partially isolated bacterium from the gill of Siniperca chuatsi
- Tracking behavioral changes of confined sows from the first mating to the third parity
- The sequencing of the key genes and end products in the TLR4 signaling pathway from the kidney of Rana dybowskii exposed to Aeromonas hydrophila
- Development of a new candidate vaccine against piglet diarrhea caused by Escherichia coli
- Plant Sciences
- Crown and diameter structure of pure Pinus massoniana Lamb. forest in Hunan province, China
- Genetic evaluation and germplasm identification analysis on ITS2, trnL-F, and psbA-trnH of alfalfa varieties germplasm resources
- Tissue culture and rapid propagation technology for Gentiana rhodantha
- Effects of cadmium on the synthesis of active ingredients in Salvia miltiorrhiza
- Cloning and expression analysis of VrNAC13 gene in mung bean
- Chlorate-induced molecular floral transition revealed by transcriptomes
- Effects of warming and drought on growth and development of soybean in Hailun region
- Effects of different light conditions on transient expression and biomass in Nicotiana benthamiana leaves
- Comparative analysis of the rhizosphere microbiome and medicinally active ingredients of Atractylodes lancea from different geographical origins
- Distinguish Dianthus species or varieties based on chloroplast genomes
- Comparative transcriptomes reveal molecular mechanisms of apple blossoms of different tolerance genotypes to chilling injury
- Study on fresh processing key technology and quality influence of Cut Ophiopogonis Radix based on multi-index evaluation
- An advanced approach for fig leaf disease detection and classification: Leveraging image processing and enhanced support vector machine methodology
- Erratum
- Erratum to “Protein Z modulates the metastasis of lung adenocarcinoma cells”
- Erratum to “BRCA1 subcellular localization regulated by PI3K signaling pathway in triple-negative breast cancer MDA-MB-231 cells and hormone-sensitive T47D cells”
- Retraction
- Retraction to “Protocatechuic acid attenuates cerebral aneurysm formation and progression by inhibiting TNF-alpha/Nrf-2/NF-kB-mediated inflammatory mechanisms in experimental rats”