Investigation of different nanoparticles properties on the thermal conductivity and viscosity of nanofluids by molecular dynamics simulation
-
Ruihao Zhang
 ,
Xiaohui Zhang
,
Zhumei Luo
,
Xiaohui Zhang
,
Zhumei Luo

Abstract
The mechanisms of thermal conductivity enhancement and the factors influencing viscosity are of great interest in the study of nanofluids, while molecular dynamics (MD) simulations considering nanofluids provide more accurate predictions of microscopic properties than conventional experimental studies. MD simulations of non-equilibrium molecular dynamics and reversing perturbation non-equilibrium molecular dynamics methods were used to study thermal conductivity and viscosity, taking into account a variety of influencing factors, as well as nanoparticle material and volume fraction. Through the analysis of the number density distribution, radial distribution function (RDF), and mean square displacement (MSD), the influences of different nanoparticles (Ag, Cu, Au, and Fe) were described and investigated: Ag particles contribute to 47.0% increase in thermal conductivity of 2.5 vol% nanofluids; Au particles improved the viscosity of 2.5 vol% nanofluids by 20.2%; the number density distribution showed positive linear relationship with the atomic mass; the results of MSD and RDF (mean square displacement and radial distribution function) in combination indicated a positive effect of interfacial nanolayer. The results of this research provide important perspectives for comprehending the impacts of multiple nanoparticles on the micro-thermal properties of nanofluids and also highlight the simulation potential of Au–Ar nanofluids.
Nomenclature
- A
-
the cross-sectional area perpendicular to the heat flux direction (m2)
- J
-
heat flow density (J m/s)
- L x
-
the length of the X direction (m)
- L y
-
the length of the Y direction (m)
- L-J
-
Lennard-Jones
- MSD
-
- NEMD
-
non-equilibrium molecular dynamics
- N
-
number of particles
- P
-
stress tensor (Pa)
- RDF
-
- RNEMD
-
reverse non-equilibrium molecular dynamics
- r ij
-
the molecular spacing between particle i and particle j (m)
- v i
-
velocity of atom i (m/s)
- V
-
the volume of the system (m3)
Greek symbols
- ε
-
the energy constant (
- σ
-
the length constant (
- η
-
shear viscosity (Pa s)
-
-
thermal conductivity (W/m K)
- Δt
-
time step (s)
- T
-
temperature (K)
Subscripts
- f
-
base fluid
- i
-
numbering of atom i
- j
-
numbering of atom j
- nf
-
nanofluids
1 Introduction
Being defined as liquid colloidal solutions containing nano-sized solid particles suspended in the base fluid, nanofluids have been widely investigated by researchers on account of their remarkable thermophysical properties and countless potential applications [1,2]. Similarly, as excellent heat transfer media, its high heat transfer capacity and potential applications have been widely applied as heat exchange of devices and energy systems [3,4].
The viscosity of a nanofluids becomes as significant as its thermal conductivity due to the fluids typically involved in the applications mentioned above, as well as drawing a great deal of research attention [5]. Based on molecular dynamics (MD) simulations, these two properties have been investigated and discussed extensively. After comparing the thermal conductivity values between various nanoparticle shapes, Bhanushali et al. [6] concluded that nanowire-shape particles reduce the detrimental impact of surface mechanical resistance on thermal transfer because of their higher aspect ratio. Analogously, nanoparticles with large aspect ratios enhance thermal conductivity with increased heat transfer rates during nanoparticle collisions, a conclusion noted by Ghosh et al. [7] in their study. Zhou et al. [8] demonstrated a comparison of the heat transfer behaviors of Cu–Ar nanofluids by constructing a non-equilibrium molecular dynamics (NEMD) simulation model. The thermal conductivity simulations and their fraction calculations were also presented to explore the relationship between the energy transfer terms of molecular motion and the agglomeration state of nanoparticles. Liao et al. [9] also calculated the potential effects of different initial aggregation structures on the thermal conductivity of various volume fractions using the Cu–Ar nanofluids model, which revealed the microscopic mechanism of the influence on thermal conductivity by nanoparticle structure. Lou and Yang [10] investigated various factors affecting the shear viscosity of Al2O3 water-based nanofluids, namely, particle size, concentration, and temperature through a combination of MD simulations and experiments. Similarly, Jabbari et al. [11] contrasted the functions of particle volume fraction and nanofluids temperature by exploring physical phenomena of SWCNT/water nanofluids employing Green–Kubo MD simulations, which indicated that the volume fraction was the most direct factor of viscosity increase. Zeroual et al. [12] investigated the factors related to the influence of the viscosity of Cu–Ar nanofluids and confirmed that the appearance of compact nanolayers at the boundary between the nanoparticles and the base fluid proved to be the origin of the influence of the volume fraction over the viscosity.
The presence of nanolayers around nanoparticles, as extensively demonstrated in previous studies above, is an essential factor that relates to the improved thermal conductivity by means of the intermediate thermal resistance that exists among the liquid and solid phases [13,14], also, it is a recognized mechanism for thermal conductivity enhancement and viscosity increase [15]. Akiner et al. [16] simulated the heat transport in Cu–H2O systems employing individual copper particles in their study, and the results can be explained brilliantly by interfacial dynamics. Guo and Zhao [17] examined the interfacial layer adsorption properties around the surface of Cu nanoparticles and discovered that the particle–fluid interfacial layer with thickness significantly depending on the nanoparticle diameter was formed around the nanoparticles, which might be exploited to explain the variation in the thermal conductivity. Importantly, the effects of various characteristics of nanoparticles in terms of type, media, and volume density on thermal conductivity were investigated systematically by Cui et al. [18] and the enhancement of thermal conductivity by Ag nanoparticles was better than Cu, Au, and Fe.
In another report by Cui et al. [19], a study was conducted for the liquid–solid interfacial absorption layer in nanofluids that had been proven to exist, at the same time, the impacts of different elements on the microstructure were concluded. The abovementioned simulation studies on nanofluids contain different kinds of particles, and several scholars have considered multiple nanoparticle cases, but the combination of thermal conductivity and viscosity studies is insufficient, besides the microscopic laws of different nanoparticles have not been further investigated.
In this study, NEMD based on NEMD and reversing perturbation non-equilibrium molecular dynamics (RNEMD) methods will be used to perform the detailed MD simulations and the main objective is to reveal the mechanisms and comparisons in the thermal conductivity and viscosity strengthening of four types of nanofluids containing different kinds of nanoparticles. In order to evaluate the credibility of the simulations model, the results are presented in comparison with a series of theoretical and experimental data published previously. In addition, the microstructures of nanofluids are explored by the number density study method to further understand the microscopic mechanisms of nanofluids. The number density distribution, mean square displacement (MSD), and radial distribution function (RDF) of atoms in nanofluids containing different types of metal atoms are interpreted systematically.
2 Simulation methodology
2.1 Choices of potential energy function and parameters
In this research, simulations were established for pure Ar and Cu/Au/Ag/Fe–Ar nanofluids, so as to say that the nanofluid systems were formed by adding structures of four types of nanoparticles in Ar liquid. Although Ar liquid is not a real fluid, this fluid type requires less computational time compared to other complex base fluids such as water, more importantly, its interatomic potential shows the same behavior as the actual base fluid, which facilitates the extension of theoretical models to practical experiments [20]. All simulations were performed by the LAMMPS package (partial use of GPU acceleration) [21,22] and the atomistic visualizations were observed using the technique of Ovito [23].
The interatomic potentials between all the argon atoms are modeled by the 12–6 Lennard-Jones potential, which allows direct use in calculating the interactions of Ar/Ar and Cu/Au/Ag/Fe–Ar in nanofluid systems [24] and enables to improve the speed and computational accuracy of LAMMPS runs with the aid of the latest GPU acceleration capabilities [22]. The mathematical expression is given below.
The Lorentz Berthelot mixing rules [25] are applied for computing the forces between various atoms.
where ε denotes the energy constant, σ represents the length constant, r
ij
denotes the separation between i with j particles, and r
c expresses the cutoff radius (
L-J potential energy parameters for Cu/Au/Ag/Fe/Ar interactions
| Atom pair |
|
|
|---|---|---|
| Ar–Ar | 0.0104 | 3.405 |
| Cu–Cu | 0.4096 | 2.338 |
| Au–Au | 0.4447 | 2.637 |
| Au–Ar | 0.0680 | 3.021 |
| Cu–Ar | 0.0650 | 2.871 |
| Ag–Ag | 0.3447 | 2.644 |
| Ag–Ar | 0.0598 | 3.025 |
| Fe–Fe | 0.5300 | 2.321 |
| Fe–Ar | 0.0740 | 2.863 |
2.2 Heat flux calculation and thermal conductivity formula
One of the prominent properties of nanofluids is thermal conductivity, and the method used to calculate thermal conductivity is predicated on NEMD [26]. This approach supposes that the transport direction occurs along the specific axis (the transport heat flow is set in the x-axis), while the macroscopic behavior of the heat transfer phenomenon is characterized by Fourier’s law [27]. In this approach, a temperature gradient needs to be established for a suitable time period first, from which the system attains a steady state [28]. Afterwards, the uniformly varying temperature gradient of the system is measured based on the obtained data, then the thermal conductivity k of the system expressed is as follows:
where
The temperature gradient
where x denotes the translation in the direction of heat conduction, and T denotes the temperature.
Concretely, the speed-heavy criterion NEMD method presented by Ikeshoji and Hafskjold [29] is applied in this part of the study rationally, while the most important heat flow density
For a given
Dividing by two for the whole system avoids double counting of the heat outflow and inflow directions, which is due to the fact that the system is governed by a periodic boundary condition A, so that
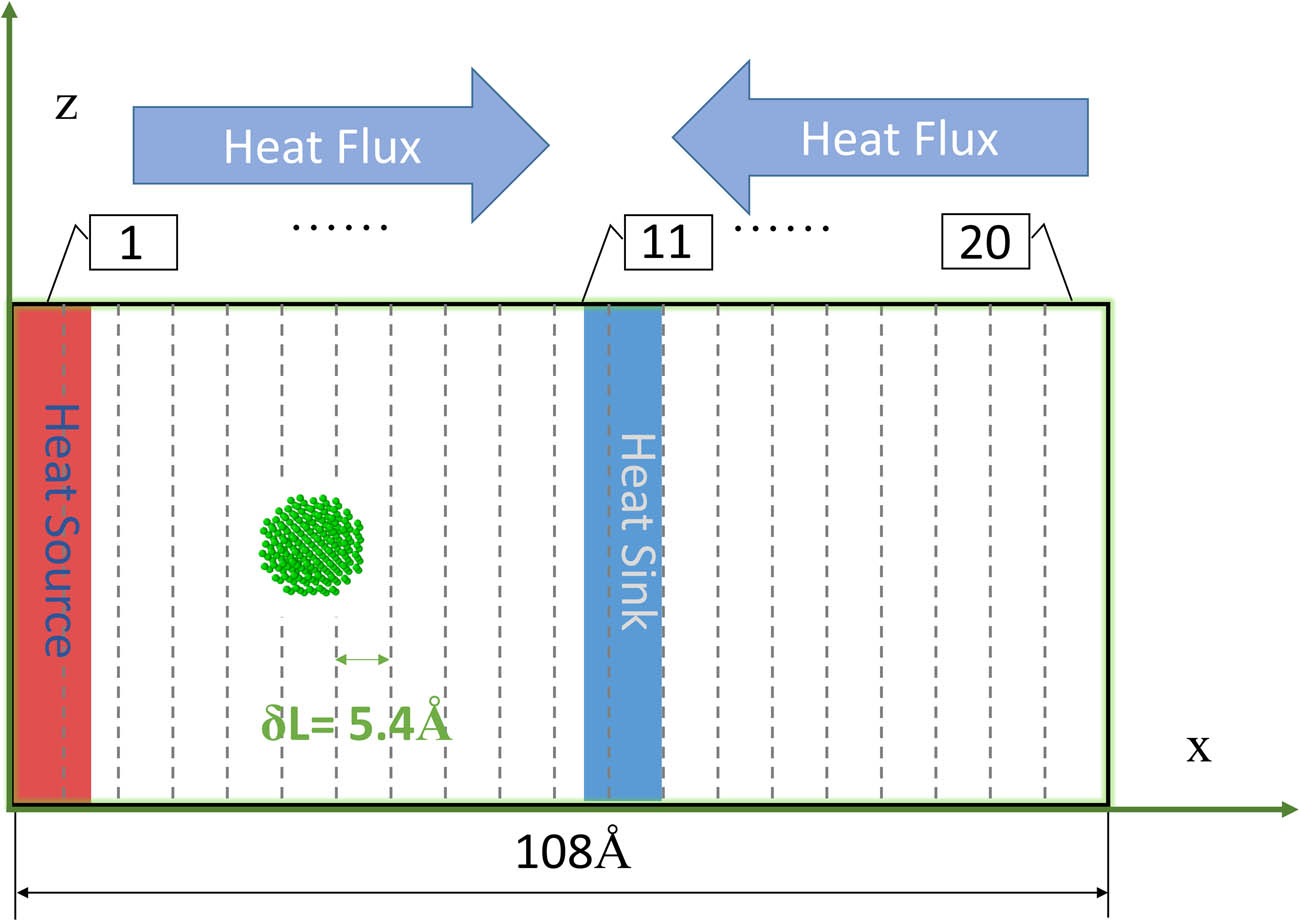
The distribution of the heat source (red) and heat sink (blue) along the x-axis in the simulated nanofluids.
2.3 Stress tensors and viscosity
The physical quantity that measures the internal friction that impedes the flow of a fluid is called viscosity of a fluid [11]. The analysis of fluid transport properties and thermal properties in MD research relies on the calculation of viscosity, and the calculation of system viscosity is essential in the field of nanofluids research [12].
The calculation of shear viscosity used in this section is based on RNEMD, namely, the MP method [30,31]. The gradient of v
x
is instituted in the Z-direction by clipping the liquid as shown in Figure 2, resulting in the X momentum flows along the Z-direction, generating a flux of momentum
where
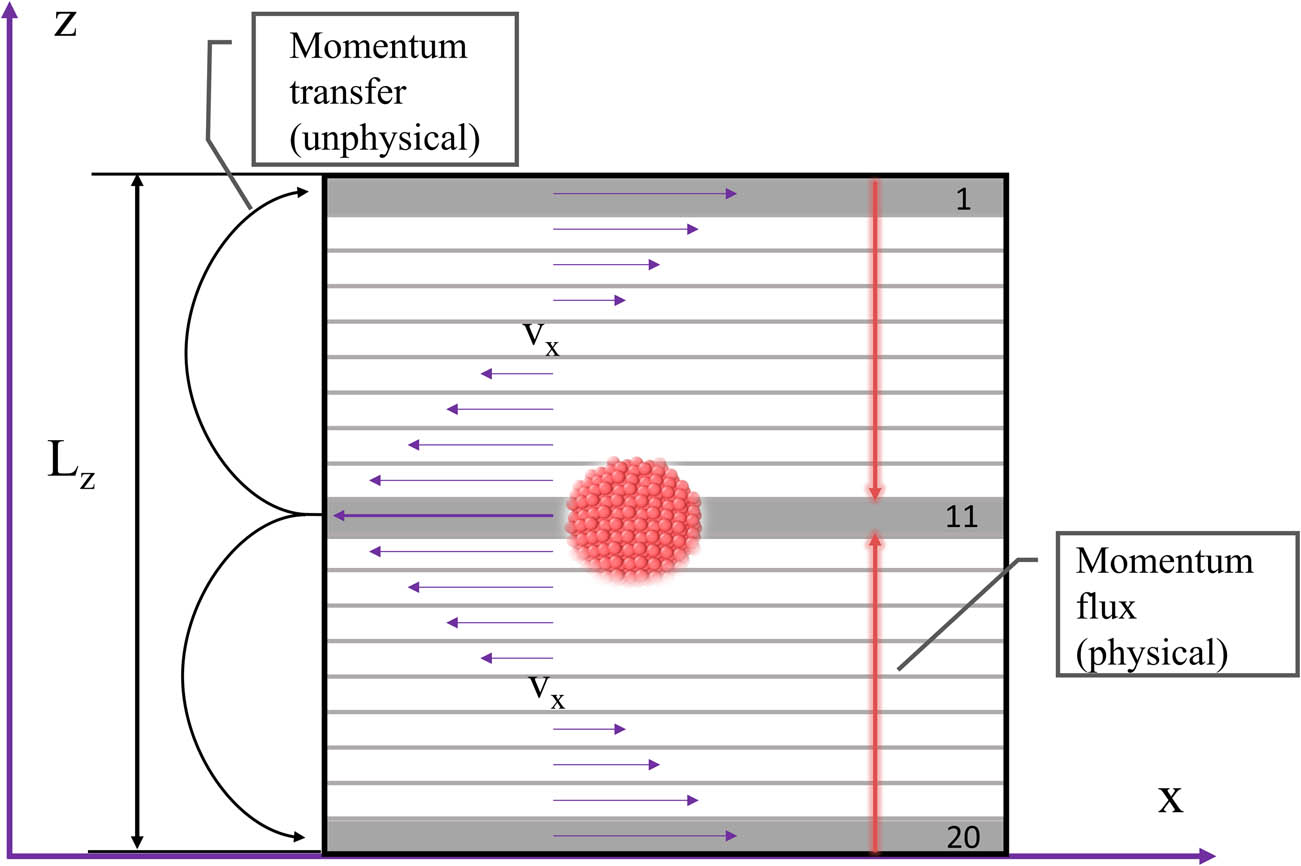
Geometry of the non-equilibrium in the simulated nanofluids.
2.4 Calculation of RDF
The RDF method is typically used to provide insight into the atomic interactions between two similar or different species [32], where g(r) denotes the probability of discovering adjacent atoms at a specified distance from the central atom. In the present study, the following formula is used for the purpose of exploring the microstructural features of nanofluids [33]:
where n
a
and n
b
stand for the amounts of particles; n
ib
(r,
2.5 Calculation of MSD
The MSD analysis technique allows for a specific study of nanofluid dynamics properties and also infers reinforced heat transfer principle by nanofluids [34] by the following formula:
where
3 Validation of the MD simulation model
3.1 Thermal conductivity
In the present simulation calculations, a simulation box of 108 Å × 55 Å × 55 Å (x, y, and z directions) was structured, and the absorbed energy value of the system was determined by applying the “Fix Ehex” command to the heat source and the heat sink. Before simulating the Cu/Au/Ag/Fe–Ar nanofluids, an effective calculation of the thermal conductivity of pure Ar was performed at 85 K to verify the accuracy of the simulation [35], with the power value of the process set to 0.05 eV/ps (with the metal units in LAMMPS). First of all, the entire simulation system (the box of 7,039 pure Ar atoms) was equilibrated for 0.8 ns to obtain a consistent temperature of 85 K in the regular system synthesis (constant volume and temperature, NVT), which used the Nose–Hoover thermostat with 2 fs time steps. Subsequently, the NEMD running in the microcanonical ensemble (constant energy and volume, NVE) was employed to calculate the thermal conductivity.
During the temperature equilibrium relaxation, 20 layers with the thickness of δL = 5.4 Å in the X-direction were set up. The heat source and heat sink regions were set up near the first and eleventh layers, respectively, which allowed the simulated heat flow to be transported uniformly in the x-axis direction for up to 54 Å. As shown in Figure 3, the temperature variation in the 20 layers has been monitored, and the temperature gradient of each region approached a V-shaped line segment when they reached 600,000 steps, indicating that the overall simulated system has reached a well-balanced NEMD simulations. Finally, the computed thermal conductivity turned out to be 0.1298, which has an error of 0.006% compared to the announced 0.1290 [9], indicating that the system established is stable and reliable.
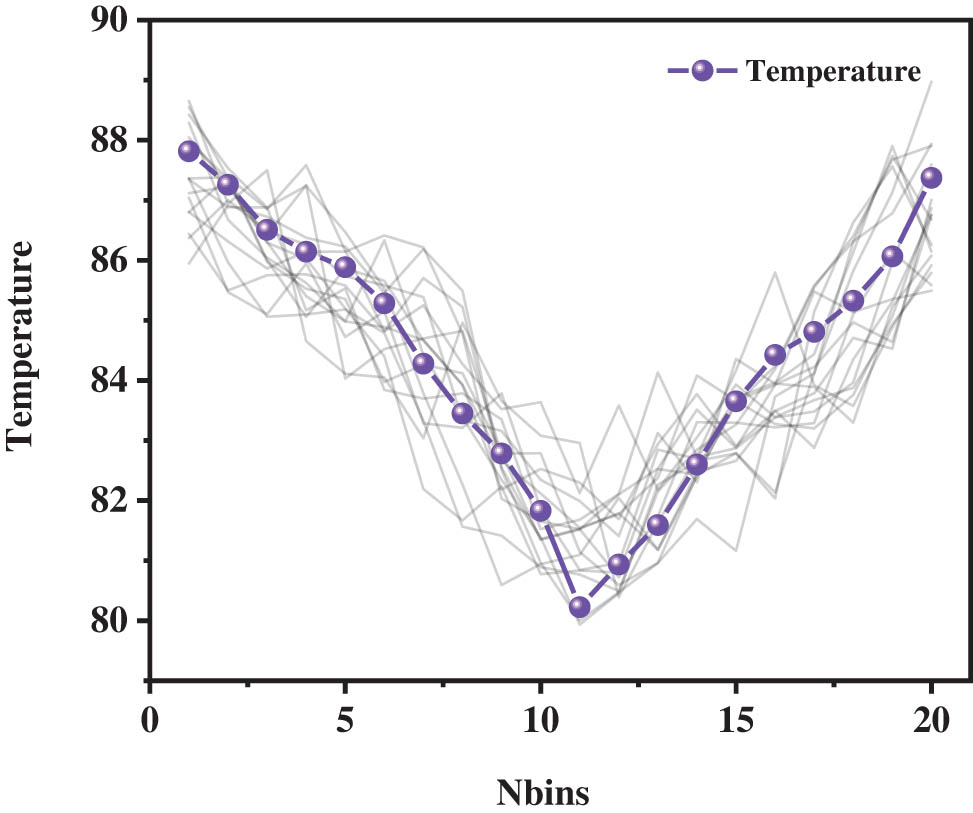
The temperature gradient of the 20 layers in the simulation box.
In Figure 4, The Cu–Ar nanofluids simulation results from this study are employed for verification with previous studies, and the similarity of the simulation results is indicated by the similar fold lines and data points [9,28,36,37]. The phenomenon of steady increment of the heat conductivity with volume fraction, as well as the reciprocal proximity of the simulation results, indicates that the established system has excellent simulation value.
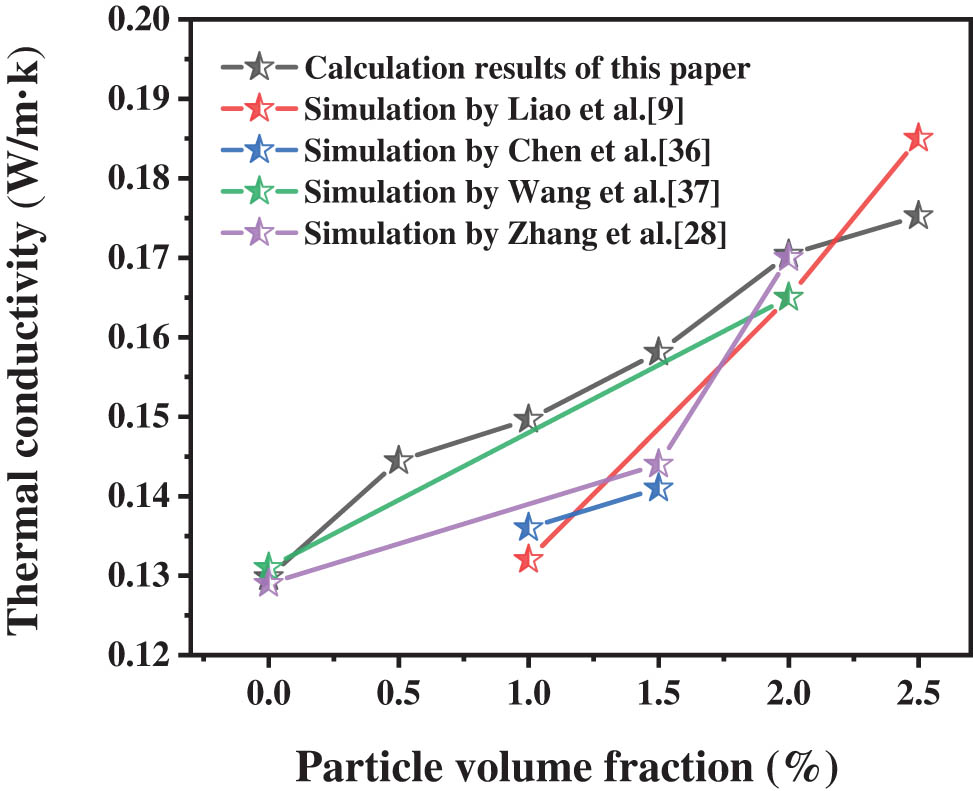
Comparison of thermal conductivity between MD simulation results for Cu–Ar nanofluids.
3.2 Viscosity
In this study, a faster and easier MP method than the Green–Kubo method was applied, and the use of interatomic potential and the application of the RNEMD method were validated gradually [30,31]. Compared with the NEMD method for calculating thermal conductivity, in the MP method, the system has been separated into 20 bins according to the Z-direction (any coordinate direction is possible), and the velocity gradient was constructed by exchanging the momentum components in the Z-direction of atoms in bins 1, 20, and 11, and then forming a shear field, while exchanging and counting the momentum exchange in the Z-direction for calculation (Figure 2). Among them, the choice of the momentum exchange frequency N has a certain influence on the results of the system viscosity calculation, and after several calculations of the linearity in the velocity gradient, N = 5 was selected in this study.
In this section, the system was warmed to 94.4 K using NPT ensemble in order to guarantee the presence of a stable liquid argon phase, where the time step Δt = 2 fs and cutoff radius r c = 13 Å. The ensemble NVT was sufficient to bring the system to balance state after being equilibrated for 50,000 steps. Similar to the NEMD method, the uniformly distributed speed distribution (Figure 5) was got for 0.4 ns under the canonical ensemble NVT (constant volume and temperature), which indicated that a stable velocity gradient was obtained in the X direction, and the final reliable viscosity results were obtained by applying Eq. (8).

The viscosity gradient of the 20 layers in the X-direction.
The system was generated by creating argon atoms arranged into a simulation box of 55 Å × 55 Å × 55 Å (4,000 pure Ar atoms), and the final result was 2.78 × 10⁻⁴ Pa s. Under the identical selected temperature of 94.4 K, the error of these data was 0.006% compared to the value of 2.79 × 10⁻⁴ Pa s [12]. Also, our simulation data were close to the previous experimental value of 2.80 × 10⁻⁴ Pa s [38], which demonstrated the stability and availability of the current numerical methods. As shown in Figure 6, the simulated Cu–Ar nanofluids viscosity values rise steadily with increasing volume fraction, which are very close to the simulated values given by Zeroual et al. [12], indicating that the established system possesses excellent simulation stability.
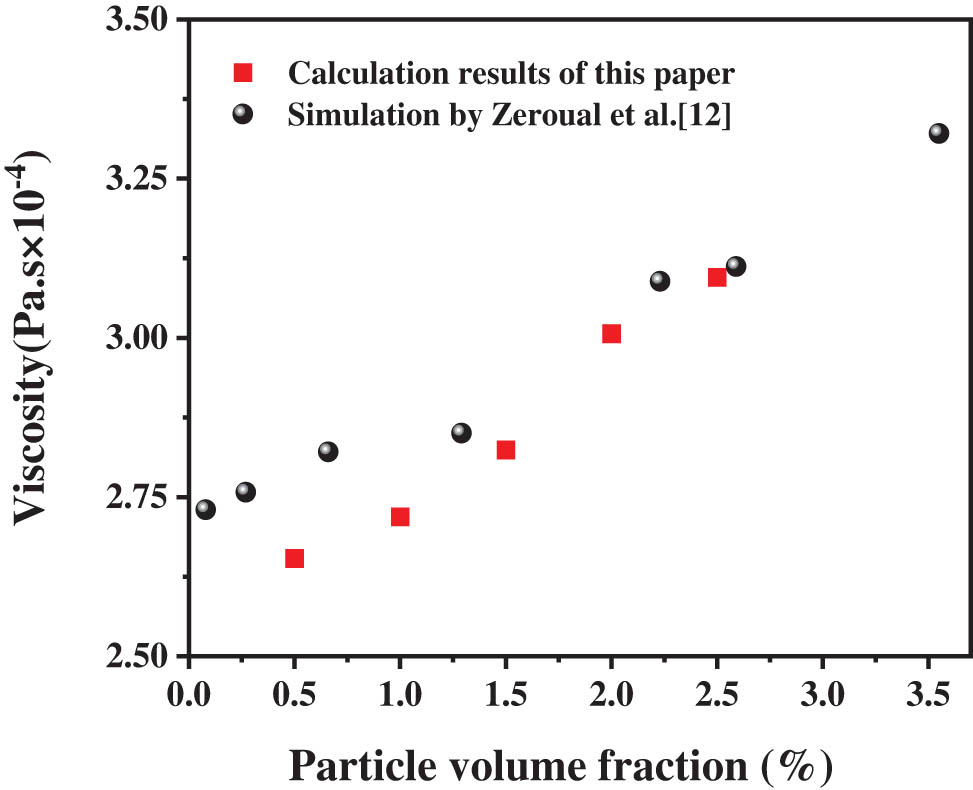
Comparison of viscosity between MD simulation values for Cu–Ar nanofluids.
4 Results and discussion
4.1 Influence of volume fraction and particle type on thermal conductivity
In this section, the impact of the volume fraction of various particles and the influence on the thermal conductivity of nanofluids were investigated systematically. The simulation box used in MD for studying was a cubic box of 108 Å × 55 Å × 55 Å in the X, Y, and Z directions containing a single nanoparticle surrounded by the Ar atoms inside the box, due to the heat flow transfer as shown in Figure 1, which was conducted from the leftmost end of the box to the middle, we chose the left half of the box as the total volume of the nanofluids. In Figure 7, the specific four particles based on the actual size of the atoms (1.5% particle volume fraction and diameter of 16.82 Å) are demonstrated in equal scale.
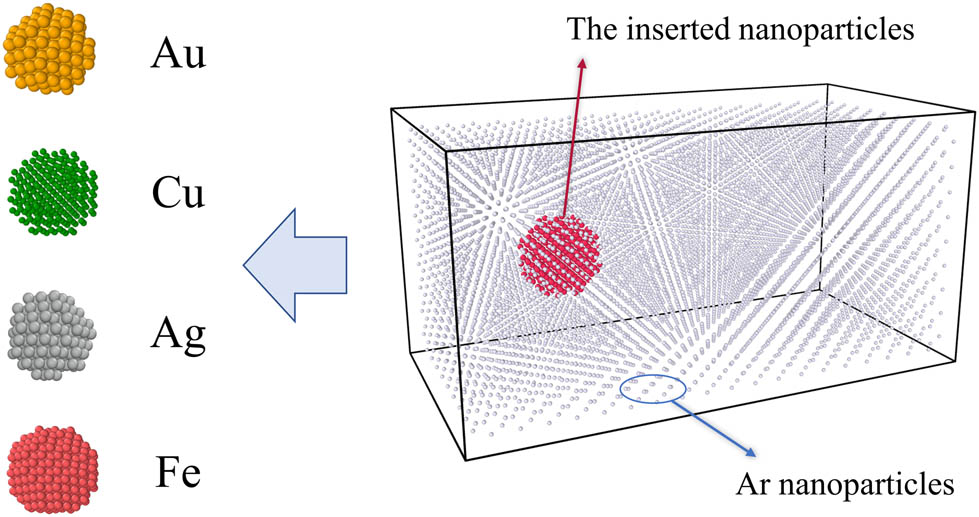
Snapshot of the four particles in nanofluids simulation box.
After calculating the corresponding volume fraction of nanoparticles, spherical atom clusters were filled into the box based on the corresponding radius. After the NVE process, the stability of temperature gradient was observed, and then the temperature difference value corresponding to the most stable temperature gradient was selected and substituted in Eq. (4) for calculation, to obtain the final accurate value of thermal conductivity.
Significantly, an influence of volume fraction on heat conductivity could be observed analytically by the three-dimensional smoothed surface plot of Figure 8, which indicates that the heat conductivity of Cu/Au/Ag/Fe–Ar nanofluids increase with the increase in the volume fraction of nanoparticles. For comparison purposes, the relatively varying heat conductivity is admitted, that is, the proportion (k nf /k f) between the heat conductivity of the nanofluids (k nf) and base fluids (k f) [13]. As can be visualized from the smooth surface in the figure, Ag–Ar nanofluids has the highest average relative thermal conductivity value, followed by Cu–Ar and Au–Ar, while Fe–Ar nanofluids have the lowest value. Ag particles achieve the highest relative thermal conductivity of 1.47 at 2.5% volume fraction, while Fe particles obtain the lowest of 1.02 at 0.5%. In general, the increment of nanoparticle concentration leads to the enhancement of the interfacial effect and is ultimately manifested by the increase in k nf /k f value with volume fraction [27]. The simulation results in this section further confirm the significant enhancement effect of interfacial layer function for the thermal conductivity [13], as well as in agreement with the previous findings of nanofluids [14,39].
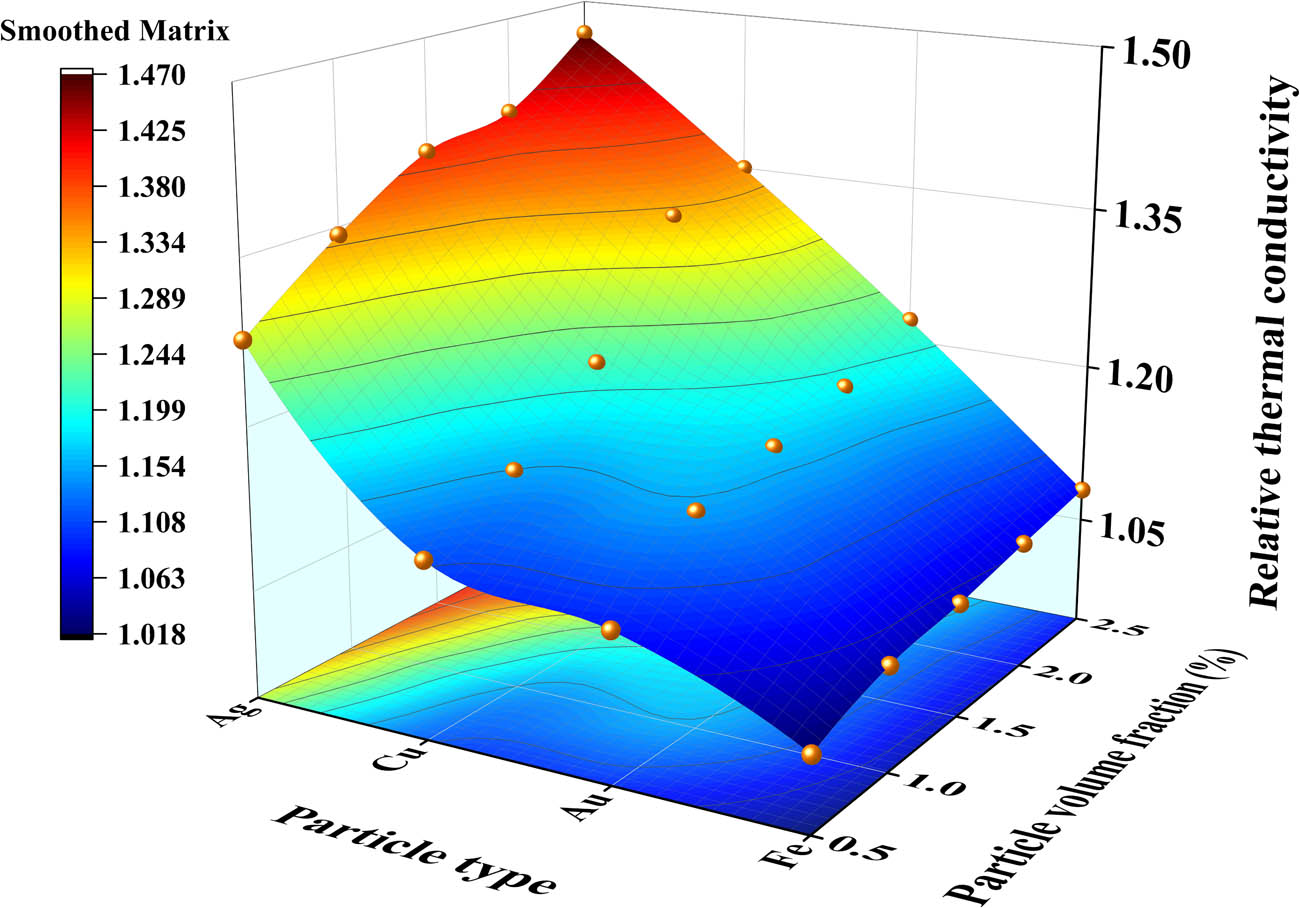
3D smoothed surface plot of nanofluids volume fraction on thermal conductivity.
Based on the contours of the bottom surface in the figure, a significant elevation in their relative thermal conductivity values around 1.5% volume fraction is obvious, especially for Cu–Ar nanofluid, while Au–Ar and Fe–Ar nanofluids show relatively flat thermal conductivity with the increase in the volume fraction. The fraction with the most significant thermal conductivity properties deserves in-depth research, and the 1.5% volume fraction, which possesses a relatively large improvement in thermal conductivity, provides a good opportunity for this investigation. And it is worthy of a subsequent comprehensive analysis in conjunction with the viscosity performances.
4.2 Impact of particle type and volume fraction on viscosity
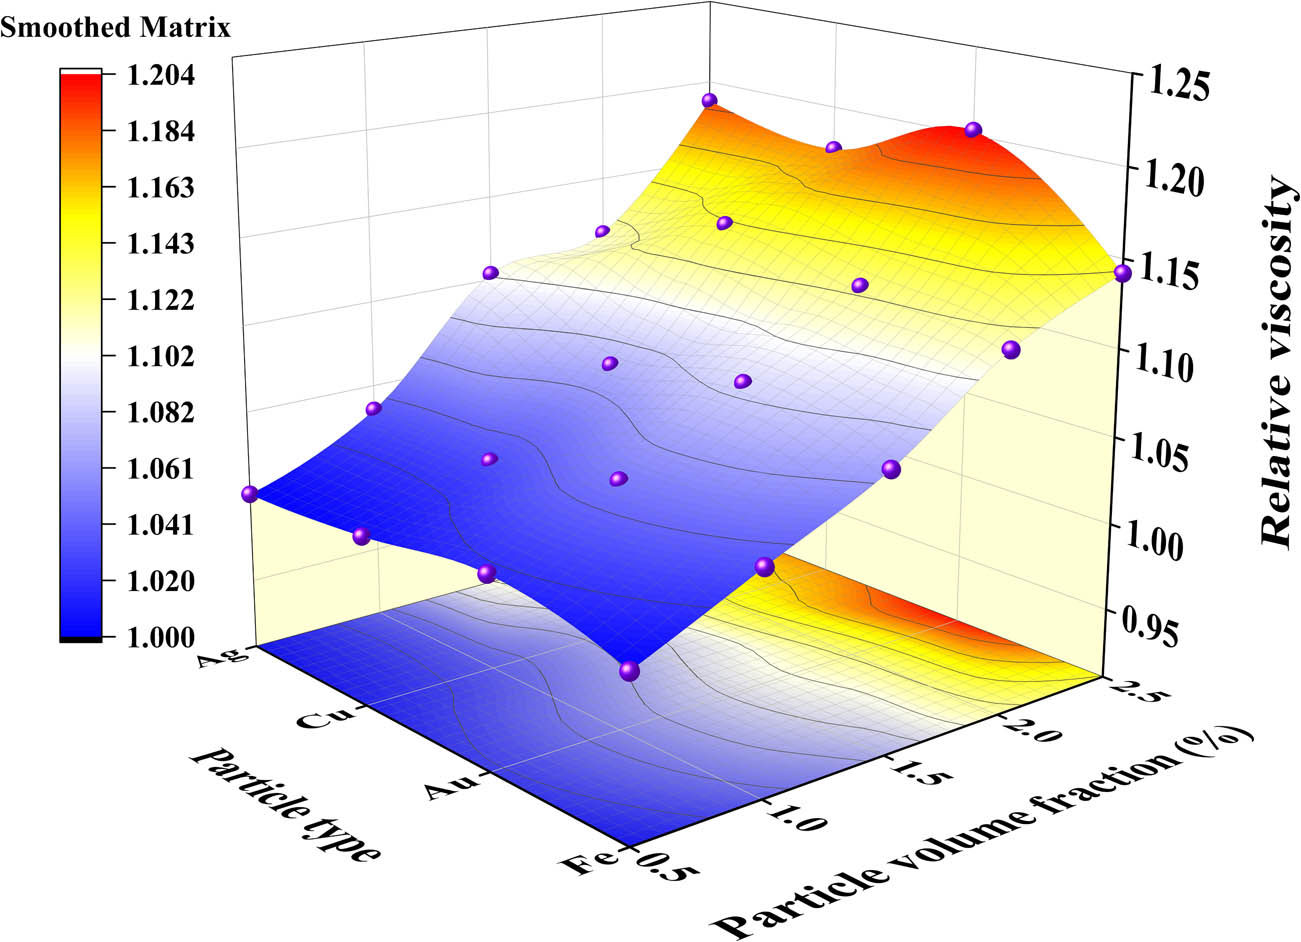
In this section, the influence of various particle types and volume fractions on the thermal conductivity of nanofluids were investigated systematically, and for this reason, we simulated the viscosity of four different types of nanofluids. The simulation box used in MD for studying was a cubic box of 55 Å × 55 Å × 55 Å containing a single nanoparticle surrounded by the Ar atoms. During the NVE calculation, the stability of the velocity gradient was monitored, the most stable velocity gradient was selected, and substituted in Eq. (8) for calculation, with the final viscosity value obtained in the LAMMPS program.
In the absence of simulation work for viscosity comparison of multiple nanofluids, our results compare the viscosity values of nanofluids composed of four particles, respectively. Similarly, the relative viscosity values are used for the convenience of comparing various nanofluids viscosity values, which is the proportion (η nf /η f) between the viscosity value of the nanofluids (η nf) and base fluids (η f) [11]. The influence of the nanofluids volume fraction on viscosity is obtained from the 3D smoothed surface plot of Figure 9, which shows that the η nf /η f of Cu/Au/Ag/Fe–Ar nanofluids increase with the increase in the volume fraction of multiple nanoparticles. As can be visualized from the smooth surface in the figure, Au–Ar nanofluids have the highest average relative viscosity value, followed by Ag–Ar and Cu–Ar, while Fe–Ar nanofluids have the lowest value. Au particles achieve the highest relative viscosity of 1.20269 at 2.5% volume fraction, while Fe particles obtain the lowest of 1.00084 at 0.5%.
3D smoothed surface plot of nanofluids volume fraction on viscosity.
From the above experimental data, it can be seen that the enhancement of the viscosity of the nanofluids strongly depends on the volume fraction of the nanoparticles, in agreement with the principle of the thermal conductivity enhancement effect, of which the solid–liquid interfacial layer between the liquid and the nanoparticles is considered to be the critical factor [12]. Specifically, since the forces between the nanoparticles and the liquid are much larger than the effects between the atoms of the liquid (as also evident from the L-J potentials in Table 1), a large amount of argon atoms are attracted around the nanoparticles after the formulation of the nanofluids and the adsorption is enhanced as the volume fraction of the particles becomes larger, which leads to the appearance of an ordered liquid layer eventually [40,41]. The analytical demonstration of the improvement of nanofluids viscosity is presented above, followed by a study of the microscopic mechanism using the density distribution method.
4.3 Number density distribution
In this work, the number density distribution of nanofluids was computed to evaluate the microscopic mechanism of heat transfer and viscosity enhancement, which means density/number is computed for each chunk (number/volume). A better comparison of the density properties of different types of atoms is achieved by dividing the spatially averaged distribution of 20 equally spaced blocks along the X-axis in the simulation box. The number of atoms ΔN in the chunk spaces ΔV can be figured out and used to calculate the number density n, written as follows:
The number density distribution curves of the representative four nanofluids from 0.5 to 2.5% volume fraction under the thermal conductivity simulation conditions are shown in Figure 10, and obviously they have similar characteristics. As the distance along the X-axis increases, the curves converge to a steady value, suggesting that the degree of density influenced by the aggregation of nanoparticles decreases with the change in position gradually; while a clear wave peak appear in the vicinity of the spherical center of the metal particles at the beginning of the simulation (sixth bin), indicating that the argon atoms in the vicinity the nanoparticles are attracted vigorously by the solid interface, which formed the interface nanolayer with great influence. In particular, Au–Ar and Ag–Ar nanofluids behave more or less the same, with the highest value of number density increasing with the volume concentration. The wave range of Cu–Ar nanofluids fluctuate widely, but the starting value of the wave start from the fifth bin basically, and the peak value of 2% volume concentration is around the seventh bin. The performance of Fe–Ar nanofluids is consistent with the wave range concentrated between 2.5th bin and 8.5th bin, and the highest value of number density increases with the volume concentration, showing a linear correlation.
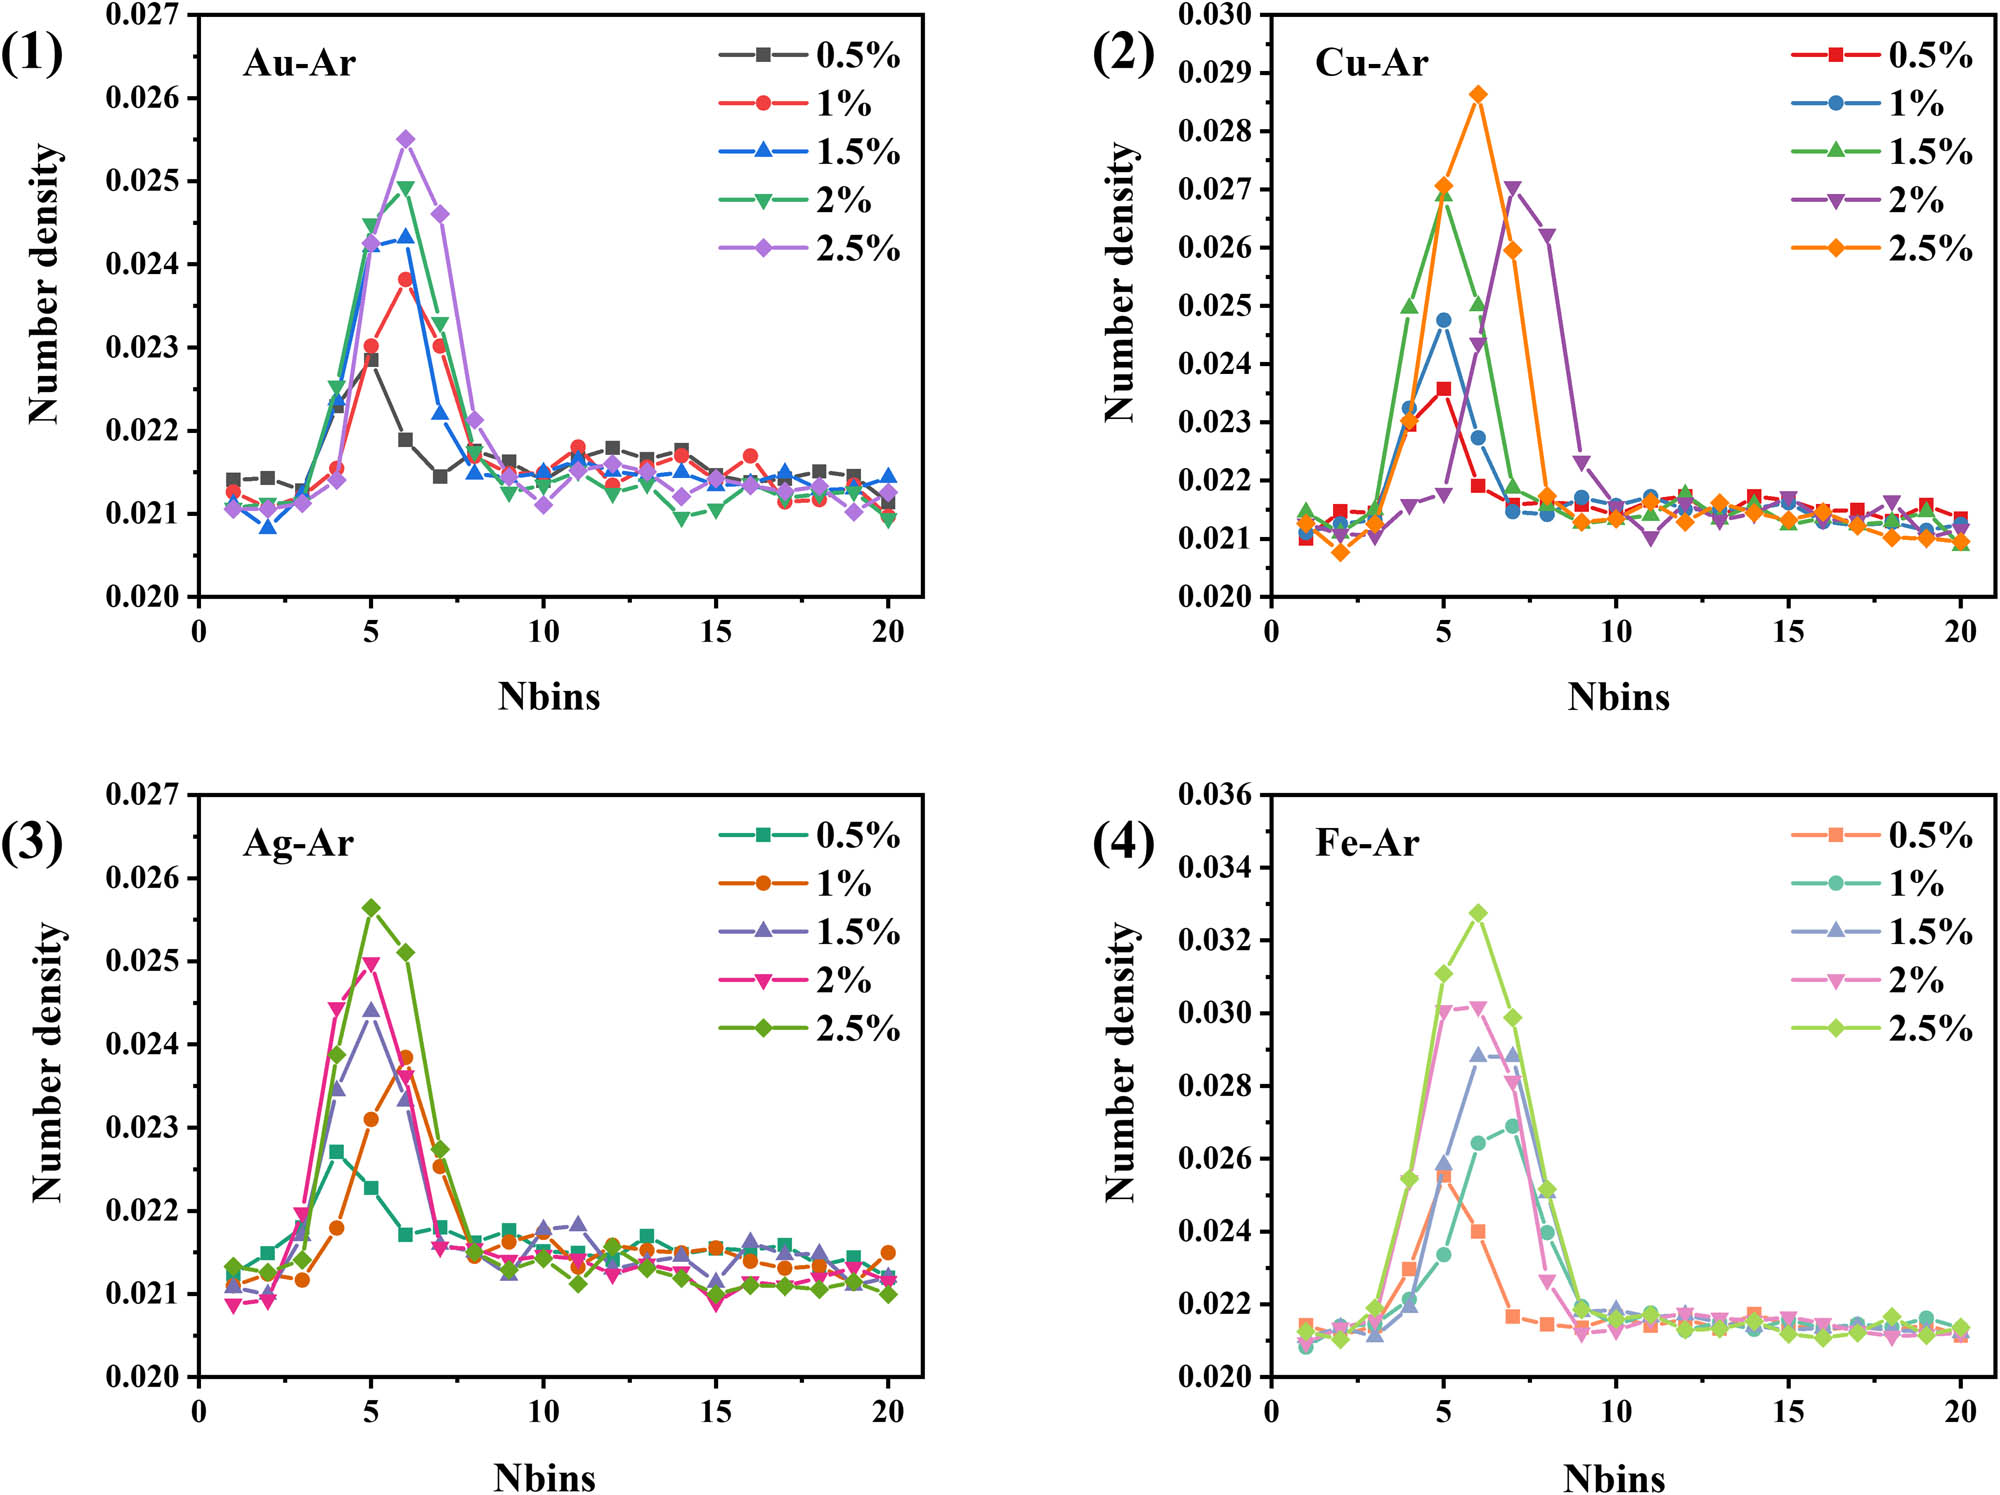
The number density distribution curves of four types of nanofluids from 0.5 to 2.5% volume fraction: (1) Au–Ar, (2) Cu–Ar, (3) Ag–Ar, and (4) Fe–Ar.
Notably, the position of the mountain peak in the figure denotes the position of the spherical center; the height of the peak reflects the degree of aggregation [28]; and the left and right displacements of the peak indicate the degree of displacement of the spherical particles after the simulation based on the method in this study [42]. As can be seen, the number density distribution is highly related to the atomic masses. For Au and Ag, which have larger atomic masses, the location of the number density peak is relatively fixed, indicating that the atomic clusters do not undergo large vibrations, while for Cu and Fe, which have smaller atomic masses, larger peaks can be observed and there is a larger shift in the position of the peaks as the volume fraction increases. Larger peaks can be observed and the location of the peak has a large shift with the increase in the volume fraction [12].
Figure 11 displays a comparison of the number density distribution curves of four nanofluids with 1.5% volume fraction. Intuitively, the different types of nanofluids possess similar curve characteristics, with distinct peaks near the sixth bin position, followed by the curve returning to a mean density value. As can be seen, the number density distribution correlates highly with the type of particle atoms, with the peak size of Fe > Cu > Ag > Au (0.02881, 0.02689, 0.02439, 0.02432, respectively), which shows positive linear relationship with the atomic mass. In combination with the above analysis, there is a strong correlation between the degree of agglomeration in nanofluid particles and the type of added atoms.
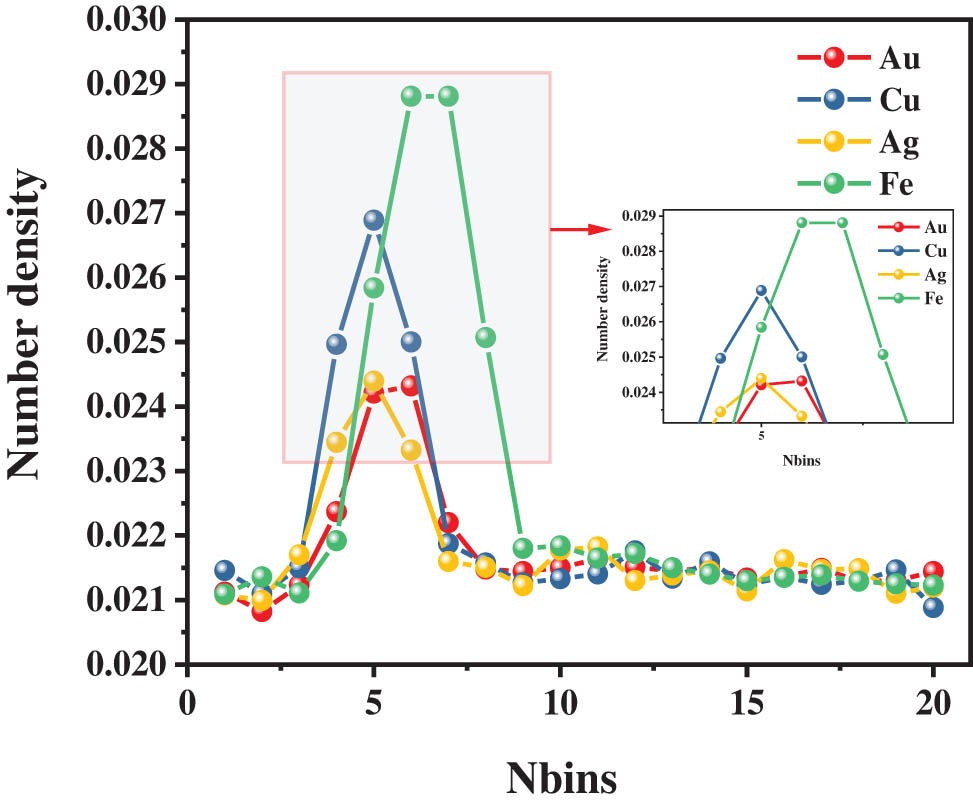
The number density distribution curves of four nanofluids with 1.5% volume fraction.
4.4 RDF and MSD
In an attempt to further investigate that how the thermal conductivity and viscosity vary with nanofluids particle type and volume fraction, it is important to calculate the RDF and MSD [39]. For this purpose, the MD simulation conditions studied above were used to derive the corresponding data under the thermal conductivity simulation conditions.
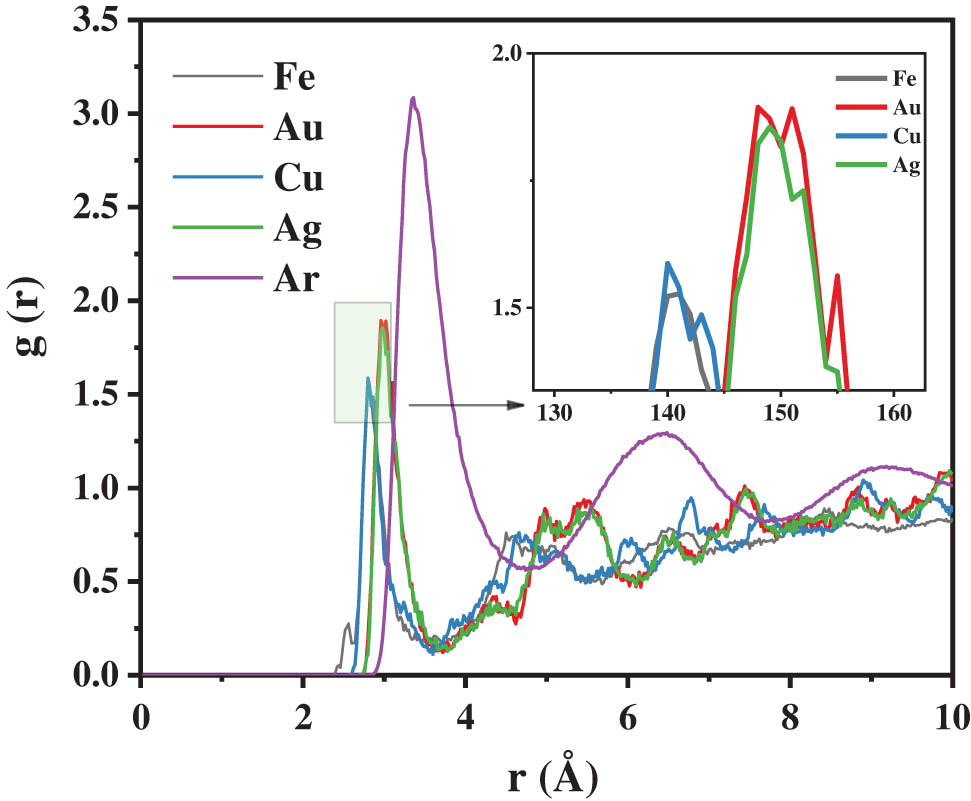
The comparative plots of RDF in the nanofluids containing pure Ar and 1.5% volume fraction of metal particles are presented in Figure 12. Intuitively, the deployment of Ar–Ar RDF explains the liquid properties of “short-range order” (observation from the first peak at 4 Å) and “long-range disorder” (observation from the second peak at 7 Å). The first peak position is shifted to the left in the nanofluids compared to the RDF curve of the pure Ar fluid, and the position of the subsequent peaks are distributed evenly, which demonstrates that the microstructure of nanofluids exhibits both “short-range ordered and long-range disordered” liquid characteristics and “long-range ordered” solid characteristics [43]. The RDF curve exhibits a high and narrow feature in the first peak followed by a broad and flattened feature in the second peak, which further demonstrates that many argon atoms are clustered around the metal particles [36]. The above phenomenon indicates that an even denser nanosphere structure is developed around the nanoparticles. As confirmed by the small detail image, the Au–Ar and Ag–Ar curves match essentially, and all curves are more to the left. The Cu–Ar and Fe–Ar peaks are essentially close to each other, which are consistent with the conclusion of the number density distribution plots for 1.5% particle volume fraction in Figure 11, further indicating the significant effect of different atomic masses on the interfacial nanolayer. Specifically, the nanolayer around the nanoparticles is recognized as an essential factor to promote thermal conductivity through the presence of interstitial thermal resistance between the liquid and solid states [44], and the main factor for the improvement in thermal conductivity is the increase in density, partly driven by the more organized structure.
The comparison of RDF curves in different nanofluids.
Figure 13 shows the specific RDF plots for the four nanofluids, which reveals that the RDF curves vary with the particle volume fraction. The peaks of Au–Ar and Ag–Ar decrease gently with the volume fraction, while the peaks of Cu–Ar and Fe–Ar have a large drop-off and decrease drastically with the addition of volume fraction, which indicates that the aggregation of the nano-interfacial layer does not follow a linear relationship. Combined with the research in this study, it could be inferred that there is a close relationship between the change in RDF peak and the change in thermal conductivity. In addition, besides the positive effect of the nanosphere, the thermal boundary resistance (also known as Kapitza resistance) is considered as an obstacle for enhancing thermal conductivity. To be more specific, owing to the different vibrational properties of the base liquid and the nanoparticles, the phonon scattering occurs at their interface and restricts the heat flow into the nanoparticles resulting in the heat transfer resistance [45]. It is most probably the reason behind the insignificant thermal conductivity enhancement of Fe nanoparticles. In general, the Cu–Ar curve has the most obvious variation, while Au–Ar is the flattest of all, which corresponds with the previous characteristics of thermal conductivity and viscosity completely. Indirectly, it also reflects the better regularity and stability of Au as simulated atom in nanofluids.
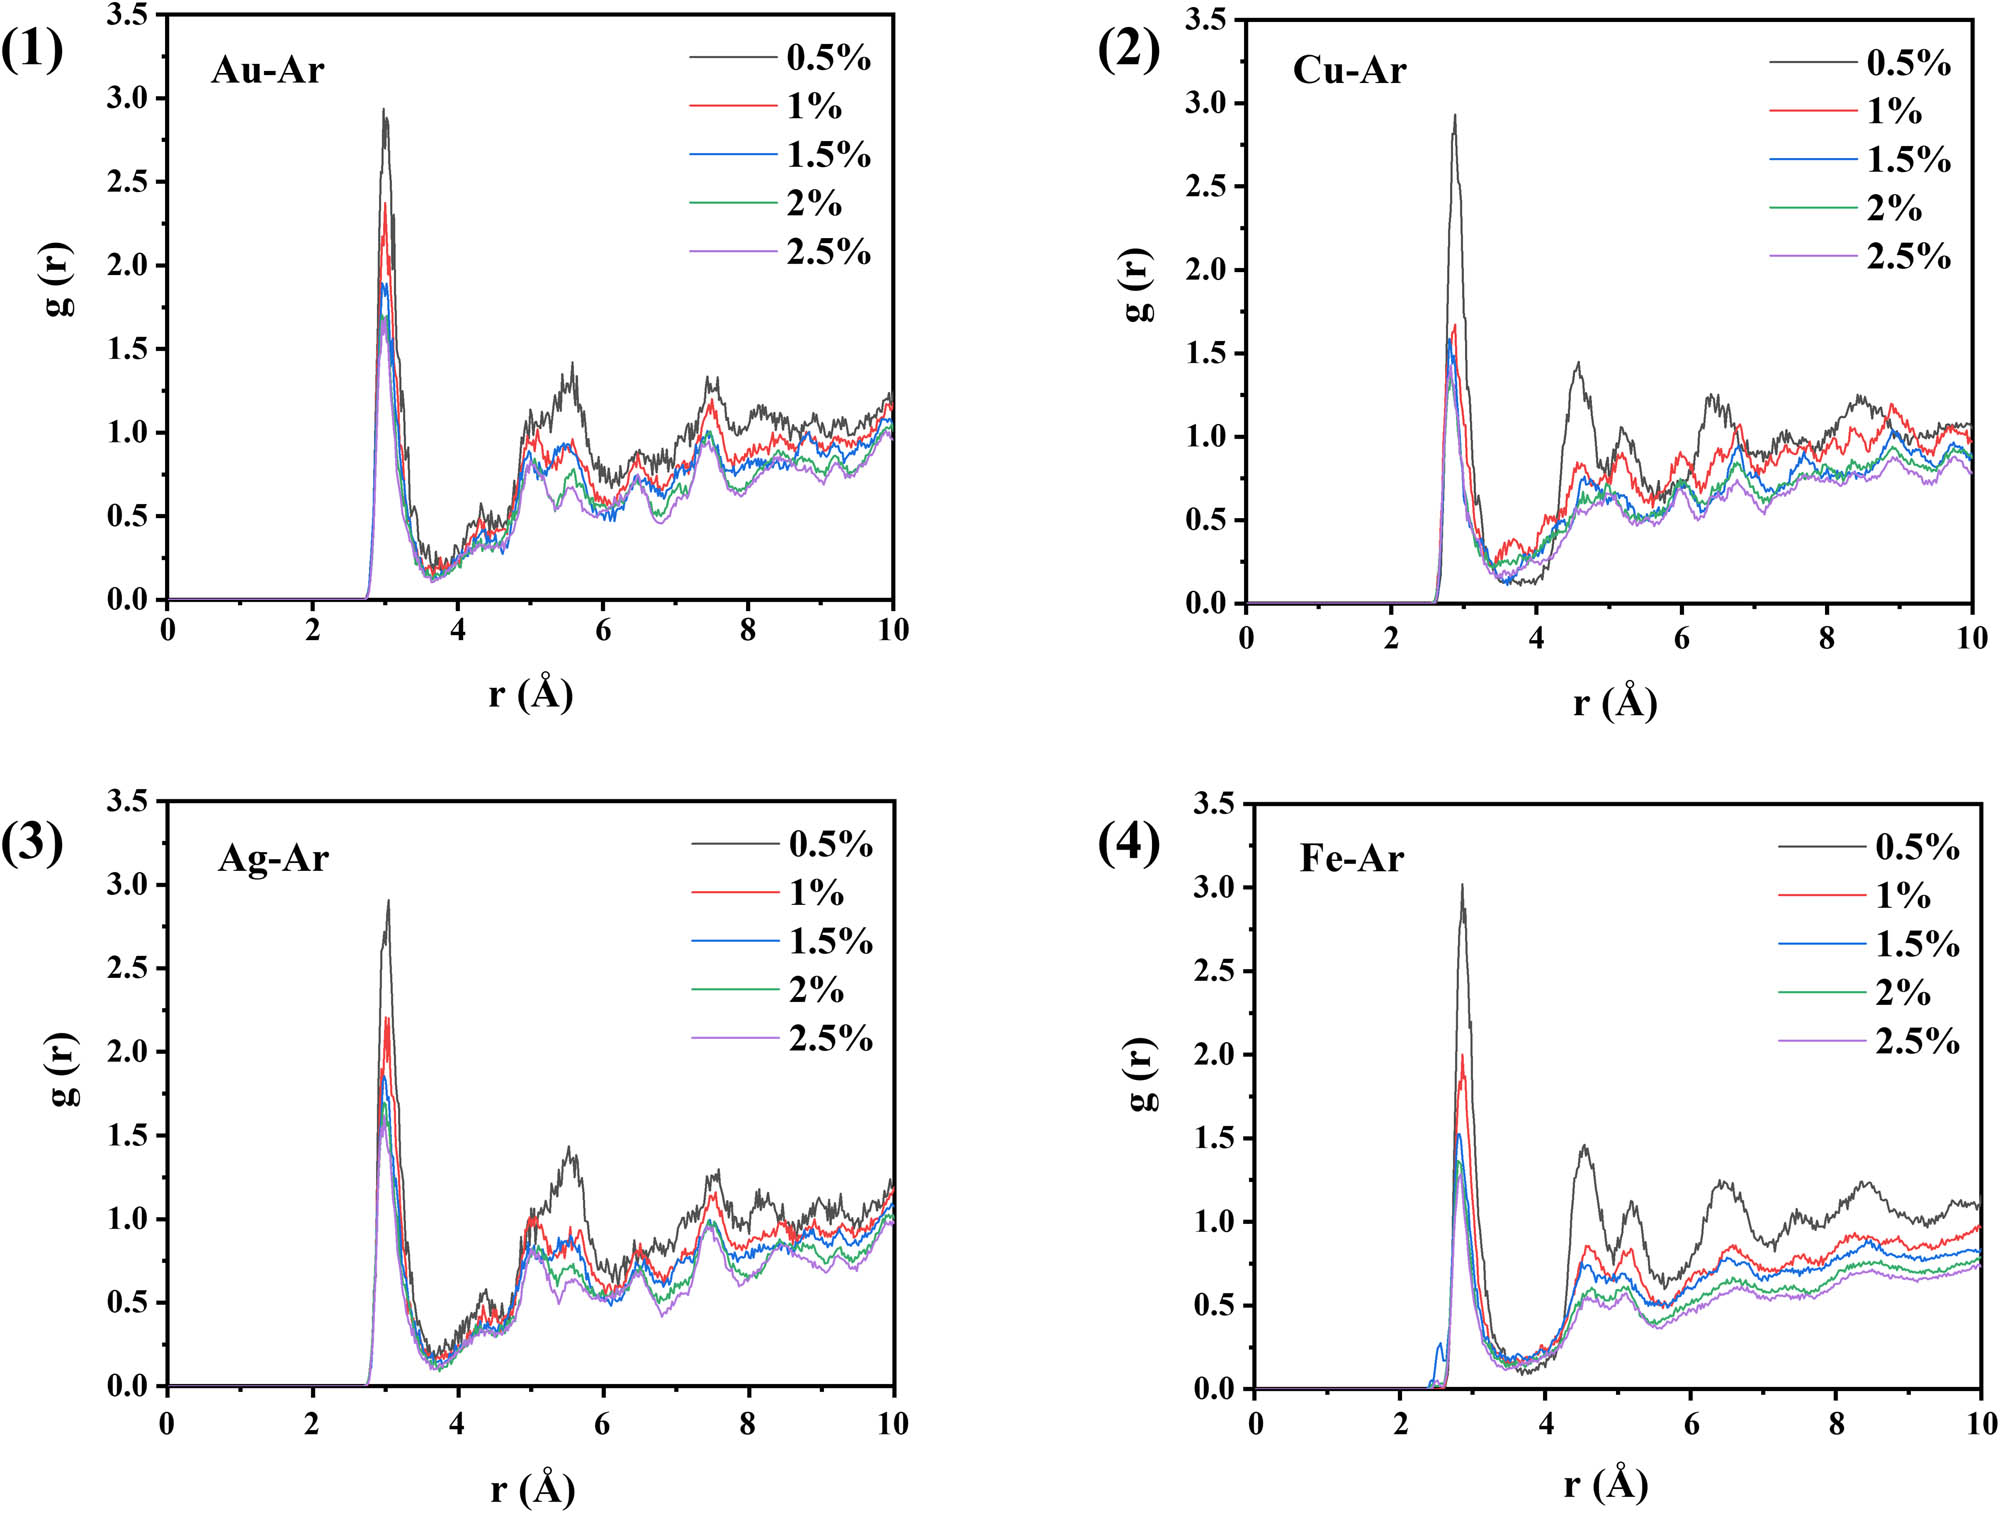
The RDF curves of four types of nanofluids from 0.5 to 2.5% volume fraction: (1) Au–Ar, (2) Cu–Ar, (3) Ag–Ar, and (4) Fe–Ar.
To investigate the impact of granular motion on the heat conductivity, we calculated the MSD functions for pure argon and four types of nanofluids under the same simulation conditions. Figure 14 displays the MSD comparison plots for four melt particles with 1.5% volume fraction and the pure Ar at 0–50,000 steps, where the MSD function approximates the straight line increasing with time and the slope of the line is 6D according to Eq. (11).
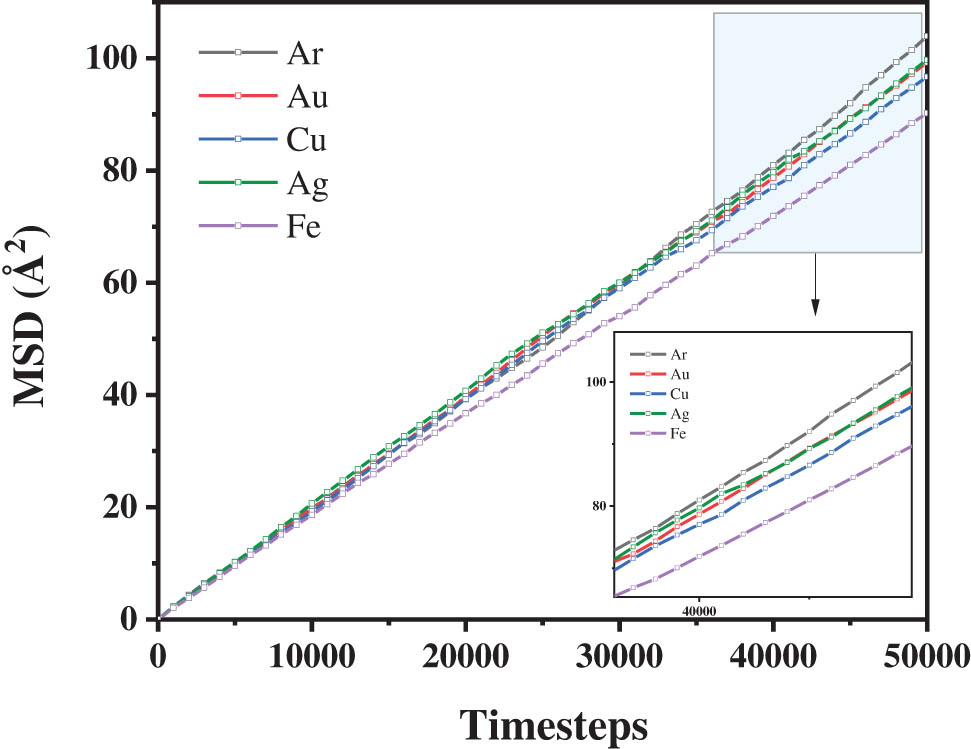
The comparison of MSD profiles in different nanofluids.
Therefore, for the purpose of studying the relative movement degree of the four nanoparticles in the nanofluids, the gradients of the lines in Figure 14 were utilized for matching and research. On analyzing the MSD of argon-based fluids, we find that our simulation result (the diffusion coefficient D = 2.11 × 10⁻⁹ m2/s) agrees fairly well with the literature values (D = 2.10 × 10⁻⁹ m2/s) [19]. The sequences of the lines slopes of the four nanoparticles in the figure show that Ag and Au are almost the same, larger than Cu, and Fe is the smallest, this sequence is also the rank of their diffusion rate in the nanofluids. The gradient of the pure argon fluid line segment is higher than the gradient of the metal particles in the nanofluids suggesting that the diffusion rate of the Ar base fluid will be higher than the nanoparticles, these results correspond to the earlier investigations [8,46]. Collectively, the appearance of the interfacial layer itself provides the foundation for the enhanced thermal conductivity effect [47,48], while the movement of Ar atoms on the interfacial nanosphere is restricted by the nanoparticles, further enhancing the resistance to fluid slippage and leading to an increase in nanofluids viscosity ultimately.
5 Conclusion
Throughout the study, the influences of different nanoparticles properties on thermal conductivity and viscosity of the nanofluids were investigated, and NEMD and RNEMD calculations were employed to research the impacts of nanoparticle type and volume fraction on the performances of nanofluids. The Au–Ar and Ag–Ar nanofluids showed the largest relative thermal conductivity and viscosity under the same condition comparison, and exhibited superior stability in number density distribution than Cu–Ar and Fe–Ar nanofluids. The combined experimental data suggest that the viscosity enhancement corresponds to the principle of the thermal conductivity strengthening effects, where the solid–liquid interfacial layer between the liquid and the nanoparticles considered to be the key factor. The simulation results showed that Au nanoparticle performed with excellent stability and regularity in RDF and MSD, which was the expected candidate for nanofluids simulation.
-
Funding information: Financial support from National Natural Science Foundation of China under Contract (No. 51966005 and No. 52069010); Yunnan Fundamental Research Projects (No. 202101AT070120 and No. 202301AT070469); Yunnan Major Scientific and Technological Projects (No. 202202AG050002) are gratefully acknowledged.
-
Author contributions: All authors have accepted responsibility for the entire content of this manuscript and approved its submission.
-
Conflict of interest: The authors state no conflict of interest.
References
[1] Narankhishig Z, Ham J, Lee H, Cho H. Convective heat transfer characteristics of nanofluids including the magnetic effect on heat transfer enhancement - a review. Appl Therm Eng. 2021;193:116987.10.1016/j.applthermaleng.2021.116987Suche in Google Scholar
[2] Qiu L, Zhu N, Feng Y, Michaelides EE, Żyła G, Jing D, et al. A review of recent advances in thermophysical properties at the nanoscale: From solid state to colloids. Phys Rep. 2020;843:1–81.10.1016/j.physrep.2019.12.001Suche in Google Scholar
[3] Das SK, Choi SUS, Patel HE. Heat transfer in nanofluids – A review. Heat Transf Eng. 2006;27:3–19.10.1080/01457630600904593Suche in Google Scholar
[4] Saidur R, Leong KY, Mohammad HA. A review on applications and challenges of nanofluids. Renew Sustain Energy Rev. 2011;15:1646–68.10.1016/j.rser.2010.11.035Suche in Google Scholar
[5] Li Y, Zhai Y, Ma M, Xuan Z, Wang H. Using molecular dynamics simulations to investigate the effect of the interfacial nanolayer structure on enhancing the viscosity and thermal conductivity of nanofluids. Int Commun Heat Mass Transf. 2021;122:105181.10.1016/j.icheatmasstransfer.2021.105181Suche in Google Scholar
[6] Bhanushali S, Jason NN, Ghosh P, Ganesh A, Simon GP, Cheng W. Enhanced thermal conductivity of copper nanofluids: the effect of filler geometry. ACS Applied Materials & Interfaces. 2017;9(22):18925–35.10.1021/acsami.7b03339Suche in Google Scholar PubMed
[7] Ghosh MM, Ghosh S, Pabi SK. Effects of particle shape and fluid temperature on heat-transfer characteristics of nanofluids. J Mater Eng Perform. 2013;22:1525–9.10.1007/s11665-012-0441-7Suche in Google Scholar
[8] Zhou L, Zhu J, Zhao Y, Ma H. A molecular dynamics study on thermal conductivity enhancement mechanism of nanofluids – Effect of nanoparticle aggregation. Int J Heat Mass Transf. 2022;183:122124.10.1016/j.ijheatmasstransfer.2021.122124Suche in Google Scholar
[9] Liao J, Zhang A, Qing S, Zhang X, Luo Z. Investigation on the aggregation structure of nanoparticle on the thermal conductivity of nanofluids by molecular dynamic simulations. Powder Technol. 2022;395:584–91.10.1016/j.powtec.2021.10.007Suche in Google Scholar
[10] Lou Z, Yang M. Molecular dynamics simulations on the shear viscosity of Al2O3 nanofluids. Comput Fluids. 2015;117:17–23.10.1016/j.compfluid.2015.05.006Suche in Google Scholar
[11] Jabbari F, Rajabpour A, Saedodin S. Viscosity of carbon nanotube/water nanofluid: Equilibrium molecular dynamics. J Therm Anal Calorim. 2019;135:1787–96.10.1007/s10973-018-7458-6Suche in Google Scholar
[12] Zeroual S, Loulijat H, Achehal E, Estellé P, Hasnaoui A, Ouaskit S. Viscosity of Ar-Cu nanofluids by molecular dynamics simulations: Effects of nanoparticle content, temperature and potential interaction. J Mol Liq. 2018;268:490–6.10.1016/j.molliq.2018.07.090Suche in Google Scholar
[13] Essajai R, Mzerd A, Hassanain N, Qjani M. Thermal conductivity enhancement of nanofluids composed of rod-shaped gold nanoparticles: Insights from molecular dynamics. J Mol Liq. 2019;293:111494.10.1016/j.molliq.2019.111494Suche in Google Scholar
[14] Essajai R, Rachadi A, Feddi E. MD simulation-based study on the thermodynamic, structural and liquid properties of gold nanostructures. Mater Chem Phys. 2018;218:116–21.10.1016/j.matchemphys.2018.05.045Suche in Google Scholar
[15] Milanese M, Iacobazzi F, Colangelo G, Risi. AD. An investigation of layering phenomenon at the liquid–solid interface in Cu and CuO based nanofluids. Int J Heat Mass Transf. 2016;103:564–71.10.1016/j.ijheatmasstransfer.2016.07.082Suche in Google Scholar
[16] Akiner T, Kocer E, Mason JK, Erturk H. Green–Kubo assessments of thermal transport in nanocolloids based on interfacial effects . Mater Today Commun. 2019;20:100533.10.1016/j.mtcomm.2019.05.009Suche in Google Scholar
[17] Guo H, Zhao N. Interfacial layer simulation and effect on Cu-Ar nanofluids thermal conductivity using molecular dynamics method. J Mol Liq. 2018;259:40–7.10.1016/j.molliq.2018.03.001Suche in Google Scholar
[18] Cui W, Shen Z, Yang J, Wu S, Bai M. Influence of nanoparticle properties on the thermal conductivity of nanofluids by molecular dynamics simulation. RSC Adv. 2014;4:55580–9.10.1039/C4RA07736ASuche in Google Scholar
[19] Cui W, Shen Z, Yang J, Wu S. Molecular dynamics simulation on the microstructure of absorption layer at the liquid–solid interface in nanofluids. Int Commun Heat Mass Transf. 2016;71:75–85.10.1016/j.icheatmasstransfer.2015.12.023Suche in Google Scholar
[20] Wang X, Jing D. Determination of thermal conductivity of interfacial layer in nanofluids by equilibrium molecular dynamics simulation. Int J Heat Mass Transf. 2019;128:199–207.Suche in Google Scholar
[21] Thompson AP, Aktulga HM, Berger R, Bolintineanu DS, Brown WM, Crozier PS, et al. Plimpton, LAMMPS - a flexible simulation tool for particle-based materials modeling at the atomic, meso, and continuum scales. Comput Phys Commun. 2022;271:108171.10.1016/j.cpc.2021.108171Suche in Google Scholar
[22] Nguyen TD. GPU-accelerated Tersoff potentials for massively parallel molecular dynamics simulations. Comput Phys Commun. 2017;212:113–22.10.1016/j.cpc.2016.10.020Suche in Google Scholar
[23] Stukowski A. Visualization and analysis of atomistic simulation data with OVITO–the Open Visualization Tool. Model Simul Mater Sci Eng. 2009;18:015012.10.1088/0965-0393/18/1/015012Suche in Google Scholar
[24] Zoli L, Sciti D, Sani E. Zirconium diboride-based nanofluids for solar energy applications. J Mol Liq. 2021;322:114981.10.1016/j.molliq.2020.114981Suche in Google Scholar
[25] Daw MS, Baskes MI. Embedded-atom method: Derivation and application to impurities, surfaces, and other defects in metals. Phys Rev B Condens Matter. 1984;29:6443–53.10.1103/PhysRevB.29.6443Suche in Google Scholar
[26] Topal I, Servantie J. Molecular dynamics study of the thermal conductivity in nanofluids. Chem Phys. 2019;516:147–51.10.1016/j.chemphys.2018.09.001Suche in Google Scholar
[27] Fujiwara K, Daimo M, Ueki Y, Ohara T, Shibahara M. Thermal conductivity of nanofluids: A comparison of EMD and NEMD calculations. Int J Heat Mass Transf. 2019;144:118695.10.1016/j.ijheatmasstransfer.2019.118695Suche in Google Scholar
[28] Zhang L, Tian L, Jing Y, Qu P, Zhang A. Molecular dynamics study on the mechanism of nanofluid coolant’s thermal conductivity improvement. J Mol Liq. 2022;345:118228.10.1016/j.molliq.2021.118228Suche in Google Scholar
[29] Ikeshoji T, Hafskjold B. Non-equilibrium molecular dynamics calculation of heat conduction in liquid and through liquid-gas interface. Mol Phys. 1994;81:251–61.10.1080/00268979400100171Suche in Google Scholar
[30] Fernandez GA, Vrabec J, Hasse H. A molecular simulation study of shear and bulk viscosity and thermal conductivity of simple real fluids. Fluid Phase Equilib. 2009;221:157–63.10.1016/j.fluid.2004.05.011Suche in Google Scholar
[31] Müller-Plathe F. Reversing the perturbation in non-equilibrium molecular dynamics: An easy way to calculate the shear viscosity of fluids. Phys Rev E. 1999;59:4894–8.10.1103/PhysRevE.59.4894Suche in Google Scholar
[32] Rostami S, Zarringhalam M, Alizadeh A, Toghraie D, Shahsavar A. Goldanlou, molecular dynamic simulation of argon boiling flow inside smooth and rough microchannels by considering the effects of cubic barriers. J Mol Liq. 2020;312:113130.10.1016/j.molliq.2020.113130Suche in Google Scholar
[33] Kanhaiya K, Kim S, Im W, Heinz H. Accurate simulation of surfaces and interfaces of ten FCC metals and steel using Lennard–Jones potentials. Npj Comput Mater. 2021;7:17.10.1038/s41524-020-00478-1Suche in Google Scholar
[34] Shibuta Y, Suzuki T. A molecular dynamics study of cooling rate during solidification of metal nanoparticles. Chem Phys Lett. 2011;502:82–6.10.1016/j.cplett.2010.12.020Suche in Google Scholar
[35] Sarkar S, Selvam RP. Molecular dynamics simulation of effective thermal conductivity and study of enhanced thermal transport mechanism in nanofluids. J Appl Phys. 2007;102:280.10.1063/1.2785009Suche in Google Scholar
[36] Chen J, Han K, Wang S, Liu X, Wang P, Chen J. Investigation of enhanced thermal properties of CuAr nanofluids by reverse non equilibrium molecular dynamics method. Powder Technol. 2019;356:559–65.10.1016/j.powtec.2019.08.051Suche in Google Scholar
[37] Wang R, Qian S, Zhang Z. Investigation of the aggregation morphology of nanoparticle on the thermal conductivity of nanofluid by molecular dynamics simulations. Int J Heat Mass Transf. 2018;127:1138–46.10.1016/j.ijheatmasstransfer.2018.08.117Suche in Google Scholar
[38] Song HL, Dong KP, Kang DB. Molecular dynamics simulations for transport coefficients of liquid argon: new approaches. Bulletin of the Korean Chemical Society. 2003;24(2).10.5012/bkcs.2003.24.2.178Suche in Google Scholar
[39] Essajai R, Tabtab I, Mzerd A, Mounkachi O, Hassanain N, Qjani M. Molecular dynamics study of thermal properties of nanofluids composed of one-dimensional (1-D) network of interconnected gold nanoparticles. Results Phys. 2019;15:102576.10.1016/j.rinp.2019.102576Suche in Google Scholar
[40] Garg J, Poudel B, Chiesa M, Gordon J, Ma J, Wang J, et al. Enhanced thermal conductivity and viscosity of copper nanoparticles in ethylene glycol nanofluid. J Appl Phys. 2008;103:074301.10.1063/1.2902483Suche in Google Scholar
[41] Kole M, Dey TK. Enhanced thermophysical properties of copper nanoparticles dispersed in gear oil. Appl Therm Eng. 2013;56:45–53.10.1016/j.applthermaleng.2013.03.022Suche in Google Scholar
[42] Wu N, Zeng L, Fu T, Wang Z, Lu C. Molecular dynamics study of rapid boiling of thin liquid water film on smooth copper surface under different wettability conditions. Int J Heat Mass Transf. 2020;147:118905.10.1016/j.ijheatmasstransfer.2019.118905Suche in Google Scholar
[43] Wang X, Jing D. Determination of thermal conductivity of interfacial layer in nanofluids by equilibrium molecular dynamics simulation. Int J Heat Mass Transf. 2019;128:199–207.10.1016/j.ijheatmasstransfer.2018.08.073Suche in Google Scholar
[44] Liang Z, Tsai HL. Thermal conductivity of interfacial layers in nanofluids. Phys Rev E. 2011;83:041602.10.1103/PhysRevE.83.041602Suche in Google Scholar PubMed
[45] Nejatolahi M, Golneshan AA, Kamali R, Sabbaghi S. Non-equilibrium versus equilibrium molecular dynamics for calculating the thermal conductivity of nanofluids. J Therm Anal Calorim. 2021;144:1467–81.10.1007/s10973-020-09595-xSuche in Google Scholar
[46] Li Z, Cui L, Li B, Du X. Enhanced heat conduction in molten salt containing nanoparticles: Insights from molecular dynamics. Int J Heat Mass Transf. 2020;153:119578.10.1016/j.ijheatmasstransfer.2020.119578Suche in Google Scholar
[47] Pryazhnikov MI, Minakov AV, Rudyak VY, Guzei DV. Thermal conductivity measurements of nanofluids. Int J Heat Mass Transf. 2017;104:1275–82.10.1016/j.ijheatmasstransfer.2016.09.080Suche in Google Scholar
[48] Shi W, Li F, Lin Q. Effects of nanoparticles on the instability of liquid jets in a gaseous crossflow. Int J Multiph Flow. 2020;133:103449.10.1016/j.ijmultiphaseflow.2020.103449Suche in Google Scholar
© 2023 the author(s), published by De Gruyter
This work is licensed under the Creative Commons Attribution 4.0 International License.
Artikel in diesem Heft
- Research Articles
- Preparation of CdS–Ag2S nanocomposites by ultrasound-assisted UV photolysis treatment and its visible light photocatalysis activity
- Significance of nanoparticle radius and inter-particle spacing toward the radiative water-based alumina nanofluid flow over a rotating disk
- Aptamer-based detection of serotonin based on the rapid in situ synthesis of colorimetric gold nanoparticles
- Investigation of the nucleation and growth behavior of Ti2AlC and Ti3AlC nano-precipitates in TiAl alloys
- Dynamic recrystallization behavior and nucleation mechanism of dual-scale SiCp/A356 composites processed by P/M method
- High mechanical performance of 3-aminopropyl triethoxy silane/epoxy cured in a sandwich construction of 3D carbon felts foam and woven basalt fibers
- Applying solution of spray polyurea elastomer in asphalt binder: Feasibility analysis and DSR study based on the MSCR and LAS tests
- Study on the chronic toxicity and carcinogenicity of iron-based bioabsorbable stents
- Influence of microalloying with B on the microstructure and properties of brazed joints with Ag–Cu–Zn–Sn filler metal
- Thermohydraulic performance of thermal system integrated with twisted turbulator inserts using ternary hybrid nanofluids
- Study of mechanical properties of epoxy/graphene and epoxy/halloysite nanocomposites
- Effects of CaO addition on the CuW composite containing micro- and nano-sized tungsten particles synthesized via aluminothermic coupling with silicothermic reduction
- Cu and Al2O3-based hybrid nanofluid flow through a porous cavity
- Design of functional vancomycin-embedded bio-derived extracellular matrix hydrogels for repairing infectious bone defects
- Study on nanocrystalline coating prepared by electro-spraying 316L metal wire and its corrosion performance
- Axial compression performance of CFST columns reinforced by ultra-high-performance nano-concrete under long-term loading
- Tungsten trioxide nanocomposite for conventional soliton and noise-like pulse generation in anomalous dispersion laser cavity
- Microstructure and electrical contact behavior of the nano-yttria-modified Cu-Al2O3/30Mo/3SiC composite
- Melting rheology in thermally stratified graphene-mineral oil reservoir (third-grade nanofluid) with slip condition
- Re-examination of nonlinear vibration and nonlinear bending of porous sandwich cylindrical panels reinforced by graphene platelets
- Parametric simulation of hybrid nanofluid flow consisting of cobalt ferrite nanoparticles with second-order slip and variable viscosity over an extending surface
- Chitosan-capped silver nanoparticles with potent and selective intrinsic activity against the breast cancer cells
- Multi-core/shell SiO2@Al2O3 nanostructures deposited on Ti3AlC2 to enhance high-temperature stability and microwave absorption properties
- Solution-processed Bi2S3/BiVO4/TiO2 ternary heterojunction photoanode with enhanced photoelectrochemical performance
- Electroporation effect of ZnO nanoarrays under low voltage for water disinfection
- NIR-II window absorbing graphene oxide-coated gold nanorods and graphene quantum dot-coupled gold nanorods for photothermal cancer therapy
- Nonlinear three-dimensional stability characteristics of geometrically imperfect nanoshells under axial compression and surface residual stress
- Investigation of different nanoparticles properties on the thermal conductivity and viscosity of nanofluids by molecular dynamics simulation
- Optimized Cu2O-{100} facet for generation of different reactive oxidative species via peroxymonosulfate activation at specific pH values to efficient acetaminophen removal
- Brownian and thermal diffusivity impact due to the Maxwell nanofluid (graphene/engine oil) flow with motile microorganisms and Joule heating
- Appraising the dielectric properties and the effectiveness of electromagnetic shielding of graphene reinforced silicone rubber nanocomposite
- Synthesis of Ag and Cu nanoparticles by plasma discharge in inorganic salt solutions
- Low-cost and large-scale preparation of ultrafine TiO2@C hybrids for high-performance degradation of methyl orange and formaldehyde under visible light
- Utilization of waste glass with natural pozzolan in the production of self-glazed glass-ceramic materials
- Mechanical performance of date palm fiber-reinforced concrete modified with nano-activated carbon
- Melting point of dried gold nanoparticles prepared with ultrasonic spray pyrolysis and lyophilisation
- Graphene nanofibers: A modern approach towards tailored gypsum composites
- Role of localized magnetic field in vortex generation in tri-hybrid nanofluid flow: A numerical approach
- Intelligent computing for the double-diffusive peristaltic rheology of magneto couple stress nanomaterials
- Bioconvection transport of upper convected Maxwell nanoliquid with gyrotactic microorganism, nonlinear thermal radiation, and chemical reaction
- 3D printing of porous Ti6Al4V bone tissue engineering scaffold and surface anodization preparation of nanotubes to enhance its biological property
- Bioinspired ferromagnetic CoFe2O4 nanoparticles: Potential pharmaceutical and medical applications
- Significance of gyrotactic microorganisms on the MHD tangent hyperbolic nanofluid flow across an elastic slender surface: Numerical analysis
- Performance of polycarboxylate superplasticisers in seawater-blended cement: Effect from chemical structure and nano modification
- Entropy minimization of GO–Ag/KO cross-hybrid nanofluid over a convectively heated surface
- Oxygen plasma assisted room temperature bonding for manufacturing SU-8 polymer micro/nanoscale nozzle
- Performance and mechanism of CO2 reduction by DBD-coupled mesoporous SiO2
- Polyarylene ether nitrile dielectric films modified by HNTs@PDA hybrids for high-temperature resistant organic electronics field
- Exploration of generalized two-phase free convection magnetohydrodynamic flow of dusty tetra-hybrid Casson nanofluid between parallel microplates
- Hygrothermal bending analysis of sandwich nanoplates with FG porous core and piezomagnetic faces via nonlocal strain gradient theory
- Design and optimization of a TiO2/RGO-supported epoxy multilayer microwave absorber by the modified local best particle swarm optimization algorithm
- Mechanical properties and frost resistance of recycled brick aggregate concrete modified by nano-SiO2
- Self-template synthesis of hollow flower-like NiCo2O4 nanoparticles as an efficient bifunctional catalyst for oxygen reduction and oxygen evolution in alkaline media
- High-performance wearable flexible strain sensors based on an AgNWs/rGO/TPU electrospun nanofiber film for monitoring human activities
- High-performance lithium–selenium batteries enabled by nitrogen-doped porous carbon from peanut meal
- Investigating effects of Lorentz forces and convective heating on ternary hybrid nanofluid flow over a curved surface using homotopy analysis method
- Exploring the potential of biogenic magnesium oxide nanoparticles for cytotoxicity: In vitro and in silico studies on HCT116 and HT29 cells and DPPH radical scavenging
- Enhanced visible-light-driven photocatalytic degradation of azo dyes by heteroatom-doped nickel tungstate nanoparticles
- A facile method to synthesize nZVI-doped polypyrrole-based carbon nanotube for Ag(i) removal
- Improved osseointegration of dental titanium implants by TiO2 nanotube arrays with self-assembled recombinant IGF-1 in type 2 diabetes mellitus rat model
- Functionalized SWCNTs@Ag–TiO2 nanocomposites induce ROS-mediated apoptosis and autophagy in liver cancer cells
- Triboelectric nanogenerator based on a water droplet spring with a concave spherical surface for harvesting wave energy and detecting pressure
- A mathematical approach for modeling the blood flow containing nanoparticles by employing the Buongiorno’s model
- Molecular dynamics study on dynamic interlayer friction of graphene and its strain effect
- Induction of apoptosis and autophagy via regulation of AKT and JNK mitogen-activated protein kinase pathways in breast cancer cell lines exposed to gold nanoparticles loaded with TNF-α and combined with doxorubicin
- Effect of PVA fibers on durability of nano-SiO2-reinforced cement-based composites subjected to wet-thermal and chloride salt-coupled environment
- Effect of polyvinyl alcohol fibers on mechanical properties of nano-SiO2-reinforced geopolymer composites under a complex environment
- In vitro studies of titanium dioxide nanoparticles modified with glutathione as a potential drug delivery system
- Comparative investigations of Ag/H2O nanofluid and Ag-CuO/H2O hybrid nanofluid with Darcy-Forchheimer flow over a curved surface
- Study on deformation characteristics of multi-pass continuous drawing of micro copper wire based on crystal plasticity finite element method
- Properties of ultra-high-performance self-compacting fiber-reinforced concrete modified with nanomaterials
- Prediction of lap shear strength of GNP and TiO2/epoxy nanocomposite adhesives
- A novel exploration of how localized magnetic field affects vortex generation of trihybrid nanofluids
- Fabrication and physicochemical characterization of copper oxide–pyrrhotite nanocomposites for the cytotoxic effects on HepG2 cells and the mechanism
- Thermal radiative flow of cross nanofluid due to a stretched cylinder containing microorganisms
- In vitro study of the biphasic calcium phosphate/chitosan hybrid biomaterial scaffold fabricated via solvent casting and evaporation technique for bone regeneration
- Insights into the thermal characteristics and dynamics of stagnant blood conveying titanium oxide, alumina, and silver nanoparticles subject to Lorentz force and internal heating over a curved surface
- Effects of nano-SiO2 additives on carbon fiber-reinforced fly ash–slag geopolymer composites performance: Workability, mechanical properties, and microstructure
- Energy bandgap and thermal characteristics of non-Darcian MHD rotating hybridity nanofluid thin film flow: Nanotechnology application
- Green synthesis and characterization of ginger-extract-based oxali-palladium nanoparticles for colorectal cancer: Downregulation of REG4 and apoptosis induction
- Abnormal evolution of resistivity and microstructure of annealed Ag nanoparticles/Ag–Mo films
- Preparation of water-based dextran-coated Fe3O4 magnetic fluid for magnetic hyperthermia
- Statistical investigations and morphological aspects of cross-rheological material suspended in transportation of alumina, silica, titanium, and ethylene glycol via the Galerkin algorithm
- Effect of CNT film interleaves on the flexural properties and strength after impact of CFRP composites
- Self-assembled nanoscale entities: Preparative process optimization, payload release, and enhanced bioavailability of thymoquinone natural product
- Structure–mechanical property relationships of 3D-printed porous polydimethylsiloxane films
- Nonlinear thermal radiation and the slip effect on a 3D bioconvection flow of the Casson nanofluid in a rotating frame via a homotopy analysis mechanism
- Residual mechanical properties of concrete incorporated with nano supplementary cementitious materials exposed to elevated temperature
- Time-independent three-dimensional flow of a water-based hybrid nanofluid past a Riga plate with slips and convective conditions: A homotopic solution
- Lightweight and high-strength polyarylene ether nitrile-based composites for efficient electromagnetic interference shielding
- Review Articles
- Recycling waste sources into nanocomposites of graphene materials: Overview from an energy-focused perspective
- Hybrid nanofiller reinforcement in thermoset and biothermoset applications: A review
- Current state-of-the-art review of nanotechnology-based therapeutics for viral pandemics: Special attention to COVID-19
- Solid lipid nanoparticles for targeted natural and synthetic drugs delivery in high-incidence cancers, and other diseases: Roles of preparation methods, lipid composition, transitional stability, and release profiles in nanocarriers’ development
- Critical review on experimental and theoretical studies of elastic properties of wurtzite-structured ZnO nanowires
- Polyurea micro-/nano-capsule applications in construction industry: A review
- A comprehensive review and clinical guide to molecular and serological diagnostic tests and future development: In vitro diagnostic testing for COVID-19
- Recent advances in electrocatalytic oxidation of 5-hydroxymethylfurfural to 2,5-furandicarboxylic acid: Mechanism, catalyst, coupling system
- Research progress and prospect of silica-based polymer nanofluids in enhanced oil recovery
- Review of the pharmacokinetics of nanodrugs
- Engineered nanoflowers, nanotrees, nanostars, nanodendrites, and nanoleaves for biomedical applications
- Research progress of biopolymers combined with stem cells in the repair of intrauterine adhesions
- Progress in FEM modeling on mechanical and electromechanical properties of carbon nanotube cement-based composites
- Antifouling induced by surface wettability of poly(dimethyl siloxane) and its nanocomposites
- TiO2 aerogel composite high-efficiency photocatalysts for environmental treatment and hydrogen energy production
- Structural properties of alumina surfaces and their roles in the synthesis of environmentally persistent free radicals (EPFRs)
- Nanoparticles for the potential treatment of Alzheimer’s disease: A physiopathological approach
- Current status of synthesis and consolidation strategies for thermo-resistant nanoalloys and their general applications
- Recent research progress on the stimuli-responsive smart membrane: A review
- Dispersion of carbon nanotubes in aqueous cementitious materials: A review
- Applications of DNA tetrahedron nanostructure in cancer diagnosis and anticancer drugs delivery
- Magnetic nanoparticles in 3D-printed scaffolds for biomedical applications
- An overview of the synthesis of silicon carbide–boron carbide composite powders
- Organolead halide perovskites: Synthetic routes, structural features, and their potential in the development of photovoltaic
- Recent advancements in nanotechnology application on wood and bamboo materials: A review
- Application of aptamer-functionalized nanomaterials in molecular imaging of tumors
- Recent progress on corrosion mechanisms of graphene-reinforced metal matrix composites
- Research progress on preparation, modification, and application of phenolic aerogel
- Application of nanomaterials in early diagnosis of cancer
- Plant mediated-green synthesis of zinc oxide nanoparticles: An insight into biomedical applications
- Recent developments in terahertz quantum cascade lasers for practical applications
- Recent progress in dielectric/metal/dielectric electrodes for foldable light-emitting devices
- Nanocoatings for ballistic applications: A review
- A mini-review on MoS2 membrane for water desalination: Recent development and challenges
- Recent updates in nanotechnological advances for wound healing: A narrative review
- Recent advances in DNA nanomaterials for cancer diagnosis and treatment
- Electrochemical micro- and nanobiosensors for in vivo reactive oxygen/nitrogen species measurement in the brain
- Advances in organic–inorganic nanocomposites for cancer imaging and therapy
- Advancements in aluminum matrix composites reinforced with carbides and graphene: A comprehensive review
- Modification effects of nanosilica on asphalt binders: A review
- Decellularized extracellular matrix as a promising biomaterial for musculoskeletal tissue regeneration
- Review of the sol–gel method in preparing nano TiO2 for advanced oxidation process
- Micro/nano manufacturing aircraft surface with anti-icing and deicing performances: An overview
- Cell type-targeting nanoparticles in treating central nervous system diseases: Challenges and hopes
- An overview of hydrogen production from Al-based materials
- A review of application, modification, and prospect of melamine foam
- A review of the performance of fibre-reinforced composite laminates with carbon nanotubes
- Research on AFM tip-related nanofabrication of two-dimensional materials
- Advances in phase change building materials: An overview
- Development of graphene and graphene quantum dots toward biomedical engineering applications: A review
- Nanoremediation approaches for the mitigation of heavy metal contamination in vegetables: An overview
- Photodynamic therapy empowered by nanotechnology for oral and dental science: Progress and perspectives
- Biosynthesis of metal nanoparticles: Bioreduction and biomineralization
- Current diagnostic and therapeutic approaches for severe acute respiratory syndrome coronavirus-2 (SARS-COV-2) and the role of nanomaterial-based theragnosis in combating the pandemic
- Application of two-dimensional black phosphorus material in wound healing
- Special Issue on Advanced Nanomaterials and Composites for Energy Conversion and Storage - Part I
- Helical fluorinated carbon nanotubes/iron(iii) fluoride hybrid with multilevel transportation channels and rich active sites for lithium/fluorinated carbon primary battery
- The progress of cathode materials in aqueous zinc-ion batteries
- Special Issue on Advanced Nanomaterials for Carbon Capture, Environment and Utilization for Energy Sustainability - Part I
- Effect of polypropylene fiber and nano-silica on the compressive strength and frost resistance of recycled brick aggregate concrete
- Mechanochemical design of nanomaterials for catalytic applications with a benign-by-design focus