Dynamic recrystallization behavior and nucleation mechanism of dual-scale SiCp/A356 composites processed by P/M method
-
Yahu Song
 ,
Douqin Ma
,
Douqin Ma

Abstract
Thermal deformation can improve the properties of aluminum matrix composites (AMCs) prepared by powder metallurgy (P/M) due to the dense and uniform microstructures. And the final microstructure of the AMCs is related to the dynamic recrystallization (DRX) behavior and nucleation mechanism in the thermal forming process. In this regard, the hot compression tests of dual-scale SiC particles reinforced A356 (SiCp/A356) composites prepared by P/M method were carried out at temperatures of 460–520°C and strain rates of 0.01–5 s−1 on a thermal simulation tester. The corresponding microstructure evolution was analyzed by electron back-scattered diffraction and transmission electron microscopy. The results indicated that the stress–strain curve was a typical DRX unimodal stress curve. The comprehensive influences of the strain rate and deformation temperature on the stress were investigated using the Zener–Hollomon parameter (Z), where the deformation activation energy was 443.204 kJ/mol. The DRX critical strain model and DRX volume fraction model were established. DRX behavior of the SiCp/A356 composites was sensitive to the deformation temperatures and strain rates. The micro and nano SiCp can promote the DRX nucleation of Al matrix due to the particle-stimulated nucleation.
1 Introduction
Aluminum matrix composites (AMCs) reinforced by particles are wildly used in aerospace, national defense industry, automobile industry, electronic packaging, and other high-tech fields due to their excellent mechanical and physical properties [1,2,3]. Generally, the properties of the AMCs may be improved by adding a single micron or nanoparticle as the reinforcing phase. The research shows that micron particle significantly enhances the strength, hardness, and wear resistance of AMCs, while leading to a sharp decline in their plasticity and toughness [4,5]. For the nanoparticles, they have apparent size effects, which can enhance the strength, plasticity, and toughness of AMCs. However, the AMCs reinforced by high-volume fraction nanoparticles are challenging to prepare due to the easy agglomerate of nanoparticles, which significantly limits the application [6,7]. However, more attention has been paid to developing micron and nanoparticle hybrid aluminum matrix composites (HAMCs) with good comprehensive properties due to the different strengthening mechanisms of the reinforcements [8,9,10]. Zhang et al. [8] have investigated the effects of SiCp with varying scales on the microstructure and properties of Al2014 composites. The research shows that compared with Al2014 alloy, micron SiCp composite and nano SiCp composite, and dual-scale SiCp/Al2014 composites present more excellent mechanical properties. The creep resistance of the different-sized TiCp/Al–Cu composites has been studied by Tian et al. [9]. Their results demonstrate that the creep resistance of the dual-scale (micron + nano) TiCp/Al–Cu composite is 10–38 times and 3–6 times higher than that of the Al–Cu matrix alloy and single-scale composites, respectively.
To improve the performance of AMCs prepared by powder metallurgy (P/M), further processing, such as hot extrusion, forging, and rolling, should be proceeded to obtain the dense and uniform microstructure. However, the hot workability of AMCs is usually poor due to the difference in hardness and thermal expansion coefficient between the particles and the Al matrix [11,12]. Researchers have revealed that dynamic recrystallization (DRX) behavior is advantageous to the refinement and homogenization of the grain in AMCs, which is a crucial deformation mechanism to reconstitute the microstructure and enhance its properties during the hot working process [13,14]. Therefore, it is significant to research the DRX behavior of HAMCs during hot deformation to improve the microstructure and enhance the properties.
Presently, it is commonly accepted that the addition of reinforcement particles has an essential effect on the DRX behavior of aluminum matrix. When the particle size is greater than 1 μm, due to the mismatch between the deformation of the particle and matrix, the deformation zone with high dislocation density and orientation gradient will be formed near the particle, which can promote the nucleation of DRX. This is called particle-stimulated nucleation (PSN) [15,16]. As the particle size is less than 1 μm, the small-scale particles have a strong pinning effect on the grain boundaries, delaying the recrystallization process and inhibiting the recrystallization nucleation to a certain extent [17]. However, the research on AMCs by Zhao et al. [18] and Kai et al. [19] shows that nanoparticles can promote the nucleation of DRX. Meanwhile, Radi and Mahmudi [20] also obtained the same results in nanoparticle-reinforced magnesium matrix composites. Therefore, when micro and nano scale particles coexist in HAMCs, the DRX behavior and nucleation mechanism will be more complex in the thermal forming process, due to the influence of SiCp at different scales on the DRX behavior of composites.
Until now, there have been few reports about the DRX behavior of HAMCs in the available literature. Consequently, in the present study, based on the stress–strain curves and the relationship of the work hardening rate-strain of dual-scale SiCp/A356 composites, the critical strain model and kinetic model of DRX were determined to describe the DRX behaviors of HAMCs. Meanwhile, the microstructure evolution of the studied composites was explored by electron back-scattered diffraction (EBSD) and transmission electron microscopy (TEM). The DRX behavior and nucleation mechanism were investigated. It provides significant data support for improving the microstructure and comprehensive performance of HAMCs accurately.
2 Experimental materials and procedures
The material used in this experiment was A356 composites reinforced with dual-scale SiCp. One scale of SiCp was 10 μm with a fraction of 23 vol%, and the other was 80 nm with a fraction of 2 vol%. The matrix material was A356 alloy powders with a mean size of 7 μm, and the chemical compositions of the A356 alloy are listed in Table 1.
The chemical compositions of the A356 alloy used
| Element | Si | Mg | Cu | Fe | Al |
|---|---|---|---|---|---|
| Weight percent (wt%) | 7.0 | 0.3 | 0.1 | 0.1 | Bal. |
Figure 1 displays the fabrication process of the composites used. The A356 powders were mixed with nano-sized SiCp by the high-energy ball milling for 12 h with a rotation speed of 150 rpm and a ball-to-powder weight ratio of 8:1, and then the pre-prepared composite powders were mixed with micro-sized SiCp using the same process. After that, an LDJ 200/600-300 YS cold isostatic pressing equipment was employed to press the mixed powders with a 240 MPa pressure for 15 s, and then the cold-pressed specimens were sintered in a VAF-7720 furnace with 2 × 10⁻² Pa at 550°C for 4 h. The specimens were hot extruded by an XJ-500 type extruder at 500°C. The extrusion ratio was 15:1, and the speed was 1 mm/s. At last, the bars were annealed at 300°C for 2 h.
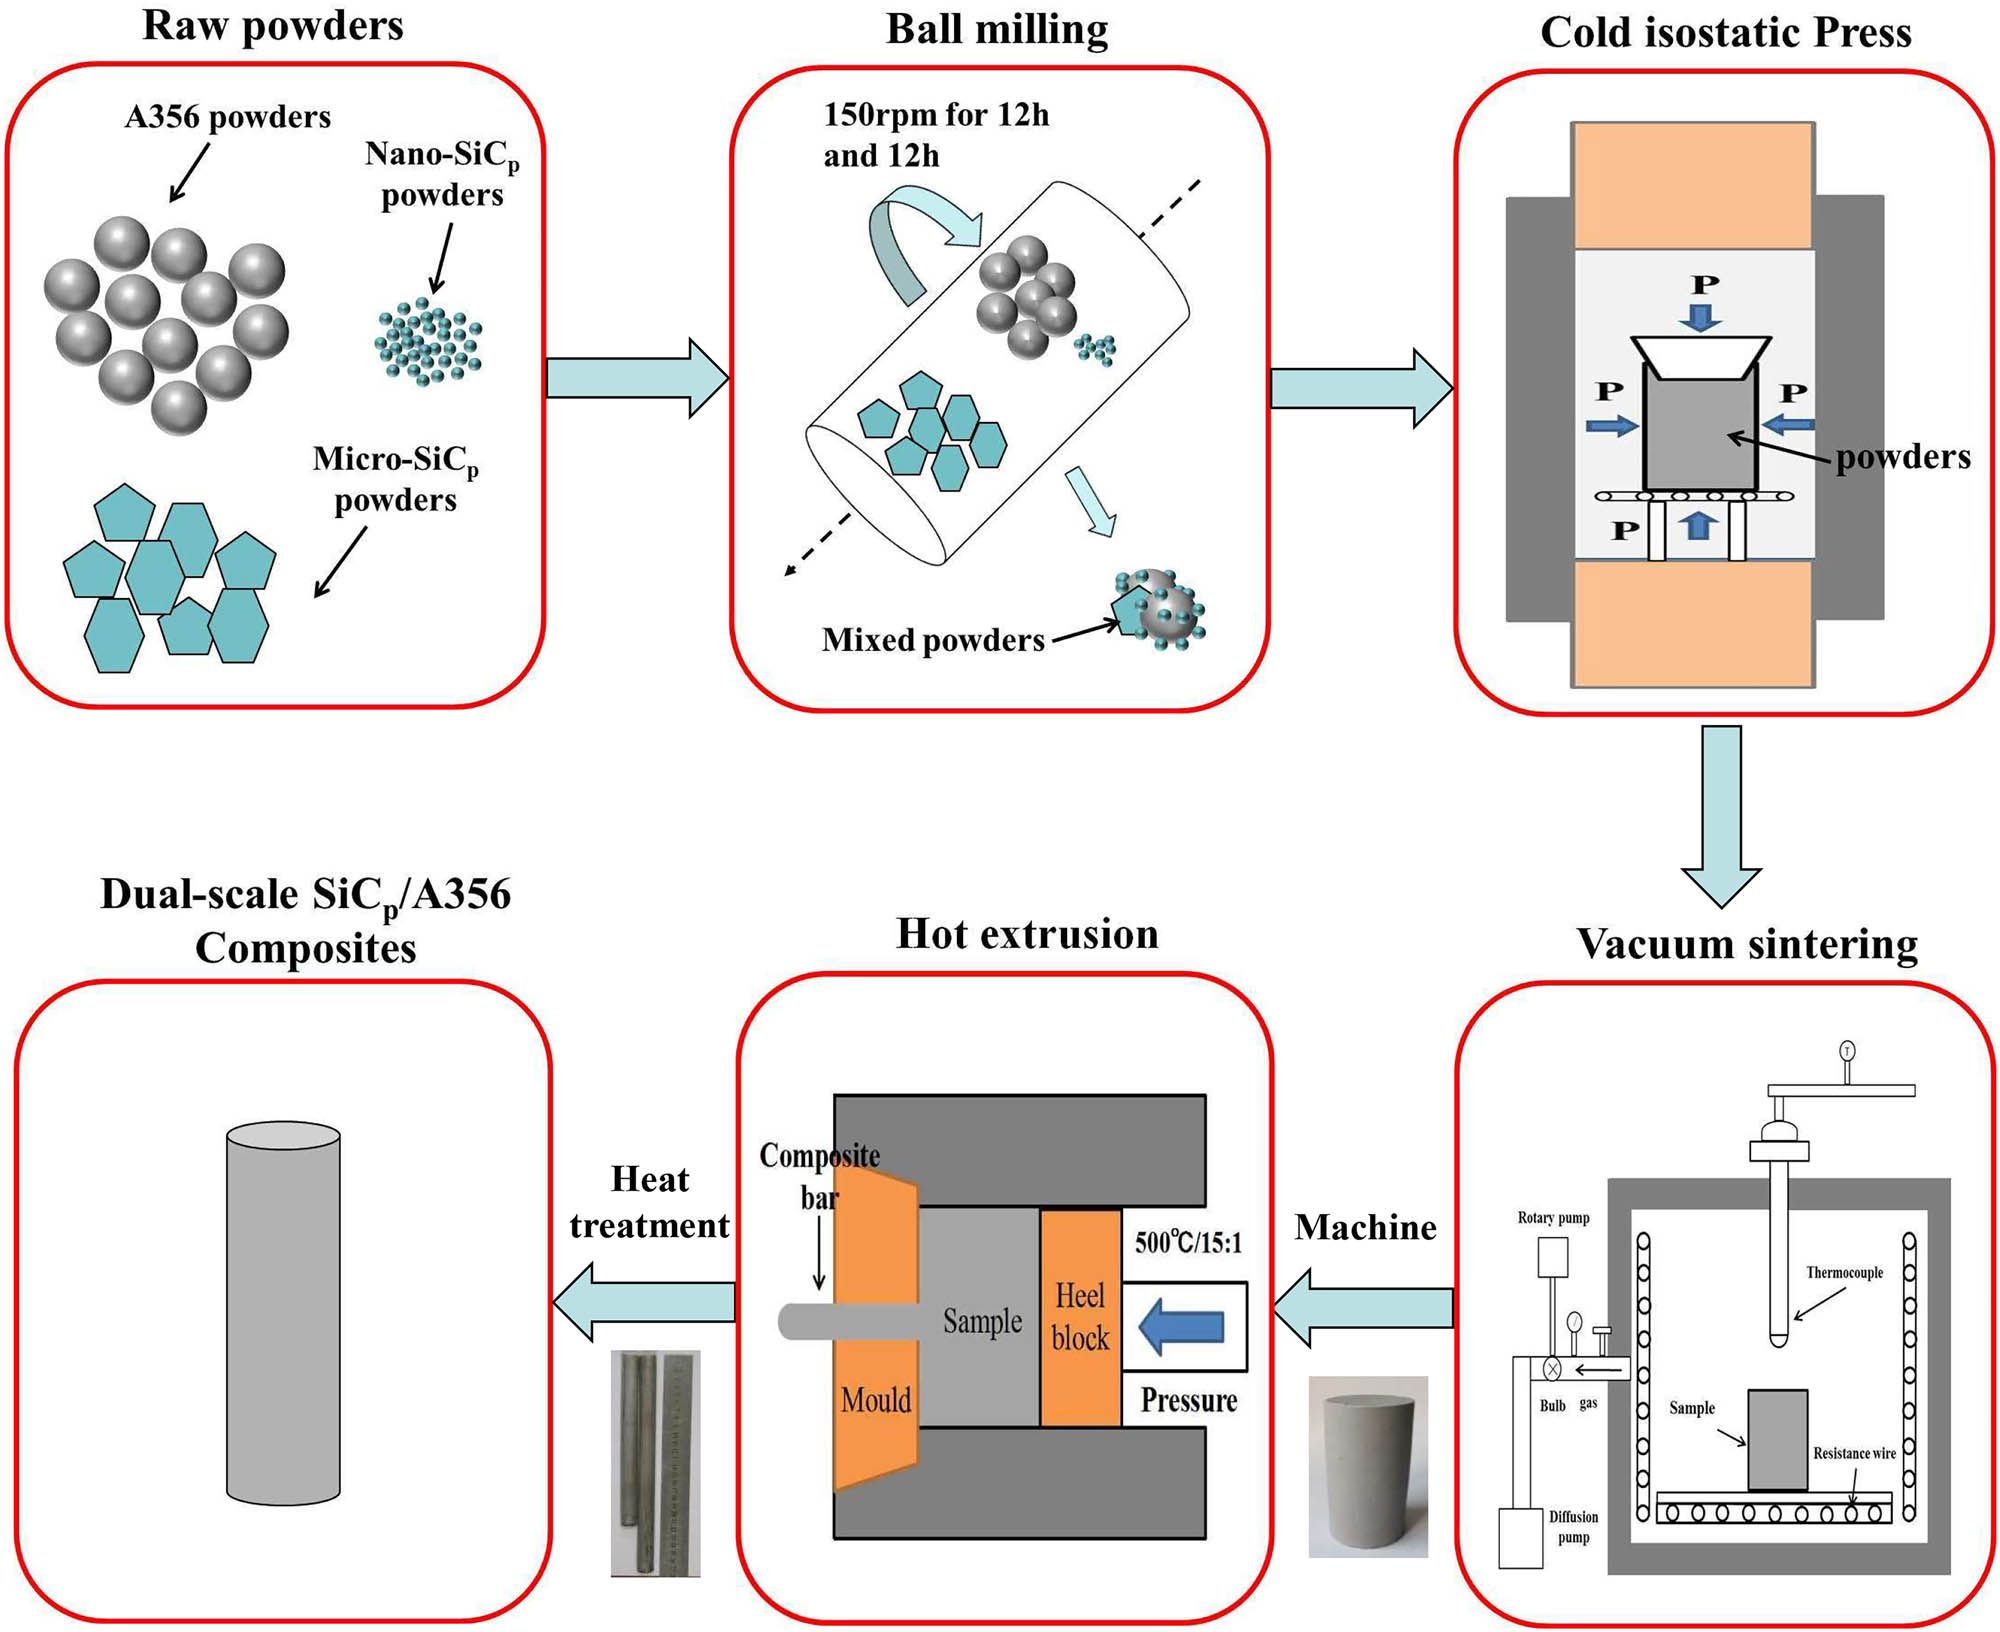
The fabrication process of dual-scale SiCp/A356 composites used.
Morphologies of the composites were observed using a ZEISS EVO 18 scanning electron microscopy (SEM) operated at 20 kV and a JEOL JEM-2100 transmission electron microscope (TEM) operated at 200 kV. The samples for TEM observation were thin foils with a diameter of 3 mm and thickness of about 50 μm, which were twin-jet electropolished in a 75% methanol and 25% nitric acid solution at about −30°C. Figure 2a–e reveals the microstructure of raw material powders and mixed powders. The microstructures of the studied composites are shown in Figure 2f–h. Obviously, micro-SiCp are uniformly distributed in the Al matrix (Figure 2f). Meanwhile, no agglomerations of nano-SiCp are observed (Figure 2g).
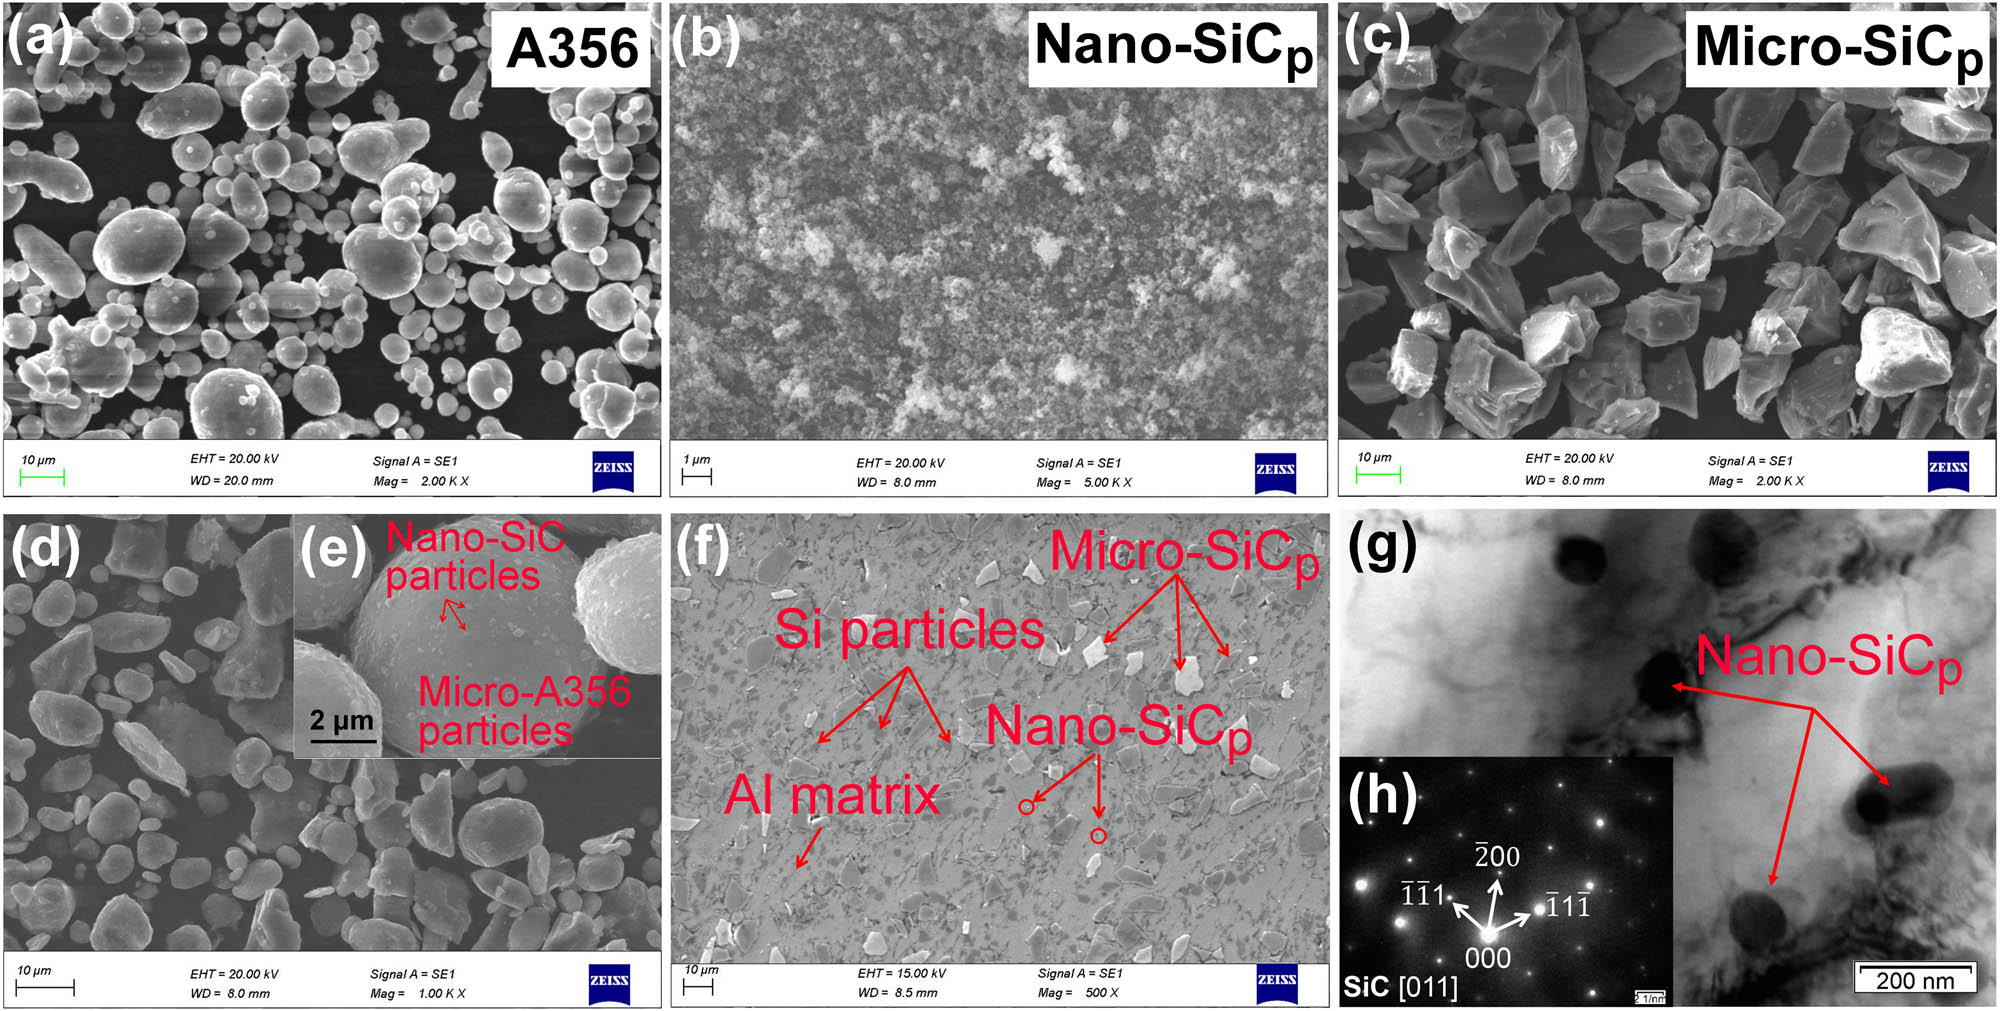
Morphologies of the preparation process of dual-scale SiCp/A356 composites used: (a) A356 powders; (b) nano-SiCp powders; (c) micro-SiCp powders; (d) mixed powders after ball milling; (e) high-magnification image of the mixed powders showing the uniform distribution of nano- SiCp on the A356 particles; (f) SEM images of the composites; (g) TEM images of the composites; and (h) corresponding diffraction pattern of the nano-SiCp.
The hot compressed samples with a length of 12 mm and a diameter of 8 mm were prepared. The hot deformation was tested at temperatures of 460–520°C and strain rates of 0.01–5 s−1 by a Gleeble-1500D thermal simulation tester. The true strain was 0.7 in the trial. The schematic diagram of the hot compression process is shown in Figure 3. In addition, to analyze the microstructure evolution of the composites during thermal deformation, compression specimens with the true strains of 0.1, 0.3, and 0.5 at the temperature of 500°C and strain rate of 1 s−1 were water quenched immediately. The microstructures of the compressed specimens were analyzed by EBSD and TEM. EBSD images were tested by the JMS-7800F field emission SEM operated at 20 kV. The EBSD data were analyzed by the Transmission Channel 5 software. The samples for EBSD measurements were electro-polished using 25 vol% HNO3 in methanol at 20°C and 5 V, and then the observation surface was carried out in a Precision ion polishing system.
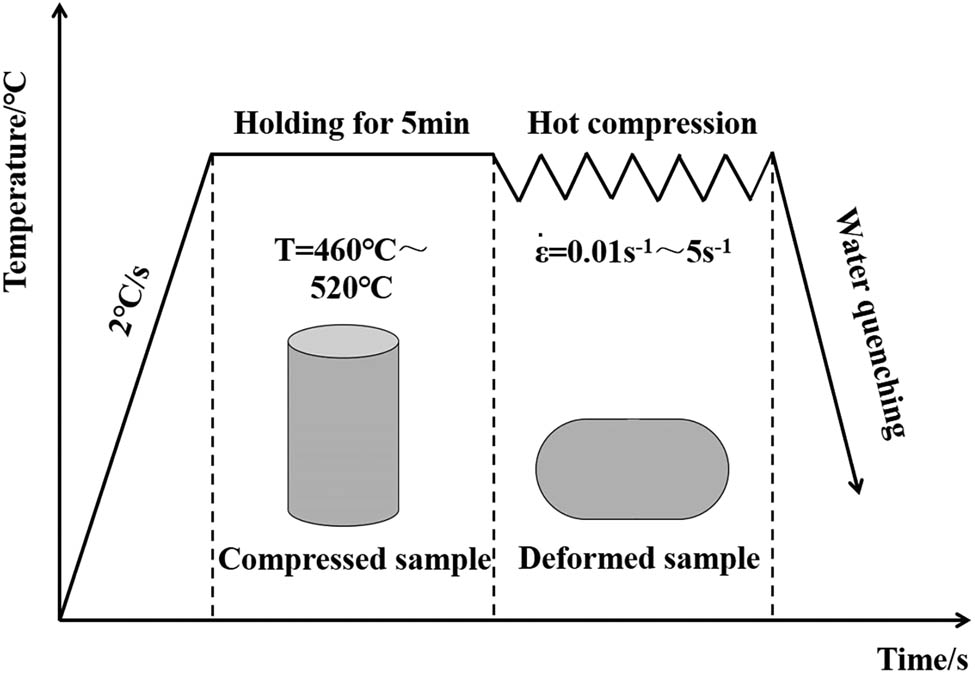
Schematic diagram of the hot compression process.
3 Results and discussion
3.1 True stress–strain curves
The true stress–strain curves of the used composites under different deformation conditions are presented in Figure 4. The temperatures and strain rates significantly affect the flow stress of the HAMCs. The curves show typical DRX characteristics with single peak stress [21]. During the hot deformation process, with the increase in the strain, the true stress rapidly reaches a peak value due to the work hardening. It then decreases slowly owing to the dynamic recovery (DRV) and DRX.
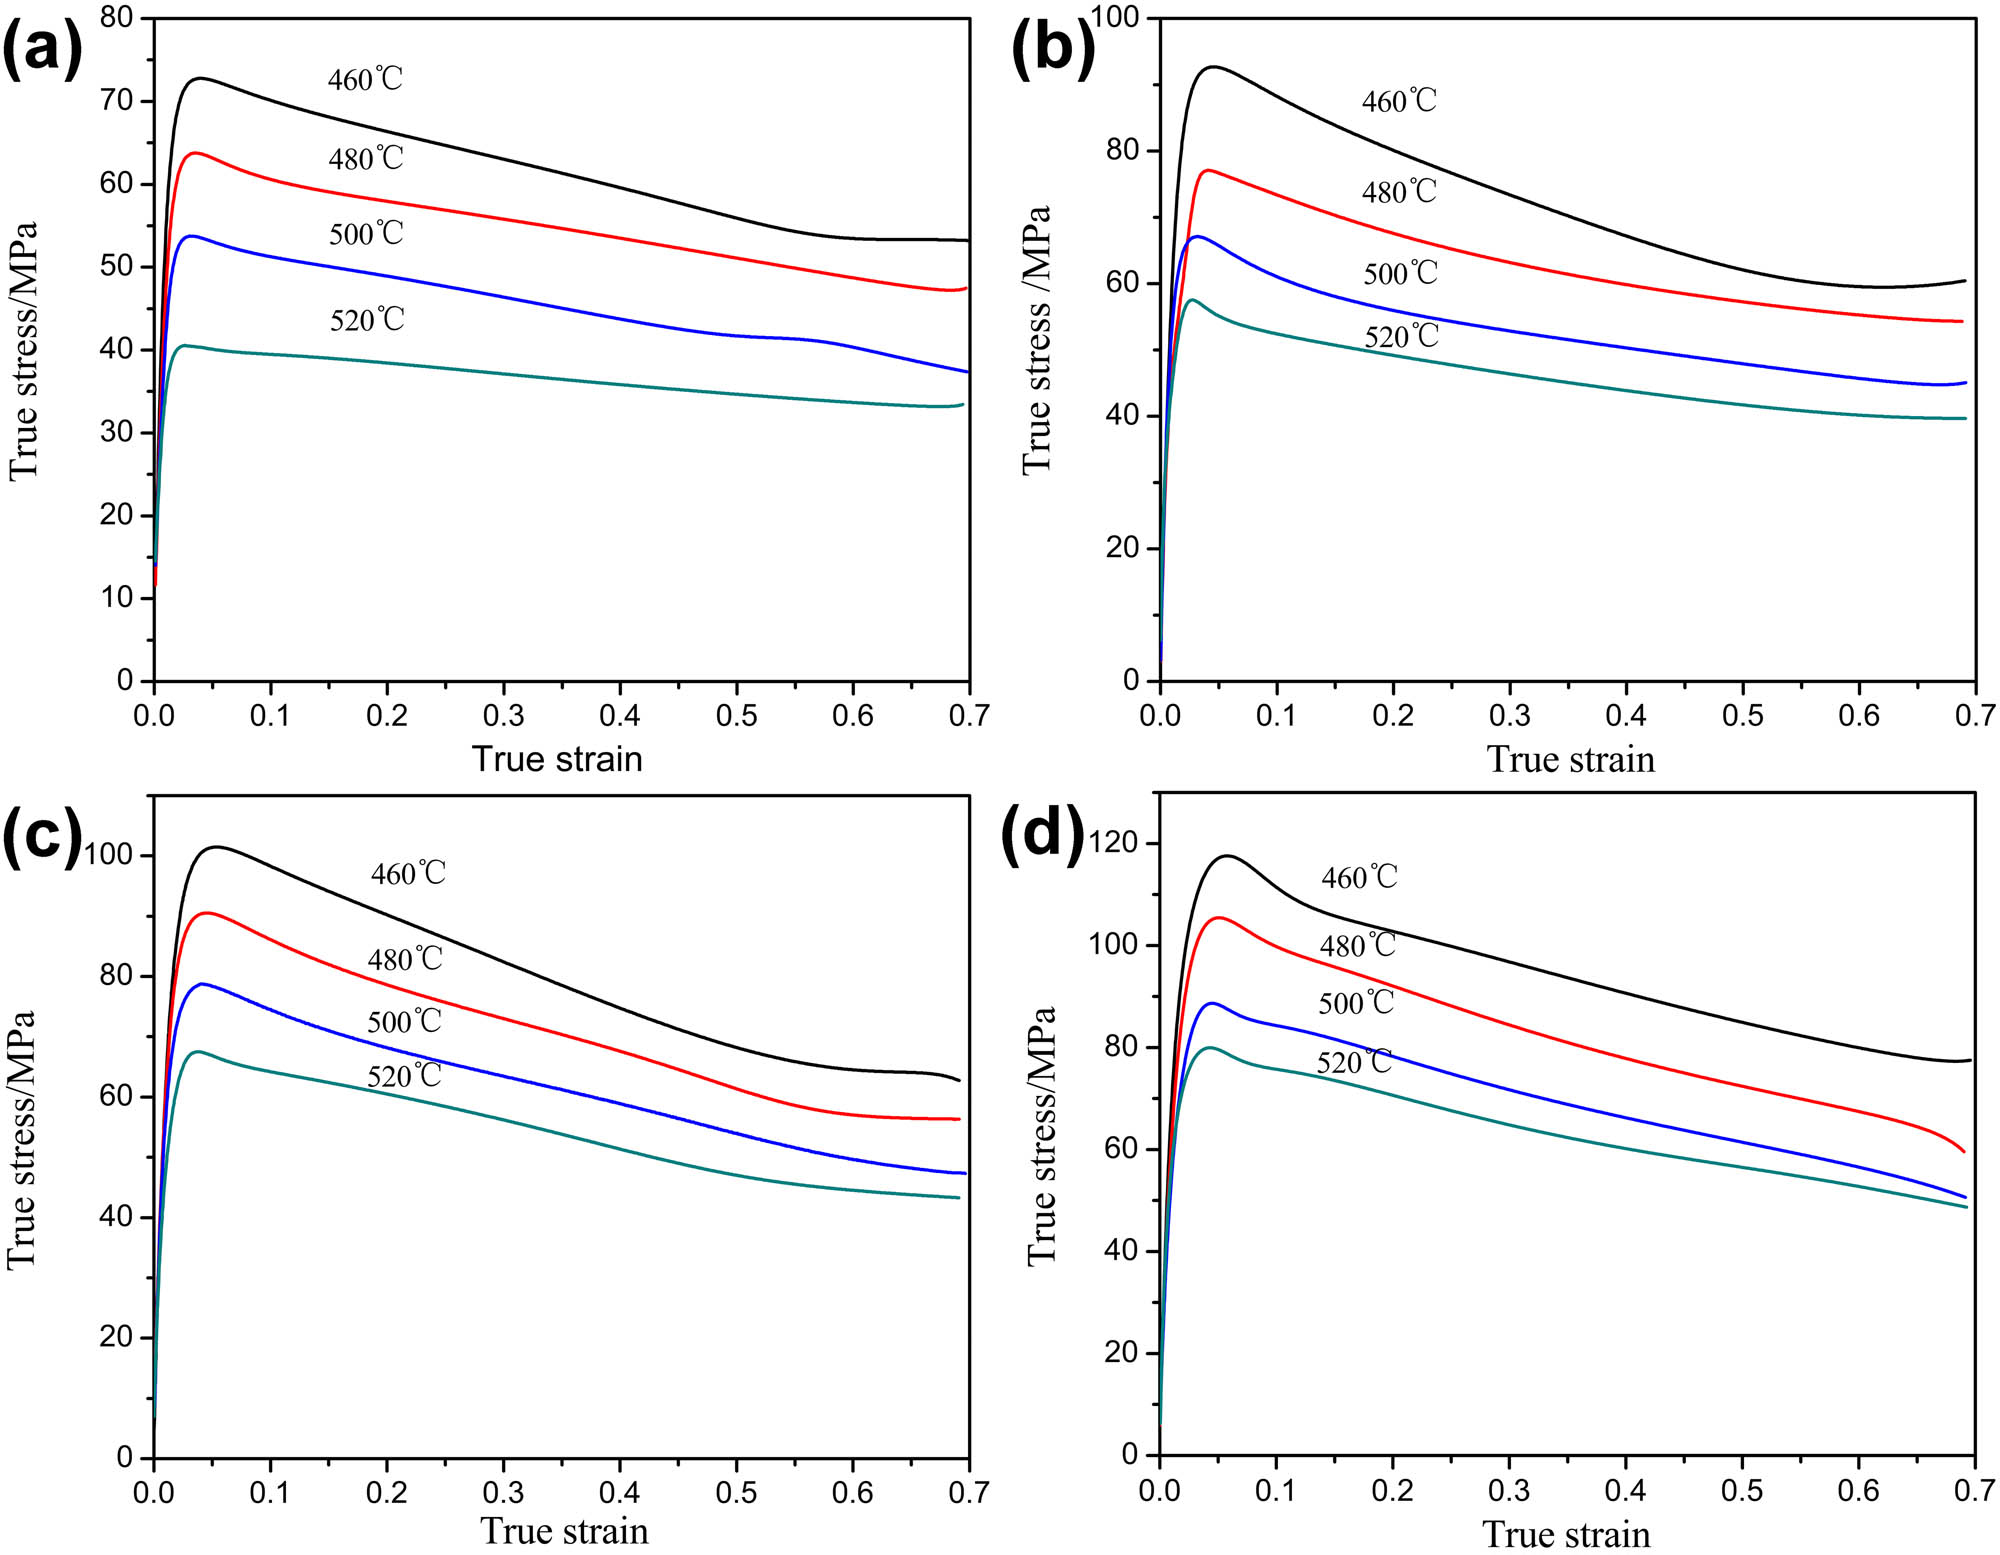
The true stress–strain curves at different strain rates: (a)
The peak stress of the composites used under various deformation conditions is displayed in Figure 5. The peak stress decreases as the temperature increases. It indicates that the composites are sensitive to the deformation temperatures, which is similar to that of single-scale micro or nano-SiCp/Al composites as reported in refs [22,23]. It is attributed to the stronger dynamic softening at high temperatures. Figure 5 also demonstrates that the peak stress increases with the strain rate at the same temperature. Because of the increased strain rate, the time for the deformation structure nucleation and growth is insufficient, and the dislocation multiplication increases rapidly. It is evident that work hardening occurs, suggesting that the flow stress increases. Thus, the composites studied have a positive sensitivity to strain rate.
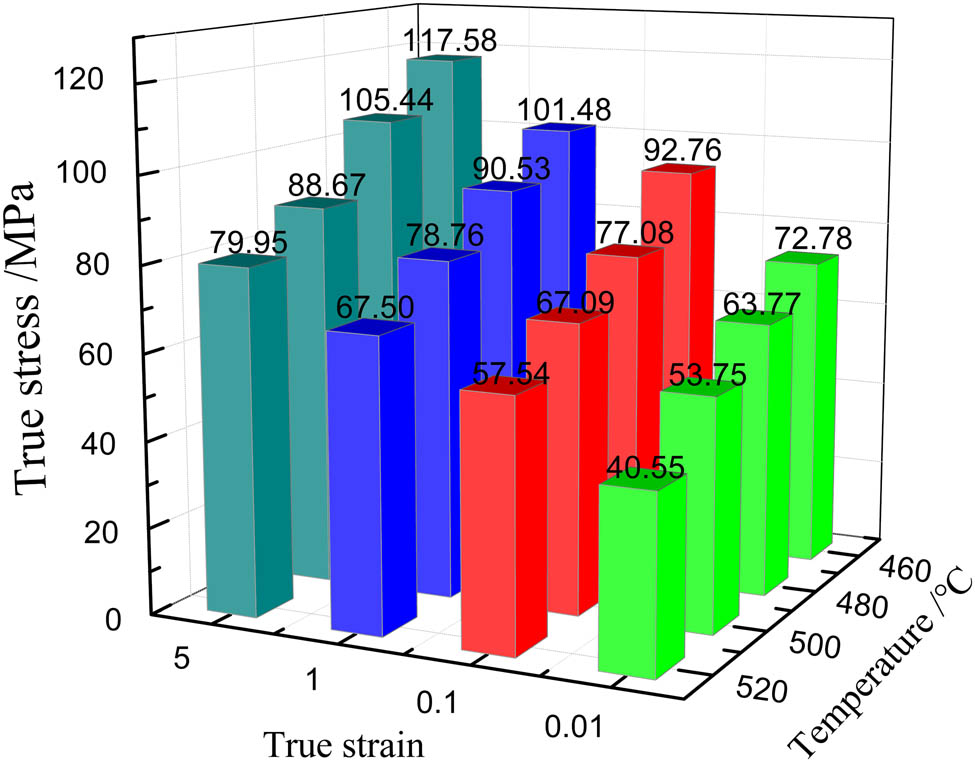
Peak stress under different deformation conditions.
3.2 Constitutive equation
For the hot deformation behavior of AMCS, the equations (1)–(3) are generally employed to demonstrate the relationship between the strain rate (
where A
1, A
2, A, α, n, β, and n´ are constant (
Taking the natural logarithms on both sides for equations (1)–(4), we get
Substituting the peak stress and corresponding strain rate values in equations (5) and (6). Scatter diagrams and linear regression fits of the
![Figure 6
Scatter diagrams and linear regression fits: (a)
ln
σ
−
ln
ε
̇
{\rm{ln}}\sigma -{\rm{ln}}\dot{\varepsilon }
; (b)
σ
−
ln
ε
̇
\sigma -{\rm{ln}}\dot{\varepsilon }
; (c)
ln
[
sinh
(
α
σ
)
]
−
ln
ε
̇
{\rm{ln}}\left[{\rm{\sinh }}\left(\alpha \sigma \left)]-{\rm{ln}}\dot{\varepsilon }
; and (d)
T
−
1
/
10
−
3
K
−
1
−
ln
[
sinh
(
α
σ
)
]
{T}^{-1}/{10}^{-3}{{K}}^{-1}\left-{\rm{ln}}\left[{\rm{\sinh }}\left(\alpha \sigma \left)]
.](/document/doi/10.1515/ntrev-2022-0506/asset/graphic/j_ntrev-2022-0506_fig_006.jpg)
Scatter diagrams and linear regression fits: (a)
According to equation (7), Q can be obtained from equation (9).
where n and K are the slopes of
According to equation (8) and Q value, the values of
The values of
|
|
T (°C) | |||
|---|---|---|---|---|
| 460 | 480 | 500 | 520 | |
| 0.01 | 68.12082028 | 66.18918707 | 64.35750900 | 62.61822327 |
| 0.1 | 70.42340537 | 68.49177216 | 66.66009409 | 64.92080836 |
| 1 | 72.72599047 | 70.79435725 | 68.96267919 | 67.22339346 |
| 5 | 74.33542838 | 72.40379516 | 70.57211710 | 68.83283137 |
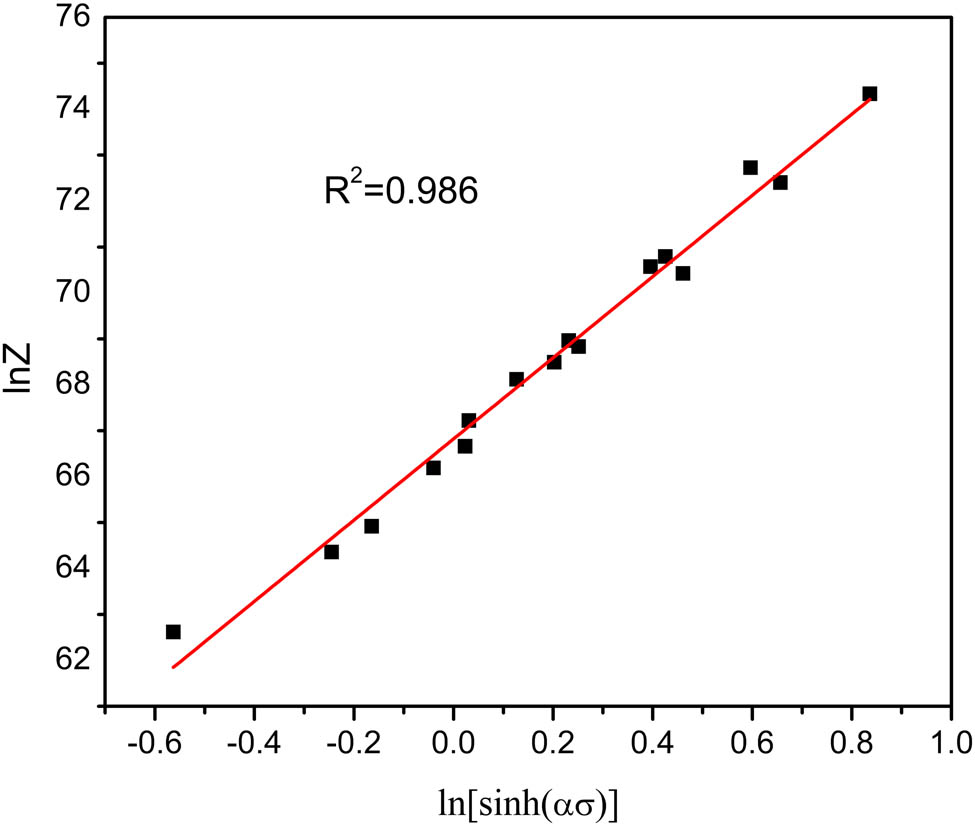
The relationship between the peak stress and Z parameter.
3.3 The critical strain for DRX
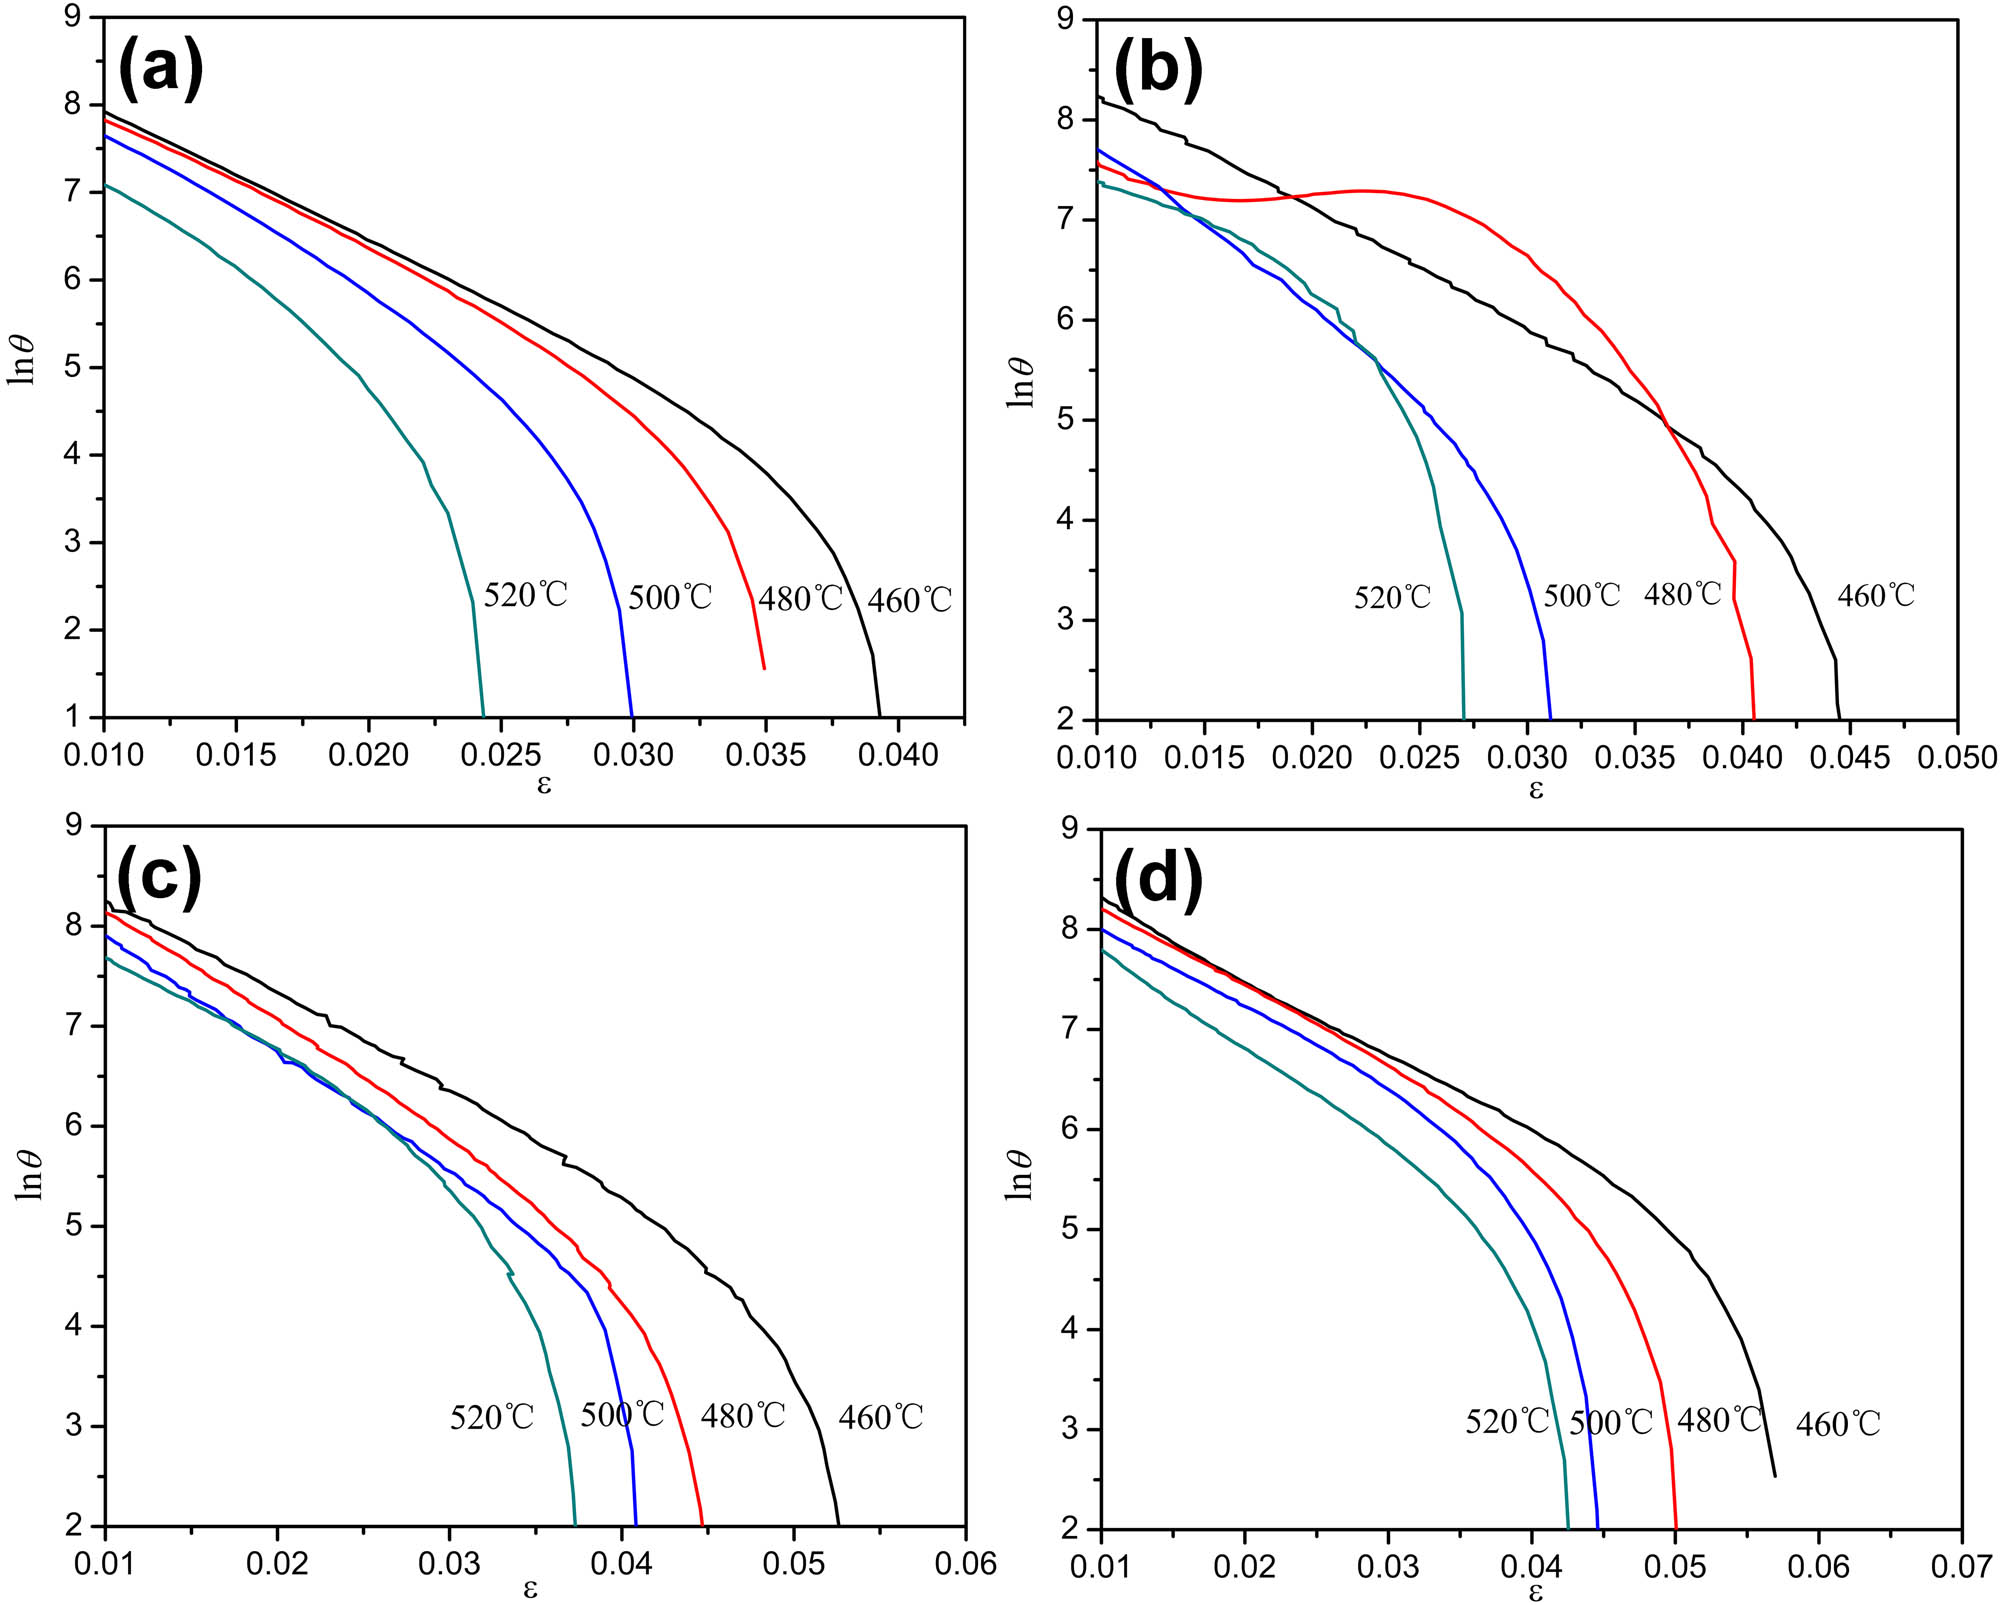
In general, the appearance of peak stress in stress–strain curves of a material suggests that DRX occurs. Moreover, the DRX has occurred before it reaches the peak strain. Therefore, the determination of critical strain has a great significance on the hot working process [27,28]. The work hardening rate-flow stress (
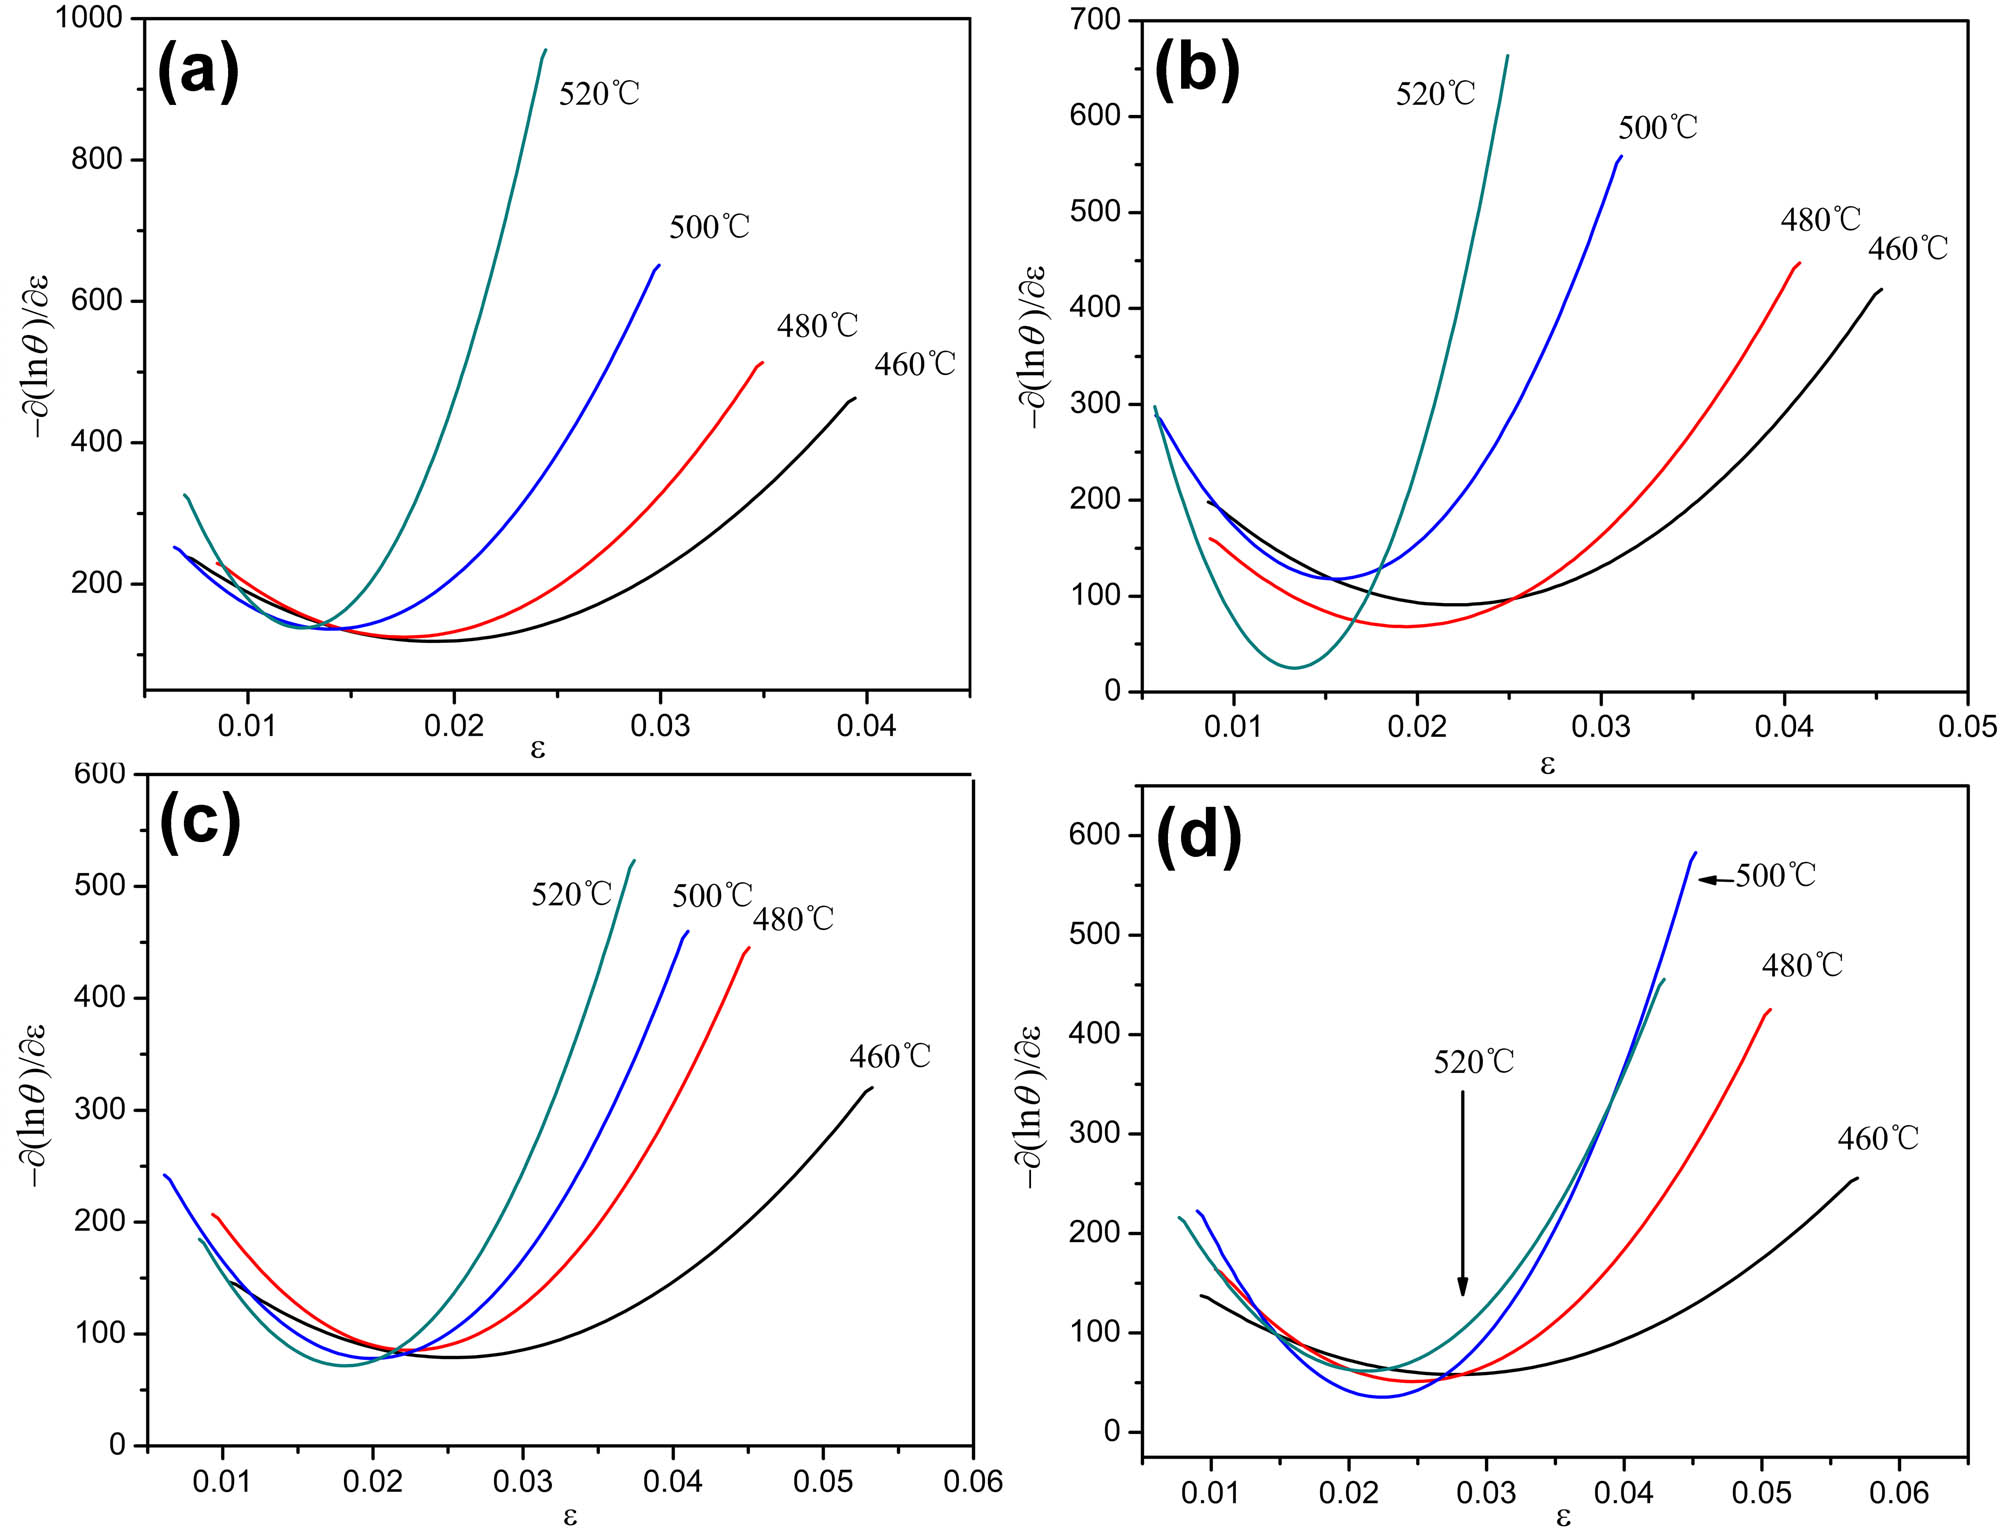
Figure 8 presents the relationship curves between
The relationship curves between
The relationship curves between
The relationship curves between
Critical strain (ε c) and peak strain (ε p) of DRX under different deformation conditions
|
|
Parameter | T (°C) | |||
|---|---|---|---|---|---|
| 460 | 480 | 500 | 520 | ||
| 0.01 | ε c | 0.01911 | 0.01757 | 0.01446 | 0.01265 |
| ε p | 0.03942 | 0.03548 | 0.03048 | 0.02597 | |
| 0.1 | ε c | 0.02198 | 0.01915 | 0.0155 | 0.01328 |
| ε p | 0.04529 | 0.04083 | 0.03111 | 0.02715 | |
| 1 | ε c | 0.02496 | 0.0225 | 0.01995 | 0.01815 |
| ε p | 0.05325 | 0.04505 | 0.04095 | 0.0374 | |
| 5 | ε c | 0.02781 | 0.02467 | 0.0224 | 0.02128 |
| ε p | 0.05785 | 0.05062 | 0.0452 | 0.0429 | |
The critical model of DRX proposed by Sellars et al. [26] is used to demonstrate the influence of temperatures and strain rates on the essential strain of DRX in the present work. The equation can be described as follows:
where k, a, and b are constants, ε
c, ε
p, and Z are critical strain, peak strain, and Zener–Hollomon parameter, respectively. According to the data in Table 3, there is a certain relationship between the critical strain and peak strain of DRX. As shown in Figure 10a, the ratio of the two (ε
c/ε
p) is 0.486. Based on the critical strain values and their corresponding Z values under different deformation conditions, the relationship diagram of
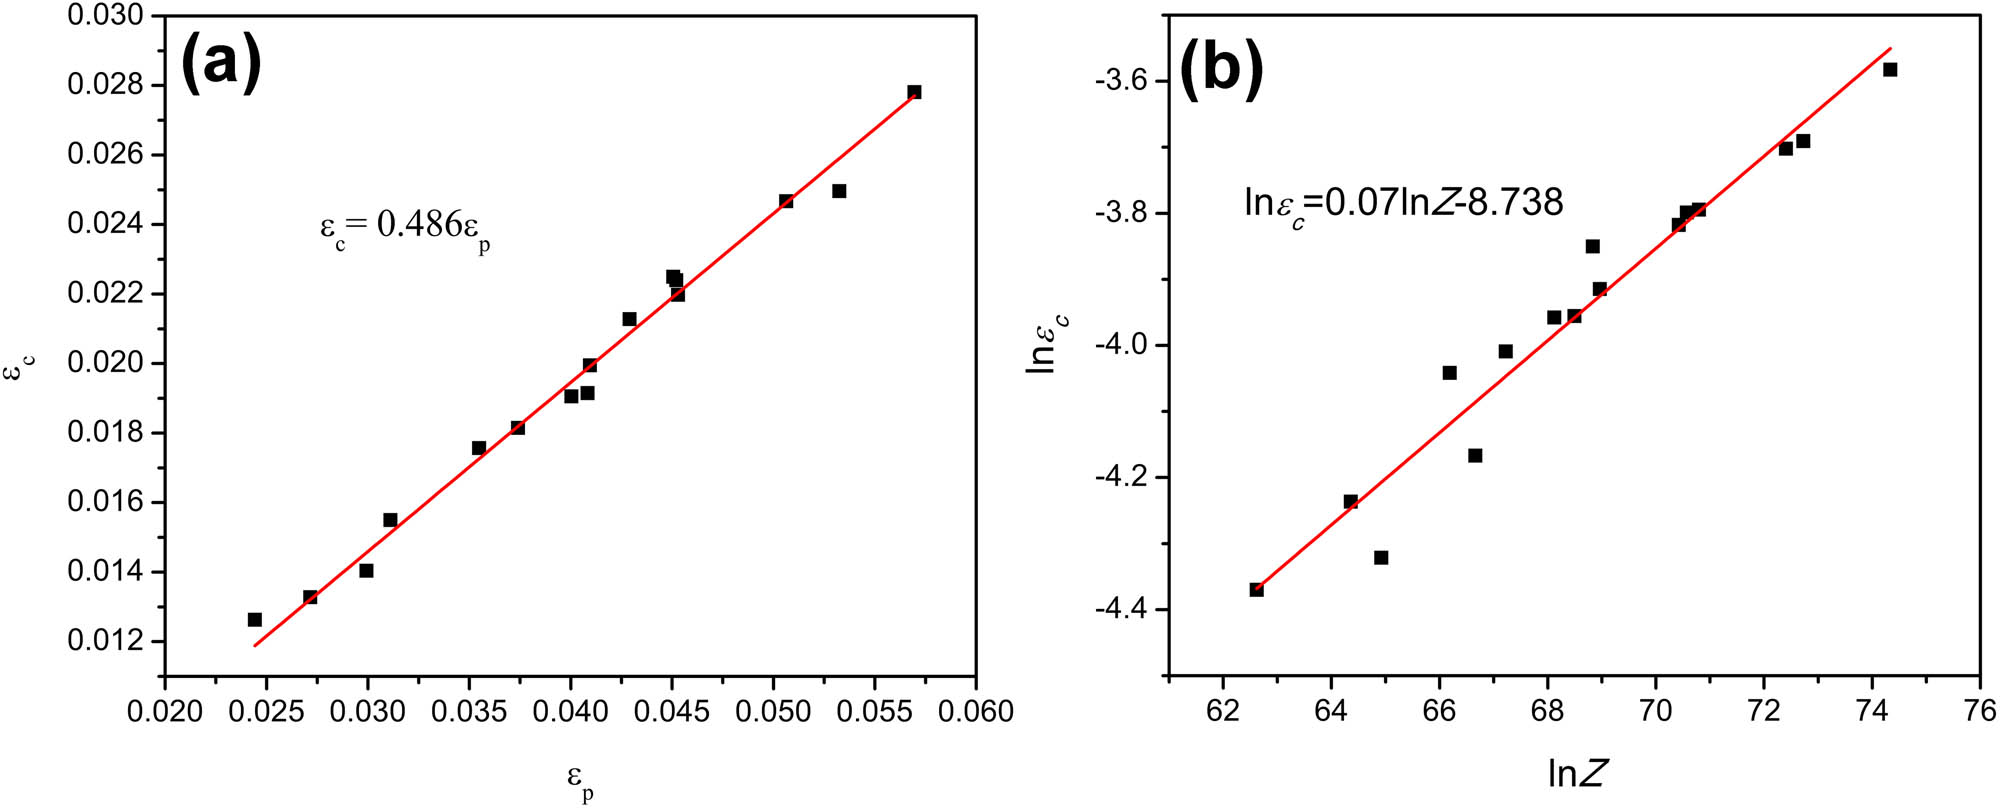
Relationship of (a)
According to the above analysis, the peak strain lags behind the critical strain, meaning that DRX occurs prior to the peak strain. The increase in Z value will lead to the increase in the critical strain, which is a disadvantage for the occurrence of DRX. Therefore, increasing the deformation temperature and reducing the strain rate will be a large favor to the microstructure uniformity and grain refinement, which will also improve the comprehensive properties of the materials.
3.4 DRX kinetic model
It can be seen from Figure 4 that DRX is the most important softening mechanism of the studied composites. Because of the important role of DRX in improving the plastic formability and performance of materials, it is an effective approach to explore the deformation mechanism of the composites by constructing DRX kinetic model. At present, the most widely used DRX dynamic model is the Johnson–Mehl–Avrami (JMA) equation [32,33].
where X
DRX is the DRX volume fraction; B and m are constants; ε is the true strain;
where σ, σ p, and σ ss are the transient stress, peak stress, and steady-state stress, respectively. Equation (14) can be expressed by taking the natural logarithms on both sides of equation (12).
According to equation (14), linear regression is performed for
![Figure 11
Relationship between
ln
[
−
ln
(
1
−
X
DRX
)
]
{\rm{ln}}{[}-{\rm{ln}}(1-{X}_{{\rm{DRX}}})]
and
ln
[
(
ε
−
ε
c
)
/
ε
p
]
{\rm{ln}}\left[(\varepsilon \left-{\varepsilon }_{{\rm{c}}})\left/{\varepsilon }_{{\rm{p}}}]
.](/document/doi/10.1515/ntrev-2022-0506/asset/graphic/j_ntrev-2022-0506_fig_011.jpg)
Relationship between
Figure 12 displays the relationship curves of X DRX and strain under various deformation conditions. It can be found that the curves are similar and present the characteristics of S-type curves. In the initial stage of deformation, X DRX grows at a relatively low rate and then increases rapidly. After reaching a certain value, X DRX tends to grow slowly. Additionally, when the strain remains constant, X DRX increases with the increase in the deformation temperatures and decrease in the strain rates.
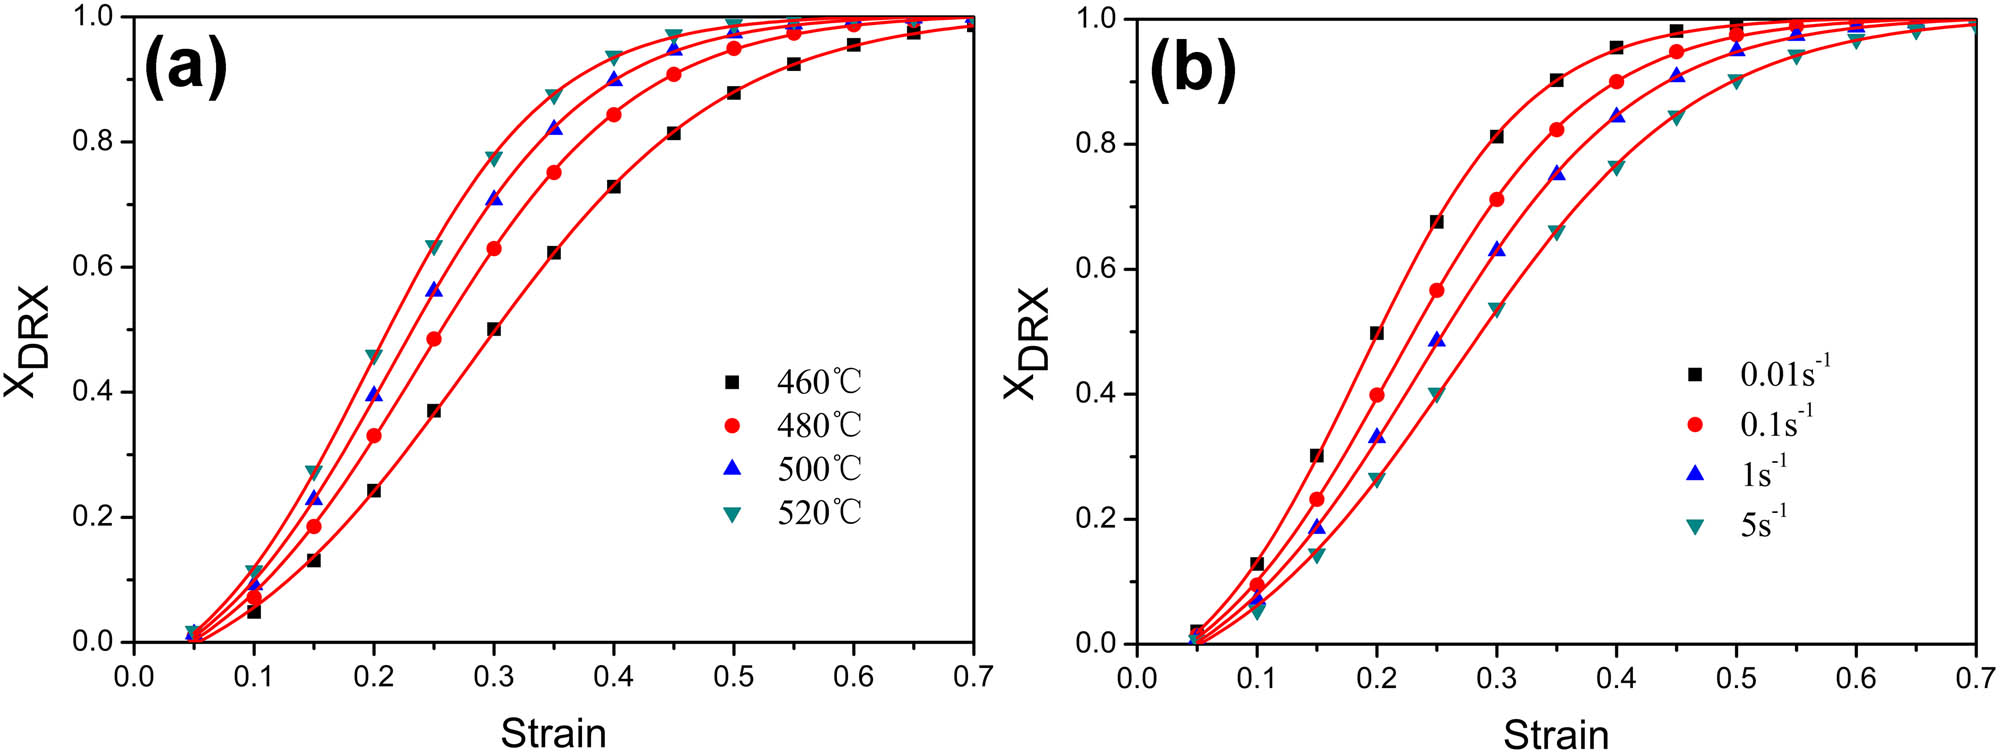
The relationship curves between X
DRX and the strain based on equation (11): (a)
To verify the accuracy of the DRX kinetic model, the experimental values measured are regressed linearly with the predicted values calculated by the model, and the fitting precision is 0.989 (Figure 13). It means that the X DRX of the composites can be well predicted by the kinetic model.
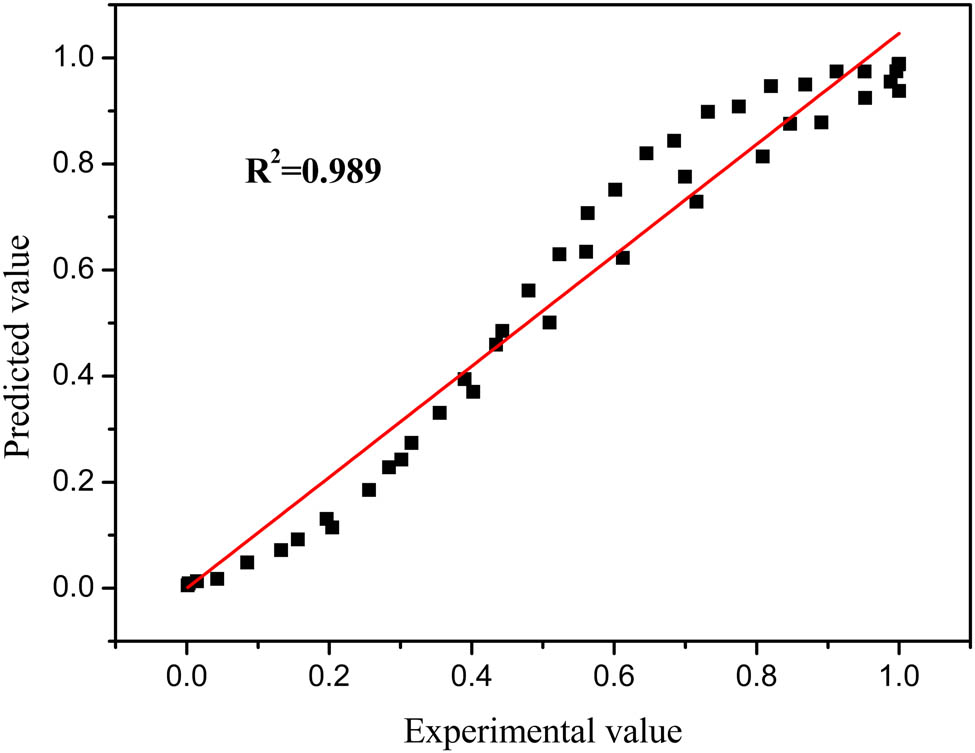
Experimental and predicted values of DRX volume fraction.
3.5 Microstructure evolution
Figure 14 displays the inverse pole figure (IPF) maps and misorientation angle distributions of the used composites at the temperature of 500°C, strain rate of 1 s−1, and strain of 0.1, 0.3, and 0.5. In the initial deformation stage, the original grain boundaries bulge and form a sawtooth shape (Figure 14a). With the increase in strain, the grain morphology of HACMs changes obviously. The initial grains are flattened or elongated, resulting in a color gradient between adjacent sub-grains in the slender grain (Figure 14b). With the further increase in strain, many fine equiaxed DRX grains are formed, and their orientation is obviously different from their adjacent grains (Figure 14c).
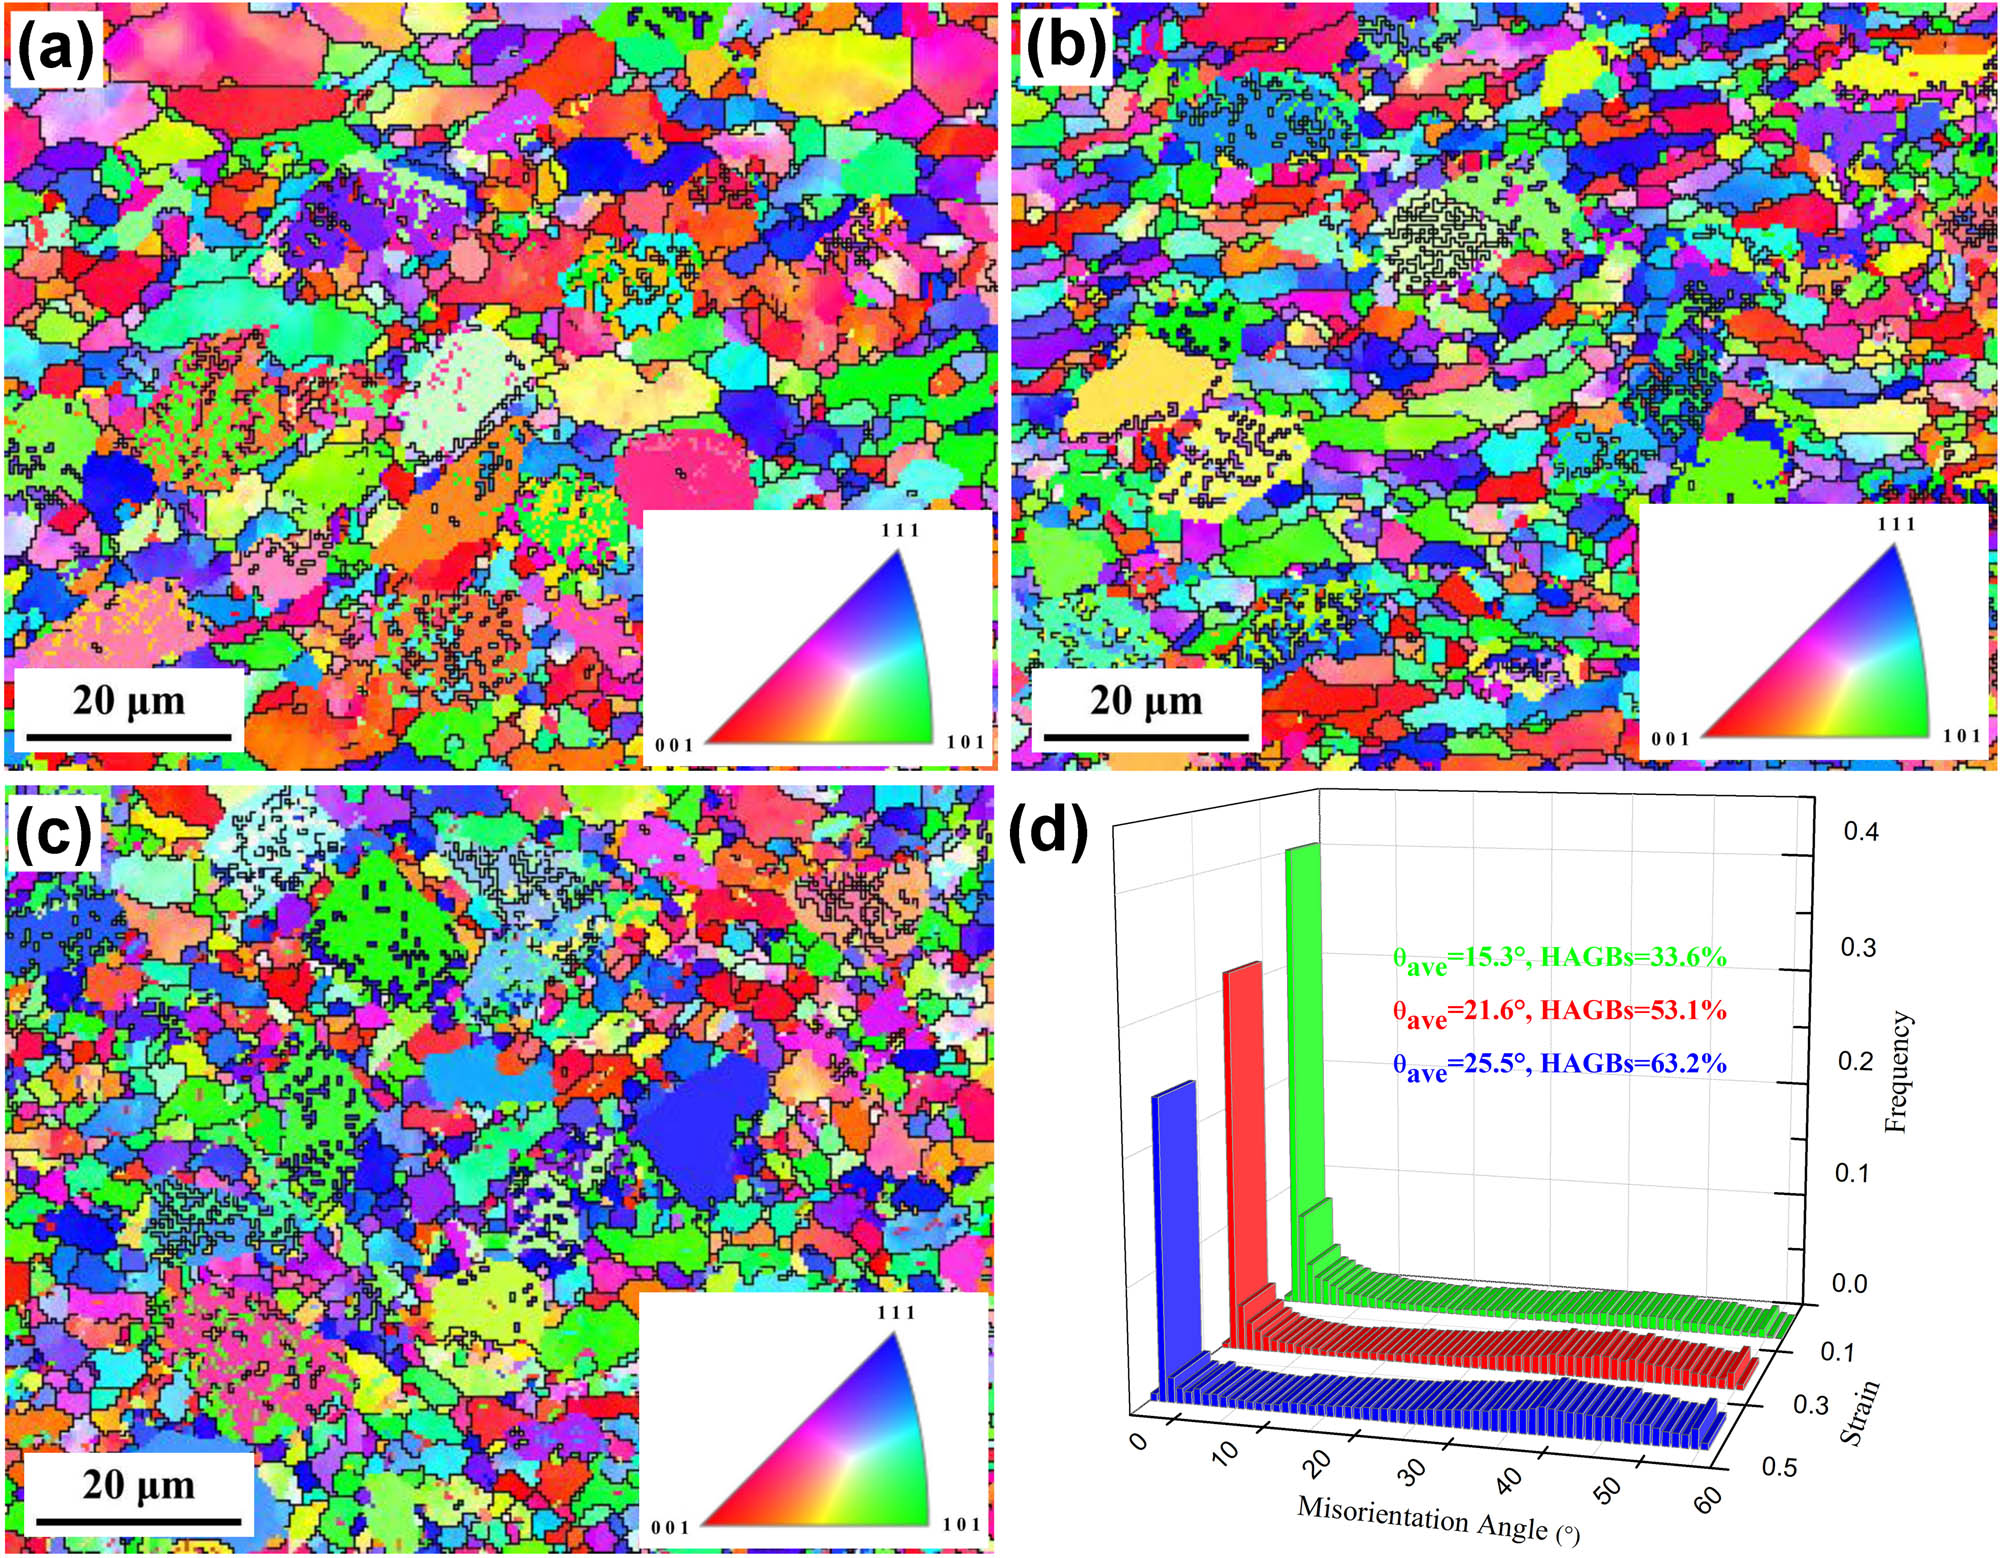
IPF maps and misorientation angle distributions of HAMCs at 500°C with a strain rate of 1 s−1 and strains of (a) 0.1, (b) 0.3, (c) 0.5, and (d) misorientation angle distributions in (a–c).
Additionally, it can be seen from misorientation angle distributions (Figure 14d), with the increase in strain, that the proportion of high-angle grain boundaries (HAGBs) is 33.6, 53.1, and 63.2%, respectively. This result illustrates that with the increase in strain, the HAGBs always increase, and the low-angle grain boundaries (LAGBs) gradually transform into HAGBs. Therefore, the increase in strain will promote the continuous migration from LAGBs to HAGBs, resulting in a higher recrystallization degree [35]. This is also consistent with the prediction trend of the DRX kinetic model.
Figure 15 shows the EBSD images of the HAMCs after hot deformation. Blue color represents recrystallized, yellow color represents substructure, and red color represents deformed in Figure 15d. It confirms that the DRX occurs during the deformation. The proportion of X DRX in Figure 15(a–c) are 13.2, 50.9, and 82.6%, respectively. The X DRX gradually increases with the strain. Although there is a certain gap between the actual detection results and the theoretical calculation value through the DRX kinetic model (Figure 12), the overall change trend is consistent, which further verifies the applicability of the DRX kinetic model.
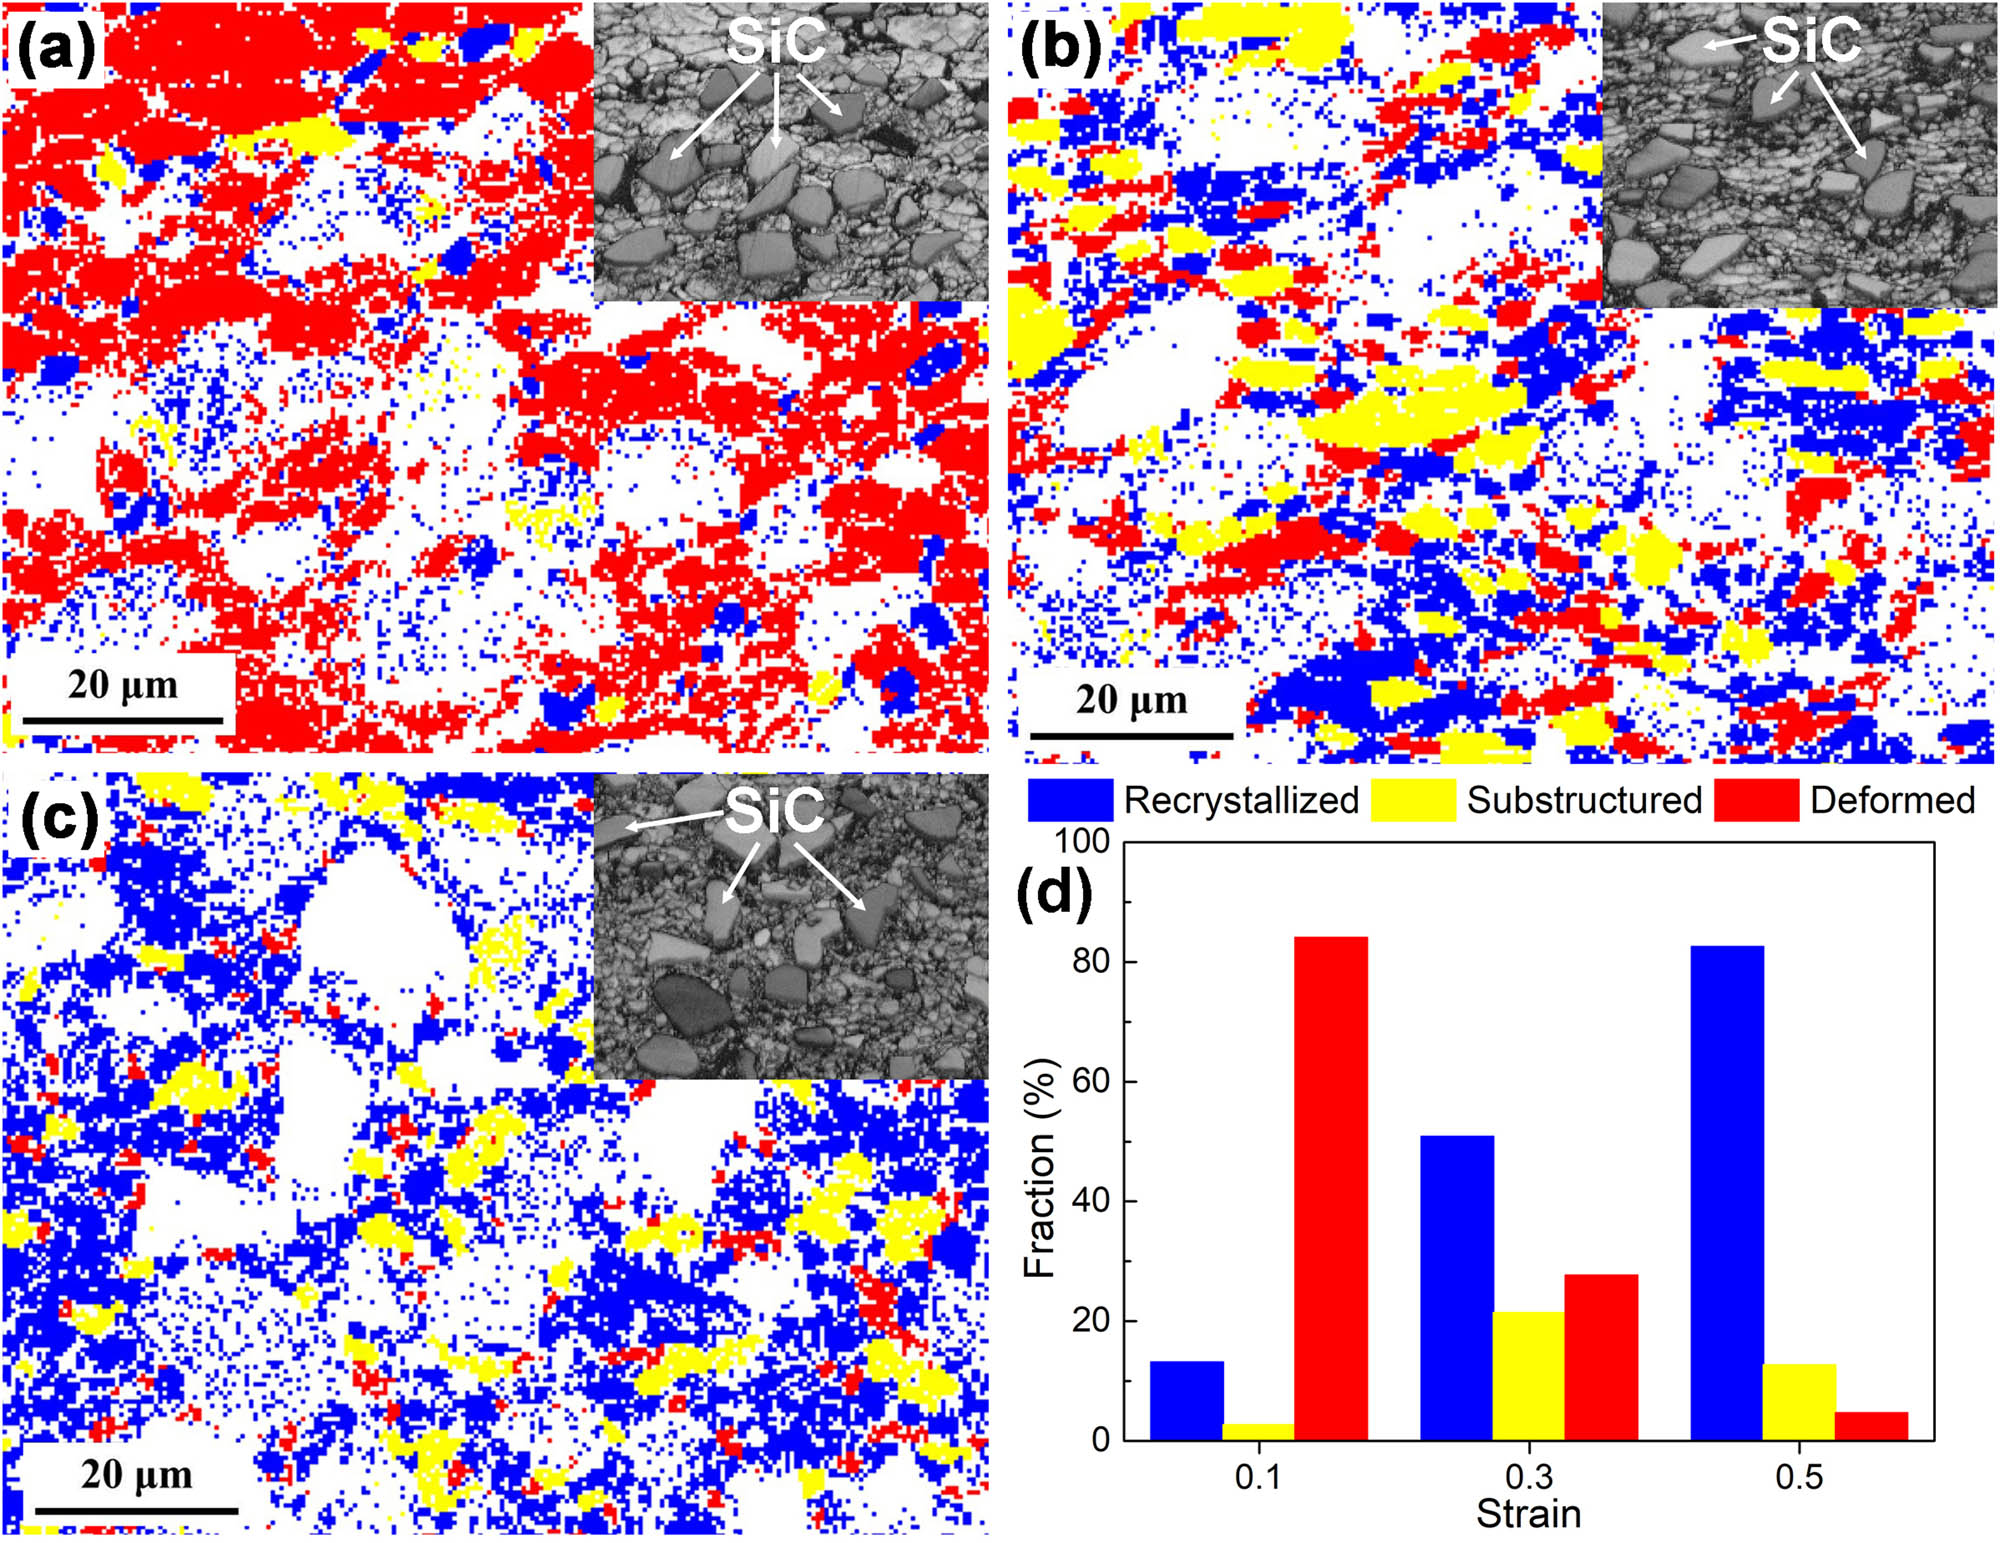
EBSD maps of HAMCs at 500°C with a strain rate of 1 s−1 and strains of (a) 0.1, (b) 0.3, (c) 0.5, and (d) fractions of three types of microstructures in (a–c).
To further explore the DRX behavior of the composites, the microstructures of different strains are investigated by TEM, as shown in Figure 16. At the beginning of hot deformation (ε = 0.1), severe dislocation accumulation occurs around the particles, owing to the deformation mismatch between the SiC particles and Al matrix. Thus, high-density dislocations can be easily found in the deformed grains (Figure 16a). At the same time, the deformed grain boundaries are uneven, and the original grain boundaries bulge as marked using the red arrow in Figure 16b. With the increase in strain (ε = 0.3), dislocations gather near grain boundaries and particles through climbing and crossing slip, and obvious sub-grain structures are formed. The sub-grain boundaries are clear and have the trend of merging and combination-grow up (Figure 16c). With the further increase in strain (ε = 0.5), the sub-grain boundaries gradually transform into grain boundaries with the clear and sharp large angles through merging and rotation. Finally, the new recrystallized grains occur, and the dislocations inside the grain basically disappear (Figure 16d). According to the results of these microstructural observations, the primary softening mechanism of the HACMs is DRX during hot deformation obviously [36,37,38]. However, there is a difference about the softening mechanism of the HACMs reported in ref. [39]. Their results indicate that the dominant softening mechanism of Al–Si/(SiCp + TiB2) HAMCs is DRV, accompanied by partial DRX. This may be related to the thermal deformation parameters and the content of reinforcing particles.
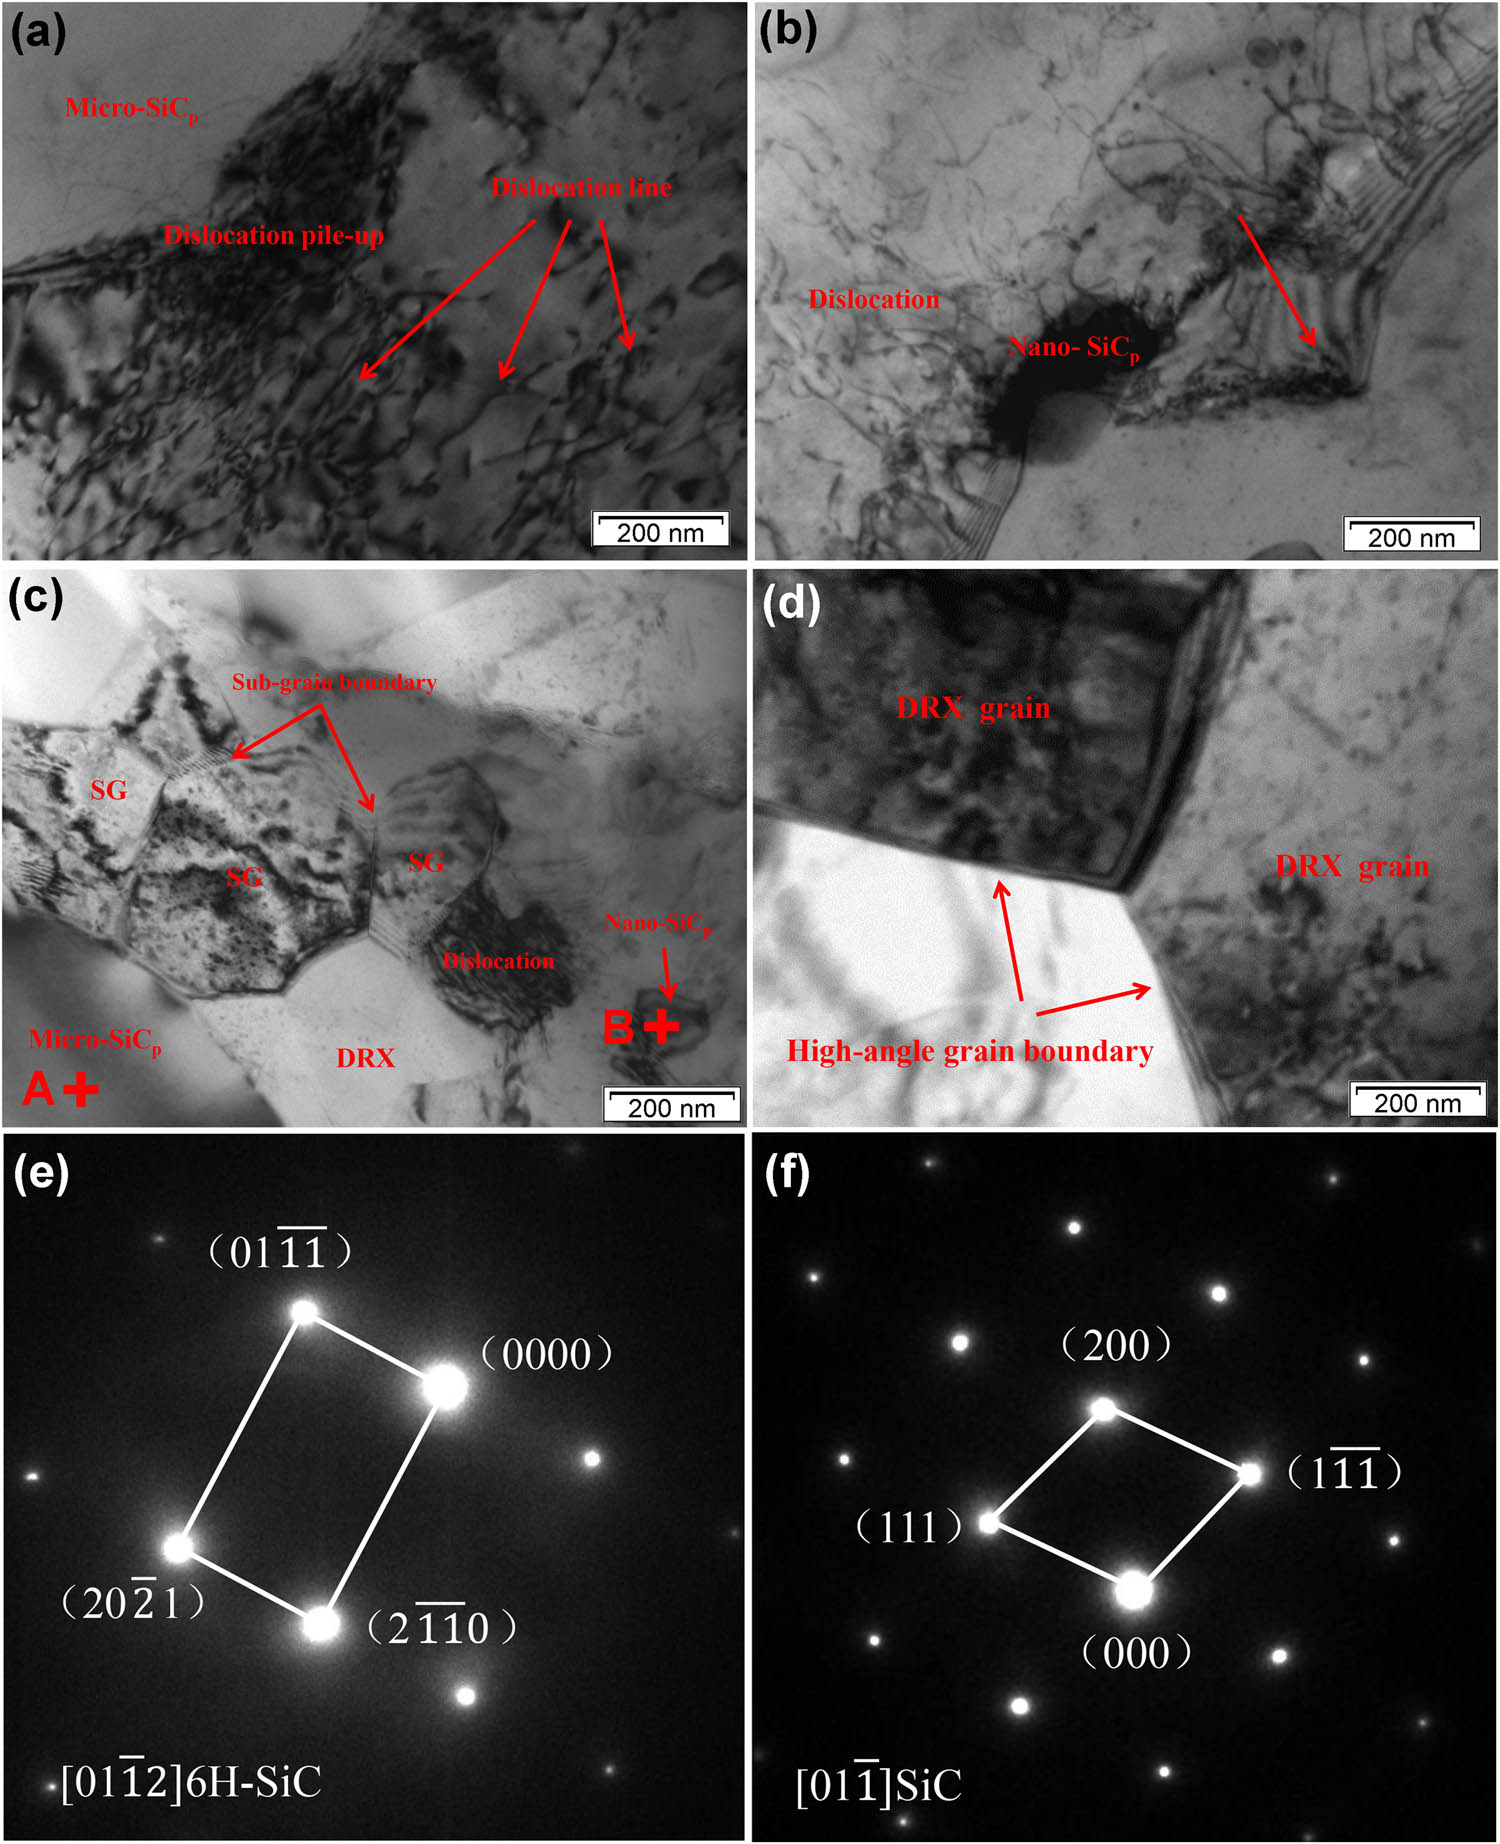
TEM microstructures of the HAMCs at different strains (T = 500°C,
According to the above observation and analysis, Figure 17 depicts the microstructure evolution mechanism of the composites in the DRX process. In the initial stage of hot deformation, high density and orientation gradient deformation zones appear near the micro-SiCp due to deformation mismatch between the Al matrix and these particles. Besides, dense dislocations can also be found around the nano-SiCp owing to the pinning effect of these particles [40,41]. So many dislocations will occur around these micro-SiCp and nano-SiCp particles. At the same time, the original grain boundaries bulge because of the strain (Figure 17b). When the dislocation accumulation and proliferation in the material reach a certain degree, DRX will preferentially nucleate around grain boundaries and reinforcing particles as the strain increases (Figure 17c). With the further increase in strain, the misorientation angle of new DRX grains gradually increases due to the accumulation and reorganization of dislocations. Then, the LAGBs can be transformed into the HAGBs. Finally, uniform and fine equiaxed grains are formed due to the pinning impact of nano-SiCp (Figure 17d). In conclusion, the DRX mechanism of the studied composites mainly consists of grain boundary bulging mechanism, PSN mechanism, and sub-grain rotation induced nucleation mechanism. With the increase in strain, the DRX characteristics of sub-grain rotation and combination-grow up were further revealed [42,43].
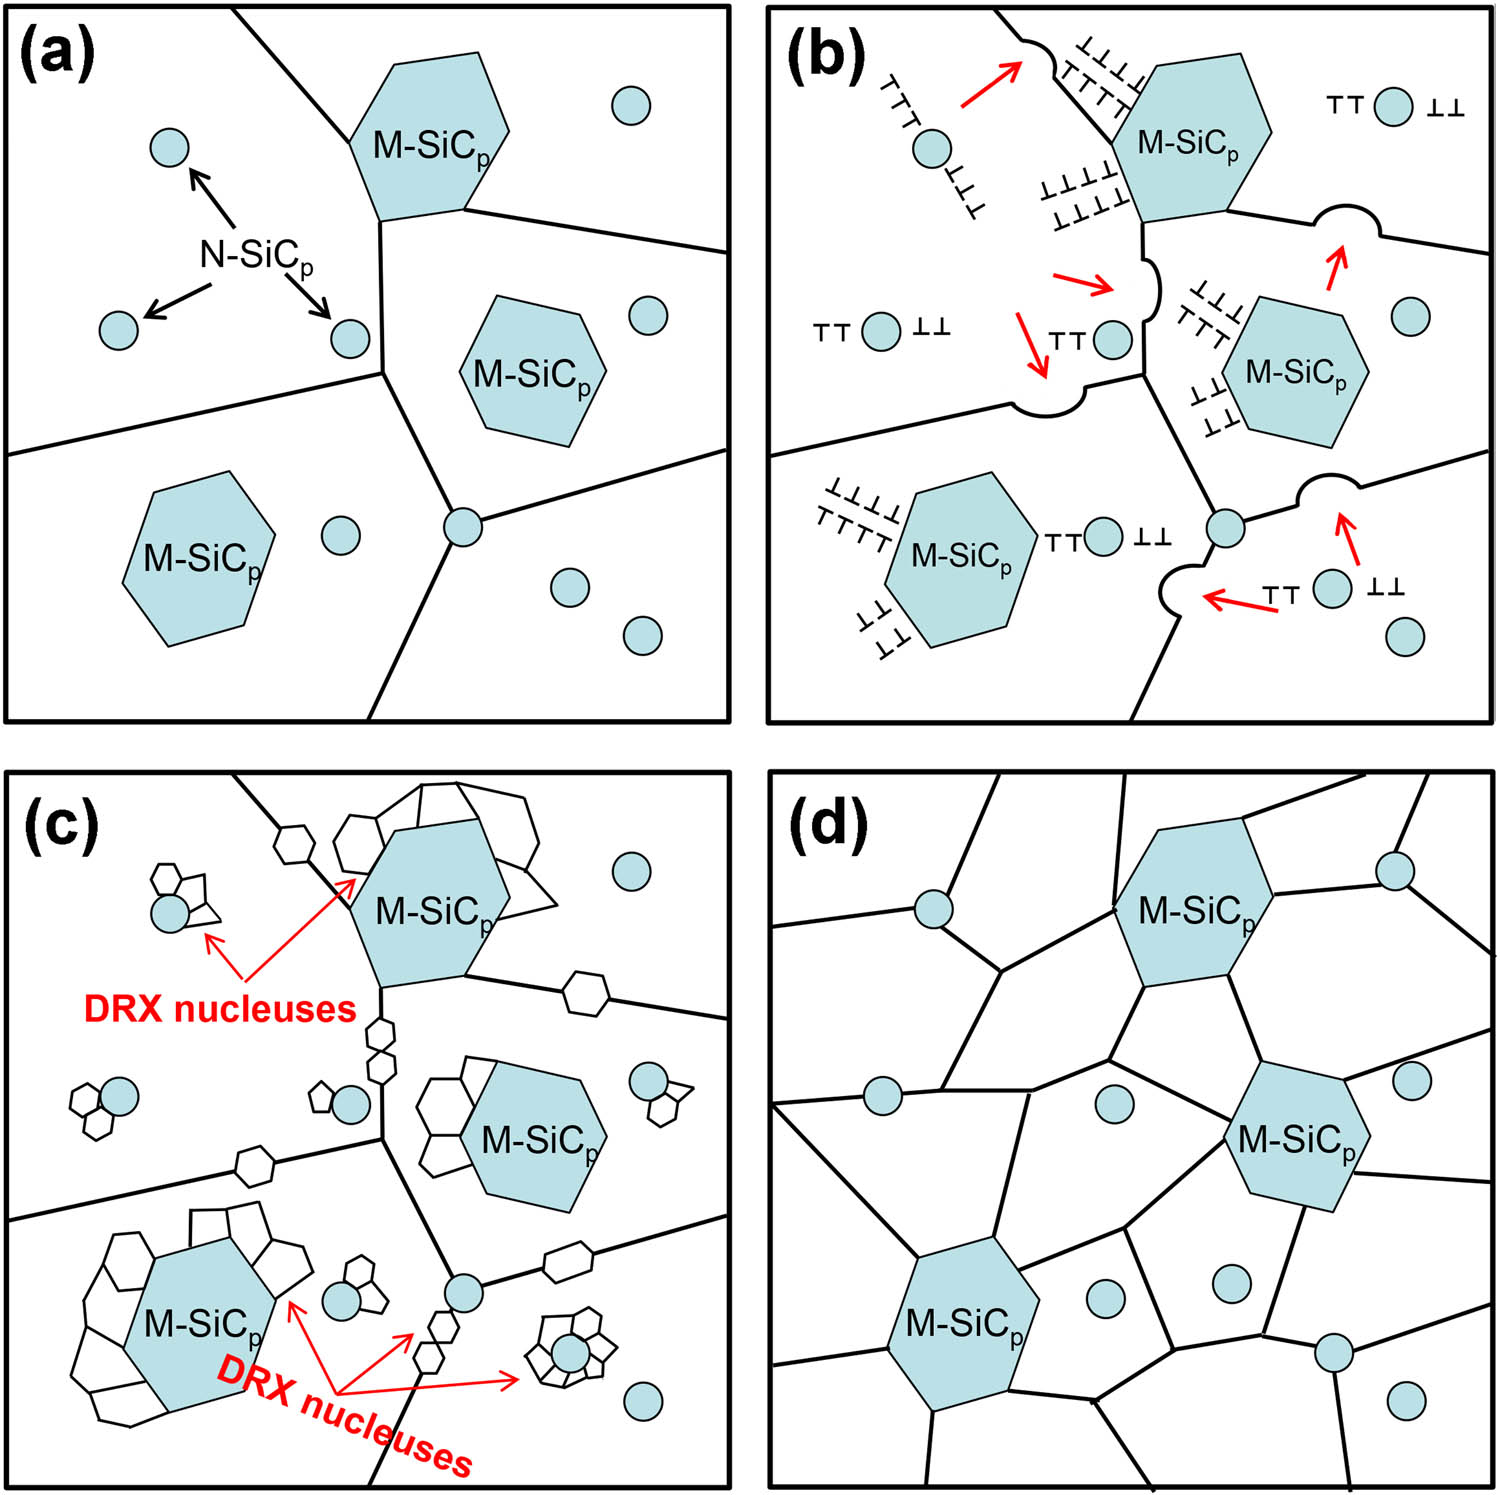
Schematic illustration of microstructure evolution mechanism of the used composites during hot deformation: (a) initial microstructure; (b) dislocations pile-up around reinforced particles and grain boundary bulging; (c) DRX nucleuses around grain boundaries and reinforcing particles; and (d) microstructure after deformation.
Furthermore, it indicates that both micro-SiCp and nano-SiCp can facilitate the DRX nucleation of the aluminum matrix in the PSN mechanism. The existence of micro-SiCp plays a primary role in stimulating the DRX nucleation by forming the particle deformation zone (PDZ) [16]. However, PDZ by nano-SiCp is relatively small, which has a minor impact on DRX nucleation. The addition of nano-SiCp increases the dislocation density in the Al matrix continuously, resulting in the dislocations pile-up, thereby stimulating DRX nucleation. Thus, the dual-scale particles both play a role in promoting DRX nucleation of the HACMs. Meanwhile, the pinning effect of nanoparticles on grain boundaries leads to grain refinement. Similar behavior has been reported in SiCp reinforced Mg matrix composites [44].
4 Conclusion
The hot compression tests of dual-scale SiCp/A356 matrix composites were performed under different deformation conditions. DRX behavior and mechanisms were carefully investigated. The main conclusions are summarized as follows:
The stress–strain curves show typical DRX characteristics with single peak stress. The comprehensive influences of the strain rate and deformation temperature on the stress are investigated using the Z parameter, in which the deformation activation energy is 443.204 kJ/mol.
The critical strain causing DRX is obtained by the inflection of
Based on the stress–strain curve data, the DRX kinetic model of composites can be constructed by the classical Avrami equation as follows:
The dominant softening mechanism of dual-scale SiCp/A356 composites during the hot deformation is the DRX mechanism, which includes grain boundaries bulging mechanism, particle stimulated nucleation mechanism, and sub-grain rotation induced nucleation mechanism. Both micro-SiCp and nano-SiCp can stimulate the DRX nucleation of the Al matrix because of the PSN mechanism.
-
Funding information: The authors acknowledge the financial support from the National Natural Science Foundation of China (Grant No. 52171138).
-
Author contributions: Yahu Song: methodology, investigation, and writing – original draft. Aiqin Wang: supervision and writing – review and editing. Douqin Ma: writing – review and editing. Jingpei Xie: writing – review and editing. Wenyan Wang: writing –review and editing. All authors have accepted responsibility for the entire content of this manuscript and approved its submission.
-
Conflict of interest: The authors state no conflict of interest.
-
Data availability statement: The raw/processed data required to reproduce these findings cannot be shared at this time as the data also form part of an ongoing study.
References
[1] Wu C, Gao T, Liu X. In situ SiC reinforced Si-SiC 3D skeletons in SiC/Al–Si composites. J Alloy Compd. 2019;810:151730.10.1016/j.jallcom.2019.151730Search in Google Scholar
[2] Yuan D, Yang X, Wu S, Lü S, Hu K. Development of high strength and toughness nano-SiCp/A356 composites with ultrasonic vibration and squeeze casting. J Mater Process Tech. 2019;269:1–9.10.1016/j.jmatprotec.2019.01.021Search in Google Scholar
[3] Lakshmikanthan A, Bontha S, Krishna M, Koppad PG, Ramprabhu T. Microstructure, mechanical and wear properties of the A357 composites reinforced with dual-sized SiC particles. J Alloy Compd. 2019;786:570–80.10.1016/j.jallcom.2019.01.382Search in Google Scholar
[4] Chen HS, Wang WX, Nie HH, Zhou J, Li YL, Liu RF, et al. Microstructure evolution and mechanical properties of B4C/6061Al neutron absorber composite sheets fabricated by powder metallurgy. J Alloy Compd. 2018;730:342–51.10.1016/j.jallcom.2017.09.312Search in Google Scholar
[5] Steinman AE, Corthay S, Firestein KL, Kvashnin DG, Kovalskii AM, Matveev AT, et al. Al-based composites reinforced with AlB2, AlN and BN phases: Experimental and theoretical studies. Mater Des. 2018;141:88–98.10.1016/j.matdes.2017.12.022Search in Google Scholar
[6] Mousavian RT, Behnamfard S, Khosroshahi RA, Zavašnik J, Ghosh P, Krishnamurthy S, et al. Strength-ductility trade-off via SiC nanoparticle dispersion in A356 aluminium matrix. Mater Sci Eng A. 2020;771:138639.10.1016/j.msea.2019.138639Search in Google Scholar
[7] Dong X, Wang A, Xie J, Wang Z. Optimization of volume fraction and microstructure evolution during thermal deformation of nano-SiCp/Al-7Si composites. Nanotechnol Rev. 2021;10:1306–17.10.1515/ntrev-2021-0088Search in Google Scholar
[8] Zhang LJ, Qiu F, Wang JG, Wang HY, Jiang QC. Microstructures and mechanical properties of the Al2014 composites reinforced with bimodal sized SiC particles. Mater Sci Eng A. 2015;637:70–4.10.1016/j.msea.2015.04.012Search in Google Scholar
[9] Tian WS, Zhao QL, Geng R, Qiu F, Jiang QC. Improved creep resistance of Al–Cu alloy matrix composite reinforced with bimodal-sized TiCp. Mater Sci Eng A. 2018;713:190–4.10.1016/j.msea.2017.12.071Search in Google Scholar
[10] Tan A, Teng J, Zeng X, Fu D, Zhang H. Fabrication of aluminium matrix hybrid composites reinforced with SiC microparticles and TiB2 nanoparticles by powder metallurgy. Powder Metall. 2017;60(1):66–72.10.1080/00325899.2016.1274816Search in Google Scholar
[11] Jahedi M, Mani B, Shakoorian S, Pourkhorshid E, Hossein Paydar M. Deformation rate effect on the microstructure and mechanical properties of Al–SiCp composites consolidated by hot extrusion. Mater Sci Eng A. 2012;556:23–30.10.1016/j.msea.2012.06.054Search in Google Scholar
[12] Srivastava VC, Jindal V, Uhlenwinkel V, Bauckhage K. Hot-deformation behavior spray-formed 2014 Al + SiCp metal matrix composites. Mater Sci Eng A. 2008;477:86–95.10.1016/j.msea.2007.06.086Search in Google Scholar
[13] Zhang P, Li F. Dynamic recrystallization model of SiC particle reinforced aluminum matrix composites. Rare Met Mater Eng. 2010;39(7):1166–70.Search in Google Scholar
[14] Sun Y, Xie J, Hao S, Wang A, Liu P, Li M. Dynamic recrystallization model of 30% SiCp/Al composite. J Alloy Compd. 2015;649:865–71.10.1016/j.jallcom.2015.04.111Search in Google Scholar
[15] Doherty RD, Hughes, DA, Humphreys, FJ, Hughes DA, Humphreys FJ, Jonas JJ, Jensen D, Kassner ME, et al. Current issues in recrystallization: a review. Mater Sci Eng A. 1997;238:219–74.10.1016/S0921-5093(97)00424-3Search in Google Scholar
[16] Humphreys FJ. The nucleation of recrystallization at second phase particles in deformed aluminium. Acta Metall. 1977;25(11):1323–44.10.1016/0001-6160(77)90109-2Search in Google Scholar
[17] Chan HM, Humphreys FJ.The recrystallization of Aluminum-Silicon alloys containing a bimodal particle distribution. Acta Mater. 1984;32:235–43.10.1016/0001-6160(84)90052-XSearch in Google Scholar
[18] Wu Y, Yu Y, Zhang Q, Zhu T, Zhai R, Zhao X. Hot deformation behavior and processing map of in situ nano ZrB2 reinforced AA6111 matrix composites. Mater Res Exp. 2019;6(2):026528.10.1088/2053-1591/aaed02Search in Google Scholar
[19] Kai X, Zhao Y, Wang A, Wang C, Mao Z. Hot deformation behavior of in situ nano ZrB2 reinforced 2024Al matrix composite. Compos Sci Technol. 2015;116:1–8.10.1016/j.compscitech.2015.05.006Search in Google Scholar
[20] Radi Y, Mahmudi R. Effect of Al2O3 nano-particles on the microstructural stability of AZ31 Mg alloy after equal channel angular pressing. Mater Sci Eng A. 2010;527:2764–71.10.1016/j.msea.2010.01.029Search in Google Scholar
[21] Wei H, Liu G, Xiao X, Zhang M. Dynamic recrystallization behavior of a medium carbon vanadium microalloyed steel. Mater Sci Eng A. 2013;573:215–21.10.1016/j.msea.2013.03.009Search in Google Scholar
[22] Mcqueen HJ, Myshlyaev M, Konopleva E. High temperature mechanical and microstructural behavior of A356/15 vol% SiCp and A356 alloy. Can Metall Quart. 2013;37(2):125–39.10.1179/cmq.1998.37.2.125Search in Google Scholar
[23] Wang Z, Wang A, Xie J, Liu P. Hot deformation behavior and strain-compensated constitutive equation of nano-sized SiC particle-reinforced Al–Si matrix composites. Materials. 2020;13(8):1812.10.3390/ma13081812Search in Google Scholar PubMed PubMed Central
[24] Zener C, Hollomon JH. Effect of strain rate upon plastic flow of steel. J Appl Phys. 1944;15(1):22–32.10.1063/1.1707363Search in Google Scholar
[25] Wang Y, Ling DL, Law CC. A correlation between tensile flow stress and Zener-Hollomon factor in TiAl alloys at high temperatures. J Mater Sci Lett. 2000;19(13):1185–8.10.1023/A:1006723629430Search in Google Scholar
[26] Sellars CM, Mc WJ, Tegart G. Hot workability. Int Metall Rev. 1972;17:1–24.10.1179/095066072790137765Search in Google Scholar
[27] Li B, Chu ZJ, Du Y, Zhou W, Zhou X. Hot deformation behavior and dynamic recrystallization kinetics of a novel Sc and Zr modified ultra-high-strength Al-Zn-Mg-Cu alloy. J Mater Eng Perform. 2020;29(12):7774–84.10.1007/s11665-020-05255-1Search in Google Scholar
[28] Zhang H, Chen G, Chen Q, Han F, Zhao Z. A physically-based constitutive modelling of a high strength aluminum alloy at hot working conditions. J Alloy Compd. 2018;743:283–93.10.1016/j.jallcom.2018.02.039Search in Google Scholar
[29] Zambrano OA, Logé RE. Dynamic recrystallization study of a Fe-Mn-Si based shape memory alloy in constant and variable thermo mechanical conditions. Mater Charact. 2019;152:151–61.10.1016/j.matchar.2019.04.016Search in Google Scholar
[30] Poliak EI, Jonas JJ. A one-parameter approach to determining the critical conditions for the initiation of dynamic recrystallization. Acta Mater. 1996;44(1):127–36.10.1016/1359-6454(95)00146-7Search in Google Scholar
[31] Rouzegar R, Azadbeh M, Danninger H. High-temperature flow behaviour modelling of stress-strain curves of the sintered Cu-28Zn pre-alloyed powder compacts considering dynamic recrystallisation. Powder Metall. 2017;61(2):1–7.10.1080/00325899.2017.1377383Search in Google Scholar
[32] Jonas JJ, Quelennec X, Jiang L, Martin É. The Avrami kinetics of dynamic recrystallization. Acta Mater. 2009;57:2748–56.10.1016/j.actamat.2009.02.033Search in Google Scholar
[33] Wen DX, Lin YC, Zhou Y. A new dynamic recrystallization kinetics model for a Nb containing Ni-Fe-Cr-base super alloy considering influences of initial δ phase. Vacuum. 2017;141:316–27.10.1016/j.vacuum.2017.04.030Search in Google Scholar
[34] Chen MS, Yuan WQ, Lin YC, Li HB, Zou ZH. Modeling and simulation of dynamic recrystallization behavior for 42CrMo steel by an extended cellular automaton method. Vacuum. 2017;146:142–51.10.1016/j.vacuum.2017.09.041Search in Google Scholar
[35] Lin YC, Wu XY, Chen XM, Chen J, Wen DX, Zhang JL, et al. EBSD study of a hot deformed nickel-based super alloy. J Alloy Compd. 2015;640:101–13.10.1016/j.jallcom.2015.04.008Search in Google Scholar
[36] Wang Y, Zhao G, Xu X, Chen X, Zhang C. Constitutive modeling, processing map establishment and microstructure analysis of spray deposited Al–Cu–Li alloy 2195. J Alloy Compd. 2019;779:735–51.10.1016/j.jallcom.2018.11.289Search in Google Scholar
[37] Sun ZC, Wu HL, Cao J, Yin ZK. Modeling of continuous dynamic recrystallization of Al-Zn-Cu-Mg alloy during hot deformation based on the internal-state-variable (ISV) method. Int J Plast. 2018;106:73–87.10.1016/j.ijplas.2018.03.002Search in Google Scholar
[38] Luo L, Liu Z, Bai S, Zhao J, Zeng D, Wang J, et al. Hot deformation behavior considering strain effects and recrystallization mechanism of an Al-Zn-Mg-Cu alloy. Materials. 2020;13(7):1743.10.3390/ma13071743Search in Google Scholar PubMed PubMed Central
[39] Chen X, Fu D, Teng J, Zhang H. Hot deformation behavior and mechanism of hybrid aluminum-matrix composites reinforced with micro-SiC and nano-TiB2. J Alloy Compd. 2018;753:566–75.10.1016/j.jallcom.2018.04.223Search in Google Scholar
[40] Robson JD, Henry DT, Davis B. Particle effects on recrystallization in magnesium-manganese alloys: Particle-stimulated nucleation. Acta Mater. 2009;57(9):2739–47.10.1016/j.actamat.2009.02.032Search in Google Scholar
[41] Deng K, Shi J, Wang C, Wang X, Wu Y, Nie K, et al. Microstructure and strengthening mechanism of bimodal size particle reinforced magnesium matrix composite. Compos Part A. 2012;43(8):1280–4.10.1016/j.compositesa.2012.03.007Search in Google Scholar
[42] Sun ZC, Zheng LS, Yang H. Softening mechanism and microstructure evolution of as-extruded 7075 aluminum alloy during hot deformation. Mater Charact. 2014;90:71–80.10.1016/j.matchar.2014.01.019Search in Google Scholar
[43] Chen K, Tang J, Jiang F, Teng J, Fu D, Zhang H. The role of various Zr additions in static softening behavior of Al-Zn-Mg-Cu alloys during interval holding of double-stage hot deformation. J Alloy Compd. 2019;792:1112–21.10.1016/j.jallcom.2019.04.090Search in Google Scholar
[44] Wang CJ, Deng KK, Zhou SS, Liang W. Dynamic recrystallization behavior of bimodal size SiCp reinforced Mg matrix composite during hot deformation. Acta Metall Sin (Engl Lett). 2016;29(6):527–37.10.1007/s40195-016-0415-0Search in Google Scholar
© 2023 the author(s), published by De Gruyter
This work is licensed under the Creative Commons Attribution 4.0 International License.
Articles in the same Issue
- Research Articles
- Preparation of CdS–Ag2S nanocomposites by ultrasound-assisted UV photolysis treatment and its visible light photocatalysis activity
- Significance of nanoparticle radius and inter-particle spacing toward the radiative water-based alumina nanofluid flow over a rotating disk
- Aptamer-based detection of serotonin based on the rapid in situ synthesis of colorimetric gold nanoparticles
- Investigation of the nucleation and growth behavior of Ti2AlC and Ti3AlC nano-precipitates in TiAl alloys
- Dynamic recrystallization behavior and nucleation mechanism of dual-scale SiCp/A356 composites processed by P/M method
- High mechanical performance of 3-aminopropyl triethoxy silane/epoxy cured in a sandwich construction of 3D carbon felts foam and woven basalt fibers
- Applying solution of spray polyurea elastomer in asphalt binder: Feasibility analysis and DSR study based on the MSCR and LAS tests
- Study on the chronic toxicity and carcinogenicity of iron-based bioabsorbable stents
- Influence of microalloying with B on the microstructure and properties of brazed joints with Ag–Cu–Zn–Sn filler metal
- Thermohydraulic performance of thermal system integrated with twisted turbulator inserts using ternary hybrid nanofluids
- Study of mechanical properties of epoxy/graphene and epoxy/halloysite nanocomposites
- Effects of CaO addition on the CuW composite containing micro- and nano-sized tungsten particles synthesized via aluminothermic coupling with silicothermic reduction
- Cu and Al2O3-based hybrid nanofluid flow through a porous cavity
- Design of functional vancomycin-embedded bio-derived extracellular matrix hydrogels for repairing infectious bone defects
- Study on nanocrystalline coating prepared by electro-spraying 316L metal wire and its corrosion performance
- Axial compression performance of CFST columns reinforced by ultra-high-performance nano-concrete under long-term loading
- Tungsten trioxide nanocomposite for conventional soliton and noise-like pulse generation in anomalous dispersion laser cavity
- Microstructure and electrical contact behavior of the nano-yttria-modified Cu-Al2O3/30Mo/3SiC composite
- Melting rheology in thermally stratified graphene-mineral oil reservoir (third-grade nanofluid) with slip condition
- Re-examination of nonlinear vibration and nonlinear bending of porous sandwich cylindrical panels reinforced by graphene platelets
- Parametric simulation of hybrid nanofluid flow consisting of cobalt ferrite nanoparticles with second-order slip and variable viscosity over an extending surface
- Chitosan-capped silver nanoparticles with potent and selective intrinsic activity against the breast cancer cells
- Multi-core/shell SiO2@Al2O3 nanostructures deposited on Ti3AlC2 to enhance high-temperature stability and microwave absorption properties
- Solution-processed Bi2S3/BiVO4/TiO2 ternary heterojunction photoanode with enhanced photoelectrochemical performance
- Electroporation effect of ZnO nanoarrays under low voltage for water disinfection
- NIR-II window absorbing graphene oxide-coated gold nanorods and graphene quantum dot-coupled gold nanorods for photothermal cancer therapy
- Nonlinear three-dimensional stability characteristics of geometrically imperfect nanoshells under axial compression and surface residual stress
- Investigation of different nanoparticles properties on the thermal conductivity and viscosity of nanofluids by molecular dynamics simulation
- Optimized Cu2O-{100} facet for generation of different reactive oxidative species via peroxymonosulfate activation at specific pH values to efficient acetaminophen removal
- Brownian and thermal diffusivity impact due to the Maxwell nanofluid (graphene/engine oil) flow with motile microorganisms and Joule heating
- Appraising the dielectric properties and the effectiveness of electromagnetic shielding of graphene reinforced silicone rubber nanocomposite
- Synthesis of Ag and Cu nanoparticles by plasma discharge in inorganic salt solutions
- Low-cost and large-scale preparation of ultrafine TiO2@C hybrids for high-performance degradation of methyl orange and formaldehyde under visible light
- Utilization of waste glass with natural pozzolan in the production of self-glazed glass-ceramic materials
- Mechanical performance of date palm fiber-reinforced concrete modified with nano-activated carbon
- Melting point of dried gold nanoparticles prepared with ultrasonic spray pyrolysis and lyophilisation
- Graphene nanofibers: A modern approach towards tailored gypsum composites
- Role of localized magnetic field in vortex generation in tri-hybrid nanofluid flow: A numerical approach
- Intelligent computing for the double-diffusive peristaltic rheology of magneto couple stress nanomaterials
- Bioconvection transport of upper convected Maxwell nanoliquid with gyrotactic microorganism, nonlinear thermal radiation, and chemical reaction
- 3D printing of porous Ti6Al4V bone tissue engineering scaffold and surface anodization preparation of nanotubes to enhance its biological property
- Bioinspired ferromagnetic CoFe2O4 nanoparticles: Potential pharmaceutical and medical applications
- Significance of gyrotactic microorganisms on the MHD tangent hyperbolic nanofluid flow across an elastic slender surface: Numerical analysis
- Performance of polycarboxylate superplasticisers in seawater-blended cement: Effect from chemical structure and nano modification
- Entropy minimization of GO–Ag/KO cross-hybrid nanofluid over a convectively heated surface
- Oxygen plasma assisted room temperature bonding for manufacturing SU-8 polymer micro/nanoscale nozzle
- Performance and mechanism of CO2 reduction by DBD-coupled mesoporous SiO2
- Polyarylene ether nitrile dielectric films modified by HNTs@PDA hybrids for high-temperature resistant organic electronics field
- Exploration of generalized two-phase free convection magnetohydrodynamic flow of dusty tetra-hybrid Casson nanofluid between parallel microplates
- Hygrothermal bending analysis of sandwich nanoplates with FG porous core and piezomagnetic faces via nonlocal strain gradient theory
- Design and optimization of a TiO2/RGO-supported epoxy multilayer microwave absorber by the modified local best particle swarm optimization algorithm
- Mechanical properties and frost resistance of recycled brick aggregate concrete modified by nano-SiO2
- Self-template synthesis of hollow flower-like NiCo2O4 nanoparticles as an efficient bifunctional catalyst for oxygen reduction and oxygen evolution in alkaline media
- High-performance wearable flexible strain sensors based on an AgNWs/rGO/TPU electrospun nanofiber film for monitoring human activities
- High-performance lithium–selenium batteries enabled by nitrogen-doped porous carbon from peanut meal
- Investigating effects of Lorentz forces and convective heating on ternary hybrid nanofluid flow over a curved surface using homotopy analysis method
- Exploring the potential of biogenic magnesium oxide nanoparticles for cytotoxicity: In vitro and in silico studies on HCT116 and HT29 cells and DPPH radical scavenging
- Enhanced visible-light-driven photocatalytic degradation of azo dyes by heteroatom-doped nickel tungstate nanoparticles
- A facile method to synthesize nZVI-doped polypyrrole-based carbon nanotube for Ag(i) removal
- Improved osseointegration of dental titanium implants by TiO2 nanotube arrays with self-assembled recombinant IGF-1 in type 2 diabetes mellitus rat model
- Functionalized SWCNTs@Ag–TiO2 nanocomposites induce ROS-mediated apoptosis and autophagy in liver cancer cells
- Triboelectric nanogenerator based on a water droplet spring with a concave spherical surface for harvesting wave energy and detecting pressure
- A mathematical approach for modeling the blood flow containing nanoparticles by employing the Buongiorno’s model
- Molecular dynamics study on dynamic interlayer friction of graphene and its strain effect
- Induction of apoptosis and autophagy via regulation of AKT and JNK mitogen-activated protein kinase pathways in breast cancer cell lines exposed to gold nanoparticles loaded with TNF-α and combined with doxorubicin
- Effect of PVA fibers on durability of nano-SiO2-reinforced cement-based composites subjected to wet-thermal and chloride salt-coupled environment
- Effect of polyvinyl alcohol fibers on mechanical properties of nano-SiO2-reinforced geopolymer composites under a complex environment
- In vitro studies of titanium dioxide nanoparticles modified with glutathione as a potential drug delivery system
- Comparative investigations of Ag/H2O nanofluid and Ag-CuO/H2O hybrid nanofluid with Darcy-Forchheimer flow over a curved surface
- Study on deformation characteristics of multi-pass continuous drawing of micro copper wire based on crystal plasticity finite element method
- Properties of ultra-high-performance self-compacting fiber-reinforced concrete modified with nanomaterials
- Prediction of lap shear strength of GNP and TiO2/epoxy nanocomposite adhesives
- A novel exploration of how localized magnetic field affects vortex generation of trihybrid nanofluids
- Fabrication and physicochemical characterization of copper oxide–pyrrhotite nanocomposites for the cytotoxic effects on HepG2 cells and the mechanism
- Thermal radiative flow of cross nanofluid due to a stretched cylinder containing microorganisms
- In vitro study of the biphasic calcium phosphate/chitosan hybrid biomaterial scaffold fabricated via solvent casting and evaporation technique for bone regeneration
- Insights into the thermal characteristics and dynamics of stagnant blood conveying titanium oxide, alumina, and silver nanoparticles subject to Lorentz force and internal heating over a curved surface
- Effects of nano-SiO2 additives on carbon fiber-reinforced fly ash–slag geopolymer composites performance: Workability, mechanical properties, and microstructure
- Energy bandgap and thermal characteristics of non-Darcian MHD rotating hybridity nanofluid thin film flow: Nanotechnology application
- Green synthesis and characterization of ginger-extract-based oxali-palladium nanoparticles for colorectal cancer: Downregulation of REG4 and apoptosis induction
- Abnormal evolution of resistivity and microstructure of annealed Ag nanoparticles/Ag–Mo films
- Preparation of water-based dextran-coated Fe3O4 magnetic fluid for magnetic hyperthermia
- Statistical investigations and morphological aspects of cross-rheological material suspended in transportation of alumina, silica, titanium, and ethylene glycol via the Galerkin algorithm
- Effect of CNT film interleaves on the flexural properties and strength after impact of CFRP composites
- Self-assembled nanoscale entities: Preparative process optimization, payload release, and enhanced bioavailability of thymoquinone natural product
- Structure–mechanical property relationships of 3D-printed porous polydimethylsiloxane films
- Nonlinear thermal radiation and the slip effect on a 3D bioconvection flow of the Casson nanofluid in a rotating frame via a homotopy analysis mechanism
- Residual mechanical properties of concrete incorporated with nano supplementary cementitious materials exposed to elevated temperature
- Time-independent three-dimensional flow of a water-based hybrid nanofluid past a Riga plate with slips and convective conditions: A homotopic solution
- Lightweight and high-strength polyarylene ether nitrile-based composites for efficient electromagnetic interference shielding
- Review Articles
- Recycling waste sources into nanocomposites of graphene materials: Overview from an energy-focused perspective
- Hybrid nanofiller reinforcement in thermoset and biothermoset applications: A review
- Current state-of-the-art review of nanotechnology-based therapeutics for viral pandemics: Special attention to COVID-19
- Solid lipid nanoparticles for targeted natural and synthetic drugs delivery in high-incidence cancers, and other diseases: Roles of preparation methods, lipid composition, transitional stability, and release profiles in nanocarriers’ development
- Critical review on experimental and theoretical studies of elastic properties of wurtzite-structured ZnO nanowires
- Polyurea micro-/nano-capsule applications in construction industry: A review
- A comprehensive review and clinical guide to molecular and serological diagnostic tests and future development: In vitro diagnostic testing for COVID-19
- Recent advances in electrocatalytic oxidation of 5-hydroxymethylfurfural to 2,5-furandicarboxylic acid: Mechanism, catalyst, coupling system
- Research progress and prospect of silica-based polymer nanofluids in enhanced oil recovery
- Review of the pharmacokinetics of nanodrugs
- Engineered nanoflowers, nanotrees, nanostars, nanodendrites, and nanoleaves for biomedical applications
- Research progress of biopolymers combined with stem cells in the repair of intrauterine adhesions
- Progress in FEM modeling on mechanical and electromechanical properties of carbon nanotube cement-based composites
- Antifouling induced by surface wettability of poly(dimethyl siloxane) and its nanocomposites
- TiO2 aerogel composite high-efficiency photocatalysts for environmental treatment and hydrogen energy production
- Structural properties of alumina surfaces and their roles in the synthesis of environmentally persistent free radicals (EPFRs)
- Nanoparticles for the potential treatment of Alzheimer’s disease: A physiopathological approach
- Current status of synthesis and consolidation strategies for thermo-resistant nanoalloys and their general applications
- Recent research progress on the stimuli-responsive smart membrane: A review
- Dispersion of carbon nanotubes in aqueous cementitious materials: A review
- Applications of DNA tetrahedron nanostructure in cancer diagnosis and anticancer drugs delivery
- Magnetic nanoparticles in 3D-printed scaffolds for biomedical applications
- An overview of the synthesis of silicon carbide–boron carbide composite powders
- Organolead halide perovskites: Synthetic routes, structural features, and their potential in the development of photovoltaic
- Recent advancements in nanotechnology application on wood and bamboo materials: A review
- Application of aptamer-functionalized nanomaterials in molecular imaging of tumors
- Recent progress on corrosion mechanisms of graphene-reinforced metal matrix composites
- Research progress on preparation, modification, and application of phenolic aerogel
- Application of nanomaterials in early diagnosis of cancer
- Plant mediated-green synthesis of zinc oxide nanoparticles: An insight into biomedical applications
- Recent developments in terahertz quantum cascade lasers for practical applications
- Recent progress in dielectric/metal/dielectric electrodes for foldable light-emitting devices
- Nanocoatings for ballistic applications: A review
- A mini-review on MoS2 membrane for water desalination: Recent development and challenges
- Recent updates in nanotechnological advances for wound healing: A narrative review
- Recent advances in DNA nanomaterials for cancer diagnosis and treatment
- Electrochemical micro- and nanobiosensors for in vivo reactive oxygen/nitrogen species measurement in the brain
- Advances in organic–inorganic nanocomposites for cancer imaging and therapy
- Advancements in aluminum matrix composites reinforced with carbides and graphene: A comprehensive review
- Modification effects of nanosilica on asphalt binders: A review
- Decellularized extracellular matrix as a promising biomaterial for musculoskeletal tissue regeneration
- Review of the sol–gel method in preparing nano TiO2 for advanced oxidation process
- Micro/nano manufacturing aircraft surface with anti-icing and deicing performances: An overview
- Cell type-targeting nanoparticles in treating central nervous system diseases: Challenges and hopes
- An overview of hydrogen production from Al-based materials
- A review of application, modification, and prospect of melamine foam
- A review of the performance of fibre-reinforced composite laminates with carbon nanotubes
- Research on AFM tip-related nanofabrication of two-dimensional materials
- Advances in phase change building materials: An overview
- Development of graphene and graphene quantum dots toward biomedical engineering applications: A review
- Nanoremediation approaches for the mitigation of heavy metal contamination in vegetables: An overview
- Photodynamic therapy empowered by nanotechnology for oral and dental science: Progress and perspectives
- Biosynthesis of metal nanoparticles: Bioreduction and biomineralization
- Current diagnostic and therapeutic approaches for severe acute respiratory syndrome coronavirus-2 (SARS-COV-2) and the role of nanomaterial-based theragnosis in combating the pandemic
- Application of two-dimensional black phosphorus material in wound healing
- Special Issue on Advanced Nanomaterials and Composites for Energy Conversion and Storage - Part I
- Helical fluorinated carbon nanotubes/iron(iii) fluoride hybrid with multilevel transportation channels and rich active sites for lithium/fluorinated carbon primary battery
- The progress of cathode materials in aqueous zinc-ion batteries
- Special Issue on Advanced Nanomaterials for Carbon Capture, Environment and Utilization for Energy Sustainability - Part I
- Effect of polypropylene fiber and nano-silica on the compressive strength and frost resistance of recycled brick aggregate concrete
- Mechanochemical design of nanomaterials for catalytic applications with a benign-by-design focus