Critical review on experimental and theoretical studies of elastic properties of wurtzite-structured ZnO nanowires
-
 ,
,

Abstract
In this critical review, we call attention to a widespread problem related to the vast disagreement in elastic moduli values reported by different authors for nanostructures made of the same material. As a particular example, we focus on ZnO nanowires (NWs), which are among the most intensively studied nanomaterials due to their remarkable physical properties and promising applications. Since ZnO NWs possess piezoelectric effects, many applications involve mechanical deformations. Therefore, there are plenty of works dedicated to the mechanical characterization of ZnO NWs using various experimental and computational techniques. Although the most of works consider exactly the same growth direction and wurtzite crystal structure, reported values of Young’s modulus vary drastically from author to author ranging from 20 to 800 GPa. Moreover, both – diameter dependent and independent – Young’s modulus values have been reported. In this work, we give a critical overview and perform a thorough analysis of the available experimental and theoretical works on the mechanical characterization of ZnO NWs in order to find out the most significant sources of errors and to bring out the most trustable results.
1 Introduction
It is known that materials reduced to the nanoscale dimensions can show significantly different properties and behavior compared to what they exhibit at the micro- and macroscales, enabling unique applications. At the same time, it means, that the bulk properties of materials cannot be directly used for the proper description and modeling of nanoscale systems. Reliable results can be obtained only by measuring the properties of individual nanostructures directly. However, any measurements at such small length scales are challenging. Complications are related to all stages of the measurement process including, but not limited to proper sample preparation, achieving stable measurement conditions, sensitivity, resolution, and reproducibility of the experiments. If the material is of great importance to the scientific community, its properties are measured by many different authors and different methods. However, the results of the measurements can differ significantly, and it can be difficult to find crucial criteria to explain the difference and to select the most trustworthy results. Probably the most evident example is related to the elastic properties of ZnO NWs, which are among the most important nanoscale materials due to their attractive properties and number of promising applications [1].
ZnO is a semiconducting material with a large exciton binding energy and a wide band gap of 3.37 eV, which can be easily controlled by doping [1]. Due to the noncentral symmetry of the wurtzite structure, ZnO possesses remarkable piezoelectric properties. Other attractive properties include high refractive index, high thermal conductivity, antibacterial and UV-protection properties, and among other things, ZnO is a bio-safe and biocompatible material. All this gives rise to numerous applications in different fields including, but not limited to, the rubber industry [2,3], dentistry [4], food packaging [5], paint pigment [6], photoprotective coatings [7,8] etc. In particular, ZnO NWs are considered functional parts of various nanoelectromechanical systems [9] and nanosensors [10,11].
The combination of semiconducting and piezoelectric properties means that ZnO, particularly in nanostructured form, can be utilized for piezoelectric devices, transducers and nanogenerators [9,12,13,14]. Numerous studies are dedicated to applications of ZnO NWs in piezotronics and piezo-phototronic, where piezoelectric potential created in the material in response to mechanical stress and deformation is used as a “gate” voltage to tune/control the charge carrier transport properties [15]. Axial stress/strain may significantly enhance the sensitivity of ZnO NW photodetectors and enhance the light emission of ZnO diodes [16,17,18]. All these applications rely on the elastic properties of ZnO NWs, and hence correct and precise data are needed for simulation and engineering of robust operational devices based on ZnO NWs.
By now, there are dozens of available articles dedicated to the mechanical characterizations of ZnO NWs. However, reported values of elastic modulus vary drastically ranging from a few tens to several hundreds of GPa as will be shown in this review article. The problem was emphasized even by the National Institute of Standards and Technologies (U.S.) [19]. In addition, there is no consensus on the size effect on the mechanical properties of the NWs. This is a frustrating situation, since Young’s modulus is an extremely important characteristic in many applications, so that trustworthy value is essential for the design and simulation of prototype devices based on ZnO NWs.
The problem of inconsistency of reported mechanical properties for various NWs was highlighted in a relatively recent review by Wang et al. [20]. In the present article, we take a more detailed look at the problem by focusing on a single property (elastic modulus) and a single material (ZnO NWs). We give an overview and perform an in-depth critical analysis of the available experimental and theoretical works dedicated to the mechanical characterization of ZnO NWs and try to find out the most important reasons for the drastic variation of measured elastic properties and to bring out the most trustworthy/reliable results.
First, we will shortly describe the structure and synthesis of ZnO NWs. Then, we will overview common methods employed for the characterization of ZnO NWs. Next, we will critically analyze and discuss the available experimental works in detail.
2 Crystal structure and elastic properties of ZnO wurtzite phase
ZnO can mainly possess three crystalline structures. Cubic zinc blende (space group
The structure of the wurtzite phase could be described as two interpenetrating hexagonal-close-packed sublattices. The unit cell of hexagonal wurtzite ZnO is composed of Zn2+ ions surrounded by four O2− ions at the corners of a tetrahedron or vice versa (Figure 1). The close-pack alternating Zn or O (001) planes are staked along the <001> direction (c-axis) displaced with respect to each other by the amount of u. The parameter u could be defined as the length of the chemical bond parallel to the c axis in fractional coordinates, i.e., in the units of c (Figure 1). In the ideal crystal, u = 3/8 = 0.375. In a real wurtzite structure, the parameter u differs from a value equal to 3/8 for the ideal structure, describing the distortion of the ZnO tetrahedra.

Axonometric hexagonal image of tripled ZnO conventional unit cell (UC) with enclosed labels (horizontal coordinates of atoms in the fifth layer coincide with those in the first layer). Dashed lines correspond to the lines of adjacent UCs. The parameter u determines the relative lengths of Zn–O bonds.
The lattice constants of the ZnO hexagon crystal structure are a = 0.325 nm and c = 0.521 nm, giving the ratio of c/a of about 1.603 which is close to the ideal value for a hexagonal closed-packed cell
Oppositely charged alternating Zn2+ and O2− planes produce spontaneous polarization along the c-axis [24]. The polar surfaces of ZnO are atomically flat, stable and without surface reconstruction. ZnO exhibits three fast-growth directions of <2-1-10>, <01-10> and <0001> allowing the synthesis of a wide range of different structures by controlling the growth rates along these directions [24]. Hexagonal ZnO crystal has five independent elastic moduli (C11, C12, C13, C33 and C44), which cause significant anisotropy of elastic properties [25].
Experimentally measured Young’s modulus of bulk ZnO in the [0001] direction obtained by method of resonance–antiresonance [26] is 140 GPa.
3 Growth methods
The anisotropic nature of the ZnO crystal structure assists the growth of NWs, which is propagated along the c-axis in <0001> direction. In recent years, different methods have been used to synthesise ZnO nanowires [1,21] including high-temperature vapor-phase methods like vapor-liquid-solid (VLS) growth [27,28,29] and metal-organic chemical vapor deposition (CVD) [28], or low-temperature solution-based methods like microemulsion synthesis [30], solvothermal [31,32] oxford, and hydrothermal methods [33].
Vapor-phase methods involve the condensation of vaporized source material onto a high-temperature substrate (500–1,500°C) with a metal catalyst inside a horizontal tube furnace. Among various vapor-phase methods, the VLS mechanism is the most widespread due to the simpler and cheaper process. Nanosized liquid metal (e.g., Au, Cu, Ni) droplets are used as catalysts on different substrates including sapphire, GaN and AlGaN. The quality and the sizes of the ZnO NWs are controlled by the chamber pressure, oxygen partial pressure and thickness of the catalyst layer.
In low-temperature solution methods, either an aqueous or an organic solution, as well as a mixture of the two can be used to carry out the synthesis of the NWs. The most popular solution-based method is hydrothermal growth [33], which employs an aqueous solution. The hydrothermal method uses a seeded substrate, e.g., a thin layer of ZnO nanoparticles that promotes nucleation for the growth of the NWs. The NWs are grown in the aqueous solution of alkaline reagent, and Zn2+ salt mixture, temperature and reaction time is used to control the sizes of the NWs.
Vapor-phase method produces NWs with high quality due to the high temperatures involved with the process limiting the substrate selection and increasing the cost of the deposition system. In contrast, low-temperature solution routes allow for commercialization due to the simple, low-cost and scalable synthesis of ZnO NWs. At the same time, hydrothermally grown ZnO NWs have more crystalline defects than NWs grown by vapor-phase-based methods, primarily due to oxygen vacancies [34,35].
4 Mechanical characterization of ZnO nanowires
4.1 Experimental test methods
Elastic properties of ZnO NWs have been measured by all common techniques employed for mechanical characterization of one-dimensional nanostructures including tensile test [36,37,38,39,40,41], resonance method [42,43,44,45,46,47], cantilevered beam bending [48,49,50,51], three-point bending [52,53], nanoindentation [54,55], buckling [40,56] and contact resonance atomic force microscopy (AFM) [57].
The uniaxial tensile test is one of the main techniques used in material science for measuring Young’s modulus of materials and has been widely used for the mechanical testing of ZnO NWs. The tensile test involves uniaxial deformation ε of the NW with the simultaneous measurement of the applied load F and the strain σ according to Hook’s law: σ = Eε. Knowing the cross-section of the NW A, the stress–strain curve is obtained and Young’s modulus can be calculated as E = F/εA.
There are two main approaches to the tensile testing of NWs. The first method involves the use of an AFM cantilever as a force sensor and a nanomanipulator probe as an actuator inside an electron microscope [38,40,41] (Figure 2a). NW is clamped between the cantilever and the probe, and a nanomanipulator is used to deform the NW uniaxially. The applied load is calculated from the deflection of the cantilever with a known spring constant, and strain is obtained from the elongation of the NW measured by the electron microscope (Figure 2b). The second option is to use specific MEMS test systems [36,37]. MEMS allows simultaneous measuring of the force and deformation using load and displacement sensors.
![Figure 2
Examples of tensile tests carried inside SEM (adapted form [41]) and TEM (adopted form [40]) using piezo scanners.](/document/doi/10.1515/ntrev-2022-0505/asset/graphic/j_ntrev-2022-0505_fig_002.jpg)
Cantilevered beam bending scheme (Figure 3a) consists of the bending of the NW from one end, while the other end is rigidly fixed. The scheme can be realized either on as-grown NWs freely protruding above the surface [58] (e.g., produced by thermal or CVD growth method) or alternatively NW can be placed half-suspended over a hole. The latter situation can be achieved in different ways: by manipulating a single NW into the desired position or transferring NWs on a specially structured substrate, either by drop casting from a solution [31] or mechanically [50]. Bending of the NW can be done with an AFM [51] or with a nanomanipulator equipped with a force sensor inside an electron microscope for real-time visual feedback [48,49,59].

Schematics of (a) cantilever beam, (b) 3-point bending, (c) nanoindentation, and (d) resonance method test schemes. Arrow indicates the direction of the applied external force.
Young modulus, E, in the cantilevered beam bending test is calculated on the basis of elastic beam theory (EBT) [60] by solving the following differential equation for a bent elastic beam:
where
where D hex is the diameter of the regular hexagon. Note that the model works best for very high aspect ratio beams.
Three-point bending test conditions are realized when both ends of NW are resting on a substrate (Figure 3b). Typically, it is achieved by the deposition of NWs on a substrate with holes or grooves so that some individual NWs are suspended over those structures [61]. Usually, the adhesion between the flat NW facet and the substrate is enough to fix the NW at both ends. Alternatively, a focused ion beam (FIB) or electron-beam-induced deposition can be used to fasten the ends of the NW to the substrate. AFM is used to simultaneously bend the NW in the middle and to measure the force and the displacement of the NW with high accuracy [52]. Three-point bending can be conducted laterally or perpendicular to the surface of the substrate. Young’s modulus of suspended NW with both ends fixed and subjected to a load F at its mid-point is calculated as follows:
where
Nanoindentation can be considered the most convenient method for the characterization of 1D nanostructures due to the simple sample preparation and fast measurement procedure [62]. NWs are deposited on a flat and hard surface, and an AFM cantilever is used to ident the sample (Figure 3c). Obtained AFM force–displacement curves are usually analyzed using the Hertz model [63]. The elastic modulus is found from the following force–displacement relationship:
where F is the applied load, R is the tip radius, δ is displacement, and E * is reduced Young’s modulus which is related to Young’s modulus of the NW by
where E
NW and
In the resonance method [42,46], mechanical oscillations are induced in a single freestanding NW by an alternating electric field of variable frequency to find the natural resonant frequency of NW. Young’s modulus is then calculated as follows:
where β i is a constant for the ith harmonic: β 1 = 1.875, and β 2 = 4.694, E is the elastic modulus, m is the unit length mass, and L is the length of the cantilever [64]. NW can be excited directly at the substrate where they are grown or by picking up and attaching a single NW to a probe. Usually, a second probe is then used as a counter electrode, and voltage is applied across the NW and the probe (Figure 3d). As the resonance method requires real-time visual observation to detect resonance, measurement is conducted inside an electron microscope.
Lastly, the buckling test has also been used for the mechanical characterization of NWs [65]. The experimental setup of a buckling test is similar to the uniaxial tensile test, which uses an AFM cantilever and a nanomanipulator (Figure 4). NW is attached to the probe of the nanomanipulator, which serves as an actuator and is then axially pushed into the AFM cantilever used to measure the applied force. An axial compressive loading leads to the buckling and subsequent bending of the NW. Young’s modulus is found using Euler’s formula:
where P cr is the buckling force, I second area moment of inertia, and L e effective length. In fixed–fixed boundary conditions, the effective length is half the actual length of the pinned NW.
![Figure 4
(a) SEM image showing the buckling test for an NW with a diameter of 46 nm. (b–e) A series of enlarged SEM images of the NW under the application of a continuously increasing compressive load. Adapted from [65].](/document/doi/10.1515/ntrev-2022-0505/asset/graphic/j_ntrev-2022-0505_fig_004.jpg)
(a) SEM image showing the buckling test for an NW with a diameter of 46 nm. (b–e) A series of enlarged SEM images of the NW under the application of a continuously increasing compressive load. Adapted from [65].
4.2 Atomistic simulations
This section gives an overview of atomistic simulations of the elastic properties of wurtzite-structured ZnO nanowires. Methods of varying complexity are used in modern computational science to calculate Young’s modulus of nanostructures. These methods can be divided into two major categories, based on the approach they use to predict interatomic interactions. The first category involves methods based on empirical interatomic potentials (also known as force fields). The second one involves quantum chemical methods, mostly based on Density Functional Theory (DFT). Alternatively, Young’s modulus calculation methods can be divided into static and dynamic. Thus, four approaches can be conditionally distinguished: molecular mechanics, first-principles methods based on the approximate solution of the Schrödinger equation, empirical molecular dynamics and, finally, first-principles molecular dynamics (Figure 5).
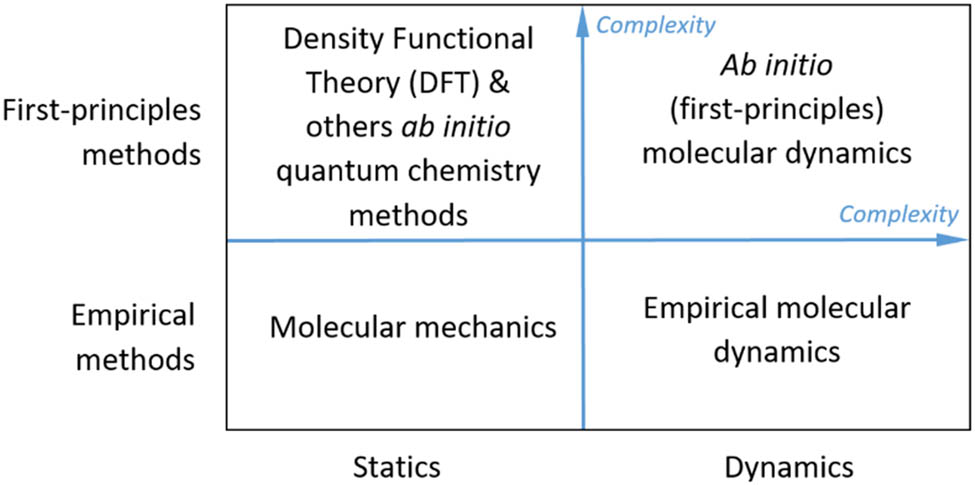
Classification of theoretical methods for Young’s modulus calculation.
Interatomic potentials are empirical analytical functions, which allow the estimation of the potential energy of a system as a function of the positions of its atoms. Interatomic potentials of various types have been developed with very different physical justifications by fitting to various material properties pre-calculated by electronic structure (DFT) calculations or known from available experimental data. However, since the interatomic interactions are extremely complex and have a quantum mechanical nature, all analytical interatomic potentials are mathematical approximations that simplify the complex interatomic interactions. The simplest potentials are the so-called pair potentials, which describe the potential energy of two interacting atoms. Typical examples of such potentials are the Buckingham and Lennard-Jones [66], Lennard-Jones [67], and Morse [68] potentials. Pair potentials can be separated into rigid-ion models or core-shell models. In the former approach, ions are considered as the point charges, whereas the latter is more complex, as it includes ionic polarizability by representing ions as cores connected to charged shells. Pair potentials often fail to describe systems with high anisotropy, processes of charge transfer from one atom to another, and many-body interactions. To capture such phenomena, interatomic potentials with a more complex mathematical structure that describe many-body interactions of atoms and give a more accurate description of chemical re-bonding can be used. Examples of such potentials are:
the reactive force-fields (ReaxFF) [69] where interatomic potentials include the energy associated with bonds forming between atoms, the energies associated with three-body valence angle strain and four-body torsional angle strain, as well as the energy penalty preventing the overcoordination of atoms, which is based on atomic valence and electrostatic and dispersive contributions calculated between all atoms in the systems;
the Stillinger -Weber potentials [70], which include both two- and three-part terms;
the embedded atom method [71], where energy is represented as a sum of functions of the separation between an atom and its local environment;
the Charge-Optimized Many Body potentials [74], which combine the ideas of bond order and variable ionic charge to produce a flexible description of interatomic interactions.
On the other side of the computational cost scale are the first-principles quantum-mechanical methods, the most typical of which is DFT. These methods are used for high-precision calculations of the interatomic interactions based on simulating the electronic structure for any atomic configuration. A key parameter to be adjusted for the reliable description of the electronic structure is the proper choice of exchange-correlation functional (E XC). For example, by changing the E XC, one can adjust the basic structural properties of the bulk ZnO phase, such as the lattice constants and the band gap [77]. Equally important is the correct selection of the pseudopotential describing the core of a studied atom, as well as the appropriate convergence of the both interatomic potentials and ab initio methods can be used to calculate macroscopic quantities such as Young’s modulus. Depending on the thermodynamical characteristics of the simulated system, different methods can be used to calculate Young’s modulus. The simplest and most computationally inexpensive method is Molecular Statics (MS), which neglects the kinetic energy of the atoms, which is a valid approximation at very low temperatures. In this approach, Young’s modulus is calculated as
where
For finite temperature calculations, the Molecular Dynamics (MD) method, which integrates Newton’s kinetic equations numerically, is used. The Newtonian forces of the moving atoms are calculated using either interatomic potentials, or from the first principles (ab initio molecular dynamics – AIMD). AIMD calculations are limited by the computational capabilities of modern high-performance computing clusters; thus, this method is not widely used today. Finally, due to those computational limitations, most of the calculations of Young’s modulus for ZnO NWs are limited to relatively small diameters (cross-sections).
5 Analysis and discussion
5.1 Available experimental works
In this section, we will give an overview and perform a critical analysis of the available experimental works dedicated to the mechanical characterization of ZnO NWs. The reported values of elastic modulus are summarized in Figure 6. As can be seen, a discrepancy in the results reaches the order of magnitude, which is unacceptable for such parameters as the Young modulus that should be a specific property of the material. Moreover, one extremely high and unrealistic value (800 GPa [54]) was excluded from the graph since it would unreasonably increase E scale and decrease the readability of the rest of the data. Note that Manoharan et al. [48] provided only the average value for the range of diameters; therefore, it is presented as a dashed line on the graph. Please also note that variation of properties with diameters (in the given case increase of the measured Young’s modulus with a decrease of the diameters) is a well-known phenomenon for nanoscale systems [36,38,42,56,78,79,80] and will be discussed further in the article. When we speak about the discrepancy in the results in the present review, our concerns are related to the discrepancy in the reported elastic modulus of ZnO NWs when we compare similar diameters.

Summary of Young’s modulus of ZnO nanowires reported by different authors. Different colors represent different methods: blue – tensile, red – resonance method, green – cantilevered, orange – three-point bending, yellow – indentation, purple – buckling and grey – contact resonance AFM.
In the next sections, we will first try to find out general factors that may influence the measured elastic properties, and then, we will analyze reported works separately in order to find the possible reasons behind the drastic discrepancy between the published results.
5.1.1 Influence of growth method and conditions
The first and most obvious factor that one would expect to have an influence on Young’s modulus of NWs is the synthesis method, conditions, and crystal growth direction. There are several methods commonly used for the synthesis of ZnO NWs [1] that can be divided into vapor phase synthesis (mostly VLS [27,81] methods) and solution phase synthesis (mostly hydrothermal methods [35,82]).
Although different research groups link the crystal structure and orientation to the synthesis conditions, little attention has been paid to the connection between the synthesis method and mechanical properties. Some authors just briefly mention synthesis conditions as the possible reason for the discrepancy in results (e.g., [41]). Indeed, the difference in synthesis can strongly affect the mechanical strength of the material due to different defect concentrations. Young’s modulus, however, is the property related to the crystal structure (mainly bond length and the coordination number of atoms [83]) and should not be as strongly influenced by the presence of defects as the strength. An exception is point defects (impurities and vacancies) that affect crystal lattice parameters and therefore have a certain influence on the elastic properties as was shown in both experiment and simulation [41,84]. In particular, oxygen vacancies in ZnO NWs will increase average bond length and, thus, result in a reduction of the intrinsic elastic modulus [85]. As pointed out in Section 2.3 (growth methods), generally oxygen vacancies are (more likely) produced during hydrothermal growth [35]. Moreover, Wang et al. [41] have shown that small changes in the initial synthesis conditions can significantly affect the concentration of point defects and consequently the elastic values of the material. The influence of impurities was studied by Vahtrus et al. [31]. They demonstrated that the incorporation of Co atoms into the ZnO lattice significantly decreased Young’s modulus – almost two times at 5% of Co inclusion. The concentration of impurities in proper synthesis should be far below such amounts. However, this factor should be kept in mind, as it may at least be partly responsible for the discrepancy in experimental results. Roy et al. [46] studied separately the influence of surface defects on the mechanical properties of ZnO NWs. Surfaces of tested NWs were studied under TEM after the mechanical characterization and despite the considerable amount of surface irregularities authors could not find any significant effects of defects on Young’s modulus.
Another aspect to consider is that although at normal conditions ZnO exhibits single-phase wurtzite crystal structure [86] both in bulk and nano forms, it may contain stacking faults of different types. The most common are basal plane stacking faults. They can be considered as a sheet of zinc blende structure embedded in the wurtzite-structure ZnO [87]. Therefore, the composition of ZnO crystal with a significant amount of basal plane stacking faults can be viewed as a mixture of wurtzite and zinc blende phases. On the other hand, both wurtzite and zinc blende phases of ZnO are tetrahedral crystals with exactly the same bond length, implying that their bulk moduli should be equal, which is also confirmed by first-principles calculations [83]. We could not find any study comparing Young’s modulus of zinc-blende or with wurtzite or mixed wurtzite/zinc-blende phases of ZnO. However, such comparisons are available for some other materials that can be grown in one of these phases. For example, Dunaevskiy et al. [88] experimentally found that Young’s modulus of the wurtzite-phase InP NWs is approx. two times higher compared to the zinc-blende phase. Therefore, we think that this aspect deserves more attention in future studies related to the mechanical properties of ZnO NWs.
The difference in synthesis methods may result also in different cross-section geometries of ZnO NWs. Wang et al. [41] showed that only small variations in the initial synthesis conditions could lead to NWs with either hexagonal or circular cross-section geometry. The situation is even more complicated by the fact that cross-sections can have any intermediate geometry between hexagonal and circular [36,57]. Additionally, distortions of hexagon geometry should be mentioned (Figure 7). As described in section 2.4, Young’s modulus is highly dependent on the diameter and the cross-section of the NW, especially in the case of bending experiments, where it is inversely proportional to the fourth power of the diameter. Consequently, using the wrong cross-section or inaccurate diameter could lead to significant errors in the calculation of elastic properties. Unfortunately, thorough descriptions and high-resolution electron microscopy images of NW cross-section are seldom given in works dedicated to the mechanical properties of ZnO NWs. Moreover, sometimes, either hexagon [51] or circular cross-section [39,53] is assumed without giving further explanation or discussion.
![Figure 7
Illustration of cross-section deviation from hexagon shape (adopted from Broitman et al. [89]).](/document/doi/10.1515/ntrev-2022-0505/asset/graphic/j_ntrev-2022-0505_fig_007.jpg)
Illustration of cross-section deviation from hexagon shape (adopted from Broitman et al. [89]).
In addition, depending on the synthesis, NWs can have non-uniform diameters. For instance, CVD (VLS) method often yields tapered NWs due to the presence of two competing processes during growth: catalyst-mediated precipitation through the liquid/solid interface, which leads to axial elongation, and non-mediated direct vapor deposition on the existing nanowire sidewall surface. The latter process results in radial thickening and eventually leads to tapering as the length of NWs increases [90] (Figure 8a). For example, ZnO NWs grown by CVD [48] and thermal evaporation [54] (Figure 8b) exhibit rather non-uniform and tapered shapes according to the images provided in their works. The assumption of uniform diameter in such case will unavoidably lead to errors in Young’s modulus value. The difference will be especially high if instead of average diameters over the whole length of NW, some researchers will calculate diameters from thinner parts and some researchers from thicker. In this case, the difference can be drastic, since Young’s modulus has power dependence on diameter (Section 4).
![Figure 8
(a) Possible deposition pathways in a VLS system [90]. Depending on the growth parameters, VLS growth via catalyst alloy, radial overcoating on the existing NW sidewalls and thin film deposition on the substrate may occur. (b) SEM image showing the morphology of as-grown ZnO nanorods arrays grown on the silicon substrate (side view) [54].](/document/doi/10.1515/ntrev-2022-0505/asset/graphic/j_ntrev-2022-0505_fig_008.jpg)
(a) Possible deposition pathways in a VLS system [90]. Depending on the growth parameters, VLS growth via catalyst alloy, radial overcoating on the existing NW sidewalls and thin film deposition on the substrate may occur. (b) SEM image showing the morphology of as-grown ZnO nanorods arrays grown on the silicon substrate (side view) [54].
Nonetheless, we could not find a clear correlation between synthesis methods and measured modulus in analyzed works. In addition, the presence of defects or simplifications made in the determination of NW cross-section and diameter cannot alone explain the huge differences in obtained results. What is more telling, is the fact that the same measurement method used by two groups on ZnO NWs produced by the same manufacturer resulted in very different modulus values [36,37]. Both Agrawal et al. [36] and Desai and Haque [37] used MEMS-based uniaxial tensile test to measure Young’s modulus of ZnO NWs produced by NanoLab Inc. Agrawal et al. [36] found that Young’s modulus of ZnO increase from 140 to 160 GPa with the decrease of diameter as opposed to Desai and Haque [37] who found that the average value of Young’s modulus was only about 21 GPa.
On the other hand, apart from the cases of obvious size effect, strong deviations of reported Young’s modulus from the bulk value in experiments appear almost exclusively toward lower values. If discrepancies between different authors were caused entirely by human or technical factors, we would observe values scattered around both sides of the bulk value. Therefore, we can conclude that structure-related factors are at least partly responsible for the observed discrepancies. Bulk values are expected at higher diameters for high-quality crystalline ZnO NWs, and lower moduli are expected for NWs with a high concentration of point defects.
5.1.2 Influence of test method
The next important factor that should be considered as potentially responsible for differences in reported moduli is the dependence on the test method. Indeed, ZnO NWs are monocrystalline materials with anisotropy of structure and properties; therefore, test conditions may have an effect on measured elastic properties. For instance, the tensile test involves uniaxial (along the NW) deformation of the NW, and the load is uniformly distributed over the cross-section of the NW. Therefore, the tensile test is not as sensitive to the inhomogeneous nature of NW, which arises from the fact that the surface atoms possess different properties compared to the bulk atoms. In particular, the outer layer in nanostructures is considered to be stiffer which is explained in [91] by (i) the broken-bond-induced local strain and skin-depth energy pinning and (ii) the tunable fraction of bonds between the undercoordinated atoms. Related phenomenon is an additional Laplace pressure P L = 2γ/r arising for nanostructures of curvature r, where γ is a specific surface energy or a specific work to create the free surface area [92]. Laplace pressure compresses the nanostructure contributing to the surface stiffening. In order to take surface stiffening into account, NWs are often approached with either core-surface [93] or core-shell [42] empirical models [94]. In these models, the “core” has the elastic properties of the bulk material, while the surface or the “shell” is stiffer. Therefore, the smaller the diameter, the higher is the contribution of either the surface or the “shell” to the elastic properties of NW resulting in size-dependent Young’s modulus.
In the bending test, deformation is highly non-uniform and surface atoms are subjected to higher mechanical stresses than the inner part of the NW. Therefore, surface effects, as well as non-uniform distribution of defects, can play a major role in the experiments where the mechanical properties of NW are found from the bending of NW such as resonance method, buckling, three-point or cantilever beam bending. The difference in the loading modes impelled some authors to distinguish between the tensile modulus and the bending modulus [38,40]. We totally support such an approach and think that it is always important to denote the test conditions.
Manoharan et al. [48] propose that the dynamic experiments are expected to show slightly higher, unrelaxed modulus compared to quasi-static experiments. According to the authors, in dynamic experiments, the time period of motion of the NW is much lower than the relaxation time, and hence, the modulus values estimated during dynamic experiments tend to be higher than the values estimated during static or quasi-static experiments [95]. In addition, the oscillating electric field induces charges on the NW surface, which can significantly overestimate the elastic properties [96]. Moreover, authors believe that for piezoelectric materials with low dielectric constant, such as ZnO, quasi-static tests are not recommended for measurements of elastic constants (Young’s modulus) because of the uncertainties in electrical boundary conditions [97]. They suggest that the strong electromechanical coupling in ZnO is a possible mechanism responsible for the reduction of the modulus of ZnO NWs compared to bulk. Due to its non-centrosymmetric wurtzite structure and the ionic nature of the interatomic bond, internal electric fields are induced in ZnO when the material is strained. The positive sign of the electromechanical coupling coefficient, e33, along the [0001] direction implies that the induced electric field tends to reduce the measured modulus of the NW. Additional electrical polarization is introduced in the NW during flexural deformation due to the flexoelectric effect which arises because of the high-strain gradient at the nanoscale [98]. The measured modulus values in quasistatic nanomechanical characterization are therefore influenced by the electromechanical coupling resulting in Young’s modulus of ZnO NW being different from the bulk. We, however, would not be too critical to quasi-static tests, even for piezoelectric materials with low dielectric constant like ZnO, since there are a number of results reported (for instance [38,40,46,52,56] and others) that are close or even exceed bulk values, obtained in the dynamic modes. Moreover, He et al. [38] compared the results of uniaxial tensile test measurements of ZnO NWs to previously published electric-filed-induced resonant method measurements on the same material. Both measurements gave similar tensile modulus and bending modulus values for ZnO NWs and showed diameter dependence. The only difference in the obtained results was the shape of the curve: at first, tensile modulus increased slower than bending modulus with the decrease of diameter and then for smaller diameters more rapidly. The authors utilized a core-shell model where stiffened surface contributes more to bending modulus at larger diameters, while relaxation of the core contributed to tensile modulus at smaller diameters. In addition, Xu et al. [40] compared the tensile modulus and bending modulus of ZnO NW using the same setup to conduct tensile and buckling tests inside an SEM equipped with a nanomanipulator and AFM cantilever. Similar to He et al. [38], the measurements performed by Xu et al. resulted in a diameter-dependent modulus with values of the same magnitude. Moreover, in both works, modulus values were close to the bulk values of ZnO. A slight difference was observed in the tendency of the diameter dependence. The bending modulus increased more rapidly compared to the tensile modulus with the decrease of the diameter even for smaller NWs. Again, the core-shell model with stiffened shell was used to explain the differences in measured values of tensile and buckling tests. Most importantly, both works showed that although loading mode can have a certain influence on the tendency of diameter dependence of ZnO NWs, it does not explain the large discrepancy in the reported values of Young’s modulus.
An alternative approach proposed by Manoharan et al. [48] for the explanation of reduction in modulus is that the elastic properties of a material can be described at the atomistic level, where the bond length, bond energy, and arrangement of atoms influence the overall elastic behavior of the material [99,100]. In the case of ZnO, the effective charge (e∗) on the Zn–O changes due to charge redistribution when the material is strained [101]. Since Young’s modulus of the material depends on e∗, the modulus of the material should change at higher strains. The techniques used for measuring the elastic properties at bulk scale involve negligible strains compared to nanoscale bending experiments. As a result, the measured modulus values of nanoscale ZnO are different from bulk due to strain-dependent modulus. Again, we would like to note that the majority of the data in Figure 6 agree well with bulk values at higher diameters; therefore, strain-dependent modulus alone cannot explain the low values of elastic modulus of ZnO NWs reported in some works.
Boundary conditions is another factor that may have a noticeable influence on the measurement results. For instance, Manoharan et al. [48] performed bending tests on ZnO NWs in cantilevered beam configuration with two different approaches to NW clamping. In one case, NWs were “soldered” by platinum deposition using a FIB. Measured elastic modulus ranged from 35 to 44 GPa. In other cases, NWs were held by adhesion only and measured elastic modulus ranged from 18 to 27 GPa. According to the authors, the discrepancy in results between clamped and adhesion-clamped NWs was attributed largely to the difference in boundary conditions in the two specimen clamping techniques. If the applied bending force is comparable to the adhesion and friction forces, the rigid support boundary condition is no longer valid, as the nanowire has free boundary conditions on a significant part of its outer surface. Nevertheless, in both cases, the elastic modulus was significantly below the bulk value. The importance of the proper choice of boundary conditions in the three-point bending test was demonstrated by Zhou et al. [102]. The authors introduced modification coefficient κ into right the part of equation (3). κ values vary from 1 for perfectly fixed ends to 4 for simply supported beams. This means that improper choice of boundary conditions can give under- or overestimate actual Young’s modulus up to 4 times.
The reliability of indentation methods relies on the knowledge of contact geometry. When it comes to the indentation of NWs (especially made from hard materials like ZnO), deformations are so small that determination of the contact geometry with reasonable accuracy becomes a very challenging task. Noteworthy are also the simulation results obtained by Chang et al. [103] revealing that using the well-known Oliver-Pharr theory, generally applied for materials with semi-infinite half-space, yields an underestimate of the elastic modulus of the NW material. We could not find studies comparing results from indentation with values obtained by other methods for ZnO NWs. However, such comparison is available, e.g., for Si NWs [104]. The authors found that the elastic moduli obtained from nanoindentation (37.9 ± 13.3 GPa for Berkovich tip and 59.5 ± 13.3 GPa for cube-corner tip), were significantly lower than the values (141.9 ± 33.3 GPa) obtained from the bending test.
Another important factor related to the test methods is the calibration of the force sensor. Small forces involved in the mechanical testing of NWs are mainly detected either by the deflection of pre-calibrated AFM cantilevers or sensors based on microelectromechanical systems (MEMS). For non-calibrated AFM cantilevers manufacturers usually provide a very broad stiffness range of up to two orders of magnitude. There are dozens of methods used for the calibration of AFM cantilevers [105,106,107,108,109,110,111,112,113,114,115,116,117,118,119,120,121,122]. Common calibration methods are “geometric” methods [105,106,107,110], based on the physical dimensions of the beam; “thermal” methods [108,109,123], based on the acquisition of the cantilever’s thermal distribution spectrum; “reference cantilever” method [122], where cantilever with unknown spring constant is pushed against the pre-calibrated cantilever. Other methods include Finite element analysis [112], nanoindentation [121] and pendulum [123] methods. According to Burnham et al. [123], the divergence between “geometric” and “thermal” methods, which are mostly used methods, does not exceed 17%. However, overall discrepancy between available methods can reach up to 50% [123]. Unfortunately, calibration methods are rarely mentioned in articles dedicated to the mechanical characterization of nanostructures; therefore, it is hard to estimate their influence. However, it is obvious that the discrepancy in reported moduli may be partly related to differences in force calibration procedures.
Note that the resonance method does not involve external force sensing and therefore does not rely on calibration. Nevertheless, no evident consistency between different works based on the resonance method was found. Chen et al. [42] found pronounced size-dependence and Young modulus values in the range 135–220 GPa for nanowires from 17 to 550 nm using the resonance method in SEM, while Huang et al. [43] observed no size dependence for NWs in the range 43–110 nm and Young modulus in the range from 49 to 70 GPa using resonance method in TEM. Zhou et al. [45] used the resonance method at ambient atmosphere for NWs in the range 152–516 nm and found Young’s modulus values in the range of 63–138 GPa and observed no size dependence. Roy et al. [46] did not observe any size effect and obtained Young’s modulus very close to the bulk value.
For experiments performed inside electron microscopes, the possible influence of electron beam (e-beam) should be discussed. Considering the energy transferred to the NW by incident electrons accompanied by Joule heating in electron microscopy imaging, a temperature increase in NWs during the mechanical testing inside SEM or TEM is expected. A slight dependence of Young’s modulus on temperature (−(1.09) × 10−4 K−1) for ZnO NWs was reported by Roy et al. [124]. Wang et al. concluded in their review [20] that e-beam-induced thermal effects alone should not significantly alter the mechanical properties of NWs. The authors note though that incident electrons can induce structural changes in materials with ionic and covalent bonds that can influence their mechanical properties. The extent of e-beam-induced effects, however, is difficult to analyze systematically based on literature only, as different research groups use different currents, voltages, magnifications and scan rates.
Some amount of additional heat production is expected also in the resonance method due to inner friction during oscillations. Since heating should lead to a slightly smaller measured modulus, this effect competes with the slight expected stiffening of ZnO NWs in dynamic methods as discussed earlier in the present section. In addition to thermal effects, incident electrons in electron microscopes may cause structural changes in irradiated structures creating point defects [125].
Based on analyzed works dedicated to the measurement of Young’s modulus of ZnO NWs, it can be concluded that test conditions may have a certain effect on measured elastic moduli. At the same time, no obvious correlations between the measured values and measurement method can be drawn to explain huge variations in reported results.
5.1.3 Geometrical factor and biased error
In Section 5.1.1, we discussed the critical importance of knowing the geometry of each measured NW as accurately as possible due to the power dependence of Young modulus on diameter and cross-section. Besides the drastically magnified errors in measured moduli, incorrectly determined geometry can result in another serious problem that we would like to discuss here separately, as it seems to be completely overlooked by the scientific community. Namely, errors and uncertainties in the determination of NW diameter and cross-section may introduce a systematic bias toward the higher Young’s modulus values at smaller diameters resulting in overemphasized size effect.
To explain this, let’s conduct an imaginary cantilever beam bending test. For simplicity, we assume that the force is measured with absolute precision and the “real” Young’s modulus E is expected to be a constant (does not depend on diameter) with a value of 140 GPa. Next, we introduce an intentionally incorrectly measured diameter D* that has a constant error σ relative to real diameter D and corresponding apparent Young’s modulus E
app that is derived from equation (1). Given that the second area moment of inertia (equation (2))
In Figure 9 (left), we plotted the dependence of E app on D* for different σ values. Solid curves on the left image correspond to the situations where the diameter of NWs is either overestimated by 3 nm (σ = 3 nm, blue curve) or underestimated by 3 nm (σ = −3, orange curve). The dashed line corresponds to the average of these two situations. It is clearly seen that depending on the sign of σ, the error in diameter measurement contributes asymmetrically to the E app value. Therefore, even if there were no real diameter dependence, it would be artificially created solely by uncertainties in diameter measurements. For the considered situation with maximum error σ = ±3, the measured E app values will be scattered between the blue and orange curves in Figure 9 (left) with an artificial bias toward higher average E app values at smaller diameters. On the right side of Figure 9, we plotted the averaged E app values for three different σ values ( ±1, 3, and 5 nm).

Apparent dependence of Young’s modulus on NW diameter artificially caused purely by uncertainties in diameter measurements.
In proper experiments, the accuracy of diameter measurements from the hi-res SEM images is expected to approach 1 nm. However, if we consider tapering and deviations from the perfect hexagonal geometries, as discussed in Section 5.1.1, then the situation becomes much more serious. Therefore, the aforementioned effect, which is apparently disregarded by all experimental studies, might be a significant contributing factor in the discrepancies among different experimental works, as well as the overestimation of the minimum NW size for which Young’s modulus starts becoming diameter-dependent. The latter is also could be at least partially responsible for the discrepancy between theoretical and experimental works, discussed in Section 5.2.1.
5.1.4 Point-by-point analysis
Since we could not find clear dependence of reported moduli on synthesis or test conditions, we suspect experimental artefacts, including flaws in experiment design and data analysis, as one of the reasons for the high discrepancy of reported values. Therefore, we will approach the problem from the other side and will try to highlight the most trustable works and separate them from the more controversial results. Then, we will shortly analyze every work separately.
To begin, initial judgment criteria should be defined that must not be based on our subjective impressions. The first criterion would be the reported value of Young’s modulus itself. The general and expected tendency for Young’s modulus of any nanoscale materials is to approach the bulk value for larger diameters, which is confirmed for different materials by numerous experimental [36,52,56,78,126] and theoretical works [36,126,127,128]. The threshold diameter at which the elastic modulus of NW starts to increase above the bulk value varies from material to material and from author to author, but typically for experimental studies lies below 100 nm. Experimentally measured Young’s modulus of bulk ZnO in the [0001] direction is 140 GPa [26]. Significant deviation from these values for larger ZnO NWs should be a strong reason for closer analysis of the study and suspecting experimental artifacts. Based on this criterion, we have sorted out several works in which deviations of reported Young’s modulus from the bulk modulus are the most significant. These works include Soomro et al. [54], Desai and Haque [37], Huang et al. [43], Polyakov et al. [49], Manoharan et al. [48] and Song et al. [51].
The most controversial is the work by Soomro et al. [54] who reported Young’s modulus of approximately 800 GPa for ZnO nanorods 200 nm in diameter measured by nanoindentation. The work was published in 2012, and by this time, Young’s modulus of ZnO nanostructures was measured several times by different authors and never was even closely as high as reported by Soomro et al. We even had to leave it out of the graph in Figure 6 since it would unreasonably increase the E scale and decrease the readability of the rest of the data. Such a high modulus would potentially indicate a presence of a novel yet unknown phase of ZnO crystal and should have attracted a lot of attention since it is even higher than Young’s modulus of such well-known stiff materials like WC (707 GPa [129]) or SiC nanowhiskers (581 GPa [130]). However, similar values were never reported again in subsequent studies. Since Soomro et al. provided no reasonable explanation of their anomalous value, we tend to suspect experimental inaccuracies as the most realistic reason. By carefully studying their work, we brought out several factors probably responsible for unrealistic values. First, while measurements were performed in a three-point bending configuration on a suspended nanorod, for unclear reasons they were treated as pure nanoindentation of a bulk material with a corresponding mathematical approach completely neglecting possible bending of the suspended nanorod. Next, the whole work is based on a single measurement: the authors provided no statistics, just a single value. There are also a number of questionable statements. For example, the authors claimed to use pyramidal Berkovich diamond indenter of 2 µm in diameter, while actual diameters of Berkovich indenters are typically below 100 nm. When discussing elasticity, they refer to Hall–Petch law, which is related to the hardness and strength of a material, but not to Young’s modulus. They talk about dislocations and their generation while they did not observe permanent deformation. In total, the whole work puts the competence of authors to challenge providing enough reasons to completely ignore their value when speaking about elastic properties of ZnO NWs.
Now, let us analyze publications reporting anomalously low elastic modulus. Polyakov et al. [49] reported Young’s modulus in the range of 27–58 GPa for ZnO NWs of 112–230 nm in diameter synthesized by CVD and later from 22 to 117 GPa for similar NWs [50]. No dependence on the diameter was found. Both works were performed inside an SEM in a cantilevered beam-bending configuration. NWs were held by adhesion only, which may be among the reasons for low values as was discussed in the previous section. Another weak point of these studies is the low resolution of the SEM used for NW visualization and experiments. No characterization of morphology, cross-sectional geometry, and crystal structure of NWs was performed. The authors only assumed hexagonal cross-section as the most common geometry for ZnO NWs. Working at the limits of SEM resolution can easily lead to an overestimation of the diameter caused by blurring and the large spot size of the electron beam. The measured modulus is inversely proportional to the fourth power of the measured diameter (equation (1)); therefore, even a minor overestimation of the diameter would lead to a significant underestimation of the Young modulus. Another possible and more general source of errors is the calibration of the special force sensor used for testing. The authors used a quartz tuning fork (QTF)-based homemade force sensor, which was calibrated on a pre-calibrated AFM cantilever (calibration provided by the manufacturer). Finally, according to the SEM images of the actual bending test provided in [49], the aspect ratio of NW can be insufficient for reliable use of EBT (Section 4.1). On the other hand, values measured by Polyakov et al. agree well with values reported in some other studies [43,48]. For instance, Huang et al. [43] reported the size-independent bending modulus of ZnO NWs measured by the resonance method to be ∼58 GPa for NWs diameters ranging from 43 to 110 nm. Experiments were performed inside a high-resolution transmission electron microscopy, therefore excluding the significant error in the estimation of diameters. The work is in letter format and, therefore, does not provide a detailed description and discussion. In particular, the method of NW fixation to the W tip is not mentioned. This is a very important nuance as insufficiently rigid fixation in the resonance method can lead to strongly underestimated elastic modulus as was shown by Agrawal et al. [36]. In the latter study, the use of Pt deposition for NW fixation yielded elastic moduli of 140 GPa, while fixation with carbon resulted in only 56 GPa. Low values (from 18 to 44 GPa) were reported also by Manoharan et al. [48] in bending tests performed inside a high-resolution SEM (HRSEM). The use of HRSEM again excludes the uncertainty in measurements of NW diameters as the main factor of possible errors. The possible reason potentially could be incorrect cantilever calibration data provided by the manufacturer. We would also like to draw your attention to the fact that NWs in their work had diameters ranging 200–750 nm, which actually lies outside the nanoscale according to common definitions [131]. In either case, higher values comparable to the bulk modulus of ZnO would be expected for such diameters.
The next work to analyze is Desai and Haque [37] who reported the average value of Young’s modulus of only about 21 GPa. The authors used original home-made MEMS for mechanical testing. ZnO NWs were deposited onto MEMS from the solution and the ends of NWs were fixed with platinum deposition excluding the reduction of the measured values due to displacement of the NW ends. Probably, the biggest source of errors lies in the estimation of NW diameter since according to the authors resolution of the SEM micrograph is 12 nm. We already mentioned this work in Section 5.1.1 and indicated the fact that the same method and NWs from the same manufacturer were used by Agrawal et al. [36] who found that Young’s modulus of ZnO increased from bulk value to 160 GPa with the decrease of diameter. Agrawal et al. [36] suggest that very low Young’s modulus measured by Desai and Haque [37] are related to errors introduced by loading a compliant SiO2 grid with the NW attached to it instead of loading the NW directly.
Song et al. [51] reported elastic moduli values measured for CVD-grown ZnO NWs in the cantilever beam bending test ranging from 15 to 47 GPa. An interesting aspect of this work is that NWs were bent in their original as-grown positions without transferring and fixing them on a separate substrate. Probably boundary conditions in such configuration should be reconsidered, especially considering the fact that CVD-grown ZnO NWs are often significantly wider at the base (tapered). However, the main concern we have in relation to their work is that the authors have used an average NW diameter for all measurements. They state, that from the SEM and TEM images, the aligned ZnO NWs have a uniform diameter of 45 nm. However, from the histogram they provide in Figure 1d in their article, it is clearly seen that diameters are actually distributed from 25 to 67 nm. Considering that elastic modulus depends on diameter in power four (equations (1) and (2)), we think that the use of average diameter is inappropriate, and results obtained in such a way cannot be considered reliable.
Now, we would like to bring out a few works that can be considered more reliable due to a number of factors. A good example is the work done by Agrawal et al. [36]. We consider their results to be one of the most trustable. This conclusion is based on several aspects. The authors approached very carefully evaluation of the geometry of the NWs. They measured cross-section separately for every ZnO NW used in the study in HRSEM. The measurements are performed in a tensile test configuration inside TEM. Based on the figures provided in their article NWs are of high quality with a uniform diameter. Obtained elastic moduli are very close to bulk value for NWs thicker than 100 nm and have a moderate increase of the modulus for smaller diameters. Data contains error bars. Moreover, measurements are accompanied by MD simulations that give very good agreement with their experimental data.
Another recent article we would like to mention is the work of Wang et al. [41]. Again, the authors paid attention to cross-section of NWs. They performed an uniaxial tensile test inside TEM and similar to Agrawal et al. [36] found that the measured elastic modulus was close to the bulk value for diameters above 100 nm and had a well-pronounced increase of the modulus for smaller diameters. Whereas for similar diameters, Young’s modulus of hexagonal NWs was always larger than that of cylindrical NWs by ∼10%. They attributed this effect to the different densities of point defects inherited from the growth stage [32].
One more example is the work by Roy et al. [46]. High-resolution and high-quality SEM and TEM images are provided revealing high-quality ZnO NWs with uniform diameters. Elastic modulus was measured using a resonance method and ranged from 123 to 154 GPa for NWs diameters from 78 to 310 nm, which is again very close to bulk values. No conclusion of diameter dependence can be drawn since there is only one NW that had a diameter below 100 nm.
We will not describe in detail every single work we reviewed for the graph in Figure 6. But we would like to emphasize that we found a tendency for correlation between overall quality and thoroughness of the works and reported moduli. If we look at the works that contain good quality high resolution images of NWs with uniform diameters, provided with detailed experimental descriptions, graphs containing error bars, etc., and published in reputable scientific journals, then we will mostly find that reported values of elastic modulus of ZnO NWs are close to bulk values of ZnO and generally have a tendency to increase with decreasing of diameters. Moreover, such values agree better with theoretical predictions and results of various simulations, which are analyzed in the next section.
5.2 Available simulation results
In this section, we overview and analyze available works on the simulation of elastic properties of ZnO NWs obtained by different authors using various empirical or full-principles methods (for a more detailed overview of the methods, paragraph 4.2). The reported values of simulated elastic moduli are summarized in Figure 10. Now let us compare this graph with the summary of experimentally found values presented in Figure 6. In general, values fall into a similar range showing satisfactory agreements. However, there are also some significant differences. First, we see that except a few cases, the majority of calculated values are less scattered (compared to experimental results) and have a better agreement between different works. Second, we see a drastic difference in the offset of size effect. Namely, if experimentally measured Young’s modulus tends to show diameter dependence already at diameters around 100 nm, then, in simulations, such tendency appears at around 10 nm, making one order of magnitude difference. Let’s now take a closer look at each work and then try to find possible reasons for observed disagreements.
![Figure 10
Dependence of calculated Young’s moduli (E) on NW diameters reported by different authors. The dashed magenta line at the bottom corresponds to experimentally measured bulk Young’s modulus [26]. Open symbols correspond to MD calculations, and solid symbols correspond to DFT calculations.](/document/doi/10.1515/ntrev-2022-0505/asset/graphic/j_ntrev-2022-0505_fig_010.jpg)
Dependence of calculated Young’s moduli (E) on NW diameters reported by different authors. The dashed magenta line at the bottom corresponds to experimentally measured bulk Young’s modulus [26]. Open symbols correspond to MD calculations, and solid symbols correspond to DFT calculations.
Classical MD was used in several studies where the dependence of Young’s moduli on NWs or nanobelts diameter was evaluated within the empirical force fields by Agrawal et al. [36], Hu et al. [78], Dai and Park [132], Wang et al. [133], He et al. [134], and Kulkarny et al. [126] (nanobelts). Wang et al. [133] calculated Young’s modulus of wurtzite-structured ZnO NWs of [0001] orientation at different strain rates (7.63 × 10⁷–1.52 × 10⁹) and temperatures (0.1–400 K). NWs with three different diameters (8.5, 15.6, and 35.5 Å) but the same initial length of ∼13 nm were modeled in this study employing the Buckingham potentials obtaining values in the range between 187.3 GPa (strain rate, 1.52 × 10⁹ s−1; T = 400 K and diameter 35.5 Å) and 337.0 GPa (strain rate, 7.63 × 10⁷ s−1; T = 0.1 K and diameter 8.5 Å). Curves that correspond to extreme temperatures of 0.1 and 400 K are shown in Figure 10. MD simulations for ZnO NWs under tensile loading were performed for NWs with lateral diameters of 7, 16, 25 and 40 Å by Dai et al. in 2010 [135]. Buckingham potential adopted from the study of Kulkarni et al. [126] has been used for these calculations. Young’s Modulus was obtained for ZnO NWs of all four diameters for bucked and hypothetical unbuckled [136] wurtzite (ZnO phase that according to our knowledge has not been demonstrated experimentally). Young’s moduli in the range between 48.8 and 203.6 were obtained for differently structured systems. Structural, mechanical and electronic properties of ultrathin ZnO NWs of wurtzite and unbuckled wurtzite structure with a diameter of 7.454–18.079 Å were investigated using the DFT method by Wang et al. [137]. Young’s modulus in the range of 159.5–537.6 GPa was obtained.
Dai and Park [132] have calculated the impact of surface effects on the piezoelectric properties of ZnO NWs under uniaxial loading utilizing classical MD. Bulk-normalized Young’s modulus for the three NW orientations ([2
Agrawal et al. [36] using the classical MD have modeled Young’s modulus of ZnO NWs with respect to NW diameters in the range from 5 to 20 nm. In this work, an atypical thermalization was performed in the MD calculation. The temperature of the NWs was raised to 1,200 K within 30 ps and then equilibrated for 30 ps and after that NWs were cooled down to room temperature at 30 ps and equilibrated for another 30 ps. The calculated values in this work are in best agreement with the observed experimental trends (magenta in Figure 10).
In 2017, He et al. [134] performed atomistic modeling of structural and mechanical properties of ZnO NWs using classical MD simulations with empirical Buckingham-type pair potentials. NWs with hexagonal cross-sections, lateral dimensions ranging 1–10 nm, and a constant length of 10.4 nm were considered in the study (violet line in Figure 10). It was observed that if NW diameter increases from 1.0 to 10.0 nm, then Young’s modulus decreases from about 260 to 145 GPa approaching the bulk value.
In 2008, Hu et al. [78] modeled ZnO NWs oriented along [0001] with diameters ranging from 8.707 to 47.887 Å with a Buckingham-type interatomic potential. Calculated Young’s modulus decreased with an increase of diameters from 212 to 183 GPa.
The size effect of the strain-dependent Young’s modulus of [0001] oriented ZnO NWs with a diameter ranging from 1.8 to 6.0 nm has been studied by first-principles calculations and molecular mechanics methods by Wang in ref. [139]. Young’s modulus was estimated using the higher-order elastic constants, and values in the range of 142–173 GPa were obtained.
The mechanical properties of ZnO NWs and nanobelts with lateral dimensions greater than 5 nm were studied by Momeni and Attariani [140] using MD accompanied with the Buckingham-type empirical potentials obtaining Young’s modulus in the range of 159–250 GPa for compression mode and 173–275 GPa for tension mode, correspondingly.
Young modulus of wurtzite-type ZnO NWs oriented along [0001] direction was calculated using molecular mechanical simulations with the eight-parameter partially charged rigid ion model (PCRIM) developed for ZnO by Wang at al. [141], as well as using hybrid DFT approach within the framework of the linear combination of atomic orbitals (LCAO) method [142] in ref. [143] by Bandura et al. PCRIM potentials are based on empirical fitting and energy surface fitting from ab initio calculations. Both DFT-LCAO and PCRIM reproduce ZnO lattice constants in good agreement with those experimentally observed. The NWs of 1–5 nm diameters were modeled with the hybrid DFT-LCAO method and from 1–20 nm for force-field molecular mechanical approaches, respectively. The theoretically predicted Young’s modulus for ZnO NWs is 167.4–206.2 GPa for force-field calculations and 173.6–232.2 GPa for first-principles calculations. Values of Young’s modulus decrease with the diameter increase.
Size-dependent Young’s modulus of ZnO nanoplates obtained with DFT is also reported by Zhang and Huang [144]. Calculations show an increase of Young’s moduli from 170 to 270 GPa as the size of nanoplate decreases. It should be noted that Young’s moduli vary discontinuously with size due to a phase transformation from wurtzite to graphitic structure in their simulations.
Qi et al. [145] using DFT demonstrated that the pristine and the H-passivated ZnO NWs have different Young’s modulus (164–208 GPa for non-passivated and 69–87 GPa for H-passivated NWs for similar diameters), indicating the great importance of surface layer composition and structure in overall elastic properties. However, note that the diameters of NWs in their simulations were only 0.65–2 nm making the contribution of surface atoms much more pronounced compared to typical NWs used in experimental studies.
Unexpected results were obtained by Wang and Li [146]. They developed a model of ZnO NWs with the quantitative relationship between a circular cross-section of NW and its bulk properties assuming clamped-end three-point bending loading conditions. In that work, DFT calculations were combined with the linear elasticity theory, and a value of 113.8 GPa was obtained for wurtzite phase for diameters above 100 nm. However, contrary to other studies, Young’s modulus rapidly decreased to 50 GPa with decreasing the diameter of NWs to 30 nm.
Separately, we would like to mention a few more works dedicated to ZnO nanobelts – 1D systems similar to NWs. However, care should be taken when comparing the results to NWs with a hexagonal cross-section. For this reason, we did not include results for nanobelts in the graph in Figure 10 and discuss them as supporting data.
The phase transformation of stress-induced ZnO nanobelts with the cross-sectional size of 21.15 Å × 21.33 Å was simulated by Hong et al. using MD with the Buckingham-type interatomic pair potentials in ref. [147]. Kulkarni et al. [126] have calculated the ZnO nanobelts oriented along [0001], [01
Finally, as a reference, we would like to mention a few works dedicated to the calculation of Young’s modulus of bulk wurtzite ZnO. DFT calculations for bulk modulus of wurtzite, zinc-blende, and rock salt phases of bulk ZnO using the chemical bond method are performed in ref. [83] obtaining 130 GPa with Generalized Gradient Approximation (GGA) and 161.0 GPa with local density approximation (LDA). The listed works give good agreement with the experimentally measured value of 140 GPa [26] for bulk wurtzite ZnO.
In the next section we will sum-up and briefly discuss the main factors that we believe may be responsible for the discrepancy in the calculated Young’s modulus values between various studies, as well as for disagreements between the results of simulations and experiments.
5.2.1 Surface conditions
From the analyzed works it can be clearly seen that surface conditions may play a huge role not only in obtained values but also in the observed trends. Qi et al. [145] clearly demonstrated (although for very small diameters) that surface chemistry may strongly affect the elastic properties. Besides the greatly reduced value of elastic modulus, they observed a decrease in stiffness with a decrease in diameters, which contradicts the vast majority of studies. Similar contradictive size dependence but for much larger diameters was observed Wang and Li [146]. According to the authors, this is related to the fact that they have fully relaxed ZnO surfaces with negative stresses in contrast to positive stresses for bulk-terminated surfaces. They suggest that the surface relaxation process can be affected by surface contamination or surface charges introduced during the preparation and characterization of NWs. The authors conclude that the elastic modulus of ZnO NWs with the same diameter might exhibit different values in various surface conditions of the experimental samples.
5.2.2 Structure and geometry
Theoretical simulations usually use ideal defectless monocrystals with perfect geometry, while NWs in real experiments unavoidably have defects and distorted geometries (Section 5.1.1.). Limited NW length used in first-principle calculations also can play a role.
5.2.3 Interatomic potentials
The choice of interatomic potentials or exchange-correlation functionals makes a significant contribution to obtaining the numerical values of Young’s moduli. The calculated parameters in semi-empirical approaches are often fitted to the experimental elastic constants and vibrational properties (e.g., phonons) obtained for the bulk phase, which can also have measurement errors. It is also important that empirical potentials optimized for volume properties do not necessarily describe surface properties well.
5.2.4 Temperature
While experimental measurements of elastic properties are performed mainly at room temperature, simulations based on DFT and molecular mechanics methods in analyzed studies were often performed at 0 K (more precisely, even in the absence of temperature) with no computation of thermodynamic temperature-dependent parameters, as thermodynamics requires calculations of the phonon properties, which is a quite sophisticated task in the case of 1D nanostructures. This fact can potentially contribute to disagreement between simulations and experiment to some extent, including differences in the onset of the size effect. However, based on the studies where temperatures were varied (e.g., [133]), this effect is not expected to be significant.
5.2.5 Strain rate
Strain rate is known to influence the results of mechanical tests [149]. Strain rates in real experiments with NWs can vary drastically from the timescale of seconds for quasi-static tests to fractions of microseconds for the resonance method. Timescales of simulations often do not exceed nanoseconds, which may have an effect on the result. The possible effect of strain rate can be tested in MD simulations by converging the simulation results with decreasing strain rate, i.e., decrease the rate until the results do not exhibit any significant dependence on it. Although this is a simple test, none of the referenced works has investigated it systematically.
5.2.6 Non-standard systems
Finally, we would like to note that some strongly different calculated values are associated either with consideration of non-standard systems like so-called unbuckled wurtzite NWs [136], which has not yet been found in experimental synthesis, or surface modification by hydrogen bonds at extremely small diameters [145] making the material an effectively a ZnO/H core-shell NW.
5.3 Comparison between theoretical and experimental results
Now let’s compare side by side theoretical and experimental results on the same graph leaving extreme and less reliable values out for convenience (Figure 11). If we now consider the work of Agrawal et al. [36] as a reference among experimental studies (based on the factors discussed in previous sections), we can see that their measurement results agree rather well with simulations results obtained by Momeni and Attariani [140], Bandura et al. [143], and their own simulations that they performed in the same work (Agrawal et al. [36]). For convenience, we connected the data points of Agrawal et al. [36] in Figure 11 by a dotted line. Unfortunately, many of the simulation studies are performed for small diameters only (below 5 nm). It leaves a large gap between theoretical and experimental results making it rather difficult, if not impossible, to make any reliable comparison with experimental data.
![Figure 11
Combined data for the dependence of Young’s moduli on NW diameters reported by different authors in simulations (left) and experiment (right). Dashed gray line corresponds to experimentally measured elastic modulus of bulk ZnO crystal. Dotted blue line connects data points reported by Agrawal et al. [36].](/document/doi/10.1515/ntrev-2022-0505/asset/graphic/j_ntrev-2022-0505_fig_011.jpg)
Combined data for the dependence of Young’s moduli on NW diameters reported by different authors in simulations (left) and experiment (right). Dashed gray line corresponds to experimentally measured elastic modulus of bulk ZnO crystal. Dotted blue line connects data points reported by Agrawal et al. [36].
What concerns the difference in the offset of the size effect between theory and experiment – we could not find clear and obvious reasons in the analyzed models used for simulations to blame only theory. In total, we suspect that simulations may insufficiently account for the surface stiffening effect and hence underestimate the size effect, while experiments may considerably overestimate it as was discussed in Section 5.1.3. The latter is additionally supported by the fact that experimental work by Agrawal et al. [36], who evaluated the geometry of every measured NW with hi-resolution electron microscopy, has rather a moderate size effect down to the smallest diameter they measured (20 nm).
In general, we can say that current computational methods in material science are more reliable at describing trends in the behavior of systems rather than providing accurate numerical values. Often, the evaluation of certain values, such as Young’s Modulus, is affected by existing experimental data that are attempted to be reproduced in calculations. In this case, the coincidence with the data for known systems allows for studying the trends that occur in modified systems. For example, acting within the framework of one model, we can understand how the system under study will be affected when defects appear or when the NW diameter increases, but when choosing a different design scheme, the absolute numerical values can change significantly.
6 Summary and conclusion
As a result of our analysis, we identified a number of factors that may be responsible for disagreement among the values reported for the elastic modulus of ZnO NWs by different authors. These factors include the method and conditions of synthesis that may result in a deviation from a perfect geometry and composition of the ZnO NWs, the influence of test method and boundary conditions, and the insufficiency of the microscopy resolution, which may result in significantly inaccurate measurements of the NW diameters. There can be also purely technical and human factors, but they are impossible to take into account when analyzing published works. Moreover, there can be less studied factors, e.g., the influence of electron beam irradiation when measurements are performed inside SEM or TEM. Having that many unknowns and being limited by the number of details given by the authors, we could not identify clear correlations between reported elastic moduli and particular factors in each analyzed article. Nevertheless, we found that despite drastic discrepancies among different studies, the majority of the reported moduli increase for decreasing diameter and approach the bulk values for large diameters, which is more pronounced in the works containing high-quality visual data and detailed experimental descriptions. In addition we demonstrated that errors in the diameter measurement contribute asymmetrically to the modulus values derived from the experiments, resulting in an increasingly systematic overestimation of the modulus as the diameter decreases.
Considerable discrepancy is present also between theoretical works. However, besides a few studies, for most of the simulation results situation is not as drastic as for experimental results. According to our analysis, the main factors responsible for the variations of simulation results among different authors include the choice of surface conditions, structure, geometry, interatomic potentials, temperature, and strain rate. Some strongly different calculated values are associated with non-standard systems that cannot be directly correlated with experimental results. In general, state-of-art computational methods in materials science are more reliable at describing trends in the behavior of investigated systems rather than specific numerical values.
Furthermore, the onset of the size effect in simulations appears at significantly smaller diameters compared to the experiment, which is another indication that experiments might overestimate the size effect. Therefore, our analysis gives a strong basis to conclude that the elastic modulus of good quality [0001] ZnO NWs decreases with increasing diameter, approaching the bulk values at diameters larger than a few tens of nm.
Overall, we can conclude that due to the challenges related to the small specimen sizes, the measurement techniques employed for the mechanical characterization of single nanostructures are not fully mastered by the scientific community yet, leaving space for significant errors and often leading to contradictory results. Therefore, in order to find a confident value for the elastic modulus of any nanoscale material from the literature, one should not rely upon a single study, but critically analyze at least several available experimental and theoretical works.
Acknowledgments
The authors express gratitude to Robert Zabels for the useful comments related to nanoindentation. The authors thank Sergei Piskunov, Yuri F. Zhukovskii, Sergei I. Lukyanov, Robert A. Evarestov, Andrei Bandura and Andris Gulans for stimulating discussions.
-
Funding information: The work was funded by ERA Chair MATTER from the European Union’s Horizon 2020 research and innovation programme under grant agreement No 856705 and by the Latvian Council of Science project “Core-shell nanowire heterostructures of Charge Density Wave materials for optoelectronic applications” No. lzp-2020/1-0261.
-
Author contributions: All authors have accepted responsibility for the entire content of this manuscript and approved its submission.
-
Conflict of interest: The authors state no conflict of interest.
References
[1] Zhang Y, Ram MK, Stefanakos EK, Goswami DY. Synthesis, characterization, and applications of ZnO nanowires. J Nanomater. 2012;2012:1–22.10.1155/2012/624520Search in Google Scholar
[2] Moezzi A, McDonagh AM, Cortie MB. Zinc oxide particles: Synthesis, properties and applications. Chem Eng J. 2012;185–186:1–22.10.1016/j.cej.2012.01.076Search in Google Scholar
[3] Company NJZ. Zinc oxide rediscovered. New York, USA: New Jersey Zinc Company; 1957.Search in Google Scholar
[4] Ferracane JL. Materials in dentistry: Principles and applications. Philadelphia, USA: Lippincott Williams & Wilkins; 2001.Search in Google Scholar
[5] Li Q, Chen S-L, Jiang W-C. Durability of nano ZnO antibacterial cotton fabric to sweat. J Appl Polym Sci. 2007;103:412–6.10.1002/app.24866Search in Google Scholar
[6] Völz HG, Kischkewitz J, Woditsch P, Westerhaus A, Griebler W-D, De Liedekerke M, et al. Pigments, Inorganic Ullmann’s Encyclopedia of Industrial Chemistry. Wiley-VCH Verlag GmbH & Co. KGaA; 2000.Search in Google Scholar
[7] Guedri-Knani L, Gardette JL, Jacquet M, Rivaton A. Photoprotection of poly(ethylene-naphthalate) by zinc oxide coating. Surf Coat Technol. 2004;180–181:71–5.10.1016/j.surfcoat.2003.10.039Search in Google Scholar
[8] Moustaghfir A, Tomasella E, Rivaton A, Mailhot B, Jacquet M, Gardette JL, et al. Sputtered zinc oxide coatings: structural study and application to the photoprotection of the polycarbonate. Surf Coat Technol. 2004;180–181:642–5.10.1016/j.surfcoat.2003.10.109Search in Google Scholar
[9] Zhou J, Fei P, Gao Y, Gu Y, Liu J, Bao G, et al. Mechanical−Electrical triggers and sensors using piezoelectric micowires/nanowires. Nano Lett. 2008;8:2725–30.10.1021/nl8010484Search in Google Scholar PubMed
[10] Yuan Q, Zhao Y-P, Li L, Wang T. Ab initio study of ZnO-based gas-sensing mechanisms: Surface reconstruction and charge transfer. J Phys Chem C. 2009;113:6107–13.10.1021/jp810161jSearch in Google Scholar
[11] Wan Q, Li QH, Chen YJ, Wang TH, He XL, Li JP, et al. Fabrication and ethanol sensing characteristics of ZnO nanowire gas sensors. Appl Phys Lett. 2004;84:3654–6.10.1063/1.1738932Search in Google Scholar
[12] Wang ZL, Song J. Piezoelectric nanogenerators based on zinc oxide nanowire arrays. Science. 2006;312:242–6.10.1126/science.1124005Search in Google Scholar PubMed
[13] Yang R, Qin Y, Dai L, Wang ZL. Power generation with laterally packaged piezoelectric fine wires. Nat Nanotechnol. 2009;4:34–9.10.1038/nnano.2008.314Search in Google Scholar PubMed
[14] Espinosa HD, Bernal RA, Minary-Jolandan M. A review of mechanical and electromechanical properties of piezoelectric nanowires. Adv Mater. 2012;24:4656–75.10.1002/adma.201104810Search in Google Scholar PubMed
[15] Pandey RK, Dutta J, Brahma S, Rao B, Liu C-P. Review on ZnO-based piezotronics and piezoelectric nanogenerators: aspects of piezopotential and screening effect. J Phys Mater. 2021;4:044011.10.1088/2515-7639/ac130aSearch in Google Scholar
[16] Yang Q, Guo X, Wang W, Zhang Y, Xu S, Lien DH, et al. Enhancing sensitivity of a single ZnO Micro-/nanowire photodetector by piezo-phototronic effect. ACS Nano. 2010;4:6285–91.10.1021/nn1022878Search in Google Scholar PubMed
[17] Yang Q, Wang W, Xu S, Wang ZL. Enhancing light emission of ZnO Microwire-based diodes by piezo-phototronic effect. Nano Lett. 2011;11:4012–7.10.1021/nl202619dSearch in Google Scholar PubMed
[18] Wang ZL. Piezopotential gated nanowire devices: Piezotronics and piezo-phototronics. Nano Today. 2010;5:540–52.10.1016/j.nantod.2010.10.008Search in Google Scholar
[19] Trautt Z. Elastic Moduli of Zno. Gaithersburg, USA: NIST; 2010.Search in Google Scholar
[20] Wang S, Shan Z, Huang H. The mechanical properties of nanowires. Adv Sci. 2017;4:1600332.10.1016/B978-0-12-822425-0.00079-8Search in Google Scholar
[21] Cui J. Zinc oxide nanowires. Mater Charact. 2012;64:43–52.10.1016/j.matchar.2011.11.017Search in Google Scholar
[22] Özgür Ü, Alivov YI, Liu C, Teke A, Reshchikov MA, Doğan S, et al. A comprehensive review of ZnO materials and devices. J Appl Phys. 2005;98:041301.10.1063/1.1992666Search in Google Scholar
[23] Bocharov D, Pudza I, Klementiev K, Krack M, Kuzmin A. Study of high-temperature behaviour of ZnO by ab initio molecular dynamics simulations and X-ray absorption spectroscopy. Materials. 2021;14:5206.10.3390/ma14185206Search in Google Scholar PubMed PubMed Central
[24] Wang ZL. Zinc oxide nanostructures: growth, properties and applications. J Phys Condens Matter. 2004;16:R829–58.10.1088/0953-8984/16/25/R01Search in Google Scholar
[25] Bateman TB. Elastic moduli of single-crystal zinc oxide. J Appl Phys. 1962;33:3309–12.10.1063/1.1931160Search in Google Scholar
[26] Kobiakov IB. Elastic, piezoelectric and dielectric properties of ZnO and CdS single crystals in a wide range of temperatures. Solid State Commun. 1980;35:305–10.10.1016/0038-1098(80)90502-5Search in Google Scholar
[27] Petersen EW, Likovich EM, Russell KJ, Narayanamurti V. Growth of ZnO nanowires catalyzed by size-dependent melting of Au nanoparticles. Nanotechnology. 2009;20:405603.10.1088/0957-4484/20/40/405603Search in Google Scholar PubMed
[28] Gomez JL, Tigli O. Zinc oxide nanostructures: from growth to application. J Mater Sci. 2013;48:612–24.10.1007/s10853-012-6938-5Search in Google Scholar
[29] Protasova LN, Rebrov EV, Choy KL, Pung SY, Engels V, Cabaj M, et al. ZnO based nanowires grown by chemical vapour deposition for selective hydrogenation of acetylene alcohols. Catal Sci Technol. 2011;1:768–77.10.1039/c1cy00074hSearch in Google Scholar
[30] Lim SK, Hwang SH, Kim S. Microemulsion synthesis and characterization of aluminum doped ZnO nanorods. Cryst Res Technol. 2010;45:771–5.10.1002/crat.200900647Search in Google Scholar
[31] Vahtrus M, Šutka A, Polyakov B, Oras S, Antsov M, Doebelin N, et al. Effect of cobalt doping on the mechanical properties of ZnO nanowires. Mater Charact. 2016;121:40–7.10.1016/j.matchar.2016.09.027Search in Google Scholar
[32] Cheng H-M, Chiu W-H, Lee C-H, Tsai S-Y, Hsieh W-F. Formation of branched ZnO nanowires from solvothermal method and dye-sensitized solar cells applications. J Phys Chem C. 2008;112:16359–64.10.1021/jp805239kSearch in Google Scholar
[33] Alshehri NA, Lewis AR, Pleydell-Pearce C, Maffeis TGG. Investigation of the growth parameters of hydrothermal ZnO nanowires for scale up applications. J Saudi Chem Soc. 2018;22:538–45.10.1016/j.jscs.2017.09.004Search in Google Scholar
[34] Chevalier-César C, Capochichi-Gnambodoe M, Lin F, Yu D, Leprince-Wang Y, Chevalier-César C, et al. Effect of growth time and annealing on the structural defect concentration of hydrothermally grown ZnO nanowires. AIMS Mater Sci. 2016;3:562–72.10.3934/matersci.2016.2.562Search in Google Scholar
[35] Baruah S, Mahmood MA, Myint MTZ, Bora T, Dutta J. Enhanced visible light photocatalysis through fast crystallization of zinc oxide nanorods. Beilstein J Nanotechnol. 2010;1:14–20.10.3762/bjnano.1.3Search in Google Scholar PubMed PubMed Central
[36] Agrawal R, Peng B, Gdoutos EE, Espinosa HD. Elasticity size effects in ZnO nanowires−A combined experimental-computational approach. Nano Lett. 2008;8:3668–74.10.1021/nl801724bSearch in Google Scholar PubMed
[37] Desai AV, Haque MA. Mechanical properties of ZnO nanowires. Sens Actuators Phys. 2007;134:169–76.10.1016/j.sna.2006.04.046Search in Google Scholar
[38] He M-R, Shi Y, Zhou W, Chen JW, Yan YJ, Zhu J. Diameter dependence of modulus in zinc oxide nanowires and the effect of loading mode: In situ experiments and universal core-shell approach. Appl Phys Lett. 2009;95:091912.10.1063/1.3205102Search in Google Scholar
[39] Hoffmann S, Östlund F, Michler J, Fan HJ, Zacharias M, Christiansen SH, et al. Fracture strength and Young’s modulus of ZnO nanowires. Nanotechnology. 2007;18:205503.10.1088/0957-4484/18/20/205503Search in Google Scholar
[40] Xu F, Qin Q, Mishra A, Gu Y, Zhu Y. Mechanical properties of ZnO nanowires under different loading modes. Nano Res. 2010;3:271–80.10.1007/s12274-010-1030-4Search in Google Scholar
[41] Wang X, Chen K, Zhang Y, Wan J, Warren OL, Oh J, et al. Growth conditions control the elastic and electrical properties of ZnO nanowires. Nano Lett. 2015;15:7886–92.10.1021/acs.nanolett.5b02852Search in Google Scholar PubMed
[42] Chen CQ, Shi Y, Zhang YS, Zhu J, Yan YJ. Size dependence of Young’s modulus in ZnO nanowires. Phys Rev Lett. 2006;96:075505.10.1103/PhysRevLett.96.075505Search in Google Scholar PubMed
[43] Huang Y, Bai X, Zhang Y. In situ mechanical properties of individual ZnO nanowires and the mass measurement of nanoparticles. J Phys Condens Matter. 2006;18:L179–84.10.1088/0953-8984/18/15/L03Search in Google Scholar
[44] Qin Q, Xu F, Cao Y, Ro PI, Zhu Y. Measuring true Young’s modulus of a cantilevered nanowire: Effect of clamping on resonance frequency. Small. 2012;8:2571–6.10.1002/smll.201200314Search in Google Scholar PubMed
[45] Zhou J, Lao CS, Gao P, Mai W, Hughes WL, Deng SZ, et al. Nanowire as pico-gram balance at workplace atmosphere. Solid State Commun. 2006;139:222–6.10.1016/j.ssc.2006.06.004Search in Google Scholar
[46] Roy A, Mead J, Wang S, Huang H. Effects of surface defects on the mechanical properties of ZnO nanowires. Sci Rep. 2017;7:9547.10.1038/s41598-017-09843-5Search in Google Scholar PubMed PubMed Central
[47] Fan S, Bi S, Li Q, Guo Q, Liu J, Ouyang Z, et al. Size-dependent Young’s modulus in ZnO nanowires with strong surface atomic bonds. Nanotechnology. 2018;29:125702.10.1088/1361-6528/aaa929Search in Google Scholar PubMed
[48] Manoharan MP, Desai AV, Neely G, Haque MA. Synthesis and elastic characterization of zinc oxide nanowires. J Nanomater. 2008;2008:1–7.10.1155/2008/849745Search in Google Scholar
[49] Polyakov B, Dorogin LM, Vlassov S, Kink I, Lohmus A, Romanov AE, et al. Real-time measurements of sliding friction and elastic properties of ZnO nanowires inside a scanning electron microscope. Solid State Commun. 2011;151:1244–7.10.1016/j.ssc.2011.05.045Search in Google Scholar
[50] Polyakov B, Dorogin LM, Vlassov S, Antsov M, Kulis P, Kink I, et al. In situ measurements of ultimate bending strength of CuO and ZnO nanowires. Eur Phys J B. 2012;85:366.10.1140/epjb/e2012-30430-6Search in Google Scholar
[51] Song J, Wang X, Riedo E, Wang ZL. Elastic property of vertically aligned nanowires. Nano Lett. 2005;5:1954–8.10.1021/nl051334vSearch in Google Scholar PubMed
[52] Vlassov S, Polyakov B, Oras S, Vahtrus M, Antsov M, Šutka A, et al. Complex tribomechanical characterization of ZnO nanowires: nanomanipulations supported by FEM simulations. Nanotechnology. 2016;27:335701.10.1088/0957-4484/27/33/335701Search in Google Scholar PubMed
[53] Wen B, Sader JE, Boland JJ. Mechanical properties of ZnO nanowires. Phys Rev Lett. 2008;101:175502.10.1103/PhysRevLett.101.175502Search in Google Scholar PubMed
[54] Soomro MY, Hussain I, Bano N, Broitman E, Nur O, Willander M. Nanoscale elastic modulus of single horizontal ZnO nanorod using nanoindentation experiment. Nanoscale Res Lett. 2012;7:1–5.10.1186/1556-276X-7-146Search in Google Scholar PubMed PubMed Central
[55] Jiang D, Tian C, Liu Q, Zhao M, Qin J, Hou J, et al. Young׳s modulus of individual ZnO nanowires. Mater Sci Eng A. 2014;610:1–4.10.1016/j.msea.2014.05.027Search in Google Scholar
[56] Asthana A, Momeni K, Prasad A, Yap YK, Yassar RS. In situ observation of size-scale effects on the mechanical properties of ZnO nanowires. Nanotechnology. 2011;22:265712.10.1088/0957-4484/22/26/265712Search in Google Scholar PubMed
[57] Stan G, Ciobanu CV, Parthangal PM, Cook RF. Diameter-dependent radial and tangential elastic moduli of ZnO nanowires. Nano Lett. 2007;7:3691–7.10.1021/nl071986eSearch in Google Scholar
[58] Priezzheva AN, Dorogov MV, Vlassov S, Kink I, Vikarchuk AA, Dorogin LM, et al. Elastic properties of oxide nanowhiskers prepared from electrolytically deposited copper. Russ Phys J. 2015;58:843–7.10.1007/s11182-015-0579-5Search in Google Scholar
[59] Vlassov S, Polyakov B, Vahtrus M, Mets M, Antsov M, Oras S, et al. Enhanced flexibility and electron-beam-controlled shape recovery in alumina-coated Au and Ag core–shell nanowires. Nanotechnology. 2017;28:505707.10.1088/1361-6528/aa973cSearch in Google Scholar PubMed
[60] Timoshenko S, Goodier JN. Theory of Elasticity. 2nd edn. McGraw-Hill, New York.Search in Google Scholar
[61] Antsov M, Polyakov B, Zadin V, Mets M, Oras S, Vahtrus M, et al. Mechanical characterisation of pentagonal gold nanowires in three different test configurations: A comparative study. Micron. 2019;124:102686.10.1016/j.micron.2019.102686Search in Google Scholar PubMed
[62] Polyakov B, Antsov M, Vlassov S, Dorogin LM, Vahtrus M, Zabels R, et al. Mechanical properties of sol–gel derived SiO2 nanotubes. Beilstein J Nanotechnol. 2014;5:1808–14.10.3762/bjnano.5.191Search in Google Scholar PubMed PubMed Central
[63] Hertz H. Ueber die Berührung fester elastischer Körper. J Für Reine Angew Math Crelles J. 2009;1882:156–71.10.1515/9783112342404-004Search in Google Scholar
[64] Meirovitch L. Elements of vibration analysis. New York: McGraw-Hill; 1986.Search in Google Scholar
[65] Hsin C-L, Mai W, Gu Y, Gao Y, Huang C-T, Liu Y, et al. Elastic Properties and Buckling of Silicon Nanowires. Adv Mater. 2008;20:3919–23.10.1002/adma.200800485Search in Google Scholar
[66] Buckingham RA, Lennard-Jones JE. The classical equation of state of gaseous helium, neon and argon. Proc R Soc Lond Ser Math Phys Sci. 1938;168:264–83.10.1098/rspa.1938.0173Search in Google Scholar
[67] Lennard-Jones JE. Cohesion. Proc Phys Soc. 1931;43:461–82.10.1088/0959-5309/43/5/301Search in Google Scholar
[68] Filho RNC, Alencar G, Skagerstam B-S, Andrade JS. Morse potential derived from first principles. EPL Europhys Lett. 2013;101:10009.10.1209/0295-5075/101/10009Search in Google Scholar
[69] Senftle TP, Hong S, Islam MM, Kylasa SB, Zheng Y, Shin YK, et al. The ReaxFF reactive force-field: development, applications and future directions. Npj Comput Mater. 2016;2:1–14.10.1038/npjcompumats.2015.11Search in Google Scholar
[70] Stillinger FH, Weber TA. Computer simulation of local order in condensed phases of silicon. Phys Rev B. 1985;31:5262–71.10.1103/PhysRevB.31.5262Search in Google Scholar PubMed
[71] Daw MS, Foiles SM, Baskes MI. The embedded-atom method: a review of theory and applications. Mater Sci Rep. 1993;9:251–310.10.1016/0920-2307(93)90001-USearch in Google Scholar
[72] Tersoff J. New empirical approach for the structure and energy of covalent systems. Phys Rev B. 1988;37:6991–7000.10.1103/PhysRevB.37.6991Search in Google Scholar
[73] Rajasekaran G, Kumar R, Parashar A. Tersoff potential with improved accuracy for simulating graphene in molecular dynamics environment. Mater Res Express. 2016;3:035011.10.1088/2053-1591/3/3/035011Search in Google Scholar
[74] Liang T, Shan T-R, Cheng Y-T, Devine BD, Noordhoek M, Li Y, et al. Classical atomistic simulations of surfaces and heterogeneous interfaces with the charge-optimized many body (COMB) potentials. Mater Sci Eng R Rep. 2013;74:255–79.10.1016/j.mser.2013.07.001Search in Google Scholar
[75] Shapeev AV, Bocharov D, Kuzmin A. Validation of moment tensor potentials for fcc and bcc metals using EXAFS spectra. Comput Mater Sci. 2022;210:111028.10.1016/j.commatsci.2021.111028Search in Google Scholar
[76] Jiang J-W. Parametrization of Stillinger–Weber potential based on valence force field model: application to single-layer MoS2 and black phosphorus. Nanotechnology. 2015;26:315706.10.1088/0957-4484/26/31/315706Search in Google Scholar PubMed
[77] Harun K, Salleh NA, Deghfel B, Yaakob MK, Mohamad AA. DFT + U calculations for electronic, structural, and optical properties of ZnO wurtzite structure: A review. Results Phys. 2020;16:102829.10.1016/j.rinp.2019.102829Search in Google Scholar
[78] Hu J, Liu XW, Pan BC. A study of the size-dependent elastic properties of ZnO nanowires and nanotubes. Nanotechnology. 2008;19:285710.10.1088/0957-4484/19/28/285710Search in Google Scholar PubMed
[79] Buffat P, Borel JP. Size effect on the melting temperature of gold particles. Phys Rev A. 1976;13:2287–98.10.1103/PhysRevA.13.2287Search in Google Scholar
[80] Vigonski S, Jansson V, Vlassov S, Polyakov B, Baibuz E, Oras S, et al. Au nanowire junction breakup through surface atom diffusion. Nanotechnology. 2018;29:015704.10.1088/1361-6528/aa9a1bSearch in Google Scholar PubMed
[81] Suh D-I, Byeon CC, Lee C-L. Synthesis and optical characterization of vertically grown ZnO nanowires in high crystallinity through vapor–liquid–solid growth mechanism. Appl Surf Sci. 2010;257:1454–6.10.1016/j.apsusc.2010.08.067Search in Google Scholar
[82] Kim J-Y, Cho JW, Kim SH. The characteristic of the ZnO nanowire morphology grown by the hydrothermal method on various surface-treated seed layers. Mater Lett. 2011;65:1161–4.10.1016/j.matlet.2010.10.092Search in Google Scholar
[83] Fan C, Wang Q, Li L, Zhang S, Zhu Y, Zhang X, et al. Bulk moduli of wurtzite, zinc-blende, and rocksalt phases of ZnO from chemical bond method and density functional theory. Appl Phys Lett. 2008;92:101917.10.1063/1.2895635Search in Google Scholar
[84] Bhat SS, Waghmare UV, Ramamurty U. Effect of oxygen vacancies on the elastic properties of zinc oxide: A first-principles investigation. Comput Mater Sci. 2015;99:133–7.10.1016/j.commatsci.2014.12.005Search in Google Scholar
[85] Duncan KL, Wang Y, Bishop SR, Ebrahimi F, Wachsman ED. Role of point defects in the physical properties of fluorite oxides. J Am Ceram Soc. 2006;89:3162–6.10.1111/j.1551-2916.2006.01193.xSearch in Google Scholar
[86] Morkoç H, Özgür Ü. Zinc oxide: fundamentals, materials and device technology. Weinheim: Wiley-VCH; 2009.10.1002/9783527623945Search in Google Scholar
[87] Khranovskyy V, Glushenkov AM, Chen Y, Khalid A, Zhang H, Hultman L, et al. Crystal phase engineered quantum wells in ZnO nanowires. Nanotechnology. 2013;24:215202.10.1088/0957-4484/24/21/215202Search in Google Scholar PubMed
[88] Dunaevskiy M, Geydt P, Lähderanta E, Alekseev P, Haggrén T, Kakko J-P, et al. Young’s modulus of wurtzite and zinc blende InP nanowires. Nano Lett. 2017;17:3441–6.10.1021/acs.nanolett.7b00312Search in Google Scholar PubMed
[89] Broitman E, Soomro MY, Lu J, Willander M, Hultman L. Nanoscale piezoelectric response of ZnO nanowires measured using a nanoindentation technique. Phys Chem Chem Phys. 2013;15:11113–8.10.1039/c3cp50915jSearch in Google Scholar PubMed
[90] Chen L, Lu W, Lieber CM. Semiconductor nanowire growth and integration. In: Lu W, Xiang J, editors. RSC Smart Materials. Cambridge: Royal Society of Chemistry; 2014 Chapter 1. p. 1–53.10.1039/9781782625209-00001Search in Google Scholar
[91] Liu XJ, Li JW, Zhou ZF, Yang LW, Ma ZS, Xie GF, et al. Size-induced elastic stiffening of ZnO nanostructures: Skin-depth energy pinning. Appl Phys Lett. 2009;94:131902.10.1063/1.3109786Search in Google Scholar
[92] Pokropivny V. Introduction to nanomaterials and nanotechnology. Tartu: Tartu University Press; 2007.Search in Google Scholar
[93] Miller RE, Shenoy VB. Size-dependent elastic properties of nanosized structural elements. Nanotechnology. 2000;11:139–47.10.1088/0957-4484/11/3/301Search in Google Scholar
[94] Li J, Lei X, Ding J, Gao Z, Wang H, Shi Y. Surface effect on size dependent Young’s modulus of nanowires: Exponentially decreased surface elasticity model. Mater Lett. 2022;307:131001.10.1016/j.matlet.2021.131001Search in Google Scholar
[95] Nowick AS, Berry BS. Dedication. Anelastic relaxation in crystalline solids. New York, USA: Academic Press; 1972.Search in Google Scholar
[96] Zheng X, Zhu L. Theoretical analysis of electric field effect on Young’s modulus of nanowires. Appl Phys Lett. 2006;89:153110.10.1063/1.2358848Search in Google Scholar
[97] IEEE Standard on Piezoelectricity Standards Committee of the IEEE Ultrasonics, Ferroelectrics, and Frequency Control Society IEEE Standards Board American National Standards Institute, Standard 176-1987, 1987.Search in Google Scholar
[98] Maranganti R, Sharma ND, Sharma P. Electromechanical coupling in nonpiezoelectric materials due to nanoscale nonlocal size effects: Green’s function solutions and embedded inclusions. Phys Rev B. 2006;74:014110.10.1103/PhysRevB.74.014110Search in Google Scholar
[99] Martin RM. Elastic properties of ZnS structure semiconductors. Phys Rev B. 1970;1:4005–11.10.1103/PhysRevB.1.4005Search in Google Scholar
[100] Martin RM. Relation between elastic tensors of wurtzite and zinc-blende structure materials. Phys Rev B. 1972;6:4546–53.10.1103/PhysRevB.6.4546Search in Google Scholar
[101] Phillips JC, Van Vechten JA. Charge redistribution and piezoelectric constants. Phys Rev Lett. 1969;23:1115–7.10.1103/PhysRevLett.23.1115Search in Google Scholar
[102] Zhou P, Wu C, Li X. Three-point bending Young’s modulus of nanowires. Meas Sci Technol. 2008;19:115703.10.1088/0957-0233/19/11/115703Search in Google Scholar
[103] Chang N-K, Lin Y-S, Chen C-Y, Chang S-H. Size effect of indenter on determining modulus of nanowires using nanoindentation technique. Thin Solid Films. 2009;517:3695–7.10.1016/j.tsf.2009.01.094Search in Google Scholar
[104] Kim Y-J, Son K, Choi I-C, Choi I-S, Park WI, Jang J. Exploring nanomechanical behavior of silicon nanowires: AFM bending versus nanoindentation. Adv Funct Mater. 2011;21:279–86.10.1002/adfm.201001471Search in Google Scholar
[105] Cleveland JP, Manne S, Bocek D, Hansma PK. A nondestructive method for determining the spring constant of cantilevers for scanning force microscopy. Rev Sci Instrum. 1993;64:403–5.10.1063/1.1144209Search in Google Scholar
[106] Sader JE, Larson I, Mulvaney P, White LR. Method for the calibration of atomic force microscope cantilevers. Rev Sci Instrum. 1995;66:3789–98.10.1063/1.1145439Search in Google Scholar
[107] Sader JE, Chon JWM, Mulvaney P. Calibration of rectangular atomic force microscope cantilevers. Rev Sci Instrum. 1999;70:3967–9.10.1063/1.1150021Search in Google Scholar
[108] Hutter JL, Bechhoefer J. Calibration of atomic‐force microscope tips. Rev Sci Instrum. 1993;64:1868–73.10.1063/1.1143970Search in Google Scholar
[109] Butt H-J, Jaschke M. Calculation of thermal noise in atomic force microscopy. Nanotechnology. 1995;6:1.10.1088/0957-4484/6/1/001Search in Google Scholar
[110] Sader JE, Sanelli JA, Adamson BD, Monty JP, Wei X, Crawford SA, et al. Spring constant calibration of atomic force microscope cantilevers of arbitrary shape. Rev Sci Instrum. 2012;83:103705.10.1063/1.4757398Search in Google Scholar PubMed
[111] Clifford CA, Seah MP. The determination of atomic force microscope cantilever spring constants via dimensional methods for nanomechanical analysis. Nanotechnology. 2005;16:1666.10.1088/0957-4484/16/9/044Search in Google Scholar
[112] Neumeister JM, Ducker WA. Lateral, normal, and longitudinal spring constants of atomic force microscopy cantilevers. Rev Sci Instrum. 1994;65:2527–31.10.1063/1.1144646Search in Google Scholar
[113] Hazel JL, Tsukruk VV. Friction force microscopy measurements: Normal and torsional spring constants for V-shaped cantilevers. J Tribol. 1998;120:814–9.10.1115/1.2833784Search in Google Scholar
[114] Pettersson T, Nordgren N, Rutland MW, Feiler A. Comparison of different methods to calibrate torsional spring constant and photodetector for atomic force microscopy friction measurements in air and liquid. Rev Sci Instrum. 2007;78:093702.10.1063/1.2779215Search in Google Scholar PubMed
[115] Mendels D-A, Lowe M, Cuenat A, Cain MG, Vallejo E, Ellis D, et al. Dynamic properties of AFM cantilevers and the calibration of their spring constants. J Micromech Microeng. 2006;16:1720.10.1088/0960-1317/16/8/037Search in Google Scholar
[116] Stark RW, Drobek T, Heckl WM. Thermomechanical noise of a free v-shaped cantilever for atomic-force microscopy. Ultramicroscopy. 2001;86:207–15.10.1016/S0304-3991(00)00077-2Search in Google Scholar PubMed
[117] Butt H-J, Siedle P, Seifert K, Fendler K, Seeger T, Bamberg E, et al. Scan speed limit in atomic force microscopy. J Microsc. 1993;169:75–84.10.1111/j.1365-2818.1993.tb03280.xSearch in Google Scholar
[118] Hazel JL, Tsukruk VV. Spring constants of composite ceramic/gold cantilevers for scanning probe microscopy. Thin Solid Films. 1999;339:249–57.10.1016/S0040-6090(98)00961-4Search in Google Scholar
[119] Senden T, Ducker W. Experimental determination of spring constants in atomic force microscopy. Langmuir. 1994;10:1003–4.10.1021/la00016a600Search in Google Scholar
[120] Cumpson PJ, Hedley J, Zhdan P. Accurate force measurement in the atomic force microscope: a microfabricated array of reference springs for easy cantilever calibration. Nanotechnology. 2003;14:918.10.1088/0957-4484/14/8/314Search in Google Scholar
[121] Holbery JD, Eden VL, Sarikaya M, Fisher RM. Experimental determination of scanning probe microscope cantilever spring constants utilizing a nanoindentation apparatus. Rev Sci Instrum. 2000;71:3769–76.10.1063/1.1289509Search in Google Scholar
[122] Gibson CT, Smith DA, Roberts CJ. Calibration of silicon atomic force microscope cantilevers. Nanotechnology. 2005;16:234.10.1088/0957-4484/16/2/009Search in Google Scholar PubMed
[123] Burnham NA, Chen X, Hodges CS, Matei GA, Thoreson EJ, Roberts CJ, et al. Comparison of calibration methods for atomic-force microscopy cantilevers. Nanotechnology. 2003;14:1.10.1088/0957-4484/14/1/301Search in Google Scholar
[124] Roy A, Ju S, Wang S, Huang H. Temperature dependent Young’s modulus of ZnO nanowires. Nanotechnology. 2019;30:065705.10.1088/1361-6528/aaf182Search in Google Scholar PubMed
[125] Aisida SO, Obodo RM, Arshad M, Mahmood I, Ahmad I, Ezema FI, et al. Irradiation-induced structural changes in ZnO nanowires. Nucl Instrum Methods Phys Res Sect B Beam Interact Mater At. 2019;458:61–71.10.1016/j.nimb.2019.07.041Search in Google Scholar
[126] Kulkarni AJ, Zhou M, Ke FJ. Orientation and size dependence of the elastic properties of zinc oxide nanobelts. Nanotechnology. 2005;16:2749–56.10.1088/0957-4484/16/12/001Search in Google Scholar
[127] Binks DJ. Computational modelling of zinc oxide and related oxide ceramics. doctoral. Doctoral thesis. Guildford, United Kingdom: University of Surrey; 1994.Search in Google Scholar
[128] Usseinov AB, Kotomin EA, Akilbekov AT, Zhukovskii YF, Purans J. Hydrogen induced metallization of ZnO (11̅00) surface: Ab initio study. Thin Solid Films. 2014;553:38–42.10.1016/j.tsf.2013.11.021Search in Google Scholar
[129] Cardarelli F. Materials handbook: A concise desktop reference. London: Springer-Verlag; 2008.Search in Google Scholar
[130] Petrovic JJ, Milewski JV, Rohr DL, Gac FD. Tensile mechanical properties of SiC whiskers. J Mater Sci. 1985;20:1167–77.10.1007/BF01026310Search in Google Scholar
[131] Rauscher H, Roebben G. European Commission, Joint Research Centre, Institute for Health and Consumer Protection, European Commission, Joint Research Centre, Institute for Reference Materials and Measurements, European Commission, Joint Research Centre, and Institute for Environment and Sustainability. Considerations on a definition of nanomaterial for regulatory purposes. Luxembourg: Publications Office; 2010.Search in Google Scholar
[132] Dai S, Park HS. Surface effects on the piezoelectricity of ZnO nanowires. J Mech Phys Solids. 2013;61:385–97.10.1016/j.jmps.2012.10.003Search in Google Scholar
[133] Wang W, Pi Z, Lei F, Lu Y. Understanding the tensile behaviors of ultra-thin ZnO nanowires via molecular dynamics simulations. AIP Adv. 2016;6:035111.10.1063/1.4944499Search in Google Scholar
[134] He J, Wu J, Nagao S, Qiao L, Zhang Z. Size-dependent phase transformation and fracture of ZnO nanowires. Procedia IUTAM. 2017;21:86–93.10.1016/j.piutam.2017.03.041Search in Google Scholar
[135] Dai L, Cheong WCD, Sow CH, Lim CT, Tan VBC. Molecular dynamics simulation of ZnO nanowires: Size effects, defects, and super ductility. Langmuir. 2010;26:1165–71.10.1021/la9022739Search in Google Scholar PubMed
[136] Sarasamak K, Kulkarni AJ, Zhou M, Limpijumnong S. Stability of wurtzite, unbuckled wurtzite, and rocksalt phases of SiC, GaN, InN, ZnO, and CdSe under loading of different triaxialities. Phys Rev B. 2008;77:024104.10.1103/PhysRevB.77.024104Search in Google Scholar
[137] Wang B, Zhao J, Jia J, Shi D, Wan J, Wang G. Structural, mechanical, and electronic properties of ultrathin ZnO nanowires. Appl Phys Lett. 2008;93:021918.10.1063/1.2951617Search in Google Scholar
[138] Lee W-J, Chang J-G, Ju S-P, Weng M-H, Lee C-H. Structure-dependent mechanical properties of ultrathin zinc oxide nanowires. Nanoscale Res Lett. 2011;6:352.10.1186/1556-276X-6-352Search in Google Scholar PubMed PubMed Central
[139] Wang X, Gu Y, Sun X, Wang H, Zhang Y. Third-order elastic constants of ZnO and size effect in ZnO nanowires. J Appl Phys. 2014;115:213516.10.1063/1.4881775Search in Google Scholar
[140] Momeni K, Attariani H. Electromechanical properties of 1D ZnO nanostructures: nanopiezotronics building blocks, surface and size-scale effects. Phys Chem Chem Phys. 2014;16:4522–7.10.1039/C3CP54456GSearch in Google Scholar PubMed
[141] Wang S, Fan Z, Koster RS, Fang C, Van Huis MA, Yalcin AO, et al. New ab initio based pair potential for accurate simulation of phase transitions in ZnO. J Phys Chem C. 2014;118:11050–61.10.1021/jp411308zSearch in Google Scholar
[142] Evarestov RA. Hartree–Fock LCAO method for periodic systems. Quantum Chemistry of Solids: LCAO Treatment of Crystals and Nanostructures Springer Series. Solid-State Sciences ed R A Evarestov. Berlin, Heidelberg: Springer; 2012. p. 109–55.10.1007/978-3-642-30356-2_4Search in Google Scholar
[143] Bandura AV, Evarestov RA, Lukyanov SI, Piskunov S, Zhukovskii YF. Simulation of Young’s moduli for hexagonal ZnO [0 0 0 1]-oriented nanowires: first principles and molecular mechanical calculations. Mater Res Express. 2017;4:085014.10.1088/2053-1591/aa7732Search in Google Scholar
[144] Zhang L, Huang H. Young’s moduli of ZnO nanoplates: Ab initio determinations. Appl Phys Lett. 2006;89:183111.10.1063/1.2374856Search in Google Scholar
[145] Qi J, Shi D, Wang B. Different mechanical properties of the pristine and hydrogen passivated ZnO nanowires. Comput Mater Sci. 2009;46:303–6.10.1016/j.commatsci.2009.03.006Search in Google Scholar
[146] Wang G, Li X. Predicting Young’s modulus of nanowires from first-principles calculations on their surface and bulk materials. J Appl Phys. 2008;104:113517.10.1063/1.3033634Search in Google Scholar
[147] Hong Z-H, Fang T-H, Hwang S-F. Phase transformation of stress-induced zinc oxide nanobelts using molecular dynamics. Comput Mater Sci. 2011;50:1944–50.10.1016/j.commatsci.2011.01.049Search in Google Scholar
[148] Qi J, Shi D, Jia J. First-principles studies of the electronic and mechanical properties of ZnO nanobelts with different dominant surfaces. Nanotechnology. 2008;19:435707.10.1088/0957-4484/19/43/435707Search in Google Scholar PubMed
[149] Lu L, Li SX, Lu K. An abnormal strain rate effect on tensile behavior in nanocrystalline copper. Scr Mater. 2001;45:1163–9.10.1016/S1359-6462(01)01138-1Search in Google Scholar
© 2023 the author(s), published by De Gruyter
This work is licensed under the Creative Commons Attribution 4.0 International License.
Articles in the same Issue
- Research Articles
- Preparation of CdS–Ag2S nanocomposites by ultrasound-assisted UV photolysis treatment and its visible light photocatalysis activity
- Significance of nanoparticle radius and inter-particle spacing toward the radiative water-based alumina nanofluid flow over a rotating disk
- Aptamer-based detection of serotonin based on the rapid in situ synthesis of colorimetric gold nanoparticles
- Investigation of the nucleation and growth behavior of Ti2AlC and Ti3AlC nano-precipitates in TiAl alloys
- Dynamic recrystallization behavior and nucleation mechanism of dual-scale SiCp/A356 composites processed by P/M method
- High mechanical performance of 3-aminopropyl triethoxy silane/epoxy cured in a sandwich construction of 3D carbon felts foam and woven basalt fibers
- Applying solution of spray polyurea elastomer in asphalt binder: Feasibility analysis and DSR study based on the MSCR and LAS tests
- Study on the chronic toxicity and carcinogenicity of iron-based bioabsorbable stents
- Influence of microalloying with B on the microstructure and properties of brazed joints with Ag–Cu–Zn–Sn filler metal
- Thermohydraulic performance of thermal system integrated with twisted turbulator inserts using ternary hybrid nanofluids
- Study of mechanical properties of epoxy/graphene and epoxy/halloysite nanocomposites
- Effects of CaO addition on the CuW composite containing micro- and nano-sized tungsten particles synthesized via aluminothermic coupling with silicothermic reduction
- Cu and Al2O3-based hybrid nanofluid flow through a porous cavity
- Design of functional vancomycin-embedded bio-derived extracellular matrix hydrogels for repairing infectious bone defects
- Study on nanocrystalline coating prepared by electro-spraying 316L metal wire and its corrosion performance
- Axial compression performance of CFST columns reinforced by ultra-high-performance nano-concrete under long-term loading
- Tungsten trioxide nanocomposite for conventional soliton and noise-like pulse generation in anomalous dispersion laser cavity
- Microstructure and electrical contact behavior of the nano-yttria-modified Cu-Al2O3/30Mo/3SiC composite
- Melting rheology in thermally stratified graphene-mineral oil reservoir (third-grade nanofluid) with slip condition
- Re-examination of nonlinear vibration and nonlinear bending of porous sandwich cylindrical panels reinforced by graphene platelets
- Parametric simulation of hybrid nanofluid flow consisting of cobalt ferrite nanoparticles with second-order slip and variable viscosity over an extending surface
- Chitosan-capped silver nanoparticles with potent and selective intrinsic activity against the breast cancer cells
- Multi-core/shell SiO2@Al2O3 nanostructures deposited on Ti3AlC2 to enhance high-temperature stability and microwave absorption properties
- Solution-processed Bi2S3/BiVO4/TiO2 ternary heterojunction photoanode with enhanced photoelectrochemical performance
- Electroporation effect of ZnO nanoarrays under low voltage for water disinfection
- NIR-II window absorbing graphene oxide-coated gold nanorods and graphene quantum dot-coupled gold nanorods for photothermal cancer therapy
- Nonlinear three-dimensional stability characteristics of geometrically imperfect nanoshells under axial compression and surface residual stress
- Investigation of different nanoparticles properties on the thermal conductivity and viscosity of nanofluids by molecular dynamics simulation
- Optimized Cu2O-{100} facet for generation of different reactive oxidative species via peroxymonosulfate activation at specific pH values to efficient acetaminophen removal
- Brownian and thermal diffusivity impact due to the Maxwell nanofluid (graphene/engine oil) flow with motile microorganisms and Joule heating
- Appraising the dielectric properties and the effectiveness of electromagnetic shielding of graphene reinforced silicone rubber nanocomposite
- Synthesis of Ag and Cu nanoparticles by plasma discharge in inorganic salt solutions
- Low-cost and large-scale preparation of ultrafine TiO2@C hybrids for high-performance degradation of methyl orange and formaldehyde under visible light
- Utilization of waste glass with natural pozzolan in the production of self-glazed glass-ceramic materials
- Mechanical performance of date palm fiber-reinforced concrete modified with nano-activated carbon
- Melting point of dried gold nanoparticles prepared with ultrasonic spray pyrolysis and lyophilisation
- Graphene nanofibers: A modern approach towards tailored gypsum composites
- Role of localized magnetic field in vortex generation in tri-hybrid nanofluid flow: A numerical approach
- Intelligent computing for the double-diffusive peristaltic rheology of magneto couple stress nanomaterials
- Bioconvection transport of upper convected Maxwell nanoliquid with gyrotactic microorganism, nonlinear thermal radiation, and chemical reaction
- 3D printing of porous Ti6Al4V bone tissue engineering scaffold and surface anodization preparation of nanotubes to enhance its biological property
- Bioinspired ferromagnetic CoFe2O4 nanoparticles: Potential pharmaceutical and medical applications
- Significance of gyrotactic microorganisms on the MHD tangent hyperbolic nanofluid flow across an elastic slender surface: Numerical analysis
- Performance of polycarboxylate superplasticisers in seawater-blended cement: Effect from chemical structure and nano modification
- Entropy minimization of GO–Ag/KO cross-hybrid nanofluid over a convectively heated surface
- Oxygen plasma assisted room temperature bonding for manufacturing SU-8 polymer micro/nanoscale nozzle
- Performance and mechanism of CO2 reduction by DBD-coupled mesoporous SiO2
- Polyarylene ether nitrile dielectric films modified by HNTs@PDA hybrids for high-temperature resistant organic electronics field
- Exploration of generalized two-phase free convection magnetohydrodynamic flow of dusty tetra-hybrid Casson nanofluid between parallel microplates
- Hygrothermal bending analysis of sandwich nanoplates with FG porous core and piezomagnetic faces via nonlocal strain gradient theory
- Design and optimization of a TiO2/RGO-supported epoxy multilayer microwave absorber by the modified local best particle swarm optimization algorithm
- Mechanical properties and frost resistance of recycled brick aggregate concrete modified by nano-SiO2
- Self-template synthesis of hollow flower-like NiCo2O4 nanoparticles as an efficient bifunctional catalyst for oxygen reduction and oxygen evolution in alkaline media
- High-performance wearable flexible strain sensors based on an AgNWs/rGO/TPU electrospun nanofiber film for monitoring human activities
- High-performance lithium–selenium batteries enabled by nitrogen-doped porous carbon from peanut meal
- Investigating effects of Lorentz forces and convective heating on ternary hybrid nanofluid flow over a curved surface using homotopy analysis method
- Exploring the potential of biogenic magnesium oxide nanoparticles for cytotoxicity: In vitro and in silico studies on HCT116 and HT29 cells and DPPH radical scavenging
- Enhanced visible-light-driven photocatalytic degradation of azo dyes by heteroatom-doped nickel tungstate nanoparticles
- A facile method to synthesize nZVI-doped polypyrrole-based carbon nanotube for Ag(i) removal
- Improved osseointegration of dental titanium implants by TiO2 nanotube arrays with self-assembled recombinant IGF-1 in type 2 diabetes mellitus rat model
- Functionalized SWCNTs@Ag–TiO2 nanocomposites induce ROS-mediated apoptosis and autophagy in liver cancer cells
- Triboelectric nanogenerator based on a water droplet spring with a concave spherical surface for harvesting wave energy and detecting pressure
- A mathematical approach for modeling the blood flow containing nanoparticles by employing the Buongiorno’s model
- Molecular dynamics study on dynamic interlayer friction of graphene and its strain effect
- Induction of apoptosis and autophagy via regulation of AKT and JNK mitogen-activated protein kinase pathways in breast cancer cell lines exposed to gold nanoparticles loaded with TNF-α and combined with doxorubicin
- Effect of PVA fibers on durability of nano-SiO2-reinforced cement-based composites subjected to wet-thermal and chloride salt-coupled environment
- Effect of polyvinyl alcohol fibers on mechanical properties of nano-SiO2-reinforced geopolymer composites under a complex environment
- In vitro studies of titanium dioxide nanoparticles modified with glutathione as a potential drug delivery system
- Comparative investigations of Ag/H2O nanofluid and Ag-CuO/H2O hybrid nanofluid with Darcy-Forchheimer flow over a curved surface
- Study on deformation characteristics of multi-pass continuous drawing of micro copper wire based on crystal plasticity finite element method
- Properties of ultra-high-performance self-compacting fiber-reinforced concrete modified with nanomaterials
- Prediction of lap shear strength of GNP and TiO2/epoxy nanocomposite adhesives
- A novel exploration of how localized magnetic field affects vortex generation of trihybrid nanofluids
- Fabrication and physicochemical characterization of copper oxide–pyrrhotite nanocomposites for the cytotoxic effects on HepG2 cells and the mechanism
- Thermal radiative flow of cross nanofluid due to a stretched cylinder containing microorganisms
- In vitro study of the biphasic calcium phosphate/chitosan hybrid biomaterial scaffold fabricated via solvent casting and evaporation technique for bone regeneration
- Insights into the thermal characteristics and dynamics of stagnant blood conveying titanium oxide, alumina, and silver nanoparticles subject to Lorentz force and internal heating over a curved surface
- Effects of nano-SiO2 additives on carbon fiber-reinforced fly ash–slag geopolymer composites performance: Workability, mechanical properties, and microstructure
- Energy bandgap and thermal characteristics of non-Darcian MHD rotating hybridity nanofluid thin film flow: Nanotechnology application
- Green synthesis and characterization of ginger-extract-based oxali-palladium nanoparticles for colorectal cancer: Downregulation of REG4 and apoptosis induction
- Abnormal evolution of resistivity and microstructure of annealed Ag nanoparticles/Ag–Mo films
- Preparation of water-based dextran-coated Fe3O4 magnetic fluid for magnetic hyperthermia
- Statistical investigations and morphological aspects of cross-rheological material suspended in transportation of alumina, silica, titanium, and ethylene glycol via the Galerkin algorithm
- Effect of CNT film interleaves on the flexural properties and strength after impact of CFRP composites
- Self-assembled nanoscale entities: Preparative process optimization, payload release, and enhanced bioavailability of thymoquinone natural product
- Structure–mechanical property relationships of 3D-printed porous polydimethylsiloxane films
- Nonlinear thermal radiation and the slip effect on a 3D bioconvection flow of the Casson nanofluid in a rotating frame via a homotopy analysis mechanism
- Residual mechanical properties of concrete incorporated with nano supplementary cementitious materials exposed to elevated temperature
- Time-independent three-dimensional flow of a water-based hybrid nanofluid past a Riga plate with slips and convective conditions: A homotopic solution
- Lightweight and high-strength polyarylene ether nitrile-based composites for efficient electromagnetic interference shielding
- Review Articles
- Recycling waste sources into nanocomposites of graphene materials: Overview from an energy-focused perspective
- Hybrid nanofiller reinforcement in thermoset and biothermoset applications: A review
- Current state-of-the-art review of nanotechnology-based therapeutics for viral pandemics: Special attention to COVID-19
- Solid lipid nanoparticles for targeted natural and synthetic drugs delivery in high-incidence cancers, and other diseases: Roles of preparation methods, lipid composition, transitional stability, and release profiles in nanocarriers’ development
- Critical review on experimental and theoretical studies of elastic properties of wurtzite-structured ZnO nanowires
- Polyurea micro-/nano-capsule applications in construction industry: A review
- A comprehensive review and clinical guide to molecular and serological diagnostic tests and future development: In vitro diagnostic testing for COVID-19
- Recent advances in electrocatalytic oxidation of 5-hydroxymethylfurfural to 2,5-furandicarboxylic acid: Mechanism, catalyst, coupling system
- Research progress and prospect of silica-based polymer nanofluids in enhanced oil recovery
- Review of the pharmacokinetics of nanodrugs
- Engineered nanoflowers, nanotrees, nanostars, nanodendrites, and nanoleaves for biomedical applications
- Research progress of biopolymers combined with stem cells in the repair of intrauterine adhesions
- Progress in FEM modeling on mechanical and electromechanical properties of carbon nanotube cement-based composites
- Antifouling induced by surface wettability of poly(dimethyl siloxane) and its nanocomposites
- TiO2 aerogel composite high-efficiency photocatalysts for environmental treatment and hydrogen energy production
- Structural properties of alumina surfaces and their roles in the synthesis of environmentally persistent free radicals (EPFRs)
- Nanoparticles for the potential treatment of Alzheimer’s disease: A physiopathological approach
- Current status of synthesis and consolidation strategies for thermo-resistant nanoalloys and their general applications
- Recent research progress on the stimuli-responsive smart membrane: A review
- Dispersion of carbon nanotubes in aqueous cementitious materials: A review
- Applications of DNA tetrahedron nanostructure in cancer diagnosis and anticancer drugs delivery
- Magnetic nanoparticles in 3D-printed scaffolds for biomedical applications
- An overview of the synthesis of silicon carbide–boron carbide composite powders
- Organolead halide perovskites: Synthetic routes, structural features, and their potential in the development of photovoltaic
- Recent advancements in nanotechnology application on wood and bamboo materials: A review
- Application of aptamer-functionalized nanomaterials in molecular imaging of tumors
- Recent progress on corrosion mechanisms of graphene-reinforced metal matrix composites
- Research progress on preparation, modification, and application of phenolic aerogel
- Application of nanomaterials in early diagnosis of cancer
- Plant mediated-green synthesis of zinc oxide nanoparticles: An insight into biomedical applications
- Recent developments in terahertz quantum cascade lasers for practical applications
- Recent progress in dielectric/metal/dielectric electrodes for foldable light-emitting devices
- Nanocoatings for ballistic applications: A review
- A mini-review on MoS2 membrane for water desalination: Recent development and challenges
- Recent updates in nanotechnological advances for wound healing: A narrative review
- Recent advances in DNA nanomaterials for cancer diagnosis and treatment
- Electrochemical micro- and nanobiosensors for in vivo reactive oxygen/nitrogen species measurement in the brain
- Advances in organic–inorganic nanocomposites for cancer imaging and therapy
- Advancements in aluminum matrix composites reinforced with carbides and graphene: A comprehensive review
- Modification effects of nanosilica on asphalt binders: A review
- Decellularized extracellular matrix as a promising biomaterial for musculoskeletal tissue regeneration
- Review of the sol–gel method in preparing nano TiO2 for advanced oxidation process
- Micro/nano manufacturing aircraft surface with anti-icing and deicing performances: An overview
- Cell type-targeting nanoparticles in treating central nervous system diseases: Challenges and hopes
- An overview of hydrogen production from Al-based materials
- A review of application, modification, and prospect of melamine foam
- A review of the performance of fibre-reinforced composite laminates with carbon nanotubes
- Research on AFM tip-related nanofabrication of two-dimensional materials
- Advances in phase change building materials: An overview
- Development of graphene and graphene quantum dots toward biomedical engineering applications: A review
- Nanoremediation approaches for the mitigation of heavy metal contamination in vegetables: An overview
- Photodynamic therapy empowered by nanotechnology for oral and dental science: Progress and perspectives
- Biosynthesis of metal nanoparticles: Bioreduction and biomineralization
- Current diagnostic and therapeutic approaches for severe acute respiratory syndrome coronavirus-2 (SARS-COV-2) and the role of nanomaterial-based theragnosis in combating the pandemic
- Application of two-dimensional black phosphorus material in wound healing
- Special Issue on Advanced Nanomaterials and Composites for Energy Conversion and Storage - Part I
- Helical fluorinated carbon nanotubes/iron(iii) fluoride hybrid with multilevel transportation channels and rich active sites for lithium/fluorinated carbon primary battery
- The progress of cathode materials in aqueous zinc-ion batteries
- Special Issue on Advanced Nanomaterials for Carbon Capture, Environment and Utilization for Energy Sustainability - Part I
- Effect of polypropylene fiber and nano-silica on the compressive strength and frost resistance of recycled brick aggregate concrete
- Mechanochemical design of nanomaterials for catalytic applications with a benign-by-design focus