Improved GA for construction progress and cost management in construction projects
-
Xudong Wang


Abstract
The construction progress and cost management (CPCM) of construction projects are key areas that need to be focused on when formulating construction plans and conducting on-site commands. A CPCM method is proposed based on the standard genetic algorithm. During the process, a serial operation strategy is introduced, a project valuation function is defined, and a CPCM resource library is constructed. The tangent function is used to simulate the key relationships in the construction process, and finally, the construction progress and cost are compressed and optimized. The experimental results indicate that in optimal fitness tests on the construction engineering cost standards (CECS) dataset, the proposed method reaches the upper limit of 20.9 in just 23 generations, 66.67% faster than multi-stage genetic algorithm’s (MGA’s) 72 generations and 51.06% faster than quantum genetic algorithm’s (QGA’s) 47 generations. For the building engineering dataset (BED) dataset, it achieves the upper limit of 21.2 in 30 generations, 33.33% faster than MGA’s 45 generations and 49.18% faster than QGA’s 61 generations. In MSE change tests, the proposed method’s MSE fluctuates within a range of 0.04 after 22 and 23 generations for the CECS and BED datasets, respectively, which is more stable than MGA and QGA. Additionally, when the number of engineering steps increases from 5 to 25, the calculation time of the proposed method increases by less than 30 s, demonstrating higher computational efficiency than that of MGA and QGA. When conducting cost compression, the research method generates a plan that reduced construction costs by 230 k yuan. This indicates that the research method has good computational efficiency and can effectively generate the reference of project construction cost management plans.
1 Introduction
In construction projects, construction progress and cost management (CPCM) are crucial tasks, and effective schedule cost management can improve project efficiency and economy, reduce cost and time waste [1,2]. The complexity of construction projects leads to the impact of multiple factors on construction progress and costs, such as resource allocation, task priority, and duration constraints, making it difficult to accurately plan and manage [3]. Traditional methods have certain limitations when considering interdependence and resource constraints between tasks, which cannot fully solve practical problems [4]. Genetic algorithm (GA) is an optimization algorithm based on biological evolution theory. It searches for the optimal solution by simulating the process of natural selection, crossover, and mutation [5]. The use of serial operations (SOs) and project valuation functions can comprehensively consider construction progress and costs, ensuring that the project is completed within a reasonable time and cost range. In this context, a project CPCM method based on improved GA is proposed to provide feasible technical references for the construction industry. The innovations of the research method are as follows. By introducing a SO strategy, the problems of a large initial population and a single coding method in traditional GAs have been avoided. The researchers defined the project evaluation function, highlighting the advantages of each objective in the chromosome, and constructed a resource library for construction progress and cost control, which improved the coordination efficiency when multiple tasks were carried out in parallel. The earliest possible start time and the earliest completion time of the task are obtained by decoding the chromosomes, with the goal of minimizing the total duration of the task. Meanwhile, the GA is improved by using multi-task scheduling (MTS) to preserve the optimal strategy and reduce the error probability. Furthermore, the genetic operation is completed by adopting the idea of discrete crossover operators, without the need for chromosome repair. The relative positions of the parents in each working cycle are retained, and the efficiency of the algorithm is improved. Finally, the tangent function is used to simulate the relationship between the project quality reliability and the subsystem cost during the construction process, and to construct the construction progress and cost optimization model.
The research mainly consists of four parts. The first part discusses and summarizes the current CPCM methods, as well as the relevant research results of GA. The second part mainly designs a project CPCM method based on the improved GA. The third part is an analysis of the effectiveness of the research method. The final part is a summary and discussion of the entire text.
2 Related works
Construction engineering is an indispensable link in the development of urban hardware facilities. With the growth of construction engineering, more scholars have realized the importance of project CPCM technology. Some scholars have conducted relevant research on project CPCM techniques. Alizadehsalehi and other scholars proposed a management framework based on digital twins to address the issue of automated construction progress management. In the process, building information modeling and extended reality technology were used to establish reality capture technology integration, and structural equation model was introduced to test assumptions. The experimental outcomes denoted that the proposed method had good data presentation ability [6]. Chen and other scholars proposed a management model based on radio frequency identification to address the issue of material supply in construction progress management. In the process, the building information modeling was introduced to build the database system, and the information of required materials was linked with the construction plan. The experiment findings indicated that the proposed method could effectively reduce the time consumption in material supply [7]. Scholars such as Ding proposed a cost management model based on neural networks to address the issue of cost management in construction. In the process, the project cost was analyzed, the neural network was introduced to predict the cost, and the building information modeling was added to control the cost. The experimental outcomes expressed that the proposed method could effectively reduce construction costs [8]. Scholars such as Annamalaisami CD proposed a cost management method based on causal mapping for cost control in construction. It needed to analyze and understand the construction scenario during the process and to predict possible future changes. The research results indicated that the proposed method could predict the risk of overspending [9]. Scholars such as Obi have proposed a management method based on expert review for the cost management of project construction. The cost-influencing factors during the process were analyzed, and experiments were conducted on the relationship between the factors through group meetings. The experimental results indicated that the proposed method could effectively evaluate construction costs [10].
Some scholars have conducted relevant research on the GA. Dharma and other scholars proposed a prediction model based on GA for inflation prediction. In the process, the historical consumer price index was analyzed, and the inflation level was predicted through the regression model. The research outcomes denoted that the proposed method could effectively predict inflation trends [11]. Rostami and other scholars proposed a feature selection method based on GA for feature selection in data preprocessing. During the process, feature similarity was calculated, features were redistributed in a cluster form, and finally, features were selected. The experiment findings expressed that the proposed method had high accuracy [12]. Scholars such as Jalali have proposed a design optimization strategy based on GA for sustainable design of buildings. It analyzed the physical performance of the building and its natural environment during the process, and conducted parametric modeling. The research outcomes showed that the proposed method had good design optimization effects [13]. Garud and other scholars proposed a prediction model based on GA for the performance prediction of solar photovoltaic systems. During the process, artificial intelligence technology was used to analyze various parameters of the solar photovoltaic system and detected faults. The experimental findings denoted that the proposed method had high performance prediction efficiency [14]. Chen proposed a GA-based optimization technique for parameter optimization problems. During the process, machines were used to learn the dataset, and the XGBoost model was introduced for parameter adjustment and encoding. The experimental results indicated that the proposed method had high computational performance [15].
In summary, the current methods have some deficiencies. For example, the management framework based on digital twins has high requirements for the real-time performance and accuracy of data, and data deviations will lead to a decline in management effects. The management model based on radio frequency identification relies on devices and tags. Device failure or tag damage can affect usage. The training process of the cost management model based on neural networks is complex, time-consuming, and requires a large amount of data. The cost management method based on causal mapping is complex in analysis and greatly influenced by subjective factors. The management method based on expert review relies on expert experience and lacks objectivity and universality. The research methods introduce SO strategies, construct project evaluation functions and construction progress cost control resource libraries, and adopt innovations such as MTS optimization GAs to avoid the problems of large initial populations and single coding methods in traditional GAs, improve the coordination efficiency of parallel task execution, and consider construction progress and cost factors more comprehensively. Furthermore, genetic operations are completed through the idea of discrete crossover operators without the need for chromosome repair, which can improve the algorithm efficiency, shorten the calculation time, and enhance the ability to adapt to changes in engineering steps, providing a more efficient and feasible technical reference for construction projects.
3 Design of CPCM method based on improved GA
The CPCM are the key points of construction projects. This section will focus on the technical means and development ideas used in the research and design of project CPCM methods based on improved GA.
3.1 Improvement design of standard GA algorithm and project scheduling model design
In the process of formulating the construction plan for infrastructure projects, in addition to considering whether the project progress can meet the construction needs of the group project, it is also necessary to control the cost of the project, ensuring that the construction project meets both the construction schedule and cost objectives of the project plan simultaneously [16,17]. Construction progress control includes the entire process of a project from start to finish, and suitable measurement methods need to be developed for different subprojects in order to clearly control the progress [18]. When conducting project cost management, it is necessary to balance three aspects: technological innovation, schedule management, and cost control. GA is derived from natural selection and genetic mechanism. It can use specific resource allocation strategies in task management and can be applied to construction schedule cost management. In practice, GA is shown in Figure 1.
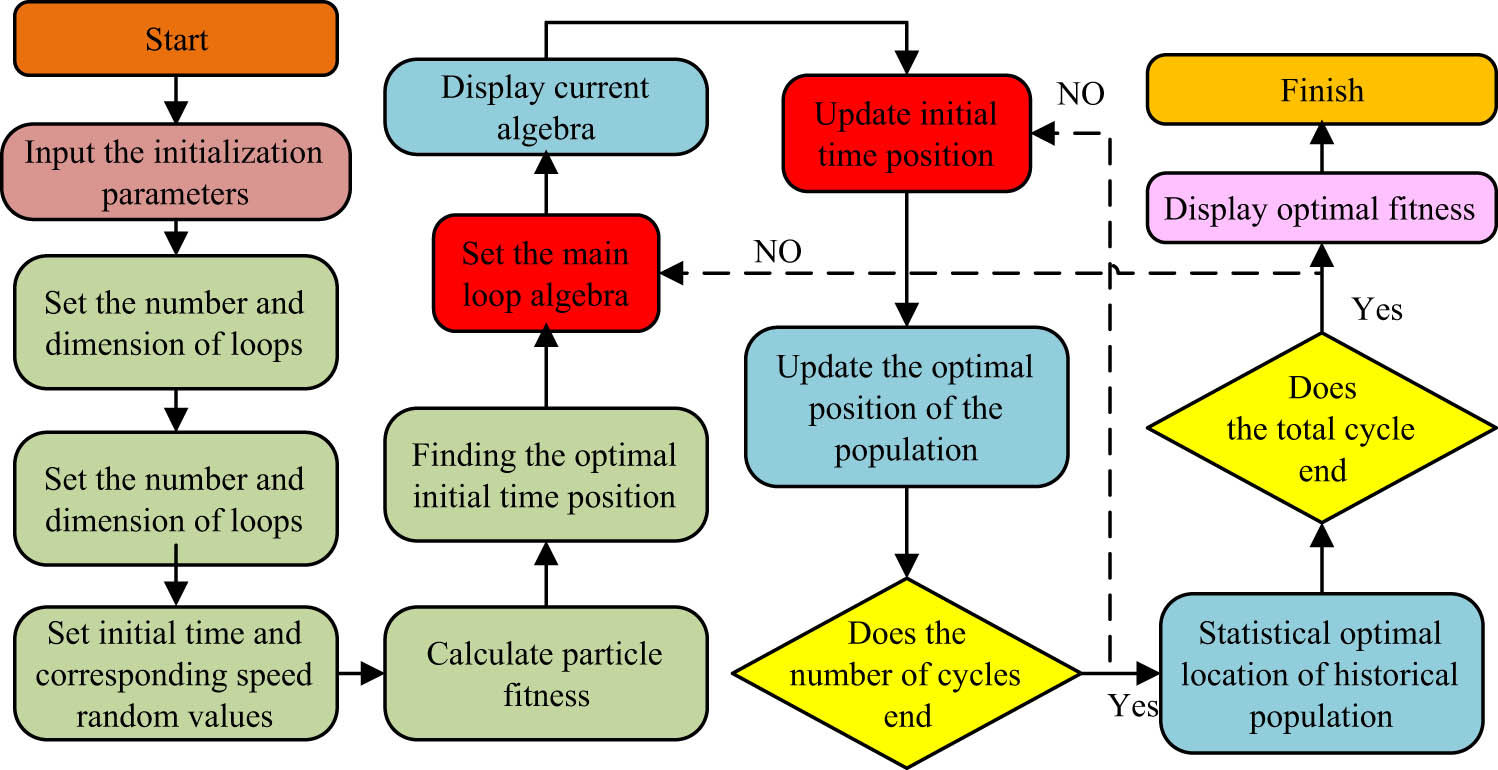
GA workflow.
From Figure 1, GA first needs to set the basic coefficient, cycle dimension and number, initial time, and corresponding speed random values during operation. After the cycle ends, particle fitness is performed to obtain the optimal initial time position. It needs to initialize time and speed, set the main loop algebra, display the current algebra, start the loop, update the initial time position, and if the applicability of the obtained initial time is greater than the optimal position of the population, it needs to update the optimal position of the population. When the amount of cycles ends, the optimal position of the historical population is counted to determine whether the total cycle has reached the end condition. If it does not end, the main cycle algebra setting step is returned to continue the cycle. If it ends, the optimal fitness is displayed. The method of studying the selection coefficient is to highlight the advantages of each objective in the chromosome by defining the project evaluation function, and at the same time construct the construction progress and cost control resource library to improve the coordination efficiency when multiple tasks are carried out in parallel. The specific steps are as follows: first, determine the key factors that affect the project schedule and cost, such as resource allocation, task priority, and time constraints. Then, assign corresponding weights to these factors. The distribution of weights is based on the degree of influence of each factor on the project goals, and the total sum of the weights is 1. Then, each factor is scored, and the scoring criteria are formulated according to the actual project requirements. Then, calculate the weighted scores of each factor, i.e., multiply the scores by the weights. Finally, add up the weighted scores of all factors to obtain the total score of each task or scheme. The task or scheme with the highest total score is the optimal choice. Theoretically, the determination of the selection coefficient is based on the project characteristics and requirements to allocate weights, which has certain flexibility and adaptability and can be applied to projects different from the original research. The steps when using SOs for calculation are shown in Figure 2.

SO steps.
In Figure 2, when performing SOs, it is necessary to first encode the problem to be solved in the algorithm and then randomly initialize a population. Fitness search is conducted for each chromosome in the initialized population, and fitness represents the adaptability of the chromosome in the environment. Then, a new population is generated to expand the range that limited individuals in the algorithm can cover. It replaces the new group with the previous generation group. If the preset termination conditions are not met, it needs to go back to the fitness search step and cycle until the termination conditions are met, and the calculation ends. However, the initial population generated by traditional GA is huge, leading to an expansion of search space. Moreover, the encoding method of traditional GA is single, and there are multiple limitations in their application. Research is conducted on the improvement design of GA and a project evaluation function is defined, as shown in Eq. (1):
where
where
where
where
where
3.2 Optimization method for improving GA for CPCM
To calculate the shortest progress duration of multiple tasks, chromosomes can be decoded to obtain the earliest possible start time of work in the task and the earliest completion time of the task. The objective function is shown in Eq. (6):
where
where
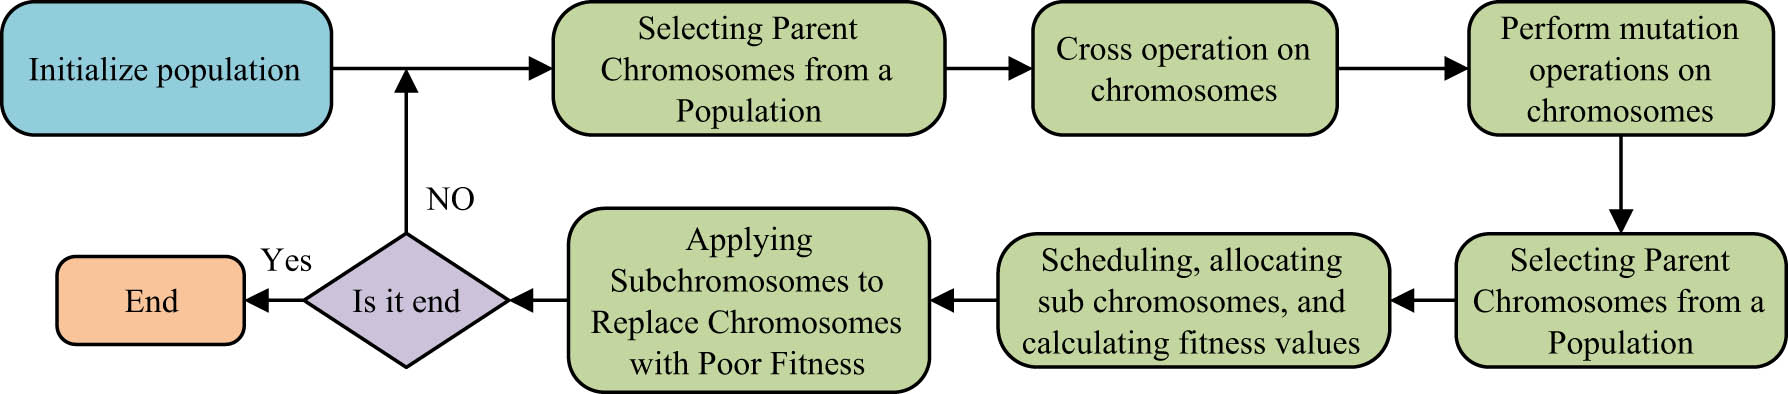
Introduction of GA algorithm flow for MTS.
As shown in Figure 3, the GA that introduces MTS first needs to initialize the population before performing calculations, then select the parent chromosome in the population, perform crossover and mutation operations, update the population, and reselect the parent chromosome. It schedules and allocates sub-chromosomes, calculates corresponding fitness values, uses sub-chromosomes to replace those with poor fitness, and determines whether the cycle has ended. If not, it will continue the cycle. If it has ended, it will end the process and output the results. The standard GA is unable to solve non-cumulative workload problems, and research imitates the idea of discrete crossover operators to complete genetic operations without chromosome repair [20]. It performs cross-operation between the mother and father in GA to generate offspring and daughter offspring, and it carries out work inheritance in the work chain table, as shown in Eq. (8):
where
where
where
where
where
Construction work of Viaduct project
| Job code | Job name | Immediate work | Dependent tasks | Duration (week) |
|---|---|---|---|---|
| A | Construction preparation | / | B | 11 |
| B | Pile foundation engineering | A | C | 16 |
| C | Pier and abutment body construction | B | D, E | 8 |
| D | Beam construction | C | F, G, H | 13 |
| E | Beam support, binding steel bars | C | O | 75 |
| F | Prestressed pouring beam | D | I | 14 |
| G | Main structure | D | K | 27 |
| H | External frame installation | D | L | 42 |
| I | Masonry and backfill of viaduct | F | J | 14 |
| J | Bridge deck and accessories | I | O | 38 |
| K | Pier structure of viaduct | G | M | 9 |
| L | Pouring | H | Q | 46 |
| M | Box construction of viaduct | K | N | 9 |
| N | Bridge deck decoration engineering | M | Q | 17 |
| O | Pier column | J | Q | 13 |
| P | Cast-in-place beams | E | Q | 12 |
| Q | Pre-beam | L, n, o, p | R | 10 |
| R | Completion acceptance | Q | / | 5 |
From Table 1, each construction work step of viaduct project construction is separated separately, and each step is given a corresponding code, and the immediate work and immediate work of each work step are marked according to the construction process. It marks the individual duration of each work step according to the normal working speed to facilitate the development of construction plans. When the actual viaduct project construction schedule cost optimization is carried out, the GA mode based on the double code network is used to set the key process as the construction process with the free float of 0. It analyzes the progress cost critical path of the project and calculates it based on the process time and direct costs of the critical project.
In construction project management, the total cost TC is composed of direct cost TDC and indirect cost IC. Direct costs include expenses such as labor, materials, and equipment that are directly related to construction activities. Indirect costs are usually non-direct expenses such as management fees, venue rentals, and administrative expenditures, and their calculation should be based on industry practices or project experience. According to the common practices in the field of construction engineering (such as references [16,17]), the proportion of indirect costs in construction projects is usually between 0.15 and 0.25, and 20% is taken as the equilibrium value. Suppose the indirect cost is proportional to the direct cost. The calculation of the indirect cost is shown in Eq. (13):
The total project cost is shown in Eq. (14):
where TC represents the total project cost, and
where

Progress deviation analysis process.
From Figure 4, when conducting progress deviation analysis, the first step is to analyze whether the deviation occurs on the critical route. If it is on the critical route, it will affect the total construction period and adjustment measures need to be taken. If it is not on a critical route, it will analyze whether the deviation is greater than the total time difference. If the deviation is greater than the total time difference, it will affect the total construction period and adjustment measures need to be taken. If the deviation is not greater than the total time difference, it will analyze whether the deviation is greater than the free time difference. If it is greater than the free time difference, it needs to take adjustment measures. If it is not greater than the free time difference, it will directly return to the progress control system. After taking adjustment measures, it executes the new progress plan and returns to the progress control system. In optimization, it is necessary to determine whether the project progress is ahead of schedule, break down specific control tasks and personnel responsibilities, and establish a corresponding coding management system based on the actual progress of the project. A project schedule assurance system is developed based on GA combined with project quality control technology, as shown in Figure 5.

Project schedule guarantee system.
As shown in Figure 5, the project schedule guarantee system is divided into three categories: legal, institutional, and economic guarantees. The legal guarantee category includes content such as command system, leadership responsibility, and ideological education; the system assurance category includes construction plans, logistics support, settlement systems, and other contents; economic guarantee includes regular meeting systems, contracting mechanisms, and other contents. In the secondary optimization of project construction progress cost, the tipping rate processes in non-critical processes can be compressed, and genetic iteration can be carried out on the processes in order from small to large to obtain the minimum construction period. The total cost calculation during practical verification is shown in Eq. (16):
where
4 Performance testing and application analysis of CPCM method based on improved GA
A good CPCM method can optimize the project’s duration and construction costs. This section will test the performance of the research method in CPCM and introduce real engineering projects for application effect analysis to determine the effectiveness of the method.
4.1 Performance testing of CPCM method based on improved GA
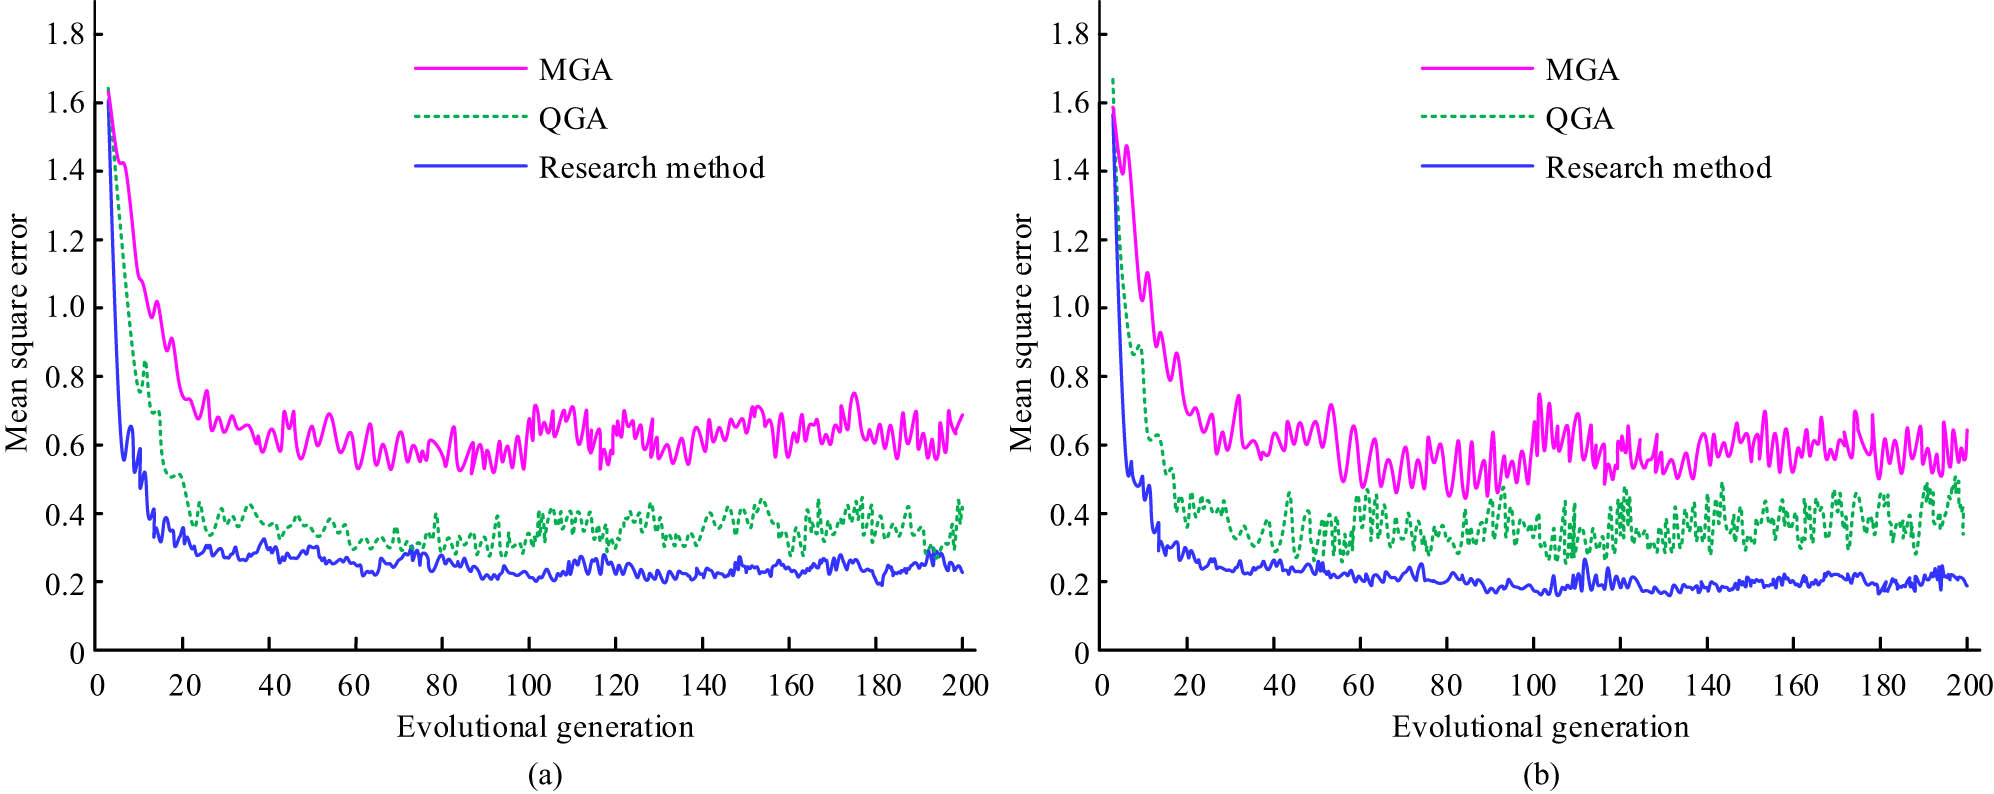
To analyze the effectiveness of the research institute’s design method in project CPCM for building engineering, performance testing and application analysis were conducted on the method. The construction engineering cost standards (CECS) and building engineering dataset (BED) were utilized as datasets, and it set the evolution algebra to 200, the population size to 20, the crossover probability to 0.4, and the mutation probability to 0.001. The optimal fitness was tested during the evolution of research methods, and they were compared with multi-stage genetic algorithm (MGA) and quantum genetic algorithm (QGA), as shown in Figure 6.

Best-fit evolution test: (a) CECS and (b) BED.
From Figure 6, during the best fitness test, the best fitness of all methods continuously increased with the increase of evolution times, stopped rising, and remained stable when reaching the upper limit of the best fitness. In the CECS dataset, MGA reached its optimal fitness upper limit of 20.9 when evolving to the 72nd generation; when QGA evolved to the 47th generation, it reached the upper limit of optimal fitness of 20.9, and there was a cross between the curve of optimal fitness and MGA during the upward process; the research method reached the optimal fitness limit of 20.9 when evolving to the 23rd generation. In the BED dataset, MGA reached its optimal fitness upper limit of 21.2 when evolving to the 45th generation; when QGA evolved to the 61st generation, it reached the upper limit of optimal fitness of 21.2, and there were multiple intersections with the curve of MGA during the rise of the optimal fitness curve; the research method reached the optimal fitness upper limit of 21.2 when evolving to the 30th generation. The research method had a faster rate of optimal fitness increase. It tested the mean squared error (MSE) change of the research method in the evolution process, as shown in Figure 7.
MSE change: (a) CECS and (b) BED.
From Figure 7, the MSE of all methods decreased with the increase of evolution algebra. In the CECS dataset, the MSE of MGA ended its downward trend at the 36th evolution and then fluctuated around 0.64, with a fluctuation range of 0.12; the MSE of QGA ended its downward trend at the 27th evolution and then fluctuated around 0.37, with a fluctuation range of 0.07; the MSE of the research method ended its downward trend at the 22nd evolution and then fluctuated around 0.23, with a fluctuation range of 0.04. In the BED dataset, the MSE of MGA ended its downward trend at the 39th evolution and then fluctuated around 0.58, with a fluctuation range of 0.17; the MSE of QGA ended its downward trend at the 33rd evolution and then fluctuated around 0.37, with a fluctuation range of 0.12; the MSE of the research method ended its downward trend at the 23rd evolution and then fluctuated around 0.21, with a fluctuation range of 0.04. The MSE of the research method decreased faster and had stronger stability after reaching the lowest range. It tested the number of redundant individuals during the operation of the research method, as shown in Figure 8.
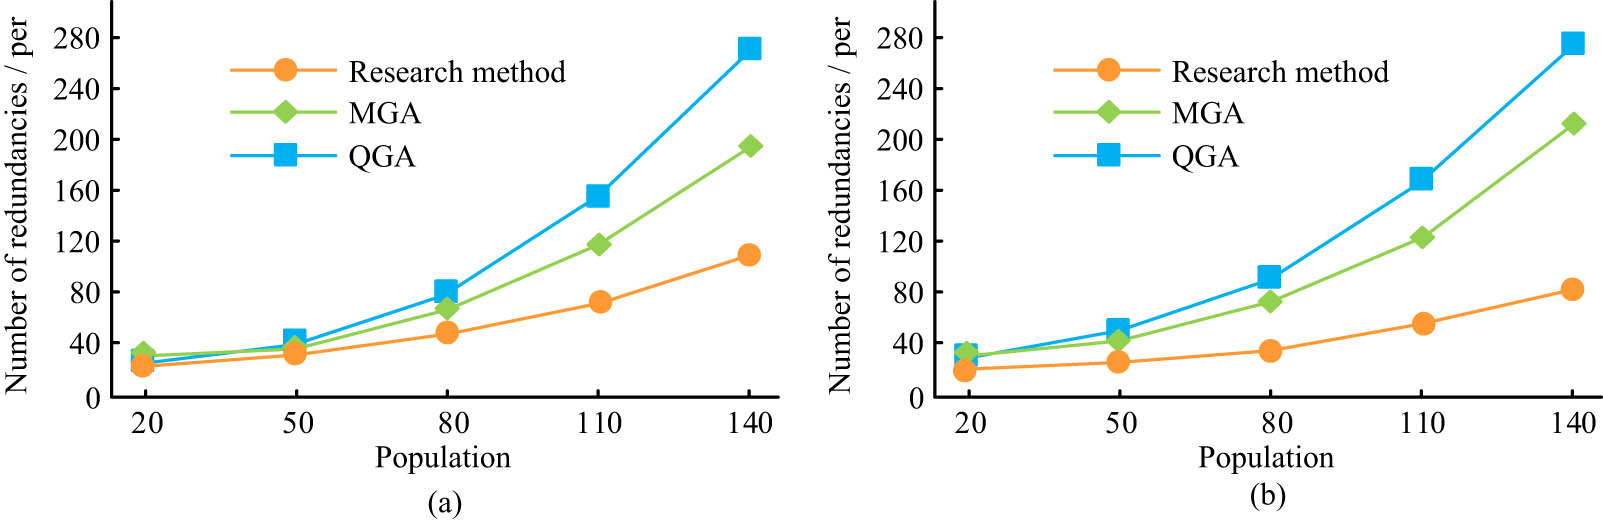
Number of redundant individuals: (a) CECS and (b) BED.
Figure 8 shows that in both the CECS and BED datasets, the number of redundant individuals for all methods increases with the increase in population size. In the CECS dataset, taking the QGA method as an example, when the population size increased from 20 to 140, the number of redundant individuals rose from 29 to 272, and other methods also showed a similar growth trend. The same is true in the BED dataset. For example, in the QGA method, there are 32 redundant individuals when the population size is 20, and it reaches 277 when it increases to 140. The number of redundant individuals in each method increases significantly with the expansion of the population size, reflecting a positive correlation between the population size and the number of redundant individuals. The reduction of redundant individuals means that the maintenance of population diversity is more effective, which helps the algorithm to explore more extensively in the search space and avoid premature convergence to the local optimal solution. When there are many redundant individuals, similar individuals in the population dominate, which limits the exploration ability of the algorithm and leads to the stagnation of the search process. The low-redundancy state can ensure the differences among individuals in the population, enabling the algorithm to continuously discover new and better solutions during the iterative process. Meanwhile, low redundancy also reduces unnecessary waste of computing resources because the algorithm no longer conducts repetitive fitness evaluations and genetic operations on a large number of similar individuals, thereby significantly improving the computing efficiency. This improvement in efficiency is particularly evident when dealing with large-scale or complex problems, enabling the algorithm to find satisfactory solutions in a shorter time. It tested the calculation time of the research method, as shown in Figure 9.

Computing time: (a) CECS and (b) BED.
As shown in Figure 9, in both datasets, the calculation time of all methods increased with the number of engineering steps. In the CECS dataset, the calculation time of QGA was 16.9 s when the amount of engineering steps was 5, and increased to 68.2 s when the amount of engineering steps increased to 25; the calculation time for MGA was 24.8 s when the number of engineering steps was 5, and increased to 61.1 s when the amount of engineering steps increased to 25; the calculation time for the research method was 9.9 s when the number of engineering steps was 5, and increased to 33.7 s when the amount of engineering steps increased to 25. In the BED dataset, the calculation time of QGA was 19.7 s when the number of engineering steps was 5, and increased to 56.1 s when the number of engineering steps increased to 25; The calculation time for MGA was 28.1 s when the amount of engineering steps was 5, and increased to 27.8 s when the number of engineering steps increased to 25; the calculation time for the research method was 8.8 s when the number of engineering steps was 5, and increased to 28.2 s when the amount of engineering steps increased to 25. The research method had faster computational efficiency.
4.2 Application analysis of CPCM method based on improved GA
In the application analysis, the research took a viaduct construction project as the analysis object. The viaduct was an interchange double deck overpass, with a longitudinal bridge length of 1,400 linear meters and a transverse bridge length of 380 linear meters. The characteristics of the elevated bridge project dataset are shown in Table 2.
Characteristics of the elevated bridge project dataset
| Task name | Duration (weeks) | Task dependencies | Resource requirements (unit) | Task priority | Earliest start time (weeks) | Latest completion time (weeks) |
|---|---|---|---|---|---|---|
| Construction preparation | 11.00 | / | 5.00 | 1 | 0.00 | 10.00 |
| Pile foundation engineering | 16.00 | 1 | 8.00 | 2 | 11.00 | 27.00 |
| Pier and abutment body construction | 8.00 | 2 | 6.00 | 3 | 27.00 | 35.00 |
| Beam construction | 13.00 | 3 | 7.00 | 4 | 35.00 | 48.00 |
| Beam support, binding steel bars | 75.00 | 3 | 10.00 | 5 | 35.00 | 110.00 |
| Prestressed pouring beam | 14.00 | 4 | 5.00 | 6 | 48.00 | 62.00 |
| Main structure | 27.00 | 4 | 9.00 | 7 | 48.00 | 75.00 |
| External frame installation | 42.00 | 4 | 7.00 | 8 | 48.00 | 90.00 |
| Masonry and backfill of viaduct | 14.00 | 6 | 6.00 | 9 | 62.00 | 76.00 |
| Bridge deck and accessories | 38.00 | 9 | 8.00 | 10 | 76.00 | 114.00 |
| Pier structure of viaduct | 9.00 | 7 | 5.00 | 11 | 75.00 | 84.00 |
| Box construction of viaduct | 9.00 | 11 | 4.00 | 12 | 84.00 | 93.00 |
| Bridge deck decoration engineering | 17.00 | 12 | 6.00 | 13 | 93.00 | 110.00 |
| Pier column | 13.00 | 10 | 5.00 | 14 | 114.00 | 127.00 |
| Cast-in-place beams | 12.00 | 5 | 6.00 | 15 | 110.00 | 122.00 |
| Pre-beam | 10.00 | 8, 13, 14, 15 | 8.00 | 16 | 127.00 | 137.00 |
| Completion acceptance | 5.00 | 16 | 3.00 | 17 | 137.00 | 142.00 |
The construction period compression test was carried out for each work of the viaduct, as shown in Figure 10.

Work duration compression.
From Figure 10, out of the 17 tasks, a total of nine tasks had their schedules compressed. The construction period of the pier and abutment body has been reduced from 8 weeks to 7 weeks; the construction period for brackets and binding steel bars has been reduced from 75 weeks to 73 weeks; the construction period of the main structure has been compressed from 27 weeks to 26 weeks; the construction period for the outer frame has been reduced from 42 weeks to 40 weeks; the construction period for the bridge deck and its accessories has been reduced from 38 weeks to 37 weeks; the pouring period has been reduced from 46 weeks to 45 weeks; the construction period of Viaduct box construction was reduced from 9 weeks to 8 weeks; the construction period for pier and abutment columns has been reduced from 13 weeks to 12 weeks. The research method effectively compressed the construction period. The cost compression was calculated in the context of schedule compression, as shown in Table 3.
Project cost compression
| Number of compressions | Compression work | Indirect rate adjustment (103 yuan/week) | Direct cost slope (103 yuan/week) | Reduce expenses (103 yuan) | Total cost (103 yuan) |
|---|---|---|---|---|---|
| 1 | Beam construction | −0.150 | 0.050 | 30 | 3,366 |
| 2 | Pouring | −0.130 | 0.067 | 40 | 3,326 |
| 3 | Pre-beam | −0.100 | 0.010 | 20 | 3,306 |
| 4 | Beam support, binding steel bars | −0.180 | 0.020 | 90 | 3,216 |
| 5 | Masonry and backfill of viaduct | −0.100 | 0.100 | 20 | 3,196 |
| 6 | Bridge deck and accessories | −0.063 | 0.130 | 20 | 3,176 |
| 7 | Cast-in-place beams | −0.050 | 0.150 | 10 | 3,166 |
From Table 3, the research method compressed the construction cost of the project in seven steps. When compressing the project duration at the same time, a total of 230k yuan in cost was reduced. The total construction period of viaduct was reduced from 149 weeks to 144 weeks, and the project construction cost was reduced from 3,366k to 3,166k yuan. The research method can effectively reduce the duration and cost of project construction. The experimental data were obtained from 30 independent repeated experiments, and the statistical test results of performance indexes are shown in Table 4.
Statistical results of performance indicators
| Performance index | Data set | Improved GA | MGA | QGA | Statistical value | p |
|---|---|---|---|---|---|---|
| Convergence algebra | CECS | 23.2 ± 1.8 | 72.5 ± 4.2 | 47.3 ± 3.1 | F = 785.6 | <0.001 |
| BED | 30.4 ± 2.1 | 45.1 ± 3.8 | 61.2 ± 5.3 | F = 423.9 | <0.001 | |
| MSE fluctuates steadily | CECS | 0.04 ± 0.006 | 0.12 ± 0.015 | 0.07 ± 0.009 | t = 28.7 | <0.001 |
| BED | 0.04 ± 0.005 | 0.17 ± 0.021 | 0.12 ± 0.018 | t = 35.2 | <0.001 | |
| Calculate the time increment (s) | CECS | 23.8 ± 2.3 | 61.4 ± 5.7 | 68.5 ± 6.2 | H = 89.1 | <0.001 |
| (Steps 5 → 25) | BED | 19.4 ± 1.9 | 56.3 ± 4.8 | 47.6 ± 4.1 | U = 0.0 | <0.001 |
| Cost reduction amount (104 yuan) | Viaduct | 23.0 ± 2.5 | 12.3 ± 3.1 | 15.8 ± 2.8 | F = 49.2 | <0.001 |
As can be seen from Table 4, the convergence algebra of Improved-GA on the CECS and BED datasets was 23.2 ± 1.8 and 30.4 ± 2.1, respectively, which was significantly superior to that of MGA and QGA. The MSE value is 0.04 on both the CECS and BED datasets, indicating that its convergence stability is higher. In terms of calculating the time increment, the performance of Improved-GA on the CECS and BED datasets is also superior to that of the other two algorithms. Especially when the engineering steps increase from 5 to 25, the calculation time increment is significantly smaller. Furthermore, in the elevated bridge project, the cost reduction of Improved-GA was 23.0 × 10⁴ yuan, which was significantly higher than that of MGA and QGA. The statistical test results show that the differences among various performance indicators are highly significant (p < 0.001), proving the superiority and reliability of Improved-GA in the progress and cost management of construction projects. These results indicate that Improved-GA can effectively shorten the project cycle and reduce costs, while maintaining high computational efficiency and stability.
5 Conclusion
Conducting project CPCM can improve construction efficiency and reduce construction costs. A construction schedule and cost management method based on GA has been proposed for project construction cost management. By encoding the problem and performing SOs, the chromosome encoding was used to calculate the shortest duration of multiple tasks. Then, the optimal strategy was saved using MTS, and the project construction work was split and compressed separately. Finally, the effectiveness of the research method was tested. The experimental findings indicated that when testing the optimal fitness, the research method reached the upper limit of 20.9 in the_ 23rd generation of evolution in the CESE dataset; in the MSE test, the research method only needed 22 and 23 evolutions, respectively, in the two datasets to reach the lowest interval; when testing the amount of redundant individuals during runtime, the research method maintained the number of redundant individuals below 108 when the population reached 140; in the calculation time test of the research method, when the number of engineering steps in the BED dataset was 5, the calculation time was 8.8 s; when compressing the construction period, the research method compressed the construction period of 9 out of 17 tasks, with a maximum compression of 3 weeks for each individual task. The aforementioned results indicated that the research method had good model performance and could effectively compress the project construction period and cost.
Furthermore, the research method has the potential to be applied to non-elevated bridge projects, but it needs to be adjusted according to different building environments. For different building environments, if the project structure and process are different, the resource library and task relationship model need to be reconstructed. For instance, the number of building floors and functional zoning will change the task sequence and resource requirements. If there are differences in resource conditions, such as the speed of material supply and the number of laborers, the resource constraint equation and the cost calculation method should be adjusted. Meanwhile, it is also necessary to modify the optimization model constructed with the tangent function in combination with the quality standards and risk factors in the new environment to ensure the effectiveness of the method. However, the research still has limitations. First of all, although this method shows high efficiency when handling multiple tasks, its adaptability to the specific project environment still needs to be improved. Second, when dealing with large-scale projects, the computing time may still be relatively long. Future research can focus on further enhancing the universality and adaptability of algorithms to better address the challenges of different construction project environments. The research will explore how to customize and adjust the algorithm according to the specific requirements of the project and the characteristics of the environment. Meanwhile, combined with the real-time data monitoring and feedback mechanism, the response ability of the algorithm to the dynamic changes of the project is enhanced, enabling it to quickly adapt to the changes in project conditions. In addition, it is also possible to study how to optimize the computational efficiency of the algorithm to handle large-scale and complex projects more effectively. Through these improvements, it is expected that this method will play a greater role in the CPCM of construction projects.
-
Funding information: The author states no funding involved.
-
Author contributions: Xudong Wang: original draft preparation; methodology, review, and editing. The author has accepted responsibility for the entire content of this manuscript and approved its submission.
-
Conflict of interest: The author states no conflict of interest.
-
Data availability statement: All data generated or analyzed during this study are included in this published article.
References
[1] Dong Y, Zhang SL, Huang YL. Construction of educational quality evaluation index system based on project management. Int J Inf Syst Serv Sect (IJISSS). 2020;12(2):65–75.10.4018/IJISSS.2020040105Suche in Google Scholar
[2] Cassar DR, Santos GG, Zanotto ED. Designing optical glasses by machine learning coupled with a genetic algorithm. Ceram Int. 2021;47(8):10555–64.10.1016/j.ceramint.2020.12.167Suche in Google Scholar
[3] Kowalski M, Izdebski M, Żak J, Gołda P, Manerowski J. Planning and management of aircraft maintenance using a genetic algorithm. Eksploat i Niezawodn. 2021;23(1):143–53.10.17531/ein.2021.1.15Suche in Google Scholar
[4] Feng-Luan DU, Zhao CQ, Ding SN. Construction and recent progress of Z-scheme-based photoelectrochemical sensor. Chin J Anal Chem. 2021;49(8):1247–57.Suche in Google Scholar
[5] Yang Y, Song X. Research on face intelligent perception technology integrating deep learning under different illumination intensities. J Comput Cognit Eng. 2022;1(1):32–6.10.47852/bonviewJCCE19919Suche in Google Scholar
[6] Alizadehsalehi S, Yitmen I. Digital twin-based progress monitoring management model through reality capture to extended reality technologies (DRX). Smart Sustain Built Environ. 2023;12(1):200–36.10.1108/SASBE-01-2021-0016Suche in Google Scholar
[7] Chen Q, Adey BT, Haas C, Hall DM. Using look-ahead plans to improve material flow processes on construction projects when using BIM and RFID technologies. Constr Innov. 2020;20(3):471–508.10.1108/CI-11-2019-0133Suche in Google Scholar
[8] Ding X, Lu Q. Construction cost management strategy based on BIM technology and neural network model. J Intell Fuzzy Syst. 2021;40(4):6669–81.10.3233/JIFS-189502Suche in Google Scholar
[9] Annamalaisami CD, Kuppuswamy A. Reckoning construction cost overruns in building projects through methodological consequences. Int J Constr Manag. 2022;22(6):1079–89.10.1080/15623599.2019.1683689Suche in Google Scholar
[10] Obi LI, Arif M, Awuzie B, Islam R, Gupta AD, Walton R. Critical success factors for cost management in public-housing projects. Constr Innov. 2021;21(4):625–47.10.1108/CI-10-2020-0166Suche in Google Scholar
[11] Dharma F, Shabrina S, Noviana A, Tahir M, Hendrastuty N, Wahyono W. Prediction of Indonesian inflation rate using regression model based on genetic algorithms. J Online Inform. 2020;5(1):45–52.10.15575/join.v5i1.532Suche in Google Scholar
[12] Rostami M, Berahmand K, Forouzandeh S. A novel community detection based genetic algorithm for feature selection. J Big Data. 2021;8(1):1–27.10.1186/s40537-020-00398-3Suche in Google Scholar
[13] Jalali Z, Noorzai E, Heidari S. Design and optimization of form and facade of an office building using the genetic algorithm. Sci Technol Built Environ. 2020;26(2):128–40.10.1080/23744731.2019.1624095Suche in Google Scholar
[14] Garud KS, Jayaraj S, Lee MY. A review on modeling of solar photovoltaic systems using artificial neural networks, fuzzy logic, genetic algorithm and hybrid models. Int J Energy Res. 2021;45(1):6–35.10.1002/er.5608Suche in Google Scholar
[15] Chen J, Zhao F, Sun Y, Yin Y. Improved XGBoost model based on genetic algorithm. Int J Comput Appl Technol. 2020;62(3):240–5.10.1504/IJCAT.2020.106571Suche in Google Scholar
[16] Mello PP, Onofre RB, Rea M, Bierman A, Gadoury DM, Ivors K, et al. Design, construction, and evaluation of equipment for nighttime applications of UV-C for management of strawberry powdery Mildew in Florida and California. Plant Health Prog. 2022;23(3):321–7.10.1094/PHP-01-22-0002-RSSuche in Google Scholar
[17] Ranjithapriya R, Arulselvan S. Study on factors affecting equipment management and its effect on productivity in building construction. Int J Eng Res Technol (IJERT). 2020;9(4):223–30.10.17577/IJERTV9IS040176Suche in Google Scholar
[18] Vasko FJ, Lu Y, McNally B. A simple methodology that efficiently generates all optimal spanning trees for the cable-trench problem. J Comput Cognit Eng. 2022;1(1):13–20.10.47852/bonviewJCCE208918205514Suche in Google Scholar
[19] Ghezelbash R, Maghsoudi A, Shamekhi M, Pradhan B, Daviran M. Genetic algorithm to optimize the SVM and K-means algorithms for mapping of mineral prospectivity. Neural Comput Appl. 2023;35(1):719–33.10.1007/s00521-022-07766-5Suche in Google Scholar
[20] Protulipac DG, Nyabeeya EE, Karitanyi N, Vincent T, Panayotidis D. Construction progress at the Rusumo Falls hydro development in challenging times. Int J Hydropower Dams. 2020;27(5):91–5.Suche in Google Scholar
[21] Xu S, Chen H, Wang P, Nie R, Si J. An improved model predictive torque control for switched reluctance motors based on variable hyperbolic tangent function modeling. IEEE Trans Transp Electr. 2025;11(1):5029–41.10.1109/TTE.2024.3476037Suche in Google Scholar
[22] Mohammad S, Mendoza I. A new hyperbolic tangent family of distributions: Properties and applications. Ann Data Sci. 2025;12(2):457–80.10.1007/s40745-024-00516-5Suche in Google Scholar
© 2025 the author(s), published by De Gruyter
This work is licensed under the Creative Commons Attribution 4.0 International License.
Artikel in diesem Heft
- Research Articles
- Generalized (ψ,φ)-contraction to investigate Volterra integral inclusions and fractal fractional PDEs in super-metric space with numerical experiments
- Solitons in ultrasound imaging: Exploring applications and enhancements via the Westervelt equation
- Stochastic improved Simpson for solving nonlinear fractional-order systems using product integration rules
- Exploring dynamical features like bifurcation assessment, sensitivity visualization, and solitary wave solutions of the integrable Akbota equation
- Research on surface defect detection method and optimization of paper-plastic composite bag based on improved combined segmentation algorithm
- Impact the sulphur content in Iraqi crude oil on the mechanical properties and corrosion behaviour of carbon steel in various types of API 5L pipelines and ASTM 106 grade B
- Unravelling quiescent optical solitons: An exploration of the complex Ginzburg–Landau equation with nonlinear chromatic dispersion and self-phase modulation
- Perturbation-iteration approach for fractional-order logistic differential equations
- Variational formulations for the Euler and Navier–Stokes systems in fluid mechanics and related models
- Rotor response to unbalanced load and system performance considering variable bearing profile
- DeepFowl: Disease prediction from chicken excreta images using deep learning
- Channel flow of Ellis fluid due to cilia motion
- A case study of fractional-order varicella virus model to nonlinear dynamics strategy for control and prevalence
- Multi-point estimation weldment recognition and estimation of pose with data-driven robotics design
- Analysis of Hall current and nonuniform heating effects on magneto-convection between vertically aligned plates under the influence of electric and magnetic fields
- A comparative study on residual power series method and differential transform method through the time-fractional telegraph equation
- Insights from the nonlinear Schrödinger–Hirota equation with chromatic dispersion: Dynamics in fiber–optic communication
- Mathematical analysis of Jeffrey ferrofluid on stretching surface with the Darcy–Forchheimer model
- Exploring the interaction between lump, stripe and double-stripe, and periodic wave solutions of the Konopelchenko–Dubrovsky–Kaup–Kupershmidt system
- Computational investigation of tuberculosis and HIV/AIDS co-infection in fuzzy environment
- Signature verification by geometry and image processing
- Theoretical and numerical approach for quantifying sensitivity to system parameters of nonlinear systems
- Chaotic behaviors, stability, and solitary wave propagations of M-fractional LWE equation in magneto-electro-elastic circular rod
- Dynamic analysis and optimization of syphilis spread: Simulations, integrating treatment and public health interventions
- Visco-thermoelastic rectangular plate under uniform loading: A study of deflection
- Threshold dynamics and optimal control of an epidemiological smoking model
- Numerical computational model for an unsteady hybrid nanofluid flow in a porous medium past an MHD rotating sheet
- Regression prediction model of fabric brightness based on light and shadow reconstruction of layered images
- Dynamics and prevention of gemini virus infection in red chili crops studied with generalized fractional operator: Analysis and modeling
- Qualitative analysis on existence and stability of nonlinear fractional dynamic equations on time scales
- Fractional-order super-twisting sliding mode active disturbance rejection control for electro-hydraulic position servo systems
- Analytical exploration and parametric insights into optical solitons in magneto-optic waveguides: Advances in nonlinear dynamics for applied sciences
- Bifurcation dynamics and optical soliton structures in the nonlinear Schrödinger–Bopp–Podolsky system
- User profiling in university libraries by combining multi-perspective clustering algorithm and reader behavior analysis
- Exploring bifurcation and chaos control in a discrete-time Lotka–Volterra model framework for COVID-19 modeling
- Review Article
- Haar wavelet collocation method for existence and numerical solutions of fourth-order integro-differential equations with bounded coefficients
- Special Issue: Nonlinear Analysis and Design of Communication Networks for IoT Applications - Part II
- Silicon-based all-optical wavelength converter for on-chip optical interconnection
- Research on a path-tracking control system of unmanned rollers based on an optimization algorithm and real-time feedback
- Analysis of the sports action recognition model based on the LSTM recurrent neural network
- Industrial robot trajectory error compensation based on enhanced transfer convolutional neural networks
- Research on IoT network performance prediction model of power grid warehouse based on nonlinear GA-BP neural network
- Interactive recommendation of social network communication between cities based on GNN and user preferences
- Application of improved P-BEM in time varying channel prediction in 5G high-speed mobile communication system
- Construction of a BIM smart building collaborative design model combining the Internet of Things
- Optimizing malicious website prediction: An advanced XGBoost-based machine learning model
- Economic operation analysis of the power grid combining communication network and distributed optimization algorithm
- Sports video temporal action detection technology based on an improved MSST algorithm
- Internet of things data security and privacy protection based on improved federated learning
- Enterprise power emission reduction technology based on the LSTM–SVM model
- Construction of multi-style face models based on artistic image generation algorithms
- Research and application of interactive digital twin monitoring system for photovoltaic power station based on global perception
- Special Issue: Decision and Control in Nonlinear Systems - Part II
- Animation video frame prediction based on ConvGRU fine-grained synthesis flow
- Application of GGNN inference propagation model for martial art intensity evaluation
- Benefit evaluation of building energy-saving renovation projects based on BWM weighting method
- Deep neural network application in real-time economic dispatch and frequency control of microgrids
- Real-time force/position control of soft growing robots: A data-driven model predictive approach
- Mechanical product design and manufacturing system based on CNN and server optimization algorithm
- Application of finite element analysis in the formal analysis of ancient architectural plaque section
- Research on territorial spatial planning based on data mining and geographic information visualization
- Fault diagnosis of agricultural sprinkler irrigation machinery equipment based on machine vision
- Closure technology of large span steel truss arch bridge with temporarily fixed edge supports
- Intelligent accounting question-answering robot based on a large language model and knowledge graph
- Analysis of manufacturing and retailer blockchain decision based on resource recyclability
- Flexible manufacturing workshop mechanical processing and product scheduling algorithm based on MES
- Exploration of indoor environment perception and design model based on virtual reality technology
- Tennis automatic ball-picking robot based on image object detection and positioning technology
- A new CNN deep learning model for computer-intelligent color matching
- Design of AR-based general computer technology experiment demonstration platform
- Indoor environment monitoring method based on the fusion of audio recognition and video patrol features
- Health condition prediction method of the computer numerical control machine tool parts by ensembling digital twins and improved LSTM networks
- Establishment of a green degree evaluation model for wall materials based on lifecycle
- Quantitative evaluation of college music teaching pronunciation based on nonlinear feature extraction
- Multi-index nonlinear robust virtual synchronous generator control method for microgrid inverters
- Manufacturing engineering production line scheduling management technology integrating availability constraints and heuristic rules
- Analysis of digital intelligent financial audit system based on improved BiLSTM neural network
- Attention community discovery model applied to complex network information analysis
- A neural collaborative filtering recommendation algorithm based on attention mechanism and contrastive learning
- Rehabilitation training method for motor dysfunction based on video stream matching
- Research on façade design for cold-region buildings based on artificial neural networks and parametric modeling techniques
- Intelligent implementation of muscle strain identification algorithm in Mi health exercise induced waist muscle strain
- Optimization design of urban rainwater and flood drainage system based on SWMM
- Improved GA for construction progress and cost management in construction projects
- Evaluation and prediction of SVM parameters in engineering cost based on random forest hybrid optimization
- Museum intelligent warning system based on wireless data module
- Optimization design and research of mechatronics based on torque motor control algorithm
- Special Issue: Nonlinear Engineering’s significance in Materials Science
- Experimental research on the degradation of chemical industrial wastewater by combined hydrodynamic cavitation based on nonlinear dynamic model
- Study on low-cycle fatigue life of nickel-based superalloy GH4586 at various temperatures
- Some results of solutions to neutral stochastic functional operator-differential equations
- Ultrasonic cavitation did not occur in high-pressure CO2 liquid
- Research on the performance of a novel type of cemented filler material for coal mine opening and filling
- Testing of recycled fine aggregate concrete’s mechanical properties using recycled fine aggregate concrete and research on technology for highway construction
- A modified fuzzy TOPSIS approach for the condition assessment of existing bridges
- Nonlinear structural and vibration analysis of straddle monorail pantograph under random excitations
- Achieving high efficiency and stability in blue OLEDs: Role of wide-gap hosts and emitter interactions
- Construction of teaching quality evaluation model of online dance teaching course based on improved PSO-BPNN
- Enhanced electrical conductivity and electromagnetic shielding properties of multi-component polymer/graphite nanocomposites prepared by solid-state shear milling
- Optimization of thermal characteristics of buried composite phase-change energy storage walls based on nonlinear engineering methods
- A higher-performance big data-based movie recommendation system
- Nonlinear impact of minimum wage on labor employment in China
- Nonlinear comprehensive evaluation method based on information entropy and discrimination optimization
- Application of numerical calculation methods in stability analysis of pile foundation under complex foundation conditions
- Research on the contribution of shale gas development and utilization in Sichuan Province to carbon peak based on the PSA process
- Characteristics of tight oil reservoirs and their impact on seepage flow from a nonlinear engineering perspective
- Nonlinear deformation decomposition and mode identification of plane structures via orthogonal theory
- Numerical simulation of damage mechanism in rock with cracks impacted by self-excited pulsed jet based on SPH-FEM coupling method: The perspective of nonlinear engineering and materials science
- Cross-scale modeling and collaborative optimization of ethanol-catalyzed coupling to produce C4 olefins: Nonlinear modeling and collaborative optimization strategies
- Unequal width T-node stress concentration factor analysis of stiffened rectangular steel pipe concrete
- Special Issue: Advances in Nonlinear Dynamics and Control
- Development of a cognitive blood glucose–insulin control strategy design for a nonlinear diabetic patient model
- Big data-based optimized model of building design in the context of rural revitalization
- Multi-UAV assisted air-to-ground data collection for ground sensors with unknown positions
- Design of urban and rural elderly care public areas integrating person-environment fit theory
- Application of lossless signal transmission technology in piano timbre recognition
- Application of improved GA in optimizing rural tourism routes
- Architectural animation generation system based on AL-GAN algorithm
- Advanced sentiment analysis in online shopping: Implementing LSTM models analyzing E-commerce user sentiments
- Intelligent recommendation algorithm for piano tracks based on the CNN model
- Visualization of large-scale user association feature data based on a nonlinear dimensionality reduction method
- Low-carbon economic optimization of microgrid clusters based on an energy interaction operation strategy
- Optimization effect of video data extraction and search based on Faster-RCNN hybrid model on intelligent information systems
- Construction of image segmentation system combining TC and swarm intelligence algorithm
- Particle swarm optimization and fuzzy C-means clustering algorithm for the adhesive layer defect detection
- Optimization of student learning status by instructional intervention decision-making techniques incorporating reinforcement learning
- Fuzzy model-based stabilization control and state estimation of nonlinear systems
- Optimization of distribution network scheduling based on BA and photovoltaic uncertainty
- Tai Chi movement segmentation and recognition on the grounds of multi-sensor data fusion and the DBSCAN algorithm
- Special Issue: Dynamic Engineering and Control Methods for the Nonlinear Systems - Part III
- Generalized numerical RKM method for solving sixth-order fractional partial differential equations