Particle swarm optimization and fuzzy C-means clustering algorithm for the adhesive layer defect detection
-
Lvfen Zhu


Abstract
To improve the performance of the adhesive layer defect detection (DD) planar array capacitor system, an adhesive layer DD method based on particle swarm optimization and fuzzy C-means (FCM) clustering algorithm is proposed. By classifying erroneous capacitance data, the experiment distinguishes the capacitance values at defect locations from those at defect-free locations. In response to the presence of artifacts in the image reconstruction results, the optimal threshold method is used to post-process the reconstructed images using the mixed regularization method. These experiments confirmed that FCM clustering reduced the mean absolute deviation (MAD) of data by about 6.1%, and the proposed clustering algorithm reduced the MAD of data by about 23.2%. Compared to the Tikhonov method, the mixed regularization method reduced the relative error of reconstructed images by about 13.1% and increased the correlation coefficient of reconstructed images by about 21.6%. Therefore, this research method had significant effects in reducing data fluctuations and errors, effectively improving the image reconstructing quality and the accuracy of DD. This study can effectively improve the accuracy of adhesive layer DD, help reduce production costs, and improve production efficiency.
1 Introduction
As the modern manufacturing industry develops, defect detection (DD) of the adhesive layer is an urgent problem that needs to be dealt with. The defects in the adhesive layer not only affect the quality of the product but may even lead to serious safety accidents [1]. Therefore, developing an efficient and accurate adhesive layer using the DD method is significant. The initial technology mainly relied on artificial visual inspection, which was not only time-consuming and labor-intensive but also limited by the experience and fatigue of the inspection personnel [2,3]. In addition, existing machine vision-based methods also have some problems, such as dependence on defect types and algorithm complexity [4]. In recent years, the fuzzy C-means (FCM) clustering algorithm has been utilized in data mining and pattern recognition due to its good clustering performance [5]. However, in practical applications, FCM also has some problems, such as sensitivity to the initial cluster center (CC) and susceptibility to local optima. To address these issues, the study introduces particle swarm optimization (PSO) and proposes a PSO-FCM algorithm, aiming to improve the accuracy and efficiency of detection. The study consists of four sections. First, Section 2 provides the summary of research related to PSO, FCM, and DD; second, the DD method is designed and validated in Section 3, and finally, the summary of the entire study is provided.
2 Related works
PSO is a population-based stochastic optimizing technique, in which members of a population continuously change their search patterns through a learning experience. Fan and Wang proposed an average field model for network fake news dissemination based on PSO, assuming that ignorant individuals were more likely to believe and forward fake news spread by similar disseminators. After the analysis, the critical threshold was inversely proportional to the maximum eigenvalue and influenced the coefficient C of the similarity matrix, and the proposed model was effective [6]. Kulkarni and Ghawghawe used a mixed model, combined with the dragonfly algorithm and the PSO, to optimize the configuration of thyristors or controllable series compensators in power systems. These studies validated the effectiveness of this method in optimizing position and parameter settings [7]. Pant and Kumar put forward a new hybrid fuzzy time-series prediction method using PSO and intuitionistic fuzzy sets, which solved the optimal length and uncertainty. These results confirmed that this method reduced the mean square error by 5% [8]. FCM is a clustering algorithm based on fuzzy set theory, which iteratively optimizes the membership function to determine the FCM, thereby achieving fuzzy clustering of datasets. Lin and Chen proposed a centroid self-fusion hierarchical FCM to automatically determine the optimal clusters and solve key problems in existing clustering algorithms. Compared to other methods, this method had simpler hyperparameter adjustment and better clustering performance [9]. Kiruba Nesamalar et al. developed an efficient model that combines FCM with firefly swarm optimization to predict the optimal interaction between genes and ligands. The results showed that the model significantly reduced the binding energy compared to other existing methods among 500 sample instances on the NCBI dataset [10].
DD is a process that utilizes various technical means and methods to identify, locate, and evaluate potential defects in products, materials, or engineering structures. Xiang et al. put forward a new DD method using 3D microtexture surface printing, which utilized directional codes to resist lighting fluctuations and constructed a multi-pair pixel consistency model based on the consistency of pixel pairs. These results confirmed that the DD rate of this method was close to 100% [11]. Cao et al. put forward a means for enhancing aerial images using drones, which effectively detected insulators with self-explosion defects through improved saliency map generation. These results confirmed that the accuracy of this method was 95.1%, which was better than existing solutions [12]. Zhang et al. put forward a fabric DD means using contrastive learning for attention generation adversarial networks, which captured long-range dependencies through contrastive learning and extracted key features through channel attention modules. These results validated that this method achieved 38.25% union intersection values and 51.67% F1 measure values on public datasets [13]. Pan et al. proposed an encoder–decoder architecture using convolutional blocks to improve the efficiency of DD on mobile screen surfaces. These results confirmed that this method had superior DD performance in real industrial scenarios and met the real-time requirements of industrial production [14]. Zhao et al. proposed a frequency domain-based genetic algorithm (GA) variational modulus decomposition reflection coefficient spectrum method for detecting and locating weak defects in cable shielding layers. These results confirmed that this method effectively detected and located weak defects such as single-strand fractures and holes, which accurately identify defected types, providing new ideas for cable shielding layer DD [15]. Nguyen et al. first used traditional clustering methods such as k-means, FCM, and self-organizing mapping to detect defects in finished products. Then, they proposed a new clustering method that combines the sine cosine algorithm and probability FCM (SCA-PFCM) to classify the detected defects into multiple categories and analyze the root cause of the faults. The results showed that the SCA-PFCM algorithm could detect 97% of defects and classify them into four categories [16]. Li et al. proposed an improved Yolov5 algorithm for fabric DD, which improved the model’s ability to detect small defects by introducing a coordinate attention module and a smoother activation function. The proposed algorithm also integrated a particular loss function to address issues of sample imbalance. The experimental results showed that the improved algorithm achieved higher mean average precision metrics and lower parameter computation on the Aliyun TianChi public dataset, meeting the requirements of real-time detection [17]. Tziolas et al. combined deep learning and FCM to fine-tune well-known convolutional neural networks (CNNs) through transfer learning to extract features and used the K-means algorithm for feature clustering. They then defined causal relationships through FCM models to assist decision-making. The experimental results demonstrated that the accuracy of this method in antenna assembly DD tasks reached 80%, which was 3% higher than existing CNN classifiers and still showed high potential in the case of data scarcity [18].
In summary, many researchers have conducted different research and designs on PSO, FCM, and DD. However, existing DD methods suffer from low efficiency when dealing with large amounts of data or complex scenarios. Therefore, a data processing method based on PSO-FCM is proposed for adhesive layer DD, aiming to provide the effect of defect image reconstruction (IR) and improve the performance of DD.
3 Design of DD method for adhesive layer
PSO-FCM is proposed to preprocess capacitance data in planar array capacitance imaging (PACI) systems for adhesive layer DD. Meanwhile, the study adopts the optimal threshold method to post-process the reconstructed images of the mixed regularization method. By reconstructing the regularization matrix, an approximate true distribution of the dielectric constant is obtained, thereby improving the accuracy of reconstructed images.
3.1 Data preprocessing method based on PSO-FCM
The PACI system has been developed for the purpose of detecting defects in the adhesive layer DD. It accomplishes this by providing capacitance distribution information on the surface of the adhesive layer. Figure 1 shows the PACI system, which mainly includes a planar array capacitive sensor, a data acquisition, and an IR module. The sensor module is connected to the data acquisition module through signal lines, and the data acquisition module can obtain 66 capacitance data and import them into the computer. The overall size of the planar array capacitive sensor used in the experiment is 160 mm × 160 mm, with a sensor substrate thickness of 15 mm. The data acquisition module employs the ITS-m3 capacitive acquisition instrument, which has a sensitivity range of 0.01–1 pF and 24 channels. This instrument facilitates single- and double-sided detection.

Structure of the planar array capacitor system.
Noise in capacitive imaging systems typically manifests as irregular fluctuations in data, characterized by randomness, non-structural properties, and independence from useful signals. In the PACI system, noise mainly comes from electronic noise of the measuring equipment, environmental interference, and errors in the signal transmission process. The interference between different noise sources refers to the interaction between them, which may cause noise superposition or cancellation and present non-linear relationships, thereby making the synthesis effect complex. It varies over time and is related to the environmental factors and equipment status of signal acquisition. Noise can also cause poor stability of capacitance data and affect the quality of IR. The PSO-FCM algorithm is proposed to preprocess capacitance data in response to the poor stability of the PACI system’s infrared process and the susceptibility to noise interference, which leads to a decrease in reconstructed image quality. This method classifies erroneous capacitance data, distinguishes the capacitance values at defective and defect-free locations, reduces the error caused by noise interference on capacitance data, and ensures the stability of capacitance data. The dielectric constant’s distribution on the surface of the sensor is represented by the following equation:
In Eq. (1),
In Eq. (2),
In Eq. (3),
In Eq. (4),
In Eq. (5), the dataset
In Eq. (6),
Figure 2 shows the FCM improvement process. First, the capacitance data are processed using the PACI principle and capacitance detection equipment. The IR method is used for IR. Then, the initial CCs are selected through PSO to avoid FCM falling into local optima. Next, the weighted error square is used as the fitness function to measure the compactness of the classification data to improve the classification performance. The applicability function is represented by the following equation:
Improvement process of the FCM algorithm.
In Eq. (7),
In Eq. (8),

PSO-FCM algorithm process.
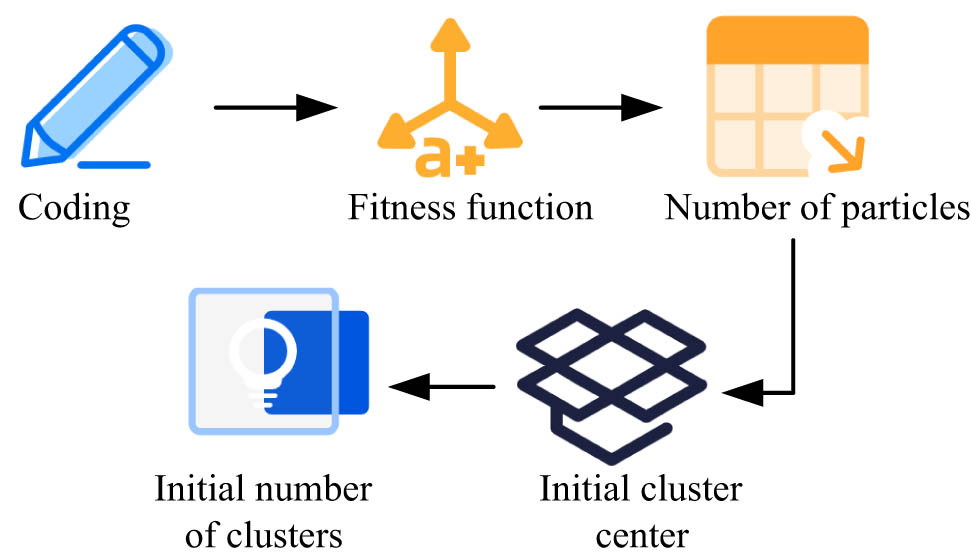
The process of PSO-FCM is as follows. First, various parameters are set, including the initialized cluster quantity. The weighting coefficient, termination threshold, number of clusters, and maximum iteration are determined. CC is initialized. The parameters and their values are usually set as follows: the initial number of clusters is 5, the weighting coefficient is 0.5, the termination threshold is 0.01, the number of clusters is the same as the initial number of clusters, and the maximum number of iterations is 100. These parameters are usually set based on specific problems and experience, and can be adjusted and optimized through experiments to achieve the best clustering effect. Then, the membership degree and CC are updated. When the membership update meets the conditions, the iterative operation stops and the optimized capacitance data are output, and the algorithm ends. The judgment formula for stopping iteration is represented by the following equation:
In Eq. (9),
3.2 Design of IR algorithm using the mixed regularization method
The IR results of PACI have issues such as artifacts, which cannot meet the requirements for image quality. Therefore, a new method is needed to improve this situation, namely the hybrid regularization method. The utilization of a mixed regularization method is predicated on its capacity to enhance the quality of the equation, thereby mitigating its ill-conditioned nature. This, in turn, facilitates the identification of an approximate true solution to the inverse problem [19]. This method divides the singular values of the sensitivity matrix into larger and smaller parts by selecting appropriate truncation parameters, with the correction being applied exclusively to the smaller singular values. This not only preserves the estimation of the solution by the smaller singular values but also suppresses the influence of noise on the solution. At the same time, the regularization matrix is reconstructed to obtain an approximate true distribution of dielectric constants, effectively improving the quality of IR. The sensitivity matrix’s singular value decomposing process is represented by the following equation:
In Eq. (10),
In Eq. (11),
In Eq. (12),
In Eq. (13),
Figure 4 shows a PACI algorithm using mixed regularization. This algorithm utilizes sensitivity matrix singular decomposition and a regularization matrix for capacitance data IR. By introducing regularization and truncation parameters, the capacitance data are mixed and regularized to avoid overfitting and noise interference. In the reconstructed images of PACI systems, the presence of artifacts leads to blurring of information such as size and shape in the reconstructed images. To solve this challenge and improve the reconstructed images’ accuracy, the optimal threshold method is used for post-processing of the reconstructed images.

A PACI algorithm using mixed regularization.
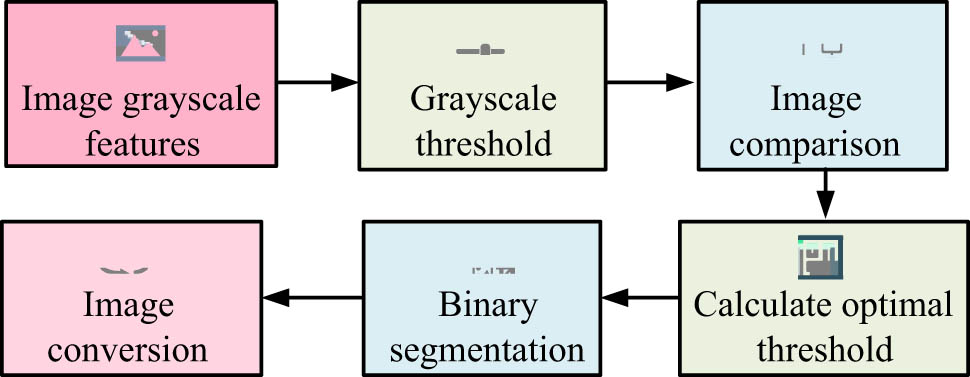
Figure 5 shows the optimal threshold image post-processing method. First, the grayscale threshold is selected based on the grayscale characteristics of the image. Then, each pixel in the image is compared with the grayscale threshold. After repeatedly calculating the optimal threshold, the image is binarized and segmented. The reconstructed image containing multiple grayscales is transformed into a binary image with only two grayscales. The image
Optimal threshold image post-processing method.
In Eq. (14),
In Eq. (15),
4 Application analysis of DD methods for adhesive layers
The experiment preprocessed capacitance data using PSO-FCM combined the processed data with sensitivity matrix, and used Tikhonov, TSVD, and mixed regularization methods to perform IR on defect samples to analyze the application effects of different methods.
4.1 Application analysis of data preprocessing methods based on PSO-FCM
The experimental sample is a type of test specimen specifically designed to simulate the performance of the adhesive layer, consisting mainly of the epoxy resin board and ceramic matrix composite material. The size of the epoxy resin board is 160 mm × 160 mm × 2 mm, with good adhesion and mechanical properties, used to simulate the resin part in the bonding layer. The size of the ceramic-based composite material sample is 165 mm × 165 mm × 20 mm, which has high hardness and wear resistance and is used to simulate the ceramic part in the adhesive layer. The source of this experimental sample is specially prepared in industrial production, and its properties are designed to simulate the mechanical, thermal, and chemical properties of the adhesive layer in actual engineering environments. The primary objective of this approach is to evaluate and study the reliability of the adhesive layer. PSO-FCM is used to determine the defects in the adhesive layer. First, in an empty field, sensors collect capacitance data on ceramic matrix composites. Then, under full field conditions, the sensors collect capacitance data on the adhesive layer between the epoxy resin board and the ceramic matrix composite material. By comparing the capacitance data in these two situations, the approximate location of the defect is obtained. The stability of capacitance data is measured by using the mean absolute deviation (MAD). MAD is an indicator that reflects the degree of data fluctuation, which calculates the average of the absolute values of the deviation between data values and the mean. In the experiment, the larger the MAD value, the greater the fluctuation of capacitance data and the larger the error, which affects the accuracy of detection. Relative image error is an important indicator for evaluating the quality of reconstructed images, which compares the differences between the reconstructed image and original image. The smaller the value of the relative image error, the smaller the difference between the reconstructed image and the original image, and the higher the quality of the reconstructed image. The image correlation coefficient is another indicator to measure the quality of reconstructed images, which measures the similarity between the reconstructed image and the original image. The larger the value of the image correlation coefficient, the more similar the reconstructed image is to the original image, and the higher the quality of the reconstructed image. Four different types of defect samples are tested, and the average capacitance data of each group of experiments is calculated. Samples 1 and 2 both have 2 defects, while samples 3 and 4 have 3 to 4 defects. Figure 6 shows the capacitance data processing results of samples 1 and 2.
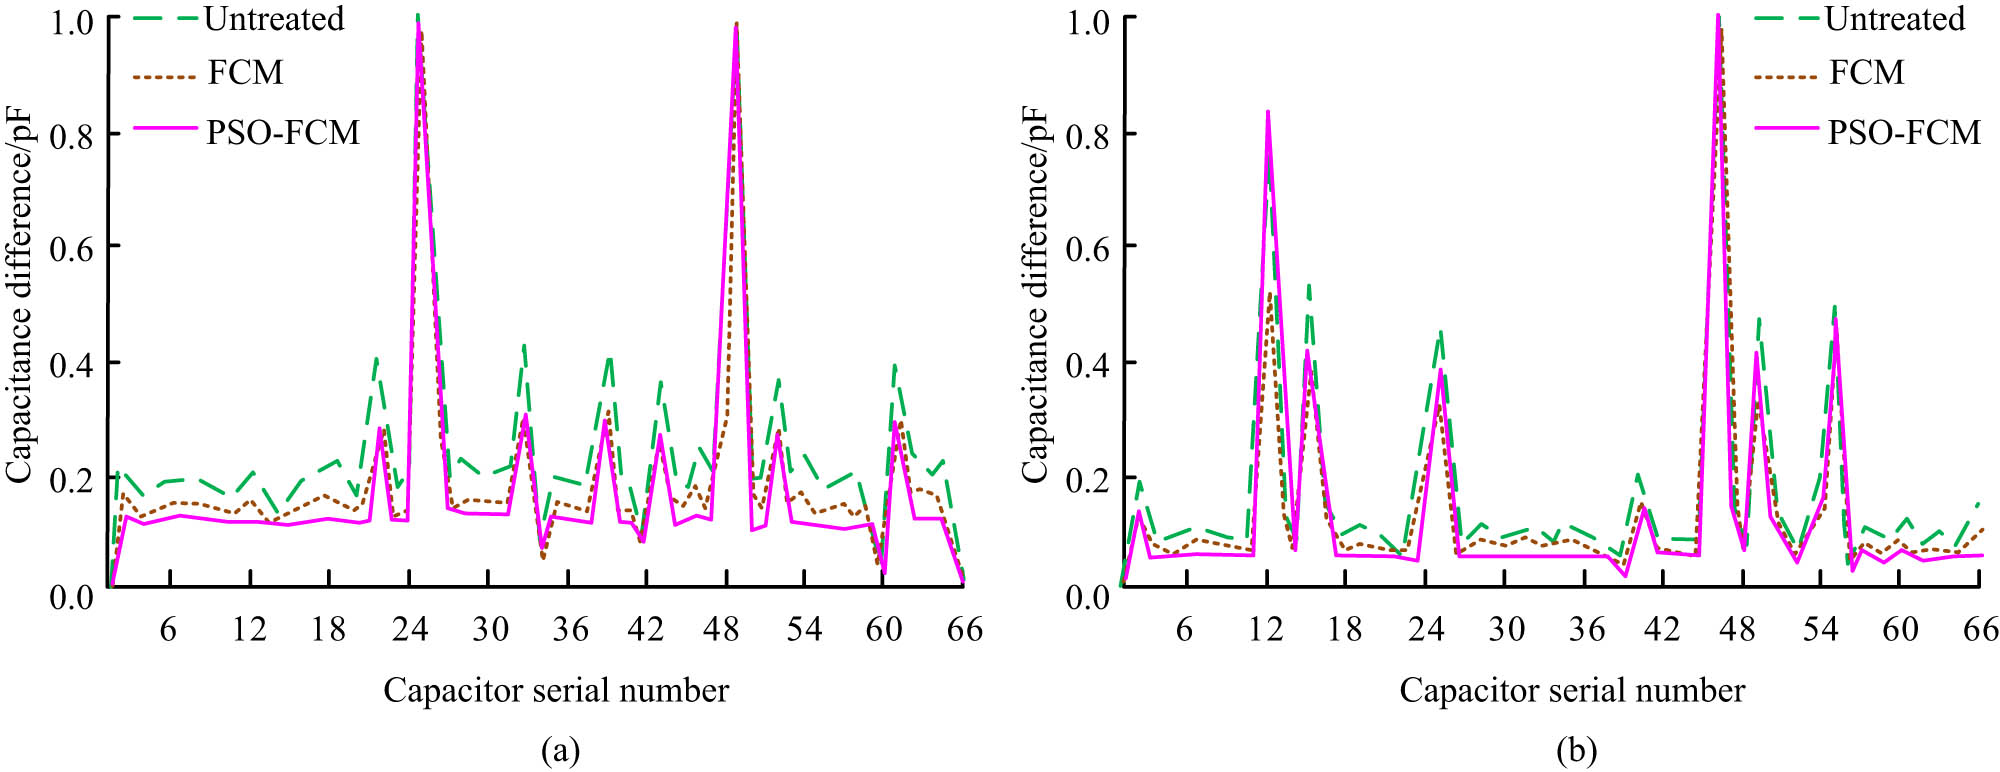
The capacitance data processing results of (a) sample 1 and (b) sample 2.
Figure 6(a) shows the capacitance data processing results of sample 1. The 25th and 49th capacitance data represent the capacitance difference at the defect location. The capacitance differences among 2–21, 27–32, and 53–59 are unstable. This results in low IR quality, which cannot accurately indicate defects’ shape, size, edge and other information, thereby affecting the detection effect of planar array capacitive sensors on adhesive layer defects. However, compared to FCM, after preprocessing the capacitance data using PSO-FCM, the smoothness of the capacitance difference at defect-free positions increases by 56%, improving the data effectiveness and stability. Figure 6(b) shows the capacitance data processing results of sample 2. PSO-FCM not only improves the stability and effectiveness of capacitance data but also makes the capacitance data at the defect location more prominent, enabling more effective detection of defects. Compared to FCM, PSO-FCM has significant advantages in capacitance difference processing. Figure 7 shows the capacitance data processing results of samples 3 and 4.

The capacitance data processing results of (a) sample 3 and (b) sample 4.
Figure 7(a) shows the capacitance data processing results of sample 3. Figure 7(b) shows the capacitance data processing results of sample 4. PSO-FCM not only improves the stability and effectiveness of capacitance data but also effectively highlights the capacitance difference at defect locations, making it easier to detect. Compared to FCM, PSO-FCM has more obvious advantages. It can improve the overall processing efficiency of capacitance data without affecting the stability of the capacitance difference in defect-free positions, providing more reliable data support for DD. Table 1 shows the impact of PSO-FCM on the stability of capacitance data.
Impact of the PSO-FCM method on the stability of capacitance data
| Sample | Algorithm | Raw data | Optimization data |
|---|---|---|---|
| 1 | FCM | 0.608 | 0.567 |
| PSO-FCM | 0.608 | 0.476 | |
| 2 | FCM | 0.621 | 0.588 |
| PSO-FCM | 0.621 | 0.477 | |
| 3 | FCM | 0.725 | 0.681 |
| PSO-FCM | 0.725 | 0.549 | |
| 4 | FCM | 0.716 | 0.673 |
| PSO-FCM | 0.716 | 0.551 |
In Table 1, FCM reduces the MAD data by about 6.1%, while PSO-FCM reduces the MAD data by about 23.2%. Compared to traditional FCM, PSO-FCM has significant effects in reducing data fluctuations and errors. PSO-FCM improves the optimized capacitance data stability. These optimized data have a smaller MAD compared to the original data. To further validate the effectiveness of PSO-FCM, the experiment uses local binary pattern (LBP) as the basis for algorithm stacking. Figure 8 shows the quality evaluation results of reconstructed images after stacking different algorithms.

The quality evaluation results of reconstructed images after stacking different algorithms: (a) relative image error and (b) image correlation coefficient.
Figure 8(a) shows the comparison results of relative image errors in reconstructed images, with smaller values indicating higher quality of reconstructed images. Compared to LBP and FCM-LBP, PSO-FCM-LBP reduces the relative error of reconstructed images by approximately 26.2 and 3.2%. Figure 8(b) shows the image correlation coefficients of the reconstructed images, with higher values indicating higher quality of the reconstructed images. Compared to LBP and FCM-LBP, PSO-FCM-LBP increases the image correlation coefficient of reconstructed images by approximately 41.8%. PSO-FCM-LBP has better performance in improving image quality and can be used as an effective data processing method. To verify the advantages of the PSO-FCM algorithm, the experiment compares GA-optimized FCM (GA-FCM), ant colony algorithm (ACO)-optimized FCM (ACO-FCM), and CNN. The performance comparison results of different algorithms are shown in Table 2.
Performance comparison results of different algorithms
| Algorithm | MAD (%) | Relative image errors | Image correlation coefficients |
|---|---|---|---|
| PSO-FCM | 13.6 | 1.132 | 0.687 |
| GA-FCM | 14.8 | 1.489 | 0.579 |
| ACO-FCM | 16.7 | 1.641 | 0.568 |
| CNN | 20.3 | 1.739 | 0.521 |
In Table 2, in terms of indicators, PSO-FCM is 13.6%, while GA-FCM reaches 14.8%. In terms of relative image error, PSO-FCM is 1.132, GA-FCM is 1.489, and CNN is 1.739. In terms of image correlation coefficient, PSO-FCM is 0.687, which is higher than the comparison algorithms. Overall, the PSO-FCM algorithm outperforms other algorithms in all metrics, providing more accurate, less erroneous, and strongly correlated results with the original image.
4.2 Application analysis of the IR algorithm based on the mixed regularization method
This study uses experimental specimens composed of epoxy resin plates and ceramic matrix composites, and four defect settings are followed. By applying PSO-FCM to preprocess capacitance data and combining the processed data with the sensitivity matrix, Tikhonov, TSVD, and mixed regularization methods are used to perform IR on defect samples. Figure 9 shows the IR results of different methods.

IR results using different methods: (a) sample 1 – Tikhonov, (b) sample 1 – TSVD, (c) sample 1 – mix, (d) sample 4 – Tikhonov, (e) sample 4 – TSVD, and (f) sample 4 – mix.
Figure 9(a)–(c) and (d)–(f) shows the reconstructed images of sample 1 and sample 4 obtained through Tikhonov, TSVD, and mixed regularization methods, respectively. Compared to the Tikhonov and TSVD methods, the mixed regularization method had significant advantages in the IR of defective samples. This method improves IR quality, reduces image noise, and more accurately reflects information such as the shape, size, and edges of defects. Therefore, this mixed regularization method is an effective way to improve the quality of IR. Figure 10 shows the reconstructed images’ quality evaluation using different methods.
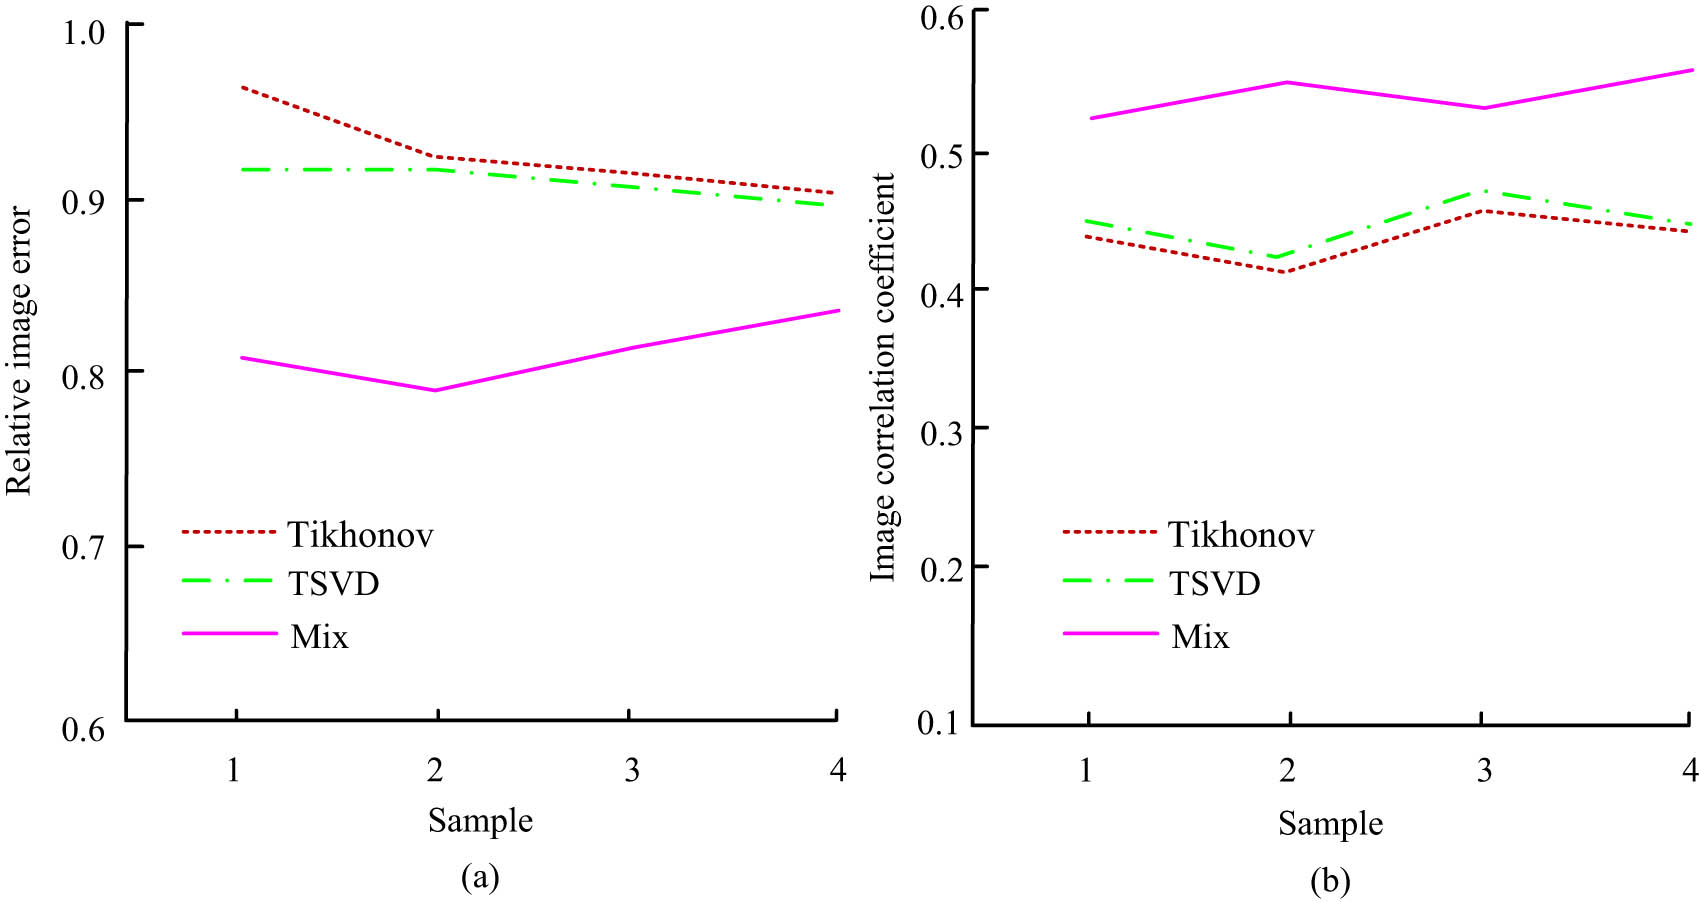
Quality evaluation of reconstructed images: (a) relative image error, and (b) image correlation coefficient.
Figure 10(a) shows the relative image error of the reconstructed images. Compared to the Tikhonov and TSVD methods, the mixed regularization method reduces the relative error of reconstructed images by about 13.1%. Figure 10(b) shows the image correlation coefficients of reconstructed images using different methods. Compared to the Tikhonov and TSVD methods, the mixed regularization method increases the correlation coefficient of reconstructed images by approximately 21.6%. Compared to Tikhonov and TSVD, the mixed regularization method shows higher quality in reducing the relative error of reconstructed images and increasing image correlation coefficients. After the optimal threshold processing, Table 3 shows the quality evaluation and DD accuracy of the reconstructed images.
Quality evaluation and DD accuracy of reconstructed images after optimal threshold processing
| Project | Algorithm | Sample 1 | Sample 2 | Sample 3 | Sample 4 |
|---|---|---|---|---|---|
| Relative image error coefficient | Mixed regularization method | 0.811 | 0.794 | 0.813 | 0.827 |
| Optimal threshold method post-processing | 0.694 | 0.683 | 0.712 | 0.704 | |
| Image correlation | Mixed regularization method | 0.512 | 0.521 | 0.533 | 0.534 |
| Optimal threshold method post-processing | 0.632 | 0.624 | 0.601 | 0.621 | |
| Accuracy | Mixed regularization method | 99.3% | 99.5% | 99.7% | 99.8% |
| Optimal threshold method post-processing | 100% | 100% | 100% | 100% |
In Table 3, after optimal threshold processing, the relative image error coefficient and image correlation of the reconstructed image are improved, and the DD accuracy reaches 100%. This indicates that the optimal threshold processing method effectively improves the quality of IR and the DD accuracy. To verify the advantages of the DD method, the experiment compares the ultrasonic detection method with X-ray imaging technology. The comparison of DD accuracy of different methods is shown in Table 4.
Comparison of DD accuracy using different methods
| Method | Sample 1 (%) | Sample 2 (%) | Sample 3 (%) | Sample 4 (%) | Average (%) |
|---|---|---|---|---|---|
| Research proposed | 100 | 100 | 100 | 100 | 100 |
| Ultrasonic testing | 85.3 | 81.6 | 70.3 | 69.8 | 76.8 |
| X-ray imaging | 98.6 | 99.2 | 93.7 | 94.4 | 96.5 |
In Table 4, the accuracy of the proposed method reaches 100%. The average accuracy of the ultrasonic detection method is 76.8%, with the lowest accuracy of 69.8% in Sample 4. The average accuracy of X-ray imaging technology is 96.5%, which is relatively high but still lower than the proposed method. The results indicate that the proposed method has significant advantages in DD, demonstrating its high reliability and effectiveness in practical applications.
5 Conclusion
This PACI system has problems such as poor capacitance data stability and susceptibility to noise interference in the adhesive layer DD. Therefore, a capacitance data preprocessing method based on PSO-FCM was proposed. Meanwhile, the sensitivity matrix and mixed regularization method were combined to perform IR on the defective samples, thereby improving the reconstructed images’ accuracy. These results confirmed that after preprocessing the capacitance data with PSO-FCM, the stationarity of capacitance difference at defect-free positions increased by 56%. FCM reduced the data MAD by about 6.1%, while PSO-FCM reduced the data MAD by about 23.2%. Compared to traditional FCM, PSO-FCM had significant effects in reducing data fluctuations and errors, effectively improving IR quality and DD accuracy. Compared to Tikhonov and TSVD, the mixed regularization method increased the correlation coefficient of reconstructed images by approximately 21.6%. After optimal threshold processing, the relative image error coefficient and image correlation of the reconstructed image were improved, and the DD accuracy reached 100%. The optimal threshold processing method effectively improved the IR quality and DD accuracy. This study provides an effective capacitance data preprocessing method that can improve the accuracy of adhesive layer DD, which has a positive impact on improving production efficiency, reducing production costs, and ensuring product quality and safety. However, there are still certain limitations in this research, as the defects used in this experiment are limited to the adhesive layer. Future research can further explore the impact of research methods on the DD effects of different objects to enhance the generalization ability of this method.
-
Funding information: Author states no funding involved.
-
Author contributions: Author has accepted responsibility for the entire content of this manuscript and approved its submission.
-
Conflict of interest: Author states no conflict of interest.
-
Data availability statement: All data generated or analyzed during this study are included in this published article.
References
[1] Xu JH, Wang LX, Zhang SY, Tan JR. Predictive defect detection for prototype additive manufacturing based on multi-layer susceptibility discrimination. Adv Manuf. 2023;11(3):407–27.10.1007/s40436-023-00446-0Search in Google Scholar
[2] Song XF, Zhang Y, Gong DW, Gao XY. A fast hybrid feature selection based on correlation-guided clustering and particle swarm optimization for high-dimensional data. IEEE Trans Cybern. 2021;52(9):9573–86.10.1109/TCYB.2021.3061152Search in Google Scholar PubMed
[3] Tirumani VHL, Tenneti M, Srikavya KC, Kotamraju SK. Image resolution and contrast enhancement with optimal brightness compensation using wavelet transforms and particle swarm optimization. IET Image Process. 2021;15(12):2833–40.10.1049/ipr2.12268Search in Google Scholar
[4] Minh HL, Khatir S, Wahab MA, Thanh CL. An enhancing particle swarm optimization algorithm (EHVPSO) for damage identification in 3D transmission tower. Eng Struct. 2021;242:112412–34.10.1016/j.engstruct.2021.112412Search in Google Scholar
[5] Wang ZJ, Zhan ZH, Kwong S, Jin H, Zhang J. Adaptive granularity learning distributed particle swarm optimization for large-scale optimization. IEEE Trans Cybern. 2020;51(3):1175–88.10.1109/TCYB.2020.2977956Search in Google Scholar PubMed
[6] Fan D, Wang J. An individual-based mean-field model for fake-news spreading on PSO-based networks. Int J Mod Phys B. 2020;34:2050172–82.10.1142/S0217979220501726Search in Google Scholar
[7] Kulkarni PP, Ghawghawe ND. Hybrid DA-PSO approach for optimal location and parameter settings for TCSC controller in power system. IET Gener Transm Distrib. 2020;14(7):1222–32.10.1049/iet-gtd.2019.0016Search in Google Scholar
[8] Pant M, Kumar S. Particle swarm optimization and intuitionistic fuzzy set-based novel method for fuzzy time series forecasting. Granul Comput. 2022;7(2):285–303.10.1007/s41066-021-00265-3Search in Google Scholar
[9] Lin Y, Chen S. A centroid auto-fused hierarchical fuzzy c-means clustering. IEEE Trans Fuzzy Syst. 2021;29(7):2006–17.10.1109/TFUZZ.2020.2991306Search in Google Scholar
[10] Kiruba Nesamalar E, SatheeshKumar J, Amudha T. Efficient DNA-ligand interaction framework using fuzzy C-means clustering based glowworm swarm optimization (FCMGSO) method. J Biomol Struct Dyn. 2023;41(13):6249–61.10.1080/07391102.2022.2105958Search in Google Scholar PubMed
[11] Xiang S, Liang D, Kaneko S, Asano H. Robust defect detection in 2D images printed on 3D micro-textured surfaces by multiple paired pixel consistency in orientation codes. IET Image Process. 2020;14(7):3373–84.10.1049/iet-ipr.2019.0724Search in Google Scholar
[12] Cao Y, Xu H, Su C, Yang Q. Accurate glass insulators defect detection in power transmission grids using aerial image augmentation. IEEE Trans Power Deliv. 2023;38(2):956–65.10.1109/TPWRD.2022.3202958Search in Google Scholar
[13] Zhang H, Chen X, Lu S, Yao L, Chen X. A contrastive learning-based attention generative adversarial network for defect detection in colour-patterned fabric. Color Technol. 2023;139(3):248–64.10.1111/cote.12642Search in Google Scholar
[14] Pan J, Zeng D, Tan Q, Wu Z, Ren Z. EU-Net: a novel semantic segmentation architecture for surface defect detection of mobile phone screens. IET Image Process. 2022;16(10):2568–76.10.1049/ipr2.12509Search in Google Scholar
[15] Zhao H, Zhang H, Su G, Shi X. Defect diagnosis method of cable shielding layer based on frequency domain reflection coefficient spectrum. IEEE Trans Electromagn Compat. 2023;65(1):114–25.10.1109/TEMC.2022.3213351Search in Google Scholar
[16] Nguyen TPQ, Yang CL, Le MD, Nguyen TT, Luu MT. Enhancing automated defect detection through sequential clustering and classification: an industrial case study using the sine-cosine algorithm, possibilistic fuzzy c-means, and artificial neural network. Adv Prod Eng Manage. 2023;18(2):237–49.10.14743/apem2023.2.470Search in Google Scholar
[17] Li F, Xiao K, Hu Z, Zhang G. Fabric defect detection algorithm based on improved YOLOv5. Vis Comput. 2024;40(4):2309–24.10.1007/s00371-023-02918-7Search in Google Scholar
[18] Tziolas T, Papageorgiou K, Feleki A, Theodosiou T, Rapti K, Papageorgiou E, et al. Deep fuzzy cognitive maps for defect inspection in antenna assembly. Procedia Comput Sci. 2024;232:97–106.10.1016/j.procs.2024.01.010Search in Google Scholar
[19] Zheng S, Zhang S, Luo Y, Xu B, Hao W. Nondestructive analysis of debonding in composite/rubber/rubber structure using ultrasonic pulse-echo method. Nondestruct Test Eval. 2020;36(5):515–27.10.1080/10589759.2020.1825707Search in Google Scholar
[20] Elmoghazy Y, Abuelgasim EMO, Osman SA, Afaneh YRH, Eissa OMA, Safaei B. Effective mechanical properties evaluation of unidirectional and bidirectional composites using virtual domain approach at microscale. Arch Adv Eng Sci. 2023;1(1):27–37.10.47852/bonviewAAES32021723Search in Google Scholar
[21] Nengem SM. Symmetric kernel-based approach for elliptic partial differential equation. J Data Sci Intell Syst. 2023;1(2):99–104.10.47852/bonviewJDSIS3202884Search in Google Scholar
© 2025 the author(s), published by De Gruyter
This work is licensed under the Creative Commons Attribution 4.0 International License.
Articles in the same Issue
- Research Articles
- Generalized (ψ,φ)-contraction to investigate Volterra integral inclusions and fractal fractional PDEs in super-metric space with numerical experiments
- Solitons in ultrasound imaging: Exploring applications and enhancements via the Westervelt equation
- Stochastic improved Simpson for solving nonlinear fractional-order systems using product integration rules
- Exploring dynamical features like bifurcation assessment, sensitivity visualization, and solitary wave solutions of the integrable Akbota equation
- Research on surface defect detection method and optimization of paper-plastic composite bag based on improved combined segmentation algorithm
- Impact the sulphur content in Iraqi crude oil on the mechanical properties and corrosion behaviour of carbon steel in various types of API 5L pipelines and ASTM 106 grade B
- Unravelling quiescent optical solitons: An exploration of the complex Ginzburg–Landau equation with nonlinear chromatic dispersion and self-phase modulation
- Perturbation-iteration approach for fractional-order logistic differential equations
- Variational formulations for the Euler and Navier–Stokes systems in fluid mechanics and related models
- Rotor response to unbalanced load and system performance considering variable bearing profile
- DeepFowl: Disease prediction from chicken excreta images using deep learning
- Channel flow of Ellis fluid due to cilia motion
- A case study of fractional-order varicella virus model to nonlinear dynamics strategy for control and prevalence
- Multi-point estimation weldment recognition and estimation of pose with data-driven robotics design
- Analysis of Hall current and nonuniform heating effects on magneto-convection between vertically aligned plates under the influence of electric and magnetic fields
- A comparative study on residual power series method and differential transform method through the time-fractional telegraph equation
- Insights from the nonlinear Schrödinger–Hirota equation with chromatic dispersion: Dynamics in fiber–optic communication
- Mathematical analysis of Jeffrey ferrofluid on stretching surface with the Darcy–Forchheimer model
- Exploring the interaction between lump, stripe and double-stripe, and periodic wave solutions of the Konopelchenko–Dubrovsky–Kaup–Kupershmidt system
- Computational investigation of tuberculosis and HIV/AIDS co-infection in fuzzy environment
- Signature verification by geometry and image processing
- Theoretical and numerical approach for quantifying sensitivity to system parameters of nonlinear systems
- Chaotic behaviors, stability, and solitary wave propagations of M-fractional LWE equation in magneto-electro-elastic circular rod
- Dynamic analysis and optimization of syphilis spread: Simulations, integrating treatment and public health interventions
- Visco-thermoelastic rectangular plate under uniform loading: A study of deflection
- Threshold dynamics and optimal control of an epidemiological smoking model
- Numerical computational model for an unsteady hybrid nanofluid flow in a porous medium past an MHD rotating sheet
- Regression prediction model of fabric brightness based on light and shadow reconstruction of layered images
- Dynamics and prevention of gemini virus infection in red chili crops studied with generalized fractional operator: Analysis and modeling
- Qualitative analysis on existence and stability of nonlinear fractional dynamic equations on time scales
- Fractional-order super-twisting sliding mode active disturbance rejection control for electro-hydraulic position servo systems
- Analytical exploration and parametric insights into optical solitons in magneto-optic waveguides: Advances in nonlinear dynamics for applied sciences
- Bifurcation dynamics and optical soliton structures in the nonlinear Schrödinger–Bopp–Podolsky system
- User profiling in university libraries by combining multi-perspective clustering algorithm and reader behavior analysis
- Exploring bifurcation and chaos control in a discrete-time Lotka–Volterra model framework for COVID-19 modeling
- Review Article
- Haar wavelet collocation method for existence and numerical solutions of fourth-order integro-differential equations with bounded coefficients
- Special Issue: Nonlinear Analysis and Design of Communication Networks for IoT Applications - Part II
- Silicon-based all-optical wavelength converter for on-chip optical interconnection
- Research on a path-tracking control system of unmanned rollers based on an optimization algorithm and real-time feedback
- Analysis of the sports action recognition model based on the LSTM recurrent neural network
- Industrial robot trajectory error compensation based on enhanced transfer convolutional neural networks
- Research on IoT network performance prediction model of power grid warehouse based on nonlinear GA-BP neural network
- Interactive recommendation of social network communication between cities based on GNN and user preferences
- Application of improved P-BEM in time varying channel prediction in 5G high-speed mobile communication system
- Construction of a BIM smart building collaborative design model combining the Internet of Things
- Optimizing malicious website prediction: An advanced XGBoost-based machine learning model
- Economic operation analysis of the power grid combining communication network and distributed optimization algorithm
- Sports video temporal action detection technology based on an improved MSST algorithm
- Internet of things data security and privacy protection based on improved federated learning
- Enterprise power emission reduction technology based on the LSTM–SVM model
- Construction of multi-style face models based on artistic image generation algorithms
- Research and application of interactive digital twin monitoring system for photovoltaic power station based on global perception
- Special Issue: Decision and Control in Nonlinear Systems - Part II
- Animation video frame prediction based on ConvGRU fine-grained synthesis flow
- Application of GGNN inference propagation model for martial art intensity evaluation
- Benefit evaluation of building energy-saving renovation projects based on BWM weighting method
- Deep neural network application in real-time economic dispatch and frequency control of microgrids
- Real-time force/position control of soft growing robots: A data-driven model predictive approach
- Mechanical product design and manufacturing system based on CNN and server optimization algorithm
- Application of finite element analysis in the formal analysis of ancient architectural plaque section
- Research on territorial spatial planning based on data mining and geographic information visualization
- Fault diagnosis of agricultural sprinkler irrigation machinery equipment based on machine vision
- Closure technology of large span steel truss arch bridge with temporarily fixed edge supports
- Intelligent accounting question-answering robot based on a large language model and knowledge graph
- Analysis of manufacturing and retailer blockchain decision based on resource recyclability
- Flexible manufacturing workshop mechanical processing and product scheduling algorithm based on MES
- Exploration of indoor environment perception and design model based on virtual reality technology
- Tennis automatic ball-picking robot based on image object detection and positioning technology
- A new CNN deep learning model for computer-intelligent color matching
- Design of AR-based general computer technology experiment demonstration platform
- Indoor environment monitoring method based on the fusion of audio recognition and video patrol features
- Health condition prediction method of the computer numerical control machine tool parts by ensembling digital twins and improved LSTM networks
- Establishment of a green degree evaluation model for wall materials based on lifecycle
- Quantitative evaluation of college music teaching pronunciation based on nonlinear feature extraction
- Multi-index nonlinear robust virtual synchronous generator control method for microgrid inverters
- Manufacturing engineering production line scheduling management technology integrating availability constraints and heuristic rules
- Analysis of digital intelligent financial audit system based on improved BiLSTM neural network
- Attention community discovery model applied to complex network information analysis
- A neural collaborative filtering recommendation algorithm based on attention mechanism and contrastive learning
- Rehabilitation training method for motor dysfunction based on video stream matching
- Research on façade design for cold-region buildings based on artificial neural networks and parametric modeling techniques
- Intelligent implementation of muscle strain identification algorithm in Mi health exercise induced waist muscle strain
- Optimization design of urban rainwater and flood drainage system based on SWMM
- Improved GA for construction progress and cost management in construction projects
- Evaluation and prediction of SVM parameters in engineering cost based on random forest hybrid optimization
- Museum intelligent warning system based on wireless data module
- Optimization design and research of mechatronics based on torque motor control algorithm
- Special Issue: Nonlinear Engineering’s significance in Materials Science
- Experimental research on the degradation of chemical industrial wastewater by combined hydrodynamic cavitation based on nonlinear dynamic model
- Study on low-cycle fatigue life of nickel-based superalloy GH4586 at various temperatures
- Some results of solutions to neutral stochastic functional operator-differential equations
- Ultrasonic cavitation did not occur in high-pressure CO2 liquid
- Research on the performance of a novel type of cemented filler material for coal mine opening and filling
- Testing of recycled fine aggregate concrete’s mechanical properties using recycled fine aggregate concrete and research on technology for highway construction
- A modified fuzzy TOPSIS approach for the condition assessment of existing bridges
- Nonlinear structural and vibration analysis of straddle monorail pantograph under random excitations
- Achieving high efficiency and stability in blue OLEDs: Role of wide-gap hosts and emitter interactions
- Construction of teaching quality evaluation model of online dance teaching course based on improved PSO-BPNN
- Enhanced electrical conductivity and electromagnetic shielding properties of multi-component polymer/graphite nanocomposites prepared by solid-state shear milling
- Optimization of thermal characteristics of buried composite phase-change energy storage walls based on nonlinear engineering methods
- A higher-performance big data-based movie recommendation system
- Nonlinear impact of minimum wage on labor employment in China
- Nonlinear comprehensive evaluation method based on information entropy and discrimination optimization
- Application of numerical calculation methods in stability analysis of pile foundation under complex foundation conditions
- Research on the contribution of shale gas development and utilization in Sichuan Province to carbon peak based on the PSA process
- Characteristics of tight oil reservoirs and their impact on seepage flow from a nonlinear engineering perspective
- Nonlinear deformation decomposition and mode identification of plane structures via orthogonal theory
- Numerical simulation of damage mechanism in rock with cracks impacted by self-excited pulsed jet based on SPH-FEM coupling method: The perspective of nonlinear engineering and materials science
- Cross-scale modeling and collaborative optimization of ethanol-catalyzed coupling to produce C4 olefins: Nonlinear modeling and collaborative optimization strategies
- Unequal width T-node stress concentration factor analysis of stiffened rectangular steel pipe concrete
- Special Issue: Advances in Nonlinear Dynamics and Control
- Development of a cognitive blood glucose–insulin control strategy design for a nonlinear diabetic patient model
- Big data-based optimized model of building design in the context of rural revitalization
- Multi-UAV assisted air-to-ground data collection for ground sensors with unknown positions
- Design of urban and rural elderly care public areas integrating person-environment fit theory
- Application of lossless signal transmission technology in piano timbre recognition
- Application of improved GA in optimizing rural tourism routes
- Architectural animation generation system based on AL-GAN algorithm
- Advanced sentiment analysis in online shopping: Implementing LSTM models analyzing E-commerce user sentiments
- Intelligent recommendation algorithm for piano tracks based on the CNN model
- Visualization of large-scale user association feature data based on a nonlinear dimensionality reduction method
- Low-carbon economic optimization of microgrid clusters based on an energy interaction operation strategy
- Optimization effect of video data extraction and search based on Faster-RCNN hybrid model on intelligent information systems
- Construction of image segmentation system combining TC and swarm intelligence algorithm
- Particle swarm optimization and fuzzy C-means clustering algorithm for the adhesive layer defect detection
- Optimization of student learning status by instructional intervention decision-making techniques incorporating reinforcement learning
- Fuzzy model-based stabilization control and state estimation of nonlinear systems
- Optimization of distribution network scheduling based on BA and photovoltaic uncertainty
- Tai Chi movement segmentation and recognition on the grounds of multi-sensor data fusion and the DBSCAN algorithm
- Special Issue: Dynamic Engineering and Control Methods for the Nonlinear Systems - Part III
- Generalized numerical RKM method for solving sixth-order fractional partial differential equations