Establishment of a green degree evaluation model for wall materials based on lifecycle

Abstract
With the increasing demand for green and environmentally friendly building materials, the development of the building materials industry is gradually moving toward an ecological and sustainable direction. At present, there are various indicators for evaluating the greenness of wall materials, and the evaluation methods are mainly in view of personal experience. Therefore, this study designed a green degree evaluation model for wall materials. The model is first in view of the lifecycle of the wall material, considering factors that affect the greenness of the wall material. Then, an improved mathematical hierarchy process is used for modeling, and finally, indicator weights are calculated, and the model is simulated for application. The results indicate that the model can reasonably and accurately rate the greenness of wall materials with different characteristics and has high scientific and practical significance. The survey results show that the satisfaction level of the model is high, indicating that it has broad application prospects and development potential in practical applications and can provide strong support for promoting the sustainability and green development of the building materials industry.
1 Introduction
As people’s attention to environmental protection, energy conservation, sustainability, and other issues deepens, the development of the building materials industry is gradually shifting toward green, ecological, and sustainable directions. As an important component of building materials, wall materials play a crucial role in the quality and environmental protection of buildings [1]. Nowadays, improving the environmental friendliness and greenness of wall materials has become an important development direction in the construction industry. The production, use, and disposal of wall materials throughout their entire lifecycle will have a certain impact on the environment, society, and economy. Therefore, in developing green wall materials, it is necessary to evaluate the greenness of wall materials and to provide a scientific basis for the selection and production of wall materials [2,3]. Traditionally, people evaluate the greenness of wall materials through empirical methods, single indicator methods, and other methods. However, these methods have many shortcomings: there is no complete evaluation system; the evaluation indicators are relatively single, making it difficult to make reasonable judgments; lack of standardized evaluation data; lack of scientific and comprehensiveness. These issues make it difficult for traditional wall material greenness evaluation systems to meet the needs of modern green buildings [4,5]. Therefore, many experts have conducted research on the general evaluation of building materials and greenness. To determine the relationship between green building factors and sustainable performance, Shurrab et al. conducted data collection and exploratory factor analysis by visiting multiple building professionals. The results delineated the relationship between green and sustainability in the construction industry and explored the impact of green management on sustainability [6]. Colorado et al. have taken actions to encourage sustainable development of materials in the areas of circular economy and material recycling to increase the possibility and awareness of using “additive manufacturing.” They have conducted in-depth research on materials such as ceramics, metals, and composite materials. The results indicate that significant breakthroughs have been made in additive manufacturing technology, which has attracted the attention of all parties [7]. Jalaei et al. used building information modeling to evaluate the reduction of waste and environmental impacts during the construction phase of building materials. This model deeply analyzes the causes of waste generation, calculates the waste generated in each stage of building materials, and proposes corresponding solutions. The results indicate that the proposed model has good practical performance [8]. Michalopoulou et al. evaluated and analyzed the performance of nano lime dispersion to protect clay-based building materials in archaeology. The results indicate that nano lime dispersion has repair and protection effects on clay-based building materials [9].
However, these methods lack a systematic assessment of the entire lifecycle, making it difficult to fully reflect the environmental impact of wall materials at various stages such as production, use, and disposal. In contrast, the lifecycle-based evaluation method for green wall materials comprehensively considers the impact of wall materials on sustainable development from multiple aspects such as environment, society, and economy during their lifecycle. Cavalieri et al. proposed traditional RC column sleeve reinforcement and innovative solutions based on energy dissipation to address the insufficient seismic performance of prefabricated reinforced concrete industrial buildings during earthquakes. Then, the environmental impact of the two solutions was quantitatively evaluated through a lifecycle assessment (LCA) based on an Environmental Product Declaration, and the results showed that the energy dissipation-based solution was more environmentally friendly [10]. To reduce the environmental impact of logging, Gan et al. analyzed and evaluated the environmental impact of various stages of logging through LCA methods and proposed corresponding suggestions for reducing environmental impact [5]. Di Domênico et al. conducted an LCA on the environmental impact of the embedding and maintenance of social interest housing building systems. By evaluating two housing building systems, it was found that the production and transportation stages have the greatest environmental impact, while the use and maintenance stages have relatively small environmental impacts. This study has a certain guiding significance for the environmental sustainability of housing construction systems [11].
To achieve accurate green evaluation of wall materials, it is necessary to introduce the analytic hierarchy process (AHP). AHP is a systematic decision analysis method that can decompose complex multi-objective decision-making problems into multiple levels and provide a scientific basis for decision-making through a combination of qualitative and quantitative methods. Oztaysi et al. proposed a method in view of spherical fuzzy AHP scoring to artificially determine the price of goods in a location-based system. This method determines the weights of multiple factors on commodity prices and applies them to dynamic pricing models, making pricing more flexible and targeted. The results indicate that the model can accurately set prices in view of different scenarios [12]. Nuroji et al. used the AHP to compare the performance of two types of concrete rigid pavement. This method first analyzes the characteristics, advantages, and disadvantages of precast concrete and traditional concrete rigid pavement and establishes a hierarchical structure model on this basis. Then, it determines the degree and priority of each factor’s impact on the concrete pavement. The results indicate that prefabricated concrete is superior to traditional concrete rigid pavement in some aspects, but slightly inferior in other aspects [13]. Darko et al. reviewed the application of AHP in the field of architecture and analyzed its application in decision-making analysis in the field of architecture. They summarized the advantages and disadvantages of AHP in the field of architecture; then, further research directions and suggestions were proposed [14]. However, the disadvantage of this method is that the subjectivity of expert allocation of indicator weights is too strong. Therefore, this study improved it through expert clustering analysis and fuzzy matrix evaluation methods.
The research of numerous scholars, both domestically and internationally, indicates that the green development of building materials has become a hot topic in the field of architecture. As one of the important components of architecture, wall materials have attracted much attention in terms of their environmental friendliness and greenness. Researchers have also used various methods for evaluation in this field, such as LCA and AHP. However, due to the limitations and subjectivity of the method itself, further improvement is needed. Therefore, this study constructed a green degree evaluation model for wall materials in view of the lifecycle. This model deeply analyzes the various green degree indicators that affect the lifecycle of wall materials and uses an improved AHP to calculate weights. It is expected to accurately score the green degree of wall materials.
The research is mainly separated into four sections: The first mainly introduces the research on building materials by domestic and foreign experts, as well as the application of lifecycle and AHP; the second mainly explains the improvement strategy of AHP and the construction of a green degree evaluation model for wall materials; the third mainly calculates some parameters in the second section for the simulation application of wall material greenness; the fourth mainly analyzes the calculation and application results and points out the shortcomings of the research methods.
2 Improvement and model construction of green degree evaluation method for wall materials
The study proposes a construction method for a green degree evaluation model of wall materials in view of the lifecycle, which adopts an improved AHP-fuzzy comprehensive evaluation method. This method comprehensively considers the environmental, social, and economic factors that affect the wall material. By analyzing and calculating the weight of evaluation indicators, the final comprehensive evaluation result of the green degree of the wall material is obtained. Meanwhile, this study also proposes improvements to the traditional AHP method, enhancing the reliability and credibility of the evaluation model, which can be used for evaluation in other fields.
2.1 Improvement strategy of AHP method in view of lifecycle
The AHP has been widely applied in LCA; AHP divides the entire lifecycle into multiple levels, and each level is organized according to certain rules to determine the weight relationship between each level in the hierarchical structure. Then, by calculating and comparing the weights of each level, the final comprehensive evaluation result is obtained. It establishes a hierarchical relationship structure among the elements of the wall material and determines the subordinate relationships between each element. It sets
where
Definition of weight scale
| Scale | Definition |
|---|---|
| 1 | The
|
| 3 | The
|
| 5 | The
|
| 7 | The
|
| 9 | The
|
| 2, 4, 6, 8 | Represents the scale value corresponding to the intermediate state of the two judgments mentioned above |
| Count backwards | The judgment value of
|
In view of this, the judgment matrix
Then, in view of the judgment matrix, the eigenvectors are obtained, and the weights are calculated as follows:
In Eq. (3),
where
In Eq. (6),
In Eq. (7),
After calculating the
In Eq. (9),
In Eq. (10),
The evaluation indicators for wall materials are evaluated in view of the evaluation level analogy. The fuzzy comprehensive evaluation matrix
The green degree rating indicators for wall materials designed in this study have three levels, so a multi-level comprehensive fuzzy evaluation model is needed. Multiplying the expert’s evaluation weight
According to Eq. (13) and combined with expert evaluation level
2.2 Construction of a green degree evaluation model for wall materials in view of lifecycle
The greenness evaluation of wall materials plays an important role in many aspects, such as helping major consumer groups choose more suitable wall materials for their own buildings and helping the government evaluate the greenness of enterprise wall materials. The general steps for constructing a green degree evaluation model for wall materials are shown in Figure 1.
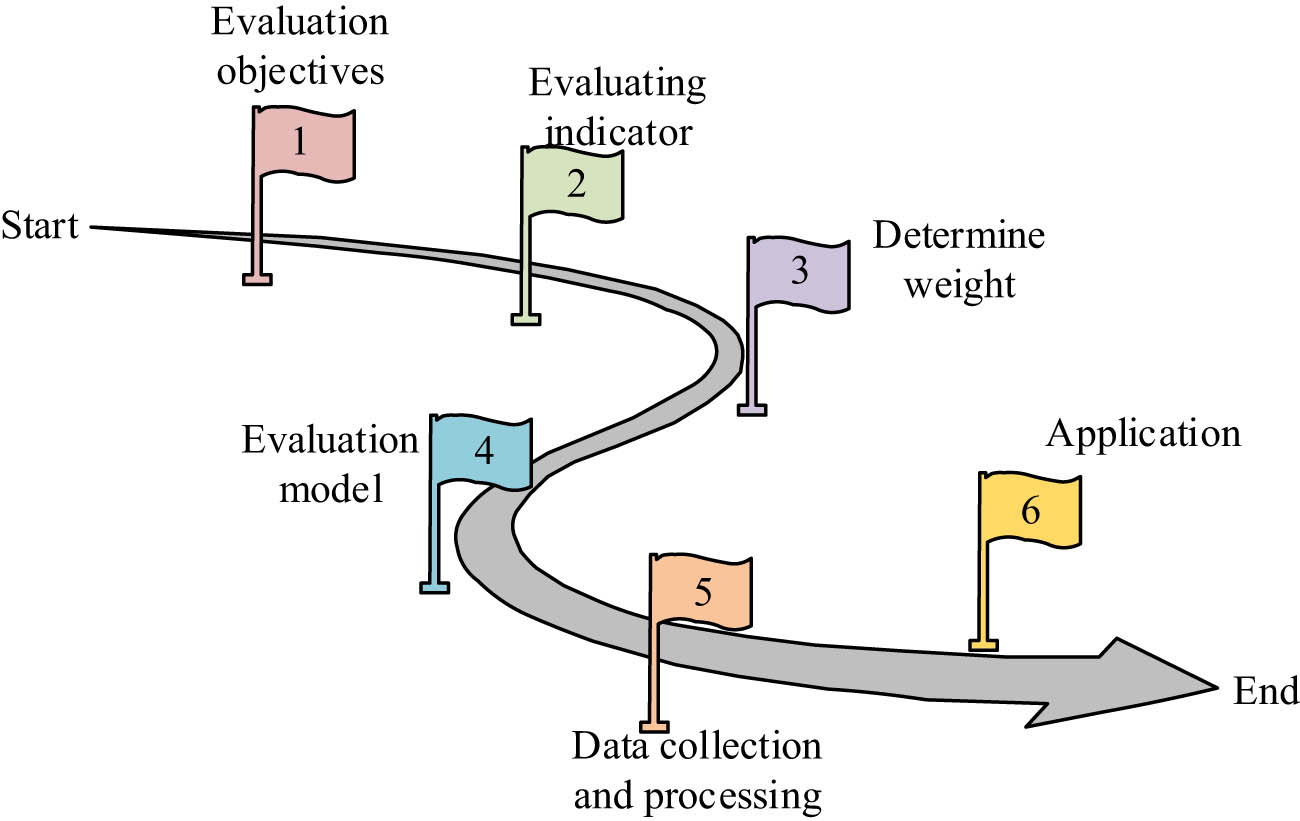
Construction steps of wall material evaluation model.
Figure 1 shows that the considerations for constructing a green degree evaluation model for wall materials in this study are as follows: first, define the evaluation objectives and clarify the focus of green degree evaluation for wall materials; then, it is divided into first- and second-level evaluation indicators; then, it determines the weights of these indicators; it reuses the improved AHP fuzzy comprehensive evaluation method for model construction; it collects relevant data to calculate indicator scores; finally, it is applied. This study uses the lifecycle method to analyze the possible influencing factors of wall materials. LCA is the assessment of the impact of a product or service on the environment and resources throughout its entire lifecycle. This method has important application value in green environmental protection and sustainable development. The input and output of the entire lifecycle of the wall material with the environment are shown in Figure 2.

Analysis of influencing factors at different stages of the wall material lifecycle.
Figure 2 shows that the lifecycle of comprehensively evaluating the greenness of wall materials mainly includes five stages: raw material stage, production and manufacturing stage, transportation stage, use stage, and recycling and reuse stage. The raw material collection stage requires the consumption of a large amount of natural resources (such as ore, wood, clay), which may lead to deforestation, land degradation, and ecosystem damage, as well as material loss, reducing resource utilization efficiency. The production and manufacturing stage consumes a large amount of energy (such as electricity and fuel), increases greenhouse gas emissions, and may also emit harmful gases, wastewater, and solid waste (such as excessive heavy metals and volatile organic compounds [VOCs]), which are harmful to the environment and human health. Process selection and technological level have a significant impact on energy efficiency and pollutant emissions. The transportation phase consumes fuel and generates greenhouse gases such as carbon dioxide, and exhaust emissions affect air quality. During use, wall materials with good insulation performance and high durability can reduce energy and resource consumption, but may release formaldehyde and VOCs, which can affect indoor air quality and human health. In the recycling and reuse stage, reasonable waste disposal methods and equipment can reduce secondary pollution, high reuse rates can reduce resource waste and new material production demand, and pollutant emissions and treatment methods directly affect the environment [16]. Through the analysis of these five stages, the greenness of wall materials can be comprehensively evaluated, providing a scientific basis for the research and application of green building materials. This study comprehensively considers the influencing factors of each stage of the wall material lifecycle and constructs a two-level evaluation hierarchy for the green degree of wall materials. The details are shown in Figure 3.
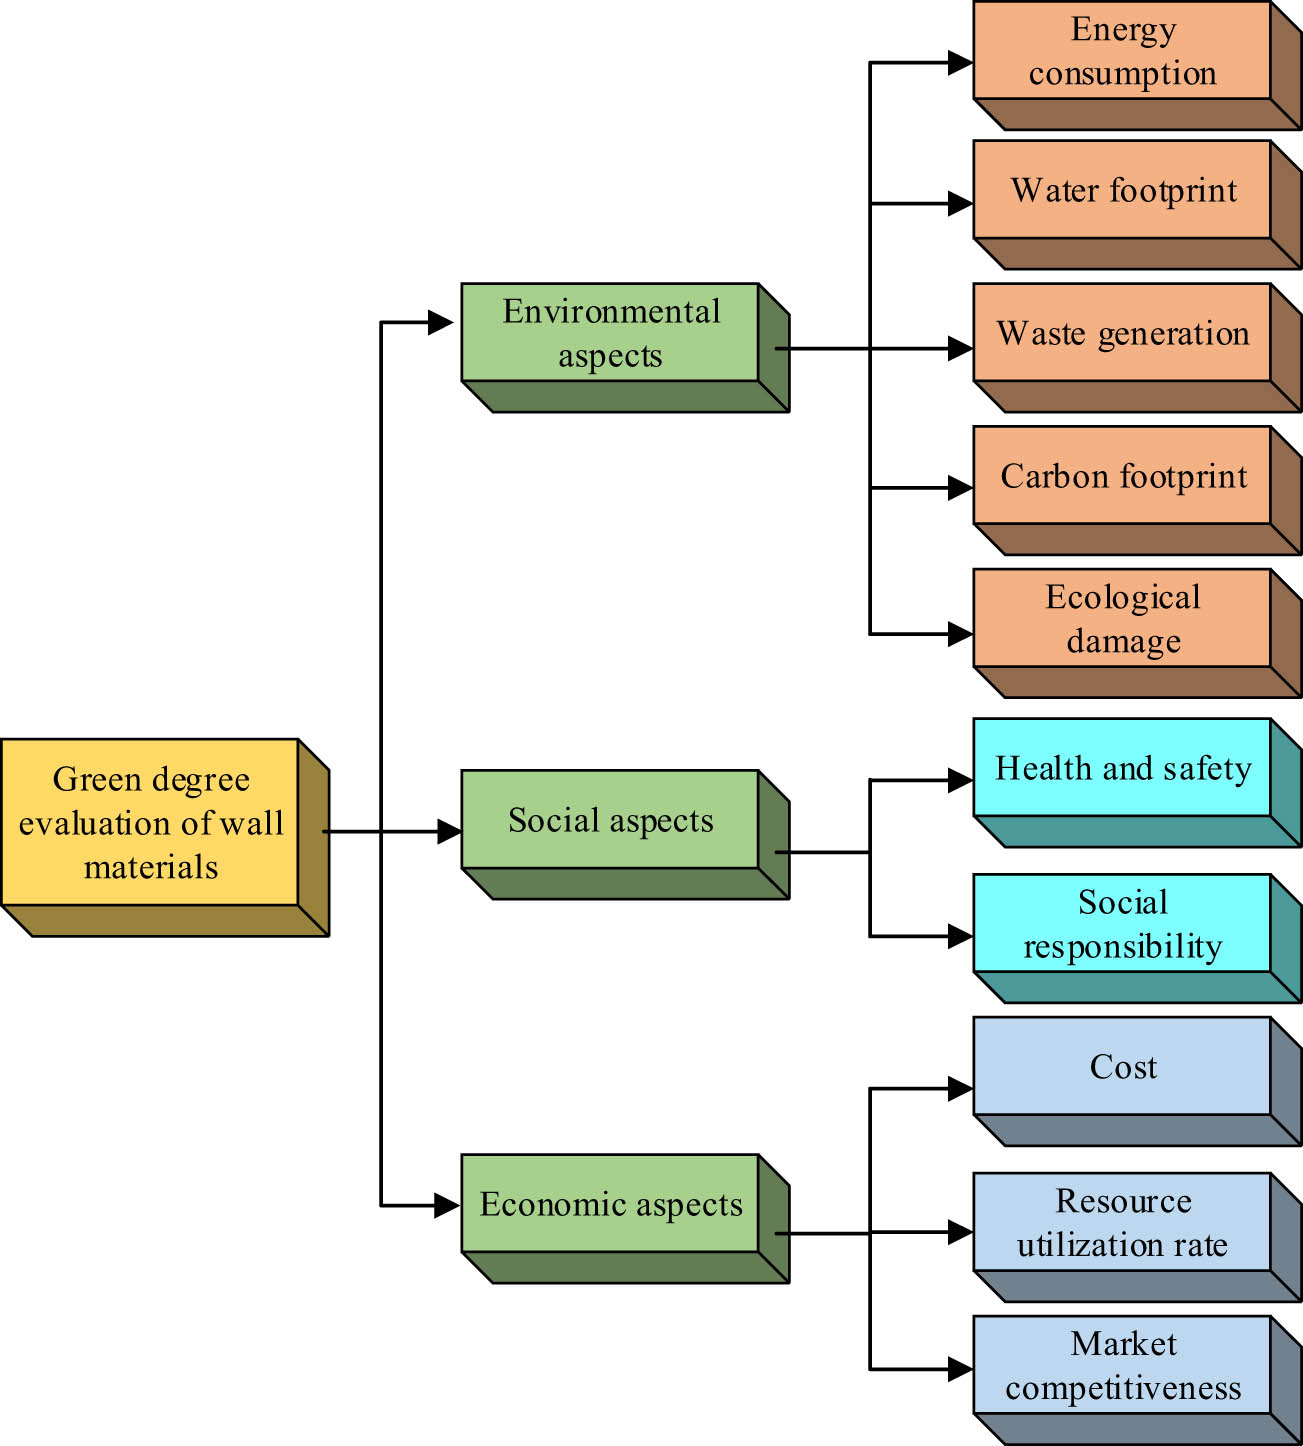
Green degree evaluation index I and II of wall materials.
Figure 3 shows the two-level evaluation hierarchy structure of the greenness evaluation of wall materials, mainly conducting comprehensive evaluation from three aspects: environment, society, and economy. The purpose is to construct a multidimensional evaluation model to ensure that the assessment of the greenness of wall materials is not limited to environmental factors, but also includes social and economic factors. The environmental aspect mainly includes five: energy consumption, greenhouse gas emissions, water consumption, and ecological environment damage in various stages of the wall material lifecycle; the social aspect mainly includes two aspects: health and safety issues during the use of wall materials and social responsibility issues that are taken into account; the economic aspect mainly includes the cost of wall materials throughout their entire lifecycle, resource utilization and recovery rate, sales competitiveness, and wall material brand image [17]. In view of the evaluation criteria of experts in the field of wall materials and the relative importance of each indicator, a visual analysis is conducted on the weight of the first-level indicator for evaluating the greenness of wall materials, as shown in Figure 4.
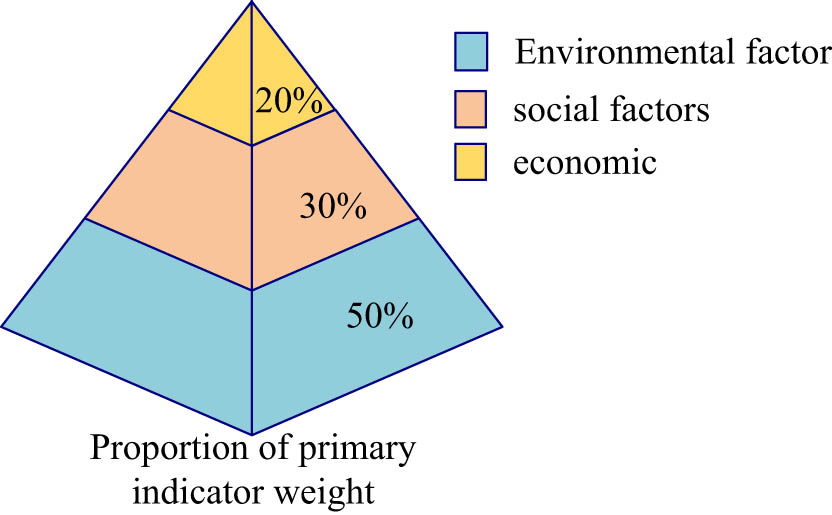
Weight proportion of first-level indicators for evaluating the greenness of wall materials.
Figure 4 shows that environmental factors are the most important among the three. Due to the need to consider issues such as resource, water, and carbon emissions throughout the entire lifecycle of raw materials, such as collection, production, transportation, and use, environmental factors are set to account for 50% of the total; social factors are the focus of evaluation, and it is necessary to consider the health and consumer needs of wall materials for practitioners, as well as the social welfare created by wall material products. Therefore, a social proportion of 30% is set; as a secondary factor in economic evaluation, it is necessary to consider the social competitiveness and production costs of wall materials. The weight of the secondary indicator of green wall material’s greenness is visualized and analyzed, as shown in Figure 5.

Weight proportion of secondary indicators for evaluating the greenness of wall materials.
As shown in the figure, Figure 5(a) shows the proportion of secondary indicators in environmental factors, with resource energy consumption being the most important. This indicator measures the energy consumption of wall materials throughout their entire lifecycle, so a weight of 40% is set; with the continuous improvement of environmental awareness and carbon emissions becoming a global environmental problem, carbon footprint is also one of the core indicators in the green degree assessment, so the weight is set at 25%; water footprint measures the use and pollution of water throughout the entire lifecycle of wall materials. In recent years, the shortage of water resources has caused a series of problems, so a weight of 20% has been set; wall material waste can cause environmental pollution, with a weight set at 10%; balance of nature has little influence on the green degree of wall materials, and the weight is set at 5%. Figure 5(b) shows the proportion of secondary indicators in social factors. Health and safety are important indicators for evaluating the green degree of wall material products, set at 70%; social responsibility is set at 30%. Figure 5(c) shows the proportion of secondary indicators in economic factors. The cost considers all cost issues throughout the entire lifecycle of the wall material and must be reasonably controlled to achieve economic benefits and sustainable development of the wall material; the resource utilization rate takes into account the utilization and recycling of wall material resources, but generally there is no recycling of wall materials, so a weight of 30% is set; market competitiveness can evaluate the market share and competitiveness of wall materials and has a relatively small impact on the evaluation of greenness. The weight is set at 10% [18,19].
3 Calculation results and application analysis of the green degree evaluation model for wall materials in view of lifecycle
This study calculates the weights of environmental, social, and economic aspects of wall materials. Finally, in view of the expert’s rating of the green degree index level of wall materials, the green degree scores of each wall material are obtained. Through a questionnaire survey, it has been proven that the evaluation model has high satisfaction among government, enterprises, residents, and other groups and has great potential for development.
3.1 Weight calculation and consistency analysis of the green degree evaluation model for wall materials in view of lifecycle
The weights of each indicator of the wall material reflect its greenness, so it is necessary to calculate the weights of each indicator. Establish a judgment matrix in view of the weight proportion set according to the expert evaluation criteria and the objective importance of the indicators mentioned above. Then, using the method provided by the research institute, three calculations were conducted on the

Figure 6(a)–(c), respectively, represent the eigenvalues, consistency indicators, and consistency ratios of the primary indicators. It can be seen that all consistency ratios are less than 0.1, so the judgment matrices of the eight experts meet the consistency requirements. Then, the weights of the first-level indicators are calculated, as shown in Figure 7.

Calculation results of environmental, social, and economic weights: (a) environmental indicators, (b) social indicators, and (c) economic indicators.
Figure 7(a)–(c), respectively, show the weight calculation results of eight experts on the first-level indicators of wall material greenness, including environmental, social, and economic aspects. It can be seen that there is a relatively large difference in the fluctuation of each broken line, which may be due to the inconsistent standards of various indicators for the greenness of wall materials by experts. Therefore, according to the clustering analysis method in the study, using the above data, the weight results of eight experts were analyzed using

Expert cluster analysis results.
Figure 8 shows that through clustering analysis of the weights of the first-level indicators for evaluating the greenness of wall materials by experts, it can be roughly divided into three groups: one group is experts 1, 8, and 3; the second group consists of experts 7 and 5; three groups are experts 2, 4, and 6. In view of the clustering analysis results, the average weight coefficients of three groups of experts can be divided into: group
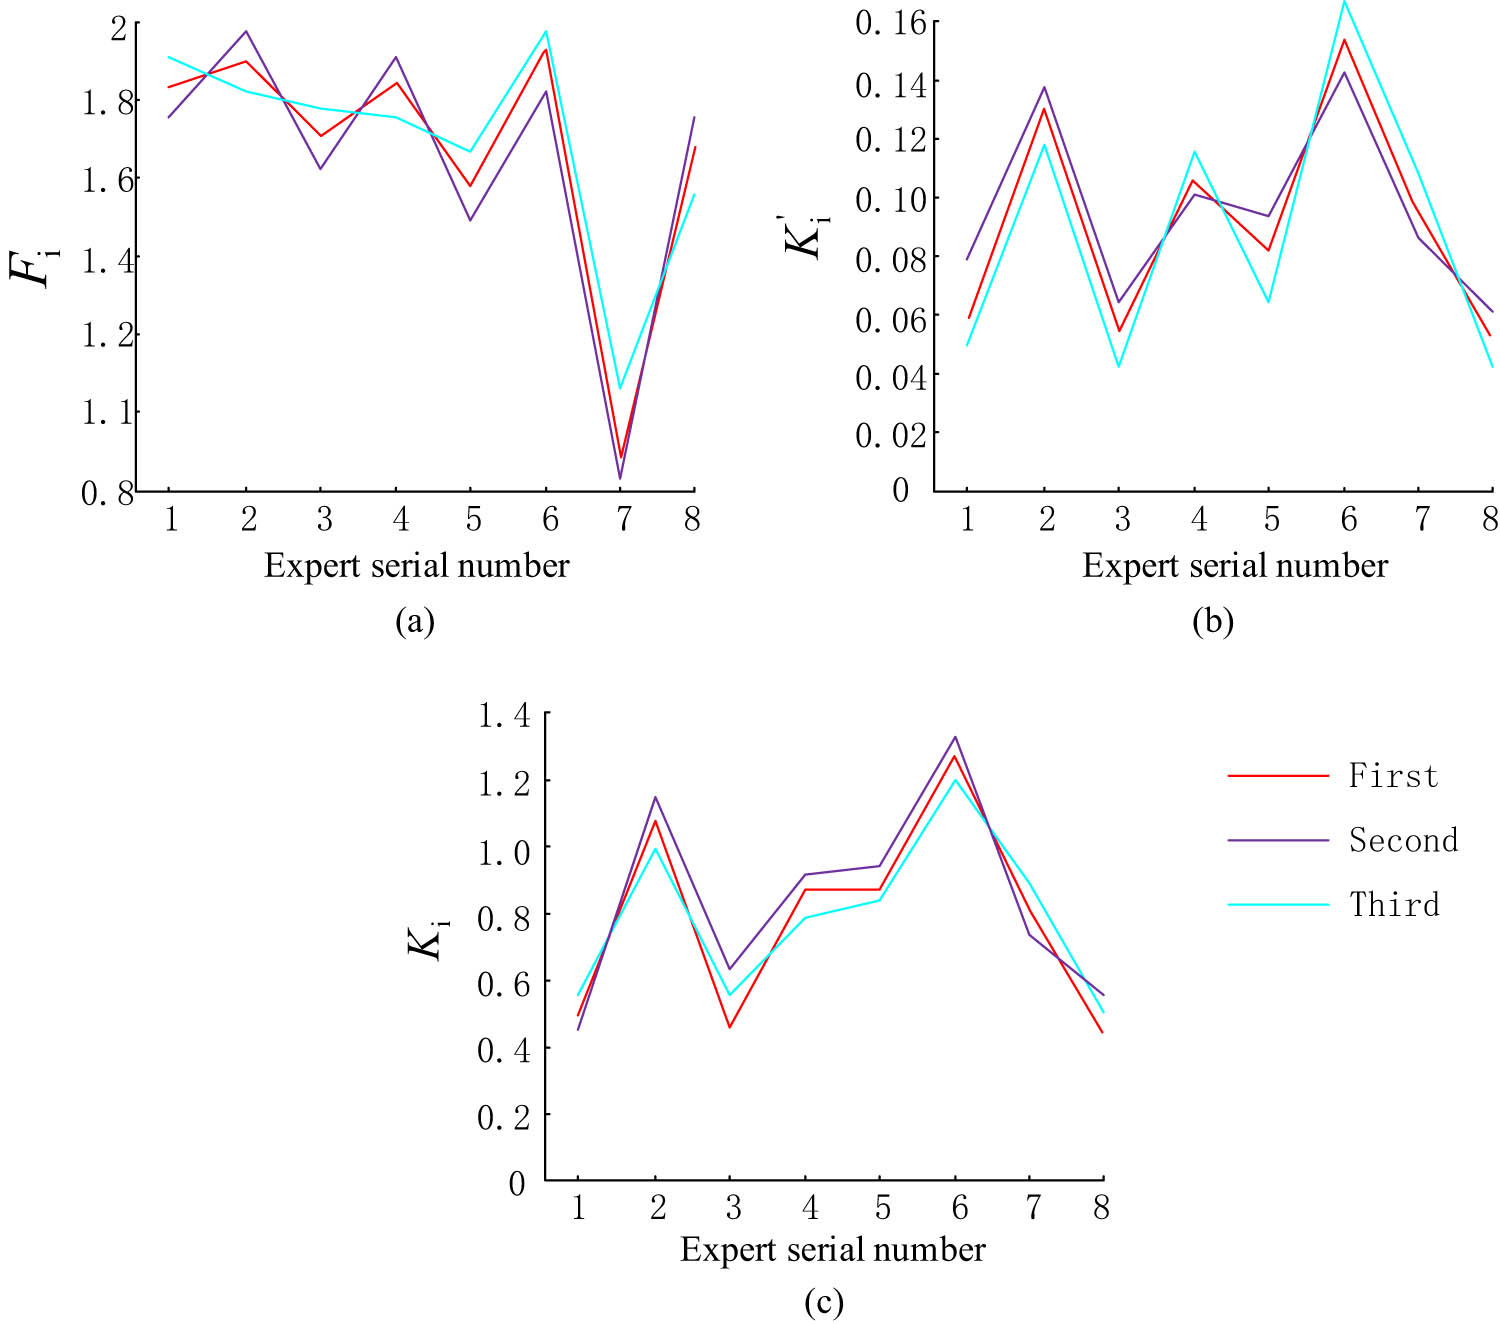
Figure 9(a)–(c), respectively, represent the consistency level
3.2 Application analysis of green degree evaluation model for wall materials in view of lifecycle
To demonstrate the practicality of the wall material greenness evaluation model constructed by the research institute, clay wall materials, concrete wall materials, wood wall materials, and stone wall materials produced by a certain enterprise were selected as the evaluation objects for wall material greenness. The score results are shown in Figure 10.

Green degree scores of four types of wall materials.
Figure 10(a) shows that the clay wall material has a higher score of 84 in terms of environmental aspects. This wall material will not generate significant waste gas and wastewater throughout its entire lifecycle, making it more environmentally friendly. The score for concrete wall material is 62 points, as it generates a large amount of CO2 and other exhaust gases during the production and manufacturing process and consumes a large amount of water resources during the construction process. Therefore, the greenness of this wall material is not high; the wood wall material has a score of 90 points, which has little impact on the environment during production and use. It has good ecological characteristics and high greenness. The stone wall material has a score of 77, which can effectively reduce the content of dust and pollutants in the air. However, certain energy and water resources are also consumed during the mining and transportation process. Figure 10(b) shows that the social clay wall material has a score of 67, which is simple in craftsmanship and cannot make much contribution to local economic development; the concrete wall material is 88 points, which is widely used and easy to use, and can promote the development of related enterprises and increase employment opportunities; the score for wooden wall material is 81 points, which reflects people’s concern for the natural environment and promotes the development of relevant talents; the stone wall material scores 85 points, which promotes the development of related industries. Figure 10(a) shows that the economic value of clay wall material is 83 points, which has a lower production cost and higher resource utilization; the concrete wall material is 91 points, which has a low cost of use; wood costs 61 points, which is a relatively expensive material and is not commonly used; the stone wall material costs 69 points, which has high production and processing costs, is difficult to mass produce, and has low resource utilization. To further demonstrate the superiority of the model constructed by the research institute, this study selected three groups of governments, enterprises, and residents from different regions to conduct a satisfaction questionnaire survey on the green degree evaluation method of wall materials, with 1000 questionnaires each. Then, it uses traditional empirical evaluation methods, single indicator evaluation methods, and comprehensive evaluation methods as references, and the survey results are shown in Figure 11.
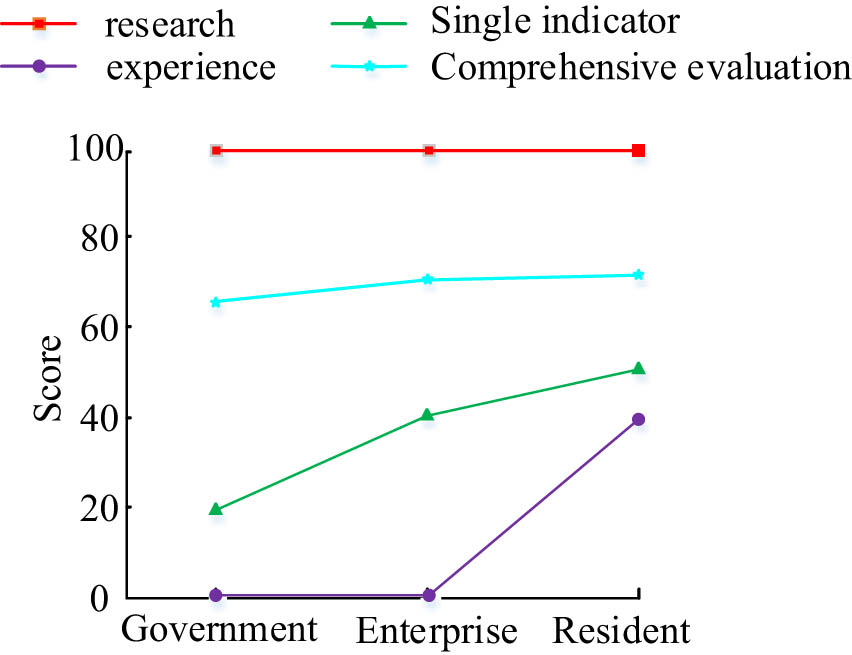
Satisfaction results of questionnaire survey.
Figure 11 shows that the satisfaction of government departments with the evaluation model, empirical method, single indicator method, and comprehensive evaluation method constructed by the research institute is 100, 0, 20, and 65%, respectively; the satisfaction of enterprises with the above four evaluation methods is 100, 0, 40, and 70%, respectively; residents’ satisfaction with these four evaluation methods is 100, 10, 50, and 70%, respectively. This indicates that the wall material greenness evaluation model constructed by the research institute is widely recognized by the public.
4 Conclusion
The precise evaluation of the greenness of wall materials is an important link in the building materials industry. This study is in view of the lifecycle of wall materials, and deeply analyzes the numerous influencing factors of wall materials from the collection of raw materials to the recycling and reuse stage. It establishes primary and secondary indicators mainly focusing on environmental, social, and economic aspects. Then, the expert clustering analysis method is used to improve the traditional AHP method, and the improved AHP method and fuzzy matrix evaluation method are used for modeling. Finally, it calculates the weight value indicators and conducts simulation application analysis. The results show that the results of all judgment matrices are less than 0.1. It meets the consistency requirements. The weight coefficients of the three groups of experts after cluster analysis are 0.265, 0.265, and 0.470, respectively. The first-level indicators for environmental, social, and economic factors are 0.6034, 0.1964, and 0.2002, respectively. The environmental scores of clay wall materials, concrete wall materials, wood wall materials, and stone wall materials are 84, 62, 90, and 77, respectively; the social scores are 67, 88, 81, and 85, respectively; the economic scores are 83, 91, 61, and 69, respectively. In the questionnaire survey, the government satisfaction rates of the model established by the research institute, empirical method, single indicator method, and comprehensive evaluation method were 100, 0, 20, and 65%, respectively; the satisfaction rates of enterprises are 100, 0, 40, and 70% respectively; the satisfaction rates of residents are 100, 10, 50, and 70%, respectively. The above data indicates that the model established by the research institute can evaluate the greenness of different wall materials, and the market recognition rate is 100%. This indicates that the model has good practicality and potential development potential. However, this method still cannot fully solve the problem of subjectivity in evaluation, and there are problems such as long data sorting time in various stages. Therefore, further improvement is needed in the objectivity of results and evaluation efficiency.
-
Funding information: The author states no funding involved.
-
Author contributions: Minjing Xie wrote original draft, participated in literature search and analyses, evaluations, and manuscript preparation, as well as wrote the paper. The author has accepted responsibility for the entire content of this manuscript and approved its submission.
-
Conflict of interest: The author states no conflict of interest.
-
Data availability statement: All data generated or analyzed during this study are included in this published article.
References
[1] Zalp NA. Evaluation of sustainable traditional buildings in the context of energy efficiency and conservation. Int J Res -GRANTHAALAYAH. 2020;8(4):200–15.10.29121/granthaalayah.v8.i4.2020.26Search in Google Scholar
[2] Ghailane H, Ahamat MA, Yahaya ANA. Properties of clay as a construction material for building wall. Int J Environ Sci Technol. 2020;29(8s):4658–64.Search in Google Scholar
[3] Thaib R, Hamdani H, Amin M. Utilization of Beeswax/Bentonite as energy storage material on building wall composite. J Phys Conf Ser. 2020;1402(4):1–5.10.1088/1742-6596/1402/4/044038Search in Google Scholar
[4] Aris A, Graham DW, Sharvini SR, Noor ZZ, Kamaruddin SN, Sabli NSM. Environmental impact evaluation of decentralized sewage treatment technologies: A life cycle assessment approach. Water Environ J. 2022;36(2):261–9.10.1111/wej.12760Search in Google Scholar
[5] Gan KS, Zairul AR, Geetha R, Khairul M. Life cycle assessment on log harvesting from natural forest in peninsular Malaysia. J Trop For Sci. 2021;33(2):213–23.10.26525/jtfs2021.33.2.213Search in Google Scholar
[6] Shurrab J, Hussain M, Khan M. Green and sustainable practices in the construction industry: a confirmatory factor analysis approach. Eng Constr Archit Manag. 2019;26(6):1063–86.10.1108/ECAM-02-2018-0056Search in Google Scholar
[7] Colorado HA, Velásquez EIG, Monteiro SN. Sustainability of additive manufacturing: The circular economy of materials and environmental perspectives. J Mater Res Technol. 2020;9(4):8221–34.10.1016/j.jmrt.2020.04.062Search in Google Scholar
[8] Jalaei F, Zoghi M, Khoshand A. Life cycle environmental impact assessment to manage and optimize construction waste using Building Information Modeling (BIM). Int J Constr Manag. 2021;21(8):784–801.10.1080/15623599.2019.1583850Search in Google Scholar
[9] Michalopoulou A, Maravelaki-Kalaitzaki PN, Stefanis NA, Theoulakis P, Andreou S, Kilikogloul V, et al. Evaluation of nanolime dispersions for the protection of archaeological clay-based building materials. Mediterr Archaeol Archaeom. 2020;20(3):221–42.Search in Google Scholar
[10] Cavalieri F, Bellotti D, Caruso M, Nascimbene R. Comparative evaluation of seismic performance and environmental impact of traditional and dissipation-based retrofitting solutions for precast structures. J Build Eng. 2023;79:107918.10.1016/j.jobe.2023.107918Search in Google Scholar
[11] Di Domênico M, da Silva TL, Ribeiro LA, Mussi AQ. Life cycle assessment: Embedded and maintenance environmental impacts of social interest housing construction systems. J Civ Eng Archit. 2021;15(8):408–18.10.17265/1934-7359/2021.08.002Search in Google Scholar
[12] Oztaysi B, Onar SC, Kahraman C. A dynamic pricing model for location-based systems by using spherical fuzzy AHP scoring. J Intell Fuzzy Syst. 2020;39(5):6293–302.10.3233/JIFS-189097Search in Google Scholar
[13] Nuroji N, Setiadji BH, Aktorina W. Comparison of precast and conventional concrete rigid pavements using analytical hierarchy process (AHP). Media Komun Teknik Sipil. 2021;26(2):212–9.10.14710/mkts.v26i2.31792Search in Google Scholar
[14] Darko A, Chan APC, Ameyaw EE, Owusu EK, Pärn E, Edwards DJ. Review of application of analytic hierarchy process (AHP) in construction. Int J Constr Manag. 2019;19(5):436–52.10.1080/15623599.2018.1452098Search in Google Scholar
[15] Shin JS, Lee DJ, Park SJ. An application of AHP for measuring the market effects of the film development fund in Korean movie industry. J Korean Inst Ind Eng. 2020;46(3):269–81.10.7232/JKIIE.2020.46.3.269Search in Google Scholar
[16] Ali S, Yan Q, Razzaq A, Khan I, Irfan M. Modeling factors of biogas technology adoption: A roadmap towards environmental sustainability and green revolution. Environ Sci Pollut Res. 2023;30(5):11838–60.10.1007/s11356-022-22894-0Search in Google Scholar PubMed PubMed Central
[17] Liu H, Wang X, Wu D. Innovative design of microencapsulated phase change materials for thermal energy storage and versatile applications: A review. Sustain Energy Fuels. 2019;3(5):1091–149.10.1039/C9SE00019DSearch in Google Scholar
[18] Barma M, Modibbo UM. Multiobjective mathematical optimization model for municipal solid waste management with economic analysis of reuse/recycling recovered waste materials. J Comput Cognit Eng. 2022;1(3):122–37.10.47852/bonviewJCCE149145Search in Google Scholar
[19] Smarandache F. Plithogeny, plithogenic set, logic, probability and statistics: A short review. J Comput Cognit Eng. 2022;1(2):47–50.10.47852/bonviewJCCE2202191Search in Google Scholar
© 2025 the author(s), published by De Gruyter
This work is licensed under the Creative Commons Attribution 4.0 International License.
Articles in the same Issue
- Research Articles
- Generalized (ψ,φ)-contraction to investigate Volterra integral inclusions and fractal fractional PDEs in super-metric space with numerical experiments
- Solitons in ultrasound imaging: Exploring applications and enhancements via the Westervelt equation
- Stochastic improved Simpson for solving nonlinear fractional-order systems using product integration rules
- Exploring dynamical features like bifurcation assessment, sensitivity visualization, and solitary wave solutions of the integrable Akbota equation
- Research on surface defect detection method and optimization of paper-plastic composite bag based on improved combined segmentation algorithm
- Impact the sulphur content in Iraqi crude oil on the mechanical properties and corrosion behaviour of carbon steel in various types of API 5L pipelines and ASTM 106 grade B
- Unravelling quiescent optical solitons: An exploration of the complex Ginzburg–Landau equation with nonlinear chromatic dispersion and self-phase modulation
- Perturbation-iteration approach for fractional-order logistic differential equations
- Variational formulations for the Euler and Navier–Stokes systems in fluid mechanics and related models
- Rotor response to unbalanced load and system performance considering variable bearing profile
- DeepFowl: Disease prediction from chicken excreta images using deep learning
- Channel flow of Ellis fluid due to cilia motion
- A case study of fractional-order varicella virus model to nonlinear dynamics strategy for control and prevalence
- Multi-point estimation weldment recognition and estimation of pose with data-driven robotics design
- Analysis of Hall current and nonuniform heating effects on magneto-convection between vertically aligned plates under the influence of electric and magnetic fields
- A comparative study on residual power series method and differential transform method through the time-fractional telegraph equation
- Insights from the nonlinear Schrödinger–Hirota equation with chromatic dispersion: Dynamics in fiber–optic communication
- Mathematical analysis of Jeffrey ferrofluid on stretching surface with the Darcy–Forchheimer model
- Exploring the interaction between lump, stripe and double-stripe, and periodic wave solutions of the Konopelchenko–Dubrovsky–Kaup–Kupershmidt system
- Computational investigation of tuberculosis and HIV/AIDS co-infection in fuzzy environment
- Signature verification by geometry and image processing
- Theoretical and numerical approach for quantifying sensitivity to system parameters of nonlinear systems
- Chaotic behaviors, stability, and solitary wave propagations of M-fractional LWE equation in magneto-electro-elastic circular rod
- Dynamic analysis and optimization of syphilis spread: Simulations, integrating treatment and public health interventions
- Visco-thermoelastic rectangular plate under uniform loading: A study of deflection
- Threshold dynamics and optimal control of an epidemiological smoking model
- Numerical computational model for an unsteady hybrid nanofluid flow in a porous medium past an MHD rotating sheet
- Regression prediction model of fabric brightness based on light and shadow reconstruction of layered images
- Dynamics and prevention of gemini virus infection in red chili crops studied with generalized fractional operator: Analysis and modeling
- Qualitative analysis on existence and stability of nonlinear fractional dynamic equations on time scales
- Fractional-order super-twisting sliding mode active disturbance rejection control for electro-hydraulic position servo systems
- Analytical exploration and parametric insights into optical solitons in magneto-optic waveguides: Advances in nonlinear dynamics for applied sciences
- Bifurcation dynamics and optical soliton structures in the nonlinear Schrödinger–Bopp–Podolsky system
- User profiling in university libraries by combining multi-perspective clustering algorithm and reader behavior analysis
- Exploring bifurcation and chaos control in a discrete-time Lotka–Volterra model framework for COVID-19 modeling
- Review Article
- Haar wavelet collocation method for existence and numerical solutions of fourth-order integro-differential equations with bounded coefficients
- Special Issue: Nonlinear Analysis and Design of Communication Networks for IoT Applications - Part II
- Silicon-based all-optical wavelength converter for on-chip optical interconnection
- Research on a path-tracking control system of unmanned rollers based on an optimization algorithm and real-time feedback
- Analysis of the sports action recognition model based on the LSTM recurrent neural network
- Industrial robot trajectory error compensation based on enhanced transfer convolutional neural networks
- Research on IoT network performance prediction model of power grid warehouse based on nonlinear GA-BP neural network
- Interactive recommendation of social network communication between cities based on GNN and user preferences
- Application of improved P-BEM in time varying channel prediction in 5G high-speed mobile communication system
- Construction of a BIM smart building collaborative design model combining the Internet of Things
- Optimizing malicious website prediction: An advanced XGBoost-based machine learning model
- Economic operation analysis of the power grid combining communication network and distributed optimization algorithm
- Sports video temporal action detection technology based on an improved MSST algorithm
- Internet of things data security and privacy protection based on improved federated learning
- Enterprise power emission reduction technology based on the LSTM–SVM model
- Construction of multi-style face models based on artistic image generation algorithms
- Research and application of interactive digital twin monitoring system for photovoltaic power station based on global perception
- Special Issue: Decision and Control in Nonlinear Systems - Part II
- Animation video frame prediction based on ConvGRU fine-grained synthesis flow
- Application of GGNN inference propagation model for martial art intensity evaluation
- Benefit evaluation of building energy-saving renovation projects based on BWM weighting method
- Deep neural network application in real-time economic dispatch and frequency control of microgrids
- Real-time force/position control of soft growing robots: A data-driven model predictive approach
- Mechanical product design and manufacturing system based on CNN and server optimization algorithm
- Application of finite element analysis in the formal analysis of ancient architectural plaque section
- Research on territorial spatial planning based on data mining and geographic information visualization
- Fault diagnosis of agricultural sprinkler irrigation machinery equipment based on machine vision
- Closure technology of large span steel truss arch bridge with temporarily fixed edge supports
- Intelligent accounting question-answering robot based on a large language model and knowledge graph
- Analysis of manufacturing and retailer blockchain decision based on resource recyclability
- Flexible manufacturing workshop mechanical processing and product scheduling algorithm based on MES
- Exploration of indoor environment perception and design model based on virtual reality technology
- Tennis automatic ball-picking robot based on image object detection and positioning technology
- A new CNN deep learning model for computer-intelligent color matching
- Design of AR-based general computer technology experiment demonstration platform
- Indoor environment monitoring method based on the fusion of audio recognition and video patrol features
- Health condition prediction method of the computer numerical control machine tool parts by ensembling digital twins and improved LSTM networks
- Establishment of a green degree evaluation model for wall materials based on lifecycle
- Quantitative evaluation of college music teaching pronunciation based on nonlinear feature extraction
- Multi-index nonlinear robust virtual synchronous generator control method for microgrid inverters
- Manufacturing engineering production line scheduling management technology integrating availability constraints and heuristic rules
- Analysis of digital intelligent financial audit system based on improved BiLSTM neural network
- Attention community discovery model applied to complex network information analysis
- A neural collaborative filtering recommendation algorithm based on attention mechanism and contrastive learning
- Rehabilitation training method for motor dysfunction based on video stream matching
- Research on façade design for cold-region buildings based on artificial neural networks and parametric modeling techniques
- Intelligent implementation of muscle strain identification algorithm in Mi health exercise induced waist muscle strain
- Optimization design of urban rainwater and flood drainage system based on SWMM
- Improved GA for construction progress and cost management in construction projects
- Evaluation and prediction of SVM parameters in engineering cost based on random forest hybrid optimization
- Museum intelligent warning system based on wireless data module
- Optimization design and research of mechatronics based on torque motor control algorithm
- Special Issue: Nonlinear Engineering’s significance in Materials Science
- Experimental research on the degradation of chemical industrial wastewater by combined hydrodynamic cavitation based on nonlinear dynamic model
- Study on low-cycle fatigue life of nickel-based superalloy GH4586 at various temperatures
- Some results of solutions to neutral stochastic functional operator-differential equations
- Ultrasonic cavitation did not occur in high-pressure CO2 liquid
- Research on the performance of a novel type of cemented filler material for coal mine opening and filling
- Testing of recycled fine aggregate concrete’s mechanical properties using recycled fine aggregate concrete and research on technology for highway construction
- A modified fuzzy TOPSIS approach for the condition assessment of existing bridges
- Nonlinear structural and vibration analysis of straddle monorail pantograph under random excitations
- Achieving high efficiency and stability in blue OLEDs: Role of wide-gap hosts and emitter interactions
- Construction of teaching quality evaluation model of online dance teaching course based on improved PSO-BPNN
- Enhanced electrical conductivity and electromagnetic shielding properties of multi-component polymer/graphite nanocomposites prepared by solid-state shear milling
- Optimization of thermal characteristics of buried composite phase-change energy storage walls based on nonlinear engineering methods
- A higher-performance big data-based movie recommendation system
- Nonlinear impact of minimum wage on labor employment in China
- Nonlinear comprehensive evaluation method based on information entropy and discrimination optimization
- Application of numerical calculation methods in stability analysis of pile foundation under complex foundation conditions
- Research on the contribution of shale gas development and utilization in Sichuan Province to carbon peak based on the PSA process
- Characteristics of tight oil reservoirs and their impact on seepage flow from a nonlinear engineering perspective
- Nonlinear deformation decomposition and mode identification of plane structures via orthogonal theory
- Numerical simulation of damage mechanism in rock with cracks impacted by self-excited pulsed jet based on SPH-FEM coupling method: The perspective of nonlinear engineering and materials science
- Cross-scale modeling and collaborative optimization of ethanol-catalyzed coupling to produce C4 olefins: Nonlinear modeling and collaborative optimization strategies
- Unequal width T-node stress concentration factor analysis of stiffened rectangular steel pipe concrete
- Special Issue: Advances in Nonlinear Dynamics and Control
- Development of a cognitive blood glucose–insulin control strategy design for a nonlinear diabetic patient model
- Big data-based optimized model of building design in the context of rural revitalization
- Multi-UAV assisted air-to-ground data collection for ground sensors with unknown positions
- Design of urban and rural elderly care public areas integrating person-environment fit theory
- Application of lossless signal transmission technology in piano timbre recognition
- Application of improved GA in optimizing rural tourism routes
- Architectural animation generation system based on AL-GAN algorithm
- Advanced sentiment analysis in online shopping: Implementing LSTM models analyzing E-commerce user sentiments
- Intelligent recommendation algorithm for piano tracks based on the CNN model
- Visualization of large-scale user association feature data based on a nonlinear dimensionality reduction method
- Low-carbon economic optimization of microgrid clusters based on an energy interaction operation strategy
- Optimization effect of video data extraction and search based on Faster-RCNN hybrid model on intelligent information systems
- Construction of image segmentation system combining TC and swarm intelligence algorithm
- Particle swarm optimization and fuzzy C-means clustering algorithm for the adhesive layer defect detection
- Optimization of student learning status by instructional intervention decision-making techniques incorporating reinforcement learning
- Fuzzy model-based stabilization control and state estimation of nonlinear systems
- Optimization of distribution network scheduling based on BA and photovoltaic uncertainty
- Tai Chi movement segmentation and recognition on the grounds of multi-sensor data fusion and the DBSCAN algorithm
- Special Issue: Dynamic Engineering and Control Methods for the Nonlinear Systems - Part III
- Generalized numerical RKM method for solving sixth-order fractional partial differential equations