Design of urban and rural elderly care public areas integrating person-environment fit theory
-
Shuai Han


Abstract
With the aggravation of the global aging process, providing a suitable living environment for the elderly has become an urgent issue. Based on the theory of human-environment adaptation, this study proposes a multilevel aging-friendly design scheme, aiming to improve the adaptability of urban and rural retirement public areas and the quality of life of the elderly. Through field research and questionnaire surveys, the impact of key design elements such as spatial layout, road design, lighting configuration, and resting area setup is investigated, taking into account the needs of the elderly in urban and rural areas of Chengdu. The results of the study reveal that spatial design has the most significant impact on the adaptability of the elderly, boasting a regression coefficient of 0.34. Road design, lighting design, and seating design also contribute, with regression coefficients of 0.27, 0.22, and 0.19, respectively. These findings indicate that various design elements play a crucial role in improving the convenience of activities, safety, and social interaction for the elderly. The adjusted R 2 of the overall model is 0.72, indicating that the explanatory power of the design elements on the adaptability of the elderly is strong. The study provides a theoretical basis and practical guidance for the design of aging-friendly public areas for the elderly, which has high social value and application prospects.
1 Methods and materials
Urban and rural elderly care (UREC) public areas usually include community parks, cultural activity centers, fitness venues, etc., aimed at providing daily social, sports, and leisure public spaces for the elderly. As the worldwide aging trend intensifies, providing a comfortable living space for seniors has become a key concern for society. Especially in urban–rural integration areas, the aging-friendly design of public elderly care areas not only affects the convenience and comfort of elderly people’s lives, but also directly impacts their physical and mental health. In this context, researchers around the world have proposed many theories and methods for the design of UREC public areas [1,2]. Xu et al. explored the influence of urban green areas on the happiness and satisfaction of the elderly and found that urban green spaces contributed significantly for enhancing their living pleasure and psychological well-being [3]. Zhu used multi-agent simulation technology to analyze the layout of elderly care institutions in Shanghai, revealing shortcomings in spatial matching and policy planning. Research showed that the resource allocation structure of existing elderly care facilities was unbalanced and could not fulfill the growing requirements of the elderly population [4]. Zeng and Chen applied the importance performance analysis method to analyze the satisfaction of elderly people with public space design, taking the old community in Wuhan as an example. Research showed that road network design, barrier free facilities, and landscape beautification were key factors in improving the satisfaction of the elderly [5]. Wang et al. applied machine learning algorithms and interest point data analysis to choose urban areas with high aging levels in Wuhan as key areas, and optimized the location and spatial configuration of elderly care facilities. Research suggested that priority should be given to the construction of elderly care facilities in densely populated regions to improve the fair distribution of social resources and the efficiency of the use of elderly care facilities [6].
In aging-friendly design, the Person-Environment adaptation Theory (POE) emphasizes that environmental design should fully consider the physiological, psychological, and social needs of the elderly, especially in UREC public areas where these needs are particularly complex [7]. Lak et al. explored the relationship between elderly friendly design of public open spaces in impoverished communities in Tehran and the health of the elderly. Through POE theory, this study indicated a significant correlation between subjective perceptions of the environment, such as the sense of security, fear, social environment, and physical and mental health, among older adults [8]. Zhang et al. conducted emotional response analysis in eight outdoor spaces in a community in China and found significant differences in color response among elderly people in different seasons based on POE theory [9]. Younes et al. studied the connection between the design of public spaces and the well-being of seniors. Through POE theory, key factors for optimizing the well-being of seniors were identified, including autonomy, social activities, and health needs. It was recommended that future designs should give greater emphasis to the fit between the environment and the requirements of the elderly [10]. Crist et al. explored the adaptation process of elderly people in their physical and social environment based on POE theory. The study particularly emphasized the effect of environmental stress on the behavior and psychological state of elderly people, believing that their adaptability was determined by their compatibility with the environment when facing declining health or cognitive abilities [11].
In summary, although previous research works have investigated the connection between the needs of the elderly and environmental design, they have mostly focused on a single design element, neglecting the systematic nature of urban–rural integration areas and comprehensive aging-friendly design. This study adopts a multi-level design scheme, combined with POE theory, to comprehensively optimize the spatial layout, road planning, lighting settings, and rest facilities of UREC public areas. The innovation lies in proposing a more systematic and diversified aging-friendly design framework that meets the diverse requirements of seniors. The research aims to raise the aging-friendly degree of UREC public areas through more scientific design methods.
1.1 Relevant theories
1.1.1 POE theory
POE, proposed by Kurt Lewin, emphasizes the adaptive relationship between individuals and their environment. In this theory, an individual’s behavior, psychological state, and feelings of well-being are closely related to the environment in which he or she lives [12,13]. When an individual’s ability matches the demands of the environment, the individual is able to adapt better to the environment and show higher well-being and quality of life. Conversely, too much environmental pressure can lead to a decrease in the individual’s adaptive ability. For the elderly, POE theory pays special attention to how the elderly can find a comfortable lifestyle in the environment, especially whether the environment design meets the multiple demand relationship of physical, psychological, and social needs of the elderly, which can be expressed by a simple adaptability formula as shown in Eq. (1).
where
1.1.2 Aging-friendly design
Aging-friendly design refers to the full consideration of the physiological, psychological, and social needs of the elderly in the design of buildings, facilities, and environments, with the aim of providing a safer, more comfortable and convenient living environment for the elderly. As the global aging trend intensifies, aging-friendly design is becoming more and more important in the fields of urban planning, residential construction, and public space. Aging-friendly design usually includes elements such as barrier-free access, clear signage, comfortable seating, reasonable spatial layout, and adequate lighting. In addition, it emphasizes the ability of the environment to support the social activities of older adults, maintain their independence, and reduce the stress of the external environment on their physical and psychological well-being [14,15]. In this study, the core of aging-friendly design is to enhance the quality of life of older people through multi-level spatial and functional design, especially in the use of public areas, focusing on improving the safety, convenience, and social interaction of older people.
1.1.3 Common areas
Public areas refer to spaces that are available for use by members of the community at large and are not limited to personal or private activities. Public areas usually include community parks, streets, squares, cultural activity centers, and activity rooms for the elderly, which are indispensable places in the daily lives of residents [16,17]. For the elderly, public areas are important places for socialization, leisure, exercise, and participation in community activities. Reasonable design of public areas can greatly enhance the adaptability of older adults to their environment and make them more comfortable and safe in social interactions and physical activities. The aging-friendly design of public areas discussed in this study, especially in urban and rural retirement public areas, focuses on how to provide better living environments for older people by enhancing the functionality, accessibility, and psychological comfort of these spaces through multilevel design.
1.2 Analysis of the current situation of UREC public areas in Chengdu city
1.2.1 Analysis of elderly service data
According to statistical data from the Report on the Development of Elderly Care in Chengdu (2022) and the Report on the Development of Urban and Rural Infrastructure in Chengdu (2022) [18,19]. The distribution of elderly care institutions in Chengdu and the proportion of elderly people in different age groups in Chengdu from 2018 to 2023 are shown in Figure 1.
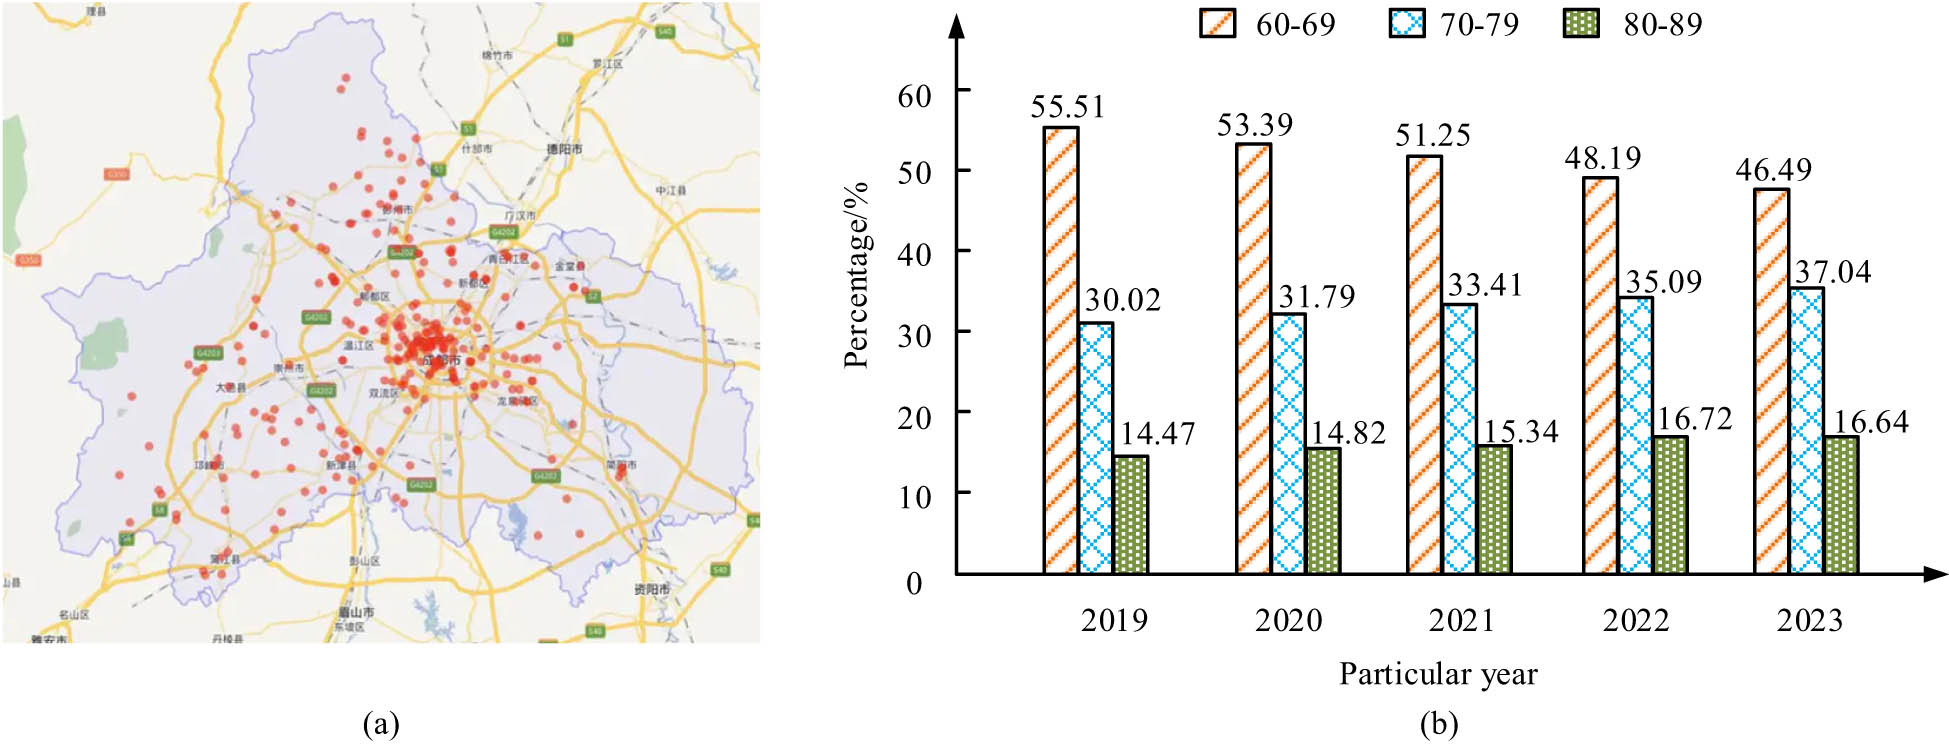
Results of locality distribution and proportion of older people by age group. (a) Distribution of senior care facilities in Chengdu. (b) Ratio of elderly people by age group in Chengdu, 2018–2023.
Figure 1(a) shows the distribution of elderly care institutions in Chengdu, and Figure 1(b) gives the proportion of elderly people in various age groups in Chengdu from 2018 to 2023. From Figure 1(a), the results showed that elderly care institutions are mainly concentrated in central urban areas and their surrounding regions, which have more public service facilities and a higher density of elderly care institutions. In contrast, the distribution of senior care institutions is sparser in the combined urban and rural areas and in rural areas in particular, where the number and coverage of senior care institutions are obviously insufficient. This distribution pattern reflected the greater demand for elderly care services in the center of Chengdu, while the construction of elderly care facilities in the peripheral areas needs to be further strengthened. According to Figure 1(b), the proportion of elderly people aged 60–69 has been diminishing annually, from 55.51% in 2018 to 46.49% in 2022. The proportion of elderly population aged 70–79 and 80 and above is showing an upward trend. This change reflects the gradual intensification of the aging trend in Chengdu, and the demand for elderly care services has increased accordingly, especially for nursing and medical services for the elderly. The detailed breakdown is shown in Table 1.
Distribution of places in Chengdu’s elderly care institutions and the proportion of elderly people in each age group
| Area type | Distribution of elderly care facilities | Proportion of elderly people (60–69 years) in 2018 (%) | Proportion of elderly people (70–79 years) in 2018 (%) | Proportion of elderly people (80–89 years) in 2018 (%) | Proportion of elderly people (60–69 years) in 2019 (%) | Proportion of elderly people (70–79 years) in 2019 (%) | Proportion of elderly people (80–89 years) in 2019 (%) |
|---|---|---|---|---|---|---|---|
| Central urban and surrounding areas | High concentration of elderly care facilities and significant concentration effect of public services | 55.51 | 30.02 | 14.47 | 53.39 | 31.79 | 14.82 |
| Urban–rural integration areas | Moderate distribution of elderly care facilities with imbalances | 55.51 | 30.02 | 14.47 | 51.25 | 33.41 | 15.34 |
| Rural areas | Sparse distribution of elderly care facilities, with significant spatial dispersion | 55.51 | 30.02 | 14.47 | 48.19 | 35.09 | 16.72 |
From Table 1, senior care facilities in Chengdu City are mainly concentrated in the central urban area and the surrounding areas, while senior care facilities in the combined urban-rural areas and rural areas are relatively sparse. In terms of the proportion of the elderly population, the proportion of the 60–69-year-old group was the highest in 2018, with 55.51% in the central city. By 2019, the share of individuals aged 60–69 had declined, whereas the percentage of those aged 70–79 and 80 and above had risen, mirroring the aging process in Chengdu City, the expanding proportion of seniors, and the growing need for elderly care services.
1.2.2 Current status of greening and infrastructure
According to the 2022 Chengdu Urban and Rural Ecological Environment Construction Report, the green coverage rate in the central urban area of Chengdu has reached 42.73% [20]. According to the Annual Development Report on Urban and Rural Infrastructure in Chengdu (2022), the infrastructure completion rate in the central urban area of Chengdu has reached 84.92%. The current status of urban and rural greening and infrastructure in Chengdu is shown in Figure 2 [21].
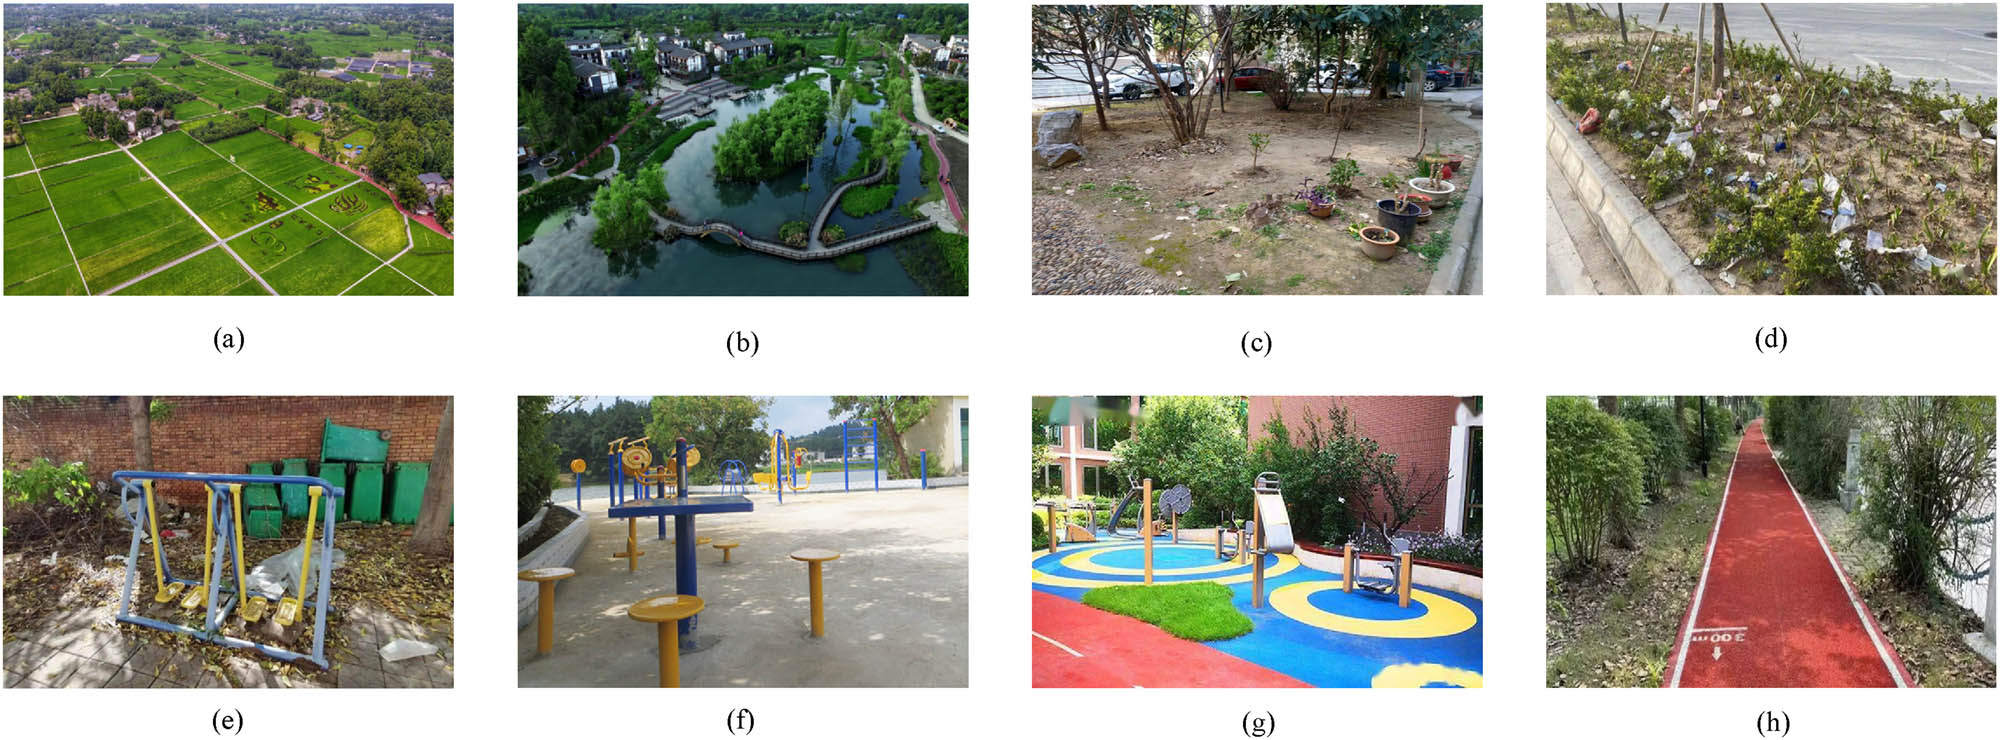
Status of urban and rural greening and infrastructure in Chengdu. (a) Status of rural greening. (b) Status of greening in urban and rural areas. (c) Status of greening in urban neighborhoods. (d) Status of urban street greening. (e) Status of rural aging infrastructure. (f) Status of aging-friendly infrastructure in urban and rural areas. (g) Status of aging infrastructure in urban neighborhoods. (h) Status of aging infrastructure in urban streets.
Figure 2(a) shows the current situation of rural greening, Figure 2(b) gives the present situation of urban–rural integration greening, Figure 2(c) gives the present situation of urban community greening, Figure 2(d) gives the present situation of urban street greening, Figure 2(e) shows the present circumstances of aging-friendly infrastructure in rural areas, Figure 2(f) shows the present circumstances of aging-friendly infrastructure in urban–rural integration, Figure 2(g) shows the present circumstances of aging-friendly infrastructure in urban communities, and Figure 2(h) shows the present circumstances of aging-friendly infrastructure in urban streets. From Figure 2, the central area of Chengdu City has more complete green coverage, higher levels of street and community greening, and more complete infrastructure. Especially in terms of aging-friendly design, the city’s greening and infrastructure show a higher standard, providing more facilities suitable for the elderly, such as walkways and leisure areas with barrier-free design. In contrast, the level of greening coverage and infrastructure development in combined urban and rural areas and in rural areas is relatively low, especially in terms of age-appropriate facilities, which show a clear gap. In rural areas, greening efforts are mostly centered around farmland and a handful of public spaces within villages. These areas typically feature straightforward greening designs, with vegetation primarily focusing on farmland and natural scenery. However, they often lack comprehensive and systematic greening plans. Compared with urban areas, the area of greening in rural areas is relatively small, and the distribution of green space is not even enough, especially in remote areas, where the level of greening is low, relying mainly on naturally growing vegetation and crop cover, and the greening environment needs to be further improved.
1.3 Age friendly design integrating POE theory
1.3.1 Quantitative analysis
Grounded on literature review and research on the actual situation of UREC public areas, the POE theory is used to determine the regional characteristics suitable for elderly people in urban and rural areas. Then, combined with variables influencing the contentment of seniors with spatial design, a hierarchical system of aging design indicators for UREC public areas is constructed. A judgment matrix for the indicator system is constructed using analytic hierarchy process (AHP). Each indicator is weighted to reflect its importance in the overall design. The weighting process is carried out using the eigenvector method, and its calculation is represented in Eq. (2) [22].
where
Indicator system for aging-friendly design of urban and rural public areas
| Level | Category from diagram | Specific indicators | Weight |
|---|---|---|---|
| Functional level | A. Safety | A1. Public area lighting facilities | 0.07 |
| A2. Public travel safety facilities | 0.06 | ||
| A3. Passageway safety protection facilities | 0.05 | ||
| B. Health and wellness | B1. Fitness equipment and wellness materials | 0.09 | |
| B2. Park environment and wellness facilities | 0.07 | ||
| B3. Safe lighting and environment | 0.06 | ||
| C. Activity | C1. Accessibility of activity spaces | 0.08 | |
| C2. Comfort of activity spaces | 0.07 | ||
| D. Support | D1. Accessibility and availability of service facilities | 0.09 | |
| D2. Accessibility of passageways | 0.08 | ||
| Environmental adaptation level | E. Livability | E1. Accessibility of residential areas | 0.07 |
| E2. Environmental design of activity spaces | 0.06 | ||
| F. Environmental Safety | F1. Protection systems in park facilities | 0.05 | |
| F2. Safety design of passageways | 0.05 | ||
| Psychological needs level | G. Convenience | G1. Convenience of recreational and cultural activities | 0.08 |
| G2. Convenience of public cultural facilities | 0.07 | ||
| G3. Convenience of digital interactions | 0.05 | ||
| H. Social Interaction | H1. Social activity space design | 0.08 | |
| H2. Participation in cultural exchanges | 0.06 | ||
| H3. Cultural space design and psychological guidance | 0.05 |
Combining the indicator bodies and assignment results in Table 2, the study found that the design assigns high weights to safety and health facilities, reflecting the high reliance of older people on safety, security, and health needs in public areas, especially in terms of accessibility, lighting, and safety of passageways. The high weight assigned to accessibility of passage and service facilities in the environmental adaptability hierarchy suggests that good access design is critical to the quality of life of older people, especially in urban-rural and rural areas. It also suggests that design should pay more attention to improving the accessibility of facilities. The emphasis on social space and accessibility to cultural activities in the psychological needs hierarchy highlights the positive effects of social interaction and cultural participation on the physical and mental health of older persons. Therefore, the design should comprehensively consider the safety, health, social, and cultural needs of the elderly and promote the multidimensional optimization of public areas to enhance the quality of life and well-being of the elderly.
Furthermore, the study employs the multiple regression analysis method and correlation analysis technique to delve into how design elements of public spaces for elderly individuals in both urban and rural areas relate to their adaptive needs. Multiple regression analysis is used to calculate the degree of contribution of each design element to the adaptive indicators of the elderly (e.g., activity participation, socialization frequency, psychological comfort, etc.) by modeling the relationship between multiple independent variables and the dependent variable. The regression equation for multiple regression is shown in Eq. (3).
where
where
1.3.2 Multi-level space design
Based on the contents of Table 1, the study not only ensures barrier-free facilities and protective design in multi-level space design, but also considers the combination of green space and activity facilities, forming a comprehensive elderly public space. The study optimizes the design of urban and rural public space levels, as shown in Figure 3.
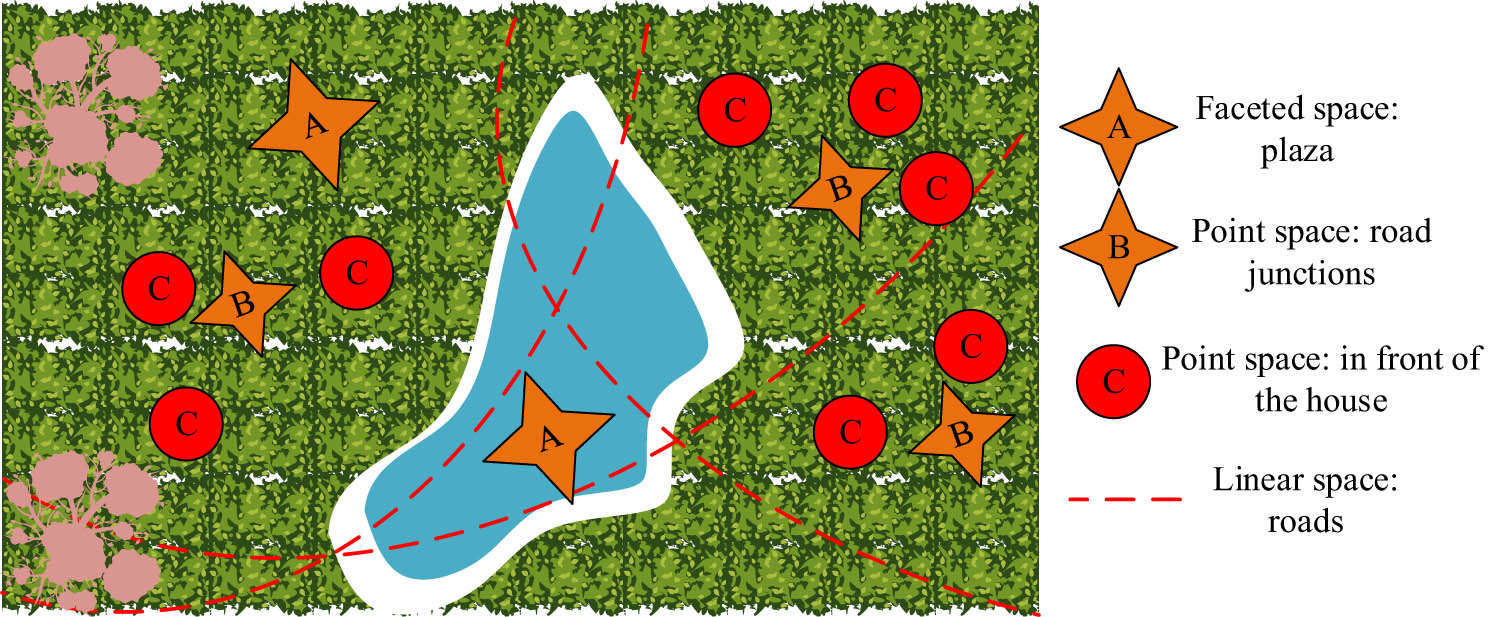
Multi-level space design display.
From Figure 3, the design divides the space into several functional areas, highlighting the organic connection between different areas. Area A, as the core plaza area, provides a large area of activity space and ensures that the elderly can freely carry out activities such as socializing and relaxing. Area B, located in front of the house, is specially designed for the elderly to set up recreational points and social places, which is convenient for them to communicate with other people and enhance the interaction with the community. Area C is set up at the road intersection to provide a small activity area to meet the needs of short stops in the process of passage. Area C is located at the intersection of roads, providing a small activity area to meet the needs of the elderly for a short stay in the process of passing through. The design also ensures that the elderly can safely and conveniently walk between the functional areas through the rationally planned green space and road system, ensuring the accessibility and comfort of the overall space.
1.3.3 Multi-level road design
On the main roads in the core area, the design needs to focus on the provision of accessible ramps and handrails, as well as clear signage and safety lighting at road intersections. For secondary roads, the continuity and accessibility of the path should be ensured. The multi-level road design is shown in Figure 4.
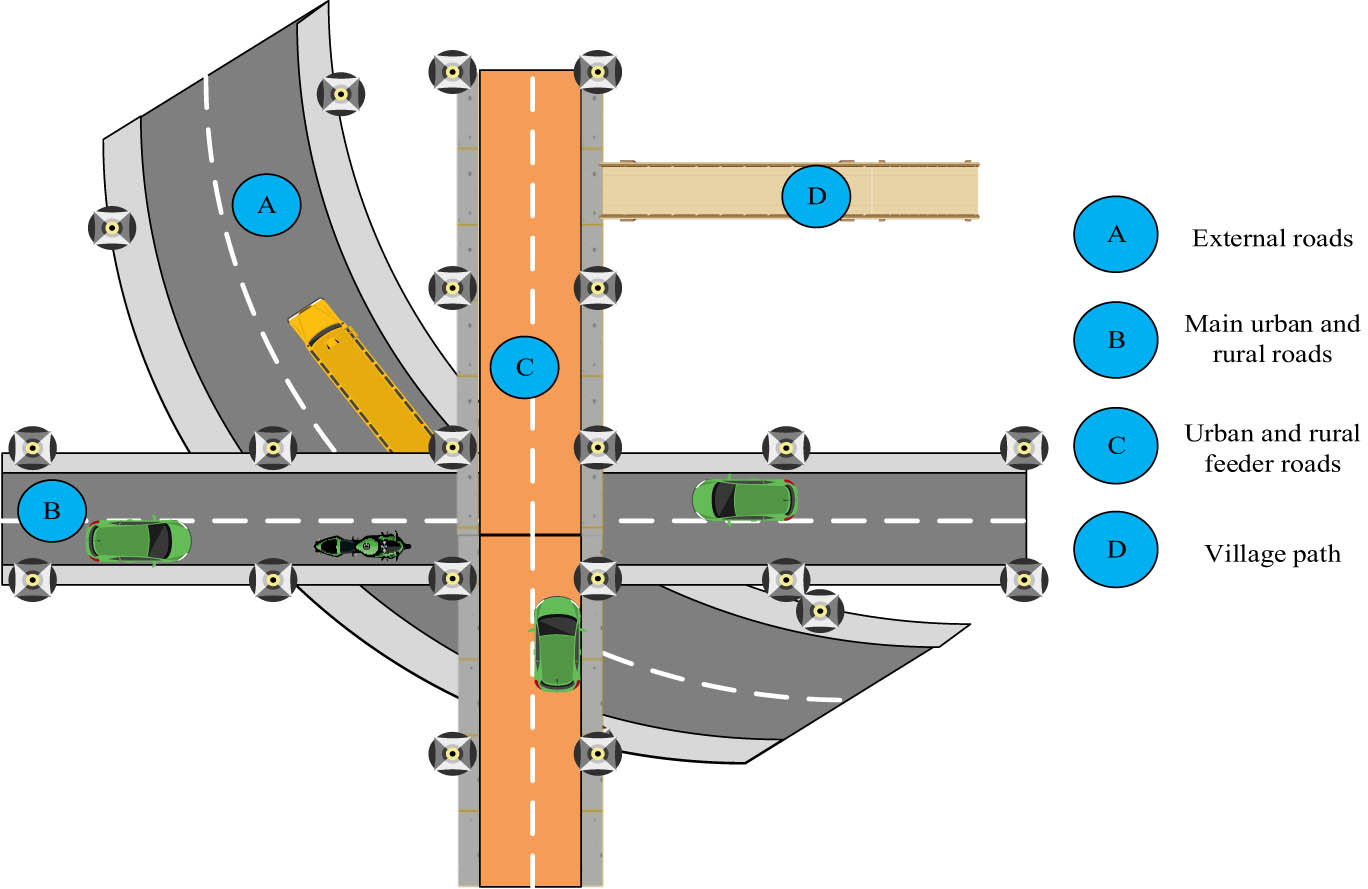
Multi-level road design display.
From Figure 4, the design divides the road system into four levels, with Area A being external roads, mainly connecting the city with external areas, and designed with wide lanes and barrier-free access to ensure smooth traffic flow. Area B is the main urban and rural roads, which take on a higher volume of traffic and are set up with wider pavements to ensure the parallel passage of older people and vehicles. Area C is the urban and rural bypass roads, which connect the various areas of urban and rural areas, designed with continuous trails suitable for the elderly to walk. Area D is village paths, which belong to low-traffic areas and mainly serve rural areas, with the design focusing on the simplicity and safety of the access. The rational layout and connection of the roads at each level ensures a seamless connection between the areas and enables older persons to move easily between functional areas.
1.3.4 Multi-level lighting design
Based on the content of Table 1 and POE theory, multi-level lighting design should be reasonably arranged according to the functions of different areas and the needs of the elderly. The multi-level lighting design is shown in Figure 5.
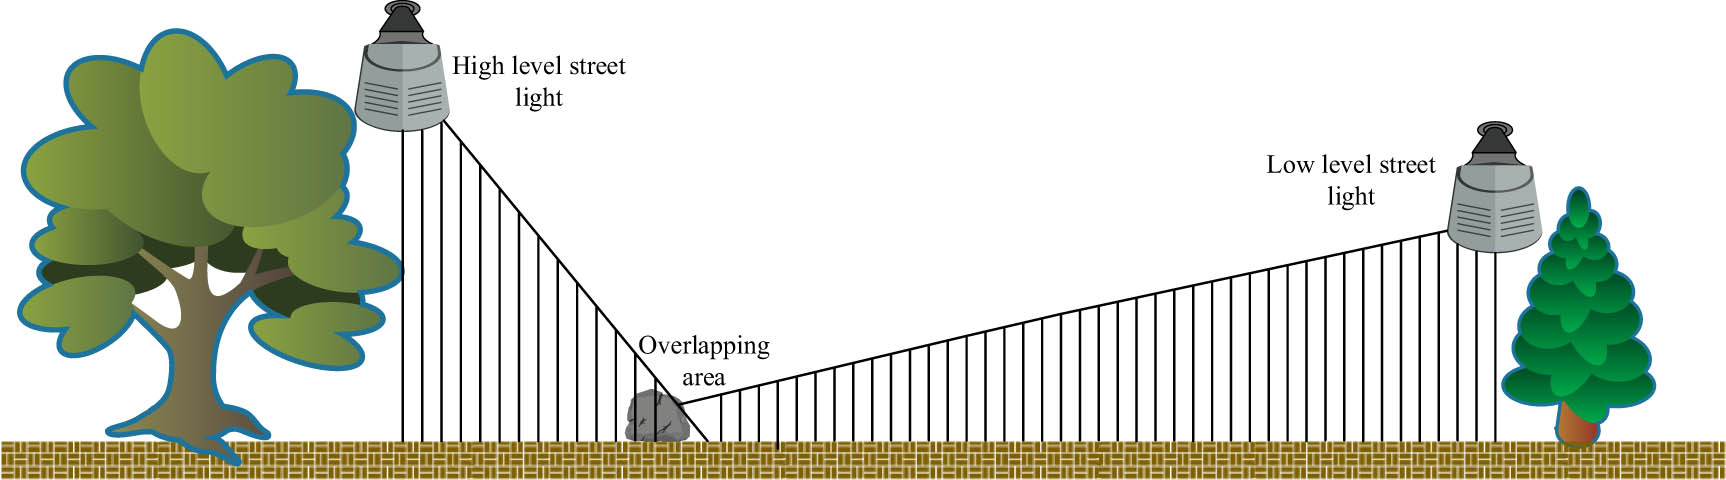
Multi-Level lighting design showcase.
From Figure 5, the lighting design utilizes a combination of high and low lights. In the main road area, long-distance main light source is provided by high street lights to ensure wide lighting coverage and avoid shadows or blind areas. In walking areas or activity zones, soft fill light is provided by low level street lights to create a warm and cozy atmosphere. The overlapping areas of the high and low lighting systems effectively avoid lighting dead zones and ensure that every corner of the area is properly lit, especially during nighttime activities, enhancing the sense of security and comfort for the elderly. In addition, the lighting layout takes into account environmental landscape elements, such as trees and green belts, to reduce psychological pressure at night and create a more pleasant public space.
1.3.5 Multi-level seat design
Based on POE, research suggests that the design of rest areas should focus on meeting the multi-level needs of the elderly. First, it is necessary to ensure that the rest area is convenient for the elderly to take a brief rest between the main passage and the activity area. Second, the rest seat needs to provide a comfortable psychological and social experience. The multi-level rest area design is shown in Figure 6.
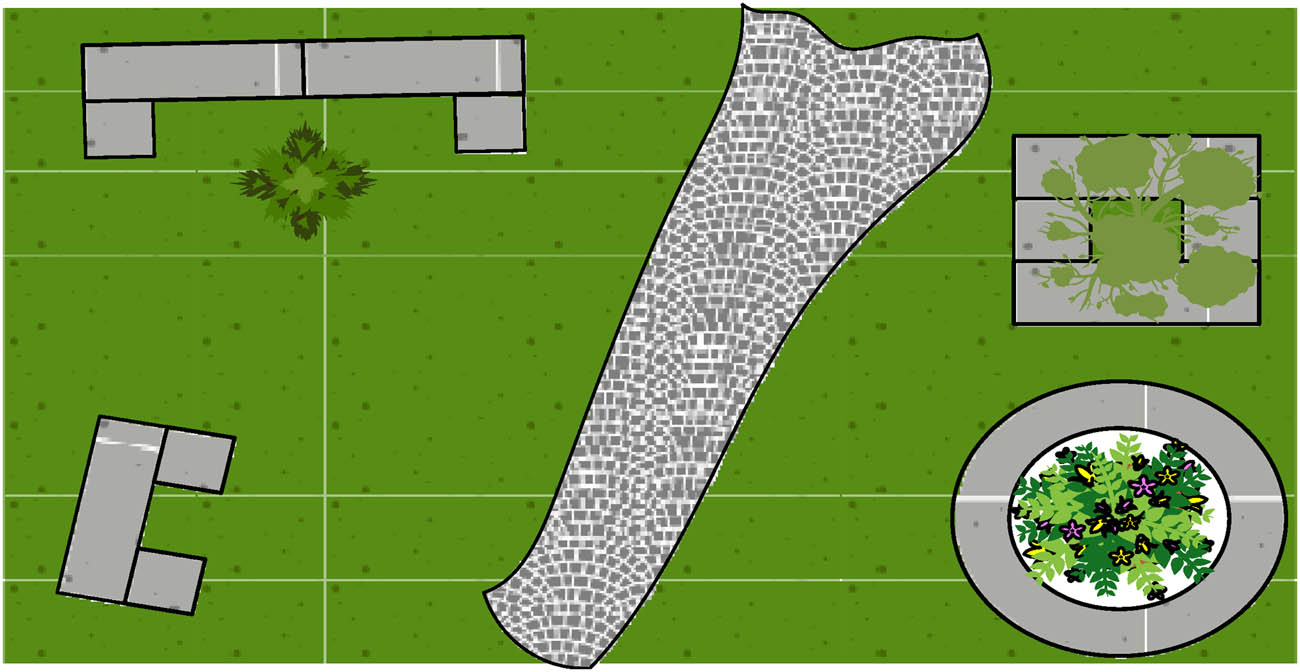
Multi-level rest area design showcase.
In Figure 6, the design meets the different needs of the elderly through different forms of seating layouts. The lounge area includes the layout forms of linear seats, square seats, and ring seats, which provide the functions of solitude, socialization, and group activities, respectively. Green landscaping is designed in the center area to enhance the comfort and social atmosphere of the lounge area while providing a visual relaxation effect. The diverse array of seating arrangements offers elderly individuals the flexibility to select a resting position that suits their needs, enabling them to enjoy solitude or engage in social interactions, thereby enriching their overall experience in the rest area.
2 Theoretical evaluation of POE in UREC public areas in Chengdu
2.1 Characteristics and statistical description of survey samples
The dataset used in the study includes field research data and secondary statistical data. The data are sourced from urban-rural and rural areas in Chengdu. Specifically, it comes from the Report on the Development of the Elderly in Chengdu (2022) and the Report on the Development of Urban and Rural Infrastructure in Chengdu (2022). These reports cover macro indicators such as the distribution of the elderly population, coverage of elderly care facilities, urban and rural greening, and the level of infrastructure. The dataset is combined with 265 valid questionnaires and 42 in-depth interviews collected through field research. The report covers macro indicators such as the distribution of elderly population, coverage of elderly facilities, urban and rural greening and infrastructure level, etc. It also combines the data collected from field research with 265 valid questionnaires and 42 in-depth interviews. The questionnaires covered the elderly’s participation in activities, psychological comfort, social interaction needs, and satisfaction ratings of public area design elements such as barrier-free facilities, road design, lighting design, and seating design, all of which were rated quantitatively on a scale of 1–5. In addition, interviews were conducted to further understand the specific use needs and design suggestions of older adults for urban and rural retirement public areas. The statistical description of the sample characteristics is shown in Table 3.
Sample characterization and statistical description
| Sample characteristic | Feature | Frequency (n) | Percentage (%) | Chi-square value | P-value |
|---|---|---|---|---|---|
| Gender | Male | 124 | 46.79 | 1.091 | 0.032 |
| Female | 141 | 53.21 | 1.091 | 0.041 | |
| Age group | 60–69 | 108 | 40.75 | 16.083 | 0.018 |
| 70–79 | 99 | 37.36 | 16.083 | 0.002 | |
| 80+ | 58 | 21.89 | 16.083 | 0.007 | |
| Location type | Urban–rural | 173 | 65.28 | 24.758 | 0.018 |
| Rural | 92 | 34.72 | 24.758 | 0.009 | |
| Health status | Good | 105 | 39.62 | 83.532 | 0.026 |
| Average | 139 | 52.45 | 83.532 | 0.022 | |
| Poor | 21 | 7.93 | 83.532 | 0.037 | |
| Education | Primary | 76 | 28.67 | 5.724 | 0.017 |
| Secondary | 115 | 43.41 | 5.724 | 0.021 | |
| Higher | 74 | 27.92 | 5.724 | 0.008 |
From Table 3, the proportion of male elderly in the sample was 46.79% and the proportion of female elderly was 53.21%, with a significant difference in gender distribution (P = 0.032). In terms of age group distribution, the 60–69 age group accounted for the largest proportion of 40.75%, the 70–79 age group accounted for 37.36%, and the 80 and above group accounted for 21.89%, and the differences between age groups were also significant (P values of 0.018, 0.002, and 0.007, respectively). In terms of type of place of residence, the percentage of elderly people was 65.28% in urban-rural areas and 34.72% in rural areas and the difference was significant (P = 0.018). In terms of health status, the proportion of elderly people with good health status was 39.62%, and the proportion of those with fair and poor health status was 52.45 and 7.93%, respectively, and the difference in health status was also significant (P = 0.026). With regard to education level, the proportion of elderly people in junior high school or below was 28.67%, high school or junior college was 43.41%, and bachelor’s degree or above was 27.92%, and the differences in education level also showed statistical significance (P = 0.017, 0.021, and 0.008).
2.2 Quantitative analysis of environmental adaptability indicators
The study selected key indicators such as accessibility facilities, lighting design, safety protection, layout of rest areas, and convenience of social spaces. A questionnaire survey was conducted to evaluate each design, and statistical methods were used to analyze the effectiveness of different design schemes. The outcomes are represented in Table 4.
Outcomes of environmental adaptability indicators
| Category | Specific indicators | Mean score (Mean) | Standard deviation (SD) | Chi-Square value | P-value |
|---|---|---|---|---|---|
| Physical environment | Accessibility of facilities | 4.45 | 0.74 | 12.573 | 0.002 |
| Road width in layered road design | 4.3 | 0.67 | 10.284 | 0.011 | |
| Safety lighting in layered lighting | 4.5 | 0.68 | 13.678 | 0.001 | |
| Seating distribution in resting areas | 4.42 | 0.71 | 11.893 | 0.005 | |
| Social environment | Convenience of social spaces | 4.22 | 0.82 | 9.872 | 0.018 |
| Psychological environment | Psychological comfort | 4.35 | 0.73 | 14.576 | 0.003 |
| Sense of belonging to the environment | 4.28 | 0.81 | 10.982 | 0.007 |
According to Table 4, the average score of accessibility facilities in multi-level space design was 4.45, and the Chi-Square test results showed significant adaptability, with P = 0.002 at this point, indicating that the accessibility design of the space greatly improved the convenience of activities for the elderly. The score for multi-level road design was 4.30, which was also statistically significant. The highest score for lighting design was 4.50, indicating that reasonable lighting design not only ensured safety, but also effectively alleviated nighttime anxiety in the elderly. The score for the seating layout in the resting area was 4.42, P = 0.005, indicating that the functional design of the resting area met the different resting needs of the elderly. The scores for social space convenience and psychological comfort were 4.22 and 4.35, with P-values less than 0.05, demonstrating that the design of social space and psychological comfort had a significant promoting effect on social interaction and mental health of the elderly.
2.3 Correlation analysis between design adaptability and the needs of the elderly
The study selected key design elements such as multi-level space design, multi-level road design, multi-level lighting design, and multi-level seat design, and quantitatively analyzed their correlation with the needs of the elderly. The result is shown in Figure 7.
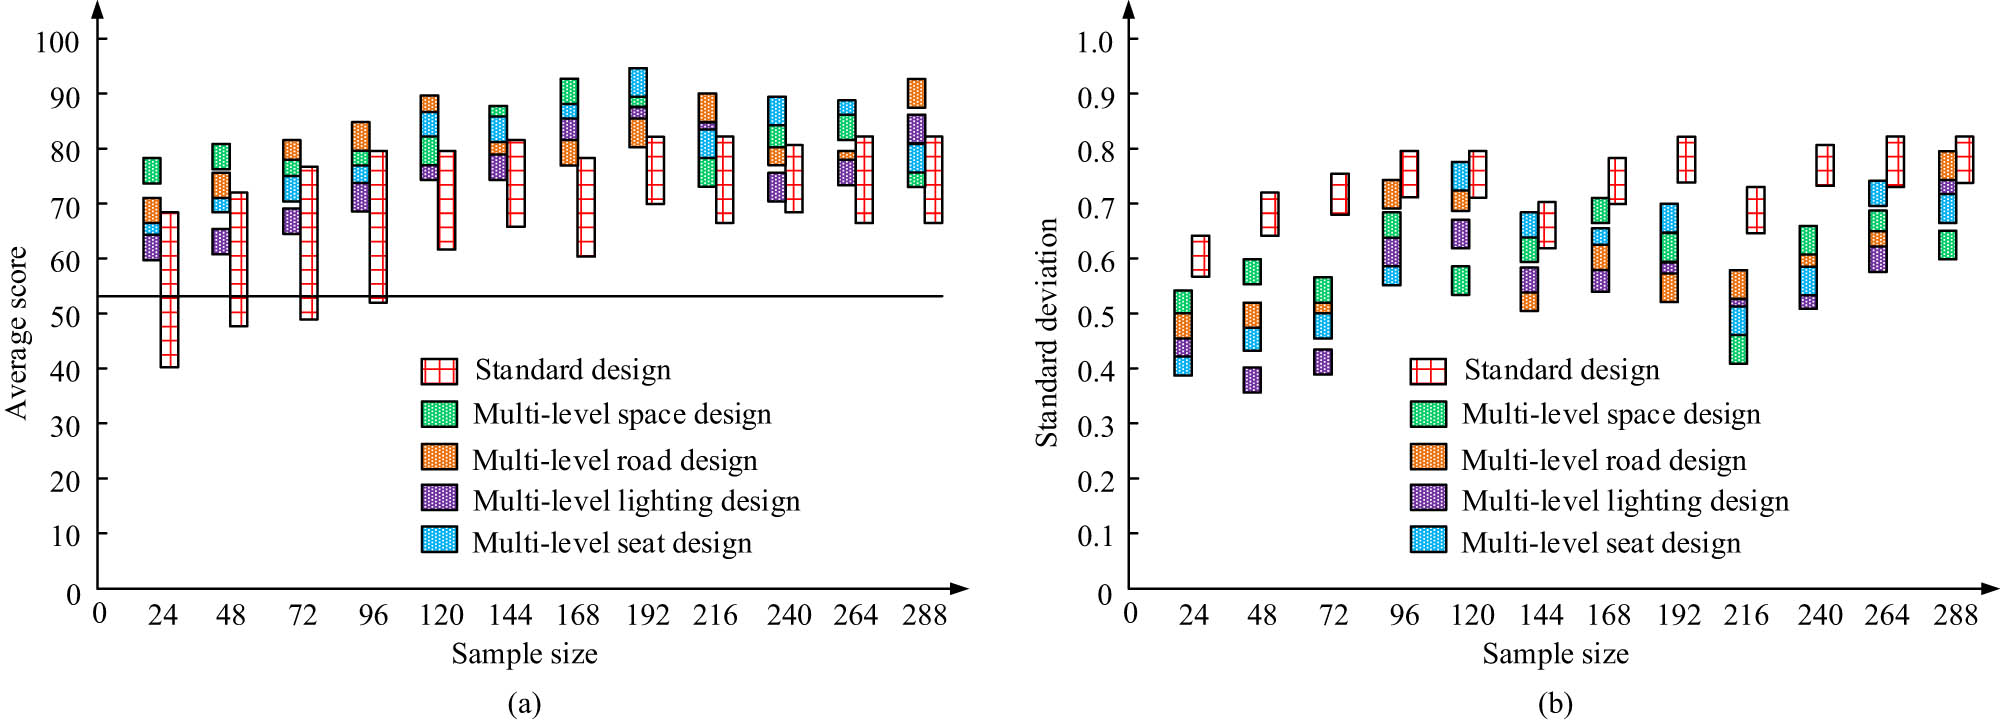
Correlation mean score and SD value test. (a) Average score test. (b) Standard deviation test.
Figure 7(a) shows the average score of the correlation between the design scheme and the requirements of seniors, and Figure 7(b) shows the standard deviation of the correlation between the design scheme and the requirements of seniors. According to Figure 7(a), the average scores for multi-level space design and multi-level seat design were relatively high, reaching 89.5 and 91.2 points, respectively, indicating that these design schemes performed well in meeting the daily activities and rest requirements of seniors. Figure 7(b) indicates that the standard deviation of multi-level design was relatively small, with a standard deviation of 0.31 for multi-level seat design and 0.35 for multi-level lighting design, indicating that the effects of these design schemes were more stable and the fluctuation of user feedback was smaller. In contrast, the standard deviation of the standard design was 0.57, indicating significant differences in satisfaction among different elderly populations, inconsistent design effects, and generally poor adaptability.
2.4 Visual comparison of urban and rural public areas before and after optimization design
To further intuitively confirm the optimization effect of multi-level design schemes on UREC public areas, this study visually compared and analyzed the changes in key design elements such as public space layout, road planning, lighting settings, and seating arrangements in different areas before and after optimization design. The results are shown in Figure 8.
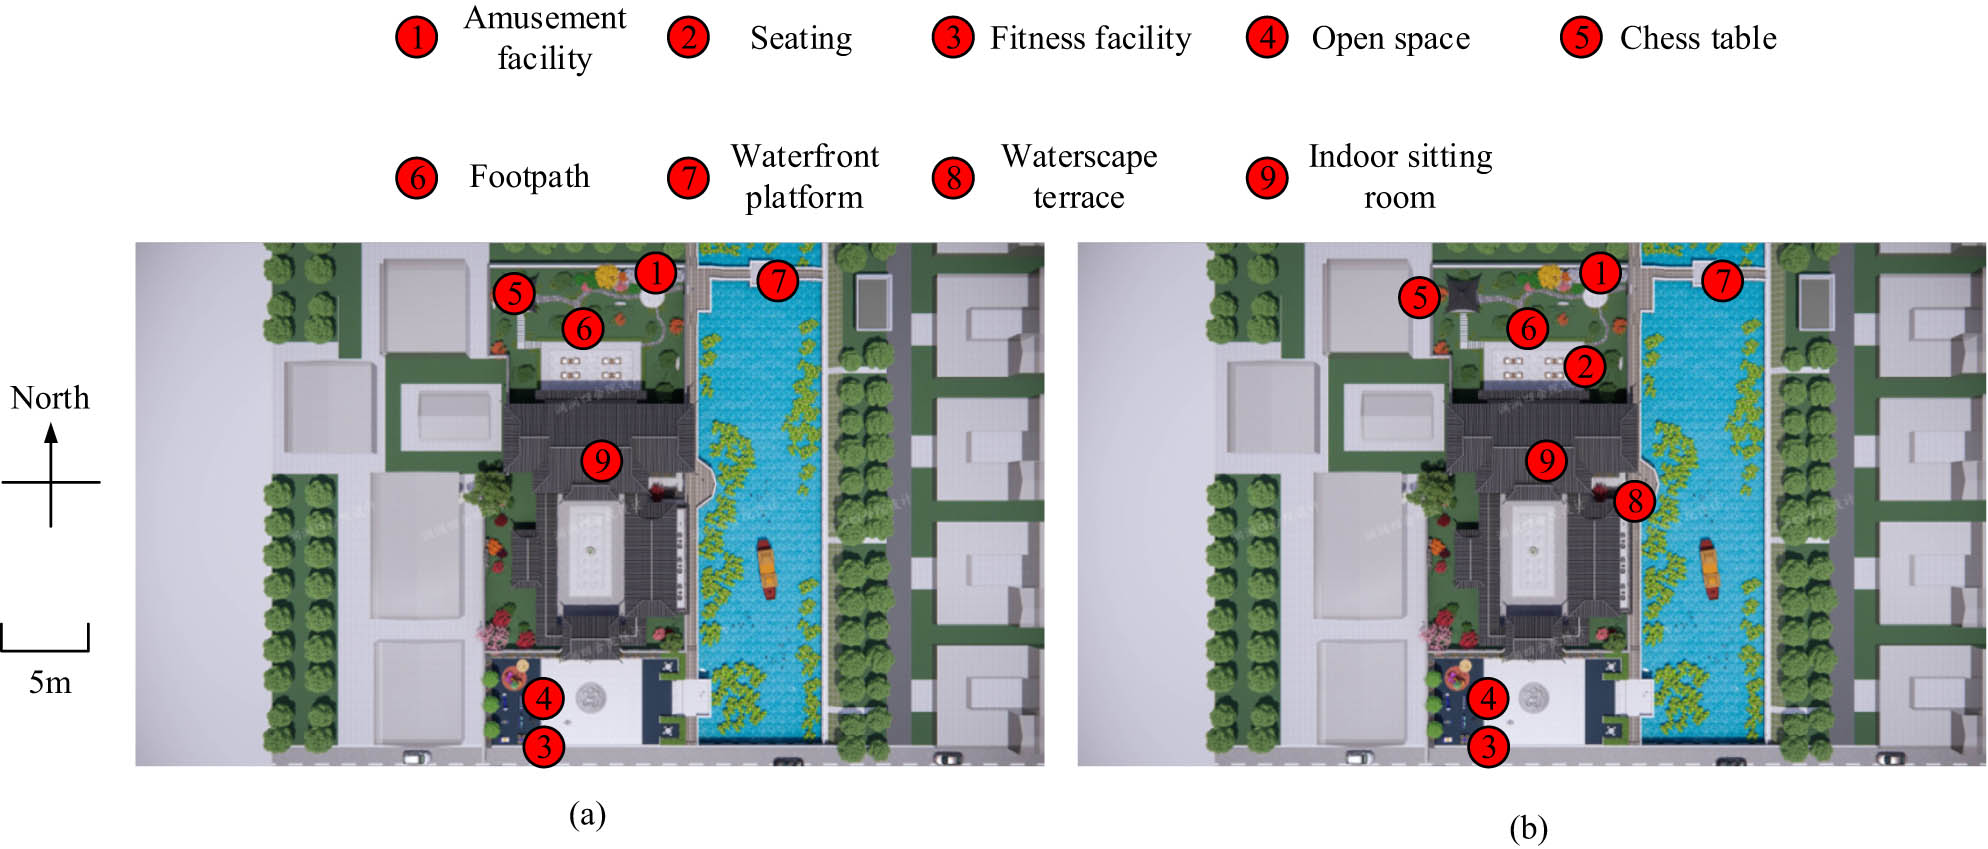
Visualization comparison results of urban and rural public areas before and after optimal design. (a) Before optimization of urban and rural areas. (b) Post-design of urban and rural areas.
Figure 8(a) shows the visualization results of urban and rural public areas before optimization, and Figure 8(b) shows the visualization results of urban and rural public areas after optimization. As shown in Figure 8, the layout of urban and rural public areas before optimization was relatively simple, with a lack of coherence in facility distribution and low spatial utilization. In addition, the entertainment facilities and open spaces in the area were limited and could not effectively meet the daily activity requirements of seniors. Alternatively, after multi-level design, the regional layout was significantly improved. New open spaces, fitness facilities, and rest seats were added, with a more reasonable distribution of facilities, improving the convenience and comfort of daily activities for the elderly. In terms of path design, accessible walkways and water terraces were added, enhancing the overall landscape experience and safety of the area. The multi-level seat design provides richer social interaction and solitude space, allowing elderly people to choose a resting place according to their own needs, optimizing their psychological and social experience.
2.5 Satisfaction analysis of elderly people with public area design
Through a questionnaire survey, this study compared the satisfaction performance of four key design elements, namely, multi-level space design, multi-level road design, multi-level lighting design, and multi-level seat design, with standard design among the elderly population. The results are shown in Figure 9.
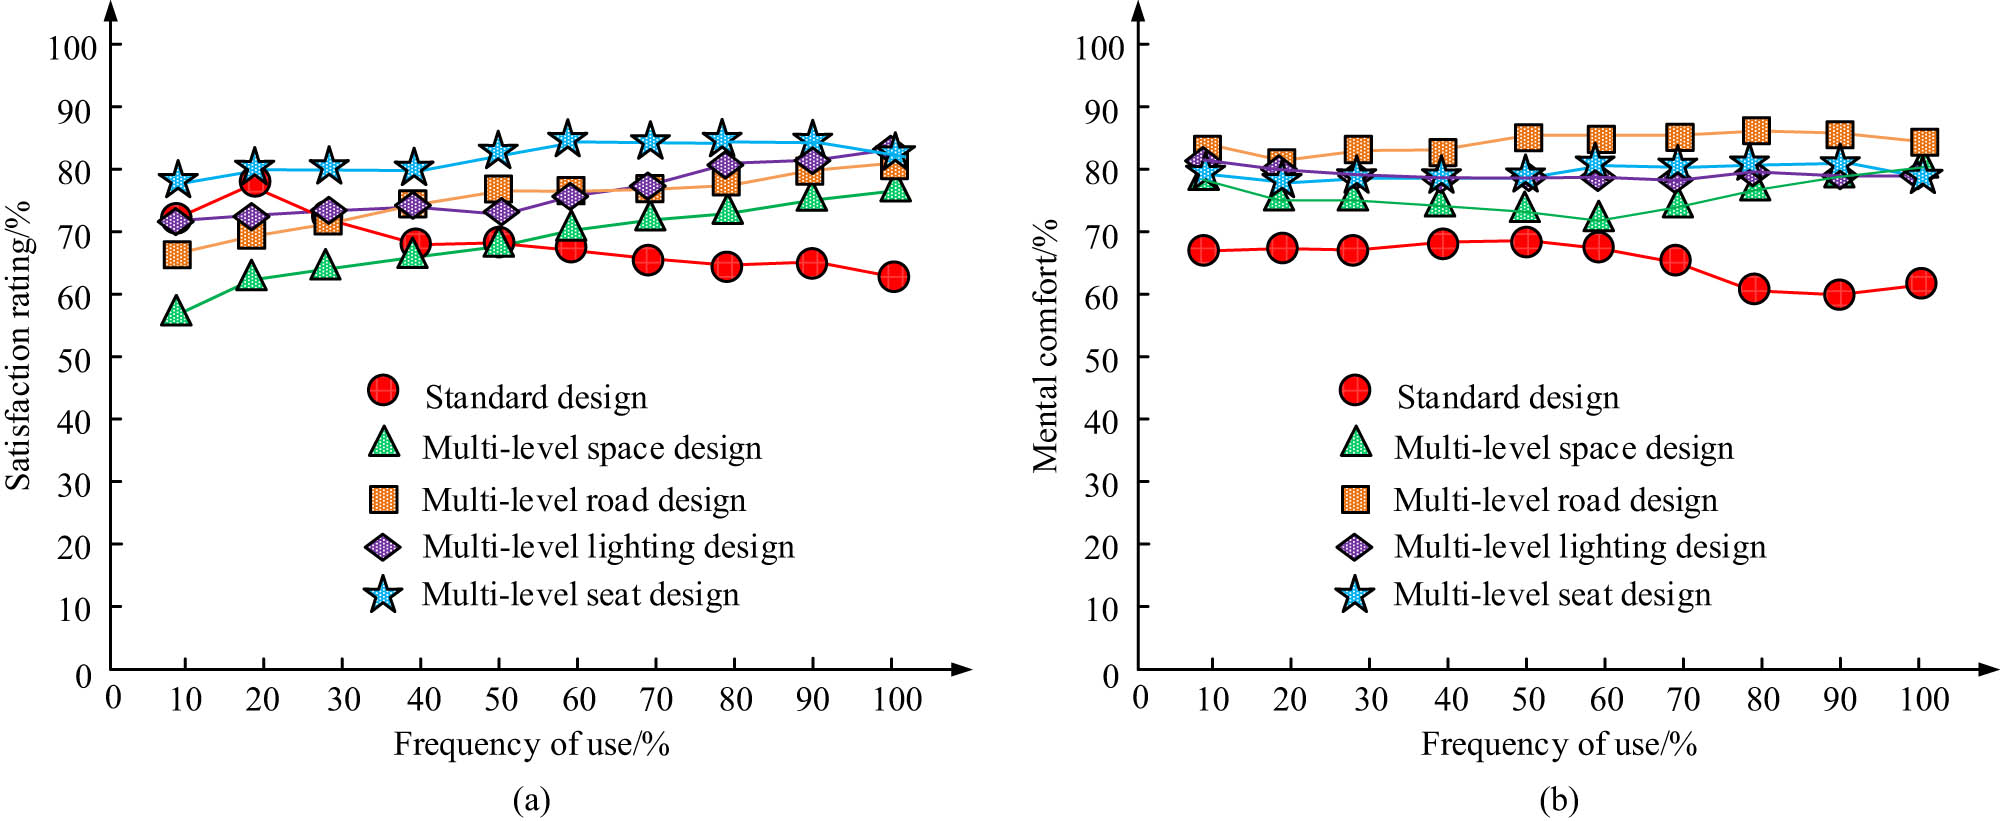
Satisfaction test. (a) Satisfaction score test. (b) Heart comfort test.
Figure 9(a) indicates the satisfaction rating outcomes after the questionnaire survey, and Figure 9(b) indicates the psychological comfort rating outcomes after the questionnaire survey. According to Figure 9(a), when the usage frequency reached 60% or more, the satisfaction score of multi-level design tended to stabilize and remained above 85%, while the standard design only maintained around 70%. The psychological comfort score in Figure 9(b) also showed a similar trend, with multi-level design significantly improving the psychological comfort of the elderly. The scores for multi-level lighting design and multi-level seat design were close to 90%, indicating that good lighting and comfortable seats contribute significantly to the psychological security of the elderly during nighttime activities and social scenes. Overall, multi-level design had significant advantages in improving the satisfaction and psychological comfort of elderly people’s use of public areas.
2.6 Regression analysis of adaptability to different environmental design elements
The study adopted multiple regression analysis method, using adaptive indicators of the elderly, such as activity participation, social frequency, psychological comfort, etc., as dependent variables for regression analysis. The outcomes are represented in Table 5.
Results of regression analysis of different environmental design elements on adaptation
| Variable | Regression coefficient | Standard error | t-value | P-value | Significance |
|---|---|---|---|---|---|
| Space design | 0.31 | 0.061 | 5.08 | 0 | Significant |
| Road design | 0.24 | 0.046 | 5.22 | 0 | Significant |
| Lighting design | 0.19 | 0.065 | 2.92 | 0.004 | Significant |
| Seating design | 0.18 | 0.051 | 3.53 | 0.001 | Significant |
| Constant | 0.63 | 0.025 | 25.23 | 0 | Significant |
| Adjusted R 2 | 0.72 | / | / | / | / |
From Table 5, the regression coefficient of space design was 0.31, indicating that it had the greatest impact on the adaptability of the elderly, which means that the elderly could better participate in daily activities and enhance social interaction and psychological comfort with reasonable space layout and functional area division. Road design was the next most important, with a regression coefficient of 0.24. Lighting design and seating design had regression coefficients of 0.19 and 0.18, respectively, which still had a significant impact on the adaptability of the elderly despite their relatively small effects. Lighting design plays a key role in ensuring the safety and psychological comfort of nighttime activities, while seating design enhances the comfort of older adults in public areas by providing adequate resting points and socialization spaces. Overall, the adjusted R 2 of the regression model was 0.72, indicating that the design elements of the study explained a larger proportion of the variance in the adaptability of older adults and that the model had high explanatory power.
3 Conclusion
Based on the theory of human-environment adaptation, the study proposed a multilevel adaptive design scheme for urban and rural public areas for the elderly, and evaluated the design effect through field research. The results of the study showed that spatial design had the greatest influence on the adaptability of the elderly, with a regression coefficient of 0.34, indicating that rational spatial layout and division of functional areas could significantly improve the activity participation and social interaction of the elderly. The regression coefficient of road design was 0.27, indicating that road width and continuity play an important role in the travel convenience of the elderly. The regression coefficient of lighting design was 0.22, which showed that nighttime lighting effectively reduced the anxiety and safety risks of the elderly traveling at night. The regression coefficient of seating design was 0.19, indicating that rest area design had a significant effect in meeting the rest needs of the elderly. Through regression analysis, the adjusted R² value of the model was 0.72, indicating that the explanatory power of the design elements on the adaptability of the elderly was strong. The overall design solution not only improved the quality of life of the elderly, especially in terms of safety, comfort, and social interaction, but also provided a quantitative basis and practical guidance for the adaptive design of urban and rural elderly public areas. However, the study also has some limitations. First, the sample only covers some urban and rural areas in Chengdu, and the generalizability of the results may be affected by regional differences; the sample should be expanded to cover more cities and regions in the future. Second, the study mainly focused on the physical environment design and did not involve the application of intelligent technology, which is of great significance in modern elderly care design. Future work can consider integrating intelligent devices and technologies into aging-friendly design, such as intelligent lighting and intelligent monitoring, in order to further improve the quality of life and safety of the elderly. In addition, the optimization of social policies and resource allocation is also an important direction for future research, which should be combined with government and social forces to jointly promote the application of aging-friendly design.
-
Funding information: The author states no funding involved.
-
Author contributions: Author has accepted responsibility for the entire content of this manuscript and approved its submission.
-
Conflict of interest: Author states no conflict of interest.
-
Data availability statement: The datasets generated during and/or analyzed during the current study are available from the corresponding author on reasonable request.
References
[1] Trischler J, Westman Trischler J. Design for experience – a public service design approach in the age of digitalization. Public Manag Rev. 2022;24(8):1251–70.10.1080/14719037.2021.1899272Suche in Google Scholar
[2] Brüchert T, Baumgart S, Bolte G. Social determinants of older adults’ urban design preference: A cross-sectional study. Cities Health. 2022;6(2):360–74.10.1080/23748834.2020.1870845Suche in Google Scholar
[3] Xu T, Nordin NA, Aini AM. Urban green space and subjective well-being of older people: A systematic literature review. Int J Env Res Public Health. 2022;19(21):14227–9.10.3390/ijerph192114227Suche in Google Scholar PubMed PubMed Central
[4] Zhu H. Spatial matching and policy-planning evaluation of urban elderly care facilities based on multi-agent simulation: Evidence from Shanghai, China. Sustainability. 2022;14(23):16183–91.10.3390/su142316183Suche in Google Scholar
[5] Zeng Y, Chen B. Evaluation of aging-friendly public spaces in old urban communities based on IPA method – A case study of Shouyi Community in Wuhan. Buildings. 2024;14(8):2362–8.10.3390/buildings14082362Suche in Google Scholar
[6] Wang Z, Wang X, Dong Z, Li L, Li S. More urban elderly care facilities should be placed in densely populated areas for an aging Wuhan of China. Land. 2023;12(1):220–34.10.3390/land12010220Suche in Google Scholar
[7] Chantakeeree C, Sormunen M, Estola M, Jullamate P, Turunen H. Factors affecting quality of life among older adults with hypertension in urban and rural areas in Thailand: A cross-sectional study. Int J Aging Hum Dev. 2022;95(2):222–44.10.1177/00914150211050880Suche in Google Scholar PubMed PubMed Central
[8] Lak A, Khodakarim S, Myint PK. The influencing factors of elder-friendly public open spaces promoting older adults’ health in deprived urban neighborhoods: Partial least square structural equation modeling approach. Front Public Health. 2023;11(6):3289–97.10.3389/fpubh.2023.1143289Suche in Google Scholar PubMed PubMed Central
[9] Zhang C, Chen Y, Dewancker BJ, Shen C, Tian H, Wan J, et al. Emotional landscapes in urban design: Analyzing color emotional responses of the elderly to community outdoor spaces in Yi Jie Qu. Buildings. 2024;14(3):793–8.10.3390/buildings14030793Suche in Google Scholar
[10] Younes SR, Marques B, McIntosh J. Public spaces for older people: A review of the relationship between public space to quality of life. Sustainability. 2024;16(11):4583–6.10.3390/su16114583Suche in Google Scholar
[11] Crist JD, Lacasse C, Phillips LR, Liu J. Lawton’s theory of person-environment fit: Theoretical foundations for detecting tipping points. Innov Aging. 2019;3(1):597–603.10.1093/geroni/igz038.2218Suche in Google Scholar
[12] Chauhan S, Srivastava S, Kumar P, Patel R. Decomposing urban-rural differences in multimorbidity among older adults in India: A study based on LASI data. BMC Public Health. 2022;22(1):502–11.10.1186/s12889-022-12878-7Suche in Google Scholar PubMed PubMed Central
[13] Yang X, Sun H, Huang Y. A framework of community pedestrian network design based on urban network analysis. Buildings. 2022;12(6):819–30.10.3390/buildings12060819Suche in Google Scholar
[14] Khalil RA. Building the public transportation system in Libya. Eng Herit J. 2024;8(1):7–12.10.26480/gwk.01.2024.07.12Suche in Google Scholar
[15] Zhang F, Loo BPY, Wang B. Aging in place: From the neighborhood environment, sense of community, to life satisfaction. Ann Am Assoc Geogr. 2022;112(5):1484–99.10.1080/24694452.2021.1985954Suche in Google Scholar
[16] Abusaada H, Elshater A. Can public spaces alleviate poverty-related feelings? Content analysis of vision 2030 and Egyptian residents’ storytelling. Buildings. 2023;13(5):1328–41.10.3390/buildings13051328Suche in Google Scholar
[17] Olurin JO, Gidiagba JG, Ehiaguina VE, Ndiwe TC, Ojo GG, Ogunjobi OA. Safety, quality control, and sustainability in construction: Exploring the nexus – A review. Eng Herit J. 2023;7(1):72–93.10.26480/gwk.01.2023.72.93Suche in Google Scholar
[18] Cao X, Hou SI. Aging in community mechanism: Transforming communities to achieving person–environment fit across time. J Aging Env. 2022;36(3):256–73.10.1080/26892618.2021.1926042Suche in Google Scholar
[19] Filipovič Hrast M, Sendi R, Kerbler B. Person–environment fit in urban neighbourhoods in Slovenia: Challenges and coping strategies. Int J Env Res Public Health. 2023;20(6):5139–44.10.3390/ijerph20065139Suche in Google Scholar PubMed PubMed Central
[20] Amin SN, Shivakumara P, Jun TX. An augmented reality-based approach for designing interactive food menu of restaurant using Android. Artif Intell Appl. 2023;1(1):26–34.10.47852/bonviewAIA2202354Suche in Google Scholar
[21] Maayah B, Moussaoui A, Bushnaq S, Abu Arqub O. The multistep Laplace optimized decomposition method for solving fractional-order coronavirus disease model (COVID-19) via the Caputo fractional approach. Demonstr Math. 2022;55(1):963–77.10.1515/dema-2022-0183Suche in Google Scholar
[22] Maayah B, Arqub OA, Alnabulsi S, Alsulami H. Numerical solutions and geometric attractors of a fractional model of the cancer-immune based on the Atangana-Baleanu-Caputo derivative and the reproducing kernel scheme. Chin J Phys. 2022;80:463–83.10.1016/j.cjph.2022.10.002Suche in Google Scholar
© 2025 the author(s), published by De Gruyter
This work is licensed under the Creative Commons Attribution 4.0 International License.
Artikel in diesem Heft
- Research Articles
- Generalized (ψ,φ)-contraction to investigate Volterra integral inclusions and fractal fractional PDEs in super-metric space with numerical experiments
- Solitons in ultrasound imaging: Exploring applications and enhancements via the Westervelt equation
- Stochastic improved Simpson for solving nonlinear fractional-order systems using product integration rules
- Exploring dynamical features like bifurcation assessment, sensitivity visualization, and solitary wave solutions of the integrable Akbota equation
- Research on surface defect detection method and optimization of paper-plastic composite bag based on improved combined segmentation algorithm
- Impact the sulphur content in Iraqi crude oil on the mechanical properties and corrosion behaviour of carbon steel in various types of API 5L pipelines and ASTM 106 grade B
- Unravelling quiescent optical solitons: An exploration of the complex Ginzburg–Landau equation with nonlinear chromatic dispersion and self-phase modulation
- Perturbation-iteration approach for fractional-order logistic differential equations
- Variational formulations for the Euler and Navier–Stokes systems in fluid mechanics and related models
- Rotor response to unbalanced load and system performance considering variable bearing profile
- DeepFowl: Disease prediction from chicken excreta images using deep learning
- Channel flow of Ellis fluid due to cilia motion
- A case study of fractional-order varicella virus model to nonlinear dynamics strategy for control and prevalence
- Multi-point estimation weldment recognition and estimation of pose with data-driven robotics design
- Analysis of Hall current and nonuniform heating effects on magneto-convection between vertically aligned plates under the influence of electric and magnetic fields
- A comparative study on residual power series method and differential transform method through the time-fractional telegraph equation
- Insights from the nonlinear Schrödinger–Hirota equation with chromatic dispersion: Dynamics in fiber–optic communication
- Mathematical analysis of Jeffrey ferrofluid on stretching surface with the Darcy–Forchheimer model
- Exploring the interaction between lump, stripe and double-stripe, and periodic wave solutions of the Konopelchenko–Dubrovsky–Kaup–Kupershmidt system
- Computational investigation of tuberculosis and HIV/AIDS co-infection in fuzzy environment
- Signature verification by geometry and image processing
- Theoretical and numerical approach for quantifying sensitivity to system parameters of nonlinear systems
- Chaotic behaviors, stability, and solitary wave propagations of M-fractional LWE equation in magneto-electro-elastic circular rod
- Dynamic analysis and optimization of syphilis spread: Simulations, integrating treatment and public health interventions
- Visco-thermoelastic rectangular plate under uniform loading: A study of deflection
- Threshold dynamics and optimal control of an epidemiological smoking model
- Numerical computational model for an unsteady hybrid nanofluid flow in a porous medium past an MHD rotating sheet
- Regression prediction model of fabric brightness based on light and shadow reconstruction of layered images
- Dynamics and prevention of gemini virus infection in red chili crops studied with generalized fractional operator: Analysis and modeling
- Qualitative analysis on existence and stability of nonlinear fractional dynamic equations on time scales
- Fractional-order super-twisting sliding mode active disturbance rejection control for electro-hydraulic position servo systems
- Analytical exploration and parametric insights into optical solitons in magneto-optic waveguides: Advances in nonlinear dynamics for applied sciences
- Bifurcation dynamics and optical soliton structures in the nonlinear Schrödinger–Bopp–Podolsky system
- User profiling in university libraries by combining multi-perspective clustering algorithm and reader behavior analysis
- Review Article
- Haar wavelet collocation method for existence and numerical solutions of fourth-order integro-differential equations with bounded coefficients
- Special Issue: Nonlinear Analysis and Design of Communication Networks for IoT Applications - Part II
- Silicon-based all-optical wavelength converter for on-chip optical interconnection
- Research on a path-tracking control system of unmanned rollers based on an optimization algorithm and real-time feedback
- Analysis of the sports action recognition model based on the LSTM recurrent neural network
- Industrial robot trajectory error compensation based on enhanced transfer convolutional neural networks
- Research on IoT network performance prediction model of power grid warehouse based on nonlinear GA-BP neural network
- Interactive recommendation of social network communication between cities based on GNN and user preferences
- Application of improved P-BEM in time varying channel prediction in 5G high-speed mobile communication system
- Construction of a BIM smart building collaborative design model combining the Internet of Things
- Optimizing malicious website prediction: An advanced XGBoost-based machine learning model
- Economic operation analysis of the power grid combining communication network and distributed optimization algorithm
- Sports video temporal action detection technology based on an improved MSST algorithm
- Internet of things data security and privacy protection based on improved federated learning
- Enterprise power emission reduction technology based on the LSTM–SVM model
- Construction of multi-style face models based on artistic image generation algorithms
- Research and application of interactive digital twin monitoring system for photovoltaic power station based on global perception
- Special Issue: Decision and Control in Nonlinear Systems - Part II
- Animation video frame prediction based on ConvGRU fine-grained synthesis flow
- Application of GGNN inference propagation model for martial art intensity evaluation
- Benefit evaluation of building energy-saving renovation projects based on BWM weighting method
- Deep neural network application in real-time economic dispatch and frequency control of microgrids
- Real-time force/position control of soft growing robots: A data-driven model predictive approach
- Mechanical product design and manufacturing system based on CNN and server optimization algorithm
- Application of finite element analysis in the formal analysis of ancient architectural plaque section
- Research on territorial spatial planning based on data mining and geographic information visualization
- Fault diagnosis of agricultural sprinkler irrigation machinery equipment based on machine vision
- Closure technology of large span steel truss arch bridge with temporarily fixed edge supports
- Intelligent accounting question-answering robot based on a large language model and knowledge graph
- Analysis of manufacturing and retailer blockchain decision based on resource recyclability
- Flexible manufacturing workshop mechanical processing and product scheduling algorithm based on MES
- Exploration of indoor environment perception and design model based on virtual reality technology
- Tennis automatic ball-picking robot based on image object detection and positioning technology
- A new CNN deep learning model for computer-intelligent color matching
- Design of AR-based general computer technology experiment demonstration platform
- Indoor environment monitoring method based on the fusion of audio recognition and video patrol features
- Health condition prediction method of the computer numerical control machine tool parts by ensembling digital twins and improved LSTM networks
- Establishment of a green degree evaluation model for wall materials based on lifecycle
- Quantitative evaluation of college music teaching pronunciation based on nonlinear feature extraction
- Multi-index nonlinear robust virtual synchronous generator control method for microgrid inverters
- Manufacturing engineering production line scheduling management technology integrating availability constraints and heuristic rules
- Analysis of digital intelligent financial audit system based on improved BiLSTM neural network
- Attention community discovery model applied to complex network information analysis
- A neural collaborative filtering recommendation algorithm based on attention mechanism and contrastive learning
- Rehabilitation training method for motor dysfunction based on video stream matching
- Research on façade design for cold-region buildings based on artificial neural networks and parametric modeling techniques
- Intelligent implementation of muscle strain identification algorithm in Mi health exercise induced waist muscle strain
- Optimization design of urban rainwater and flood drainage system based on SWMM
- Improved GA for construction progress and cost management in construction projects
- Evaluation and prediction of SVM parameters in engineering cost based on random forest hybrid optimization
- Museum intelligent warning system based on wireless data module
- Optimization design and research of mechatronics based on torque motor control algorithm
- Special Issue: Nonlinear Engineering’s significance in Materials Science
- Experimental research on the degradation of chemical industrial wastewater by combined hydrodynamic cavitation based on nonlinear dynamic model
- Study on low-cycle fatigue life of nickel-based superalloy GH4586 at various temperatures
- Some results of solutions to neutral stochastic functional operator-differential equations
- Ultrasonic cavitation did not occur in high-pressure CO2 liquid
- Research on the performance of a novel type of cemented filler material for coal mine opening and filling
- Testing of recycled fine aggregate concrete’s mechanical properties using recycled fine aggregate concrete and research on technology for highway construction
- A modified fuzzy TOPSIS approach for the condition assessment of existing bridges
- Nonlinear structural and vibration analysis of straddle monorail pantograph under random excitations
- Achieving high efficiency and stability in blue OLEDs: Role of wide-gap hosts and emitter interactions
- Construction of teaching quality evaluation model of online dance teaching course based on improved PSO-BPNN
- Enhanced electrical conductivity and electromagnetic shielding properties of multi-component polymer/graphite nanocomposites prepared by solid-state shear milling
- Optimization of thermal characteristics of buried composite phase-change energy storage walls based on nonlinear engineering methods
- A higher-performance big data-based movie recommendation system
- Nonlinear impact of minimum wage on labor employment in China
- Nonlinear comprehensive evaluation method based on information entropy and discrimination optimization
- Application of numerical calculation methods in stability analysis of pile foundation under complex foundation conditions
- Research on the contribution of shale gas development and utilization in Sichuan Province to carbon peak based on the PSA process
- Characteristics of tight oil reservoirs and their impact on seepage flow from a nonlinear engineering perspective
- Nonlinear deformation decomposition and mode identification of plane structures via orthogonal theory
- Numerical simulation of damage mechanism in rock with cracks impacted by self-excited pulsed jet based on SPH-FEM coupling method: The perspective of nonlinear engineering and materials science
- Cross-scale modeling and collaborative optimization of ethanol-catalyzed coupling to produce C4 olefins: Nonlinear modeling and collaborative optimization strategies
- Unequal width T-node stress concentration factor analysis of stiffened rectangular steel pipe concrete
- Special Issue: Advances in Nonlinear Dynamics and Control
- Development of a cognitive blood glucose–insulin control strategy design for a nonlinear diabetic patient model
- Big data-based optimized model of building design in the context of rural revitalization
- Multi-UAV assisted air-to-ground data collection for ground sensors with unknown positions
- Design of urban and rural elderly care public areas integrating person-environment fit theory
- Application of lossless signal transmission technology in piano timbre recognition
- Application of improved GA in optimizing rural tourism routes
- Architectural animation generation system based on AL-GAN algorithm
- Advanced sentiment analysis in online shopping: Implementing LSTM models analyzing E-commerce user sentiments
- Intelligent recommendation algorithm for piano tracks based on the CNN model
- Visualization of large-scale user association feature data based on a nonlinear dimensionality reduction method
- Low-carbon economic optimization of microgrid clusters based on an energy interaction operation strategy
- Optimization effect of video data extraction and search based on Faster-RCNN hybrid model on intelligent information systems
- Construction of image segmentation system combining TC and swarm intelligence algorithm
- Particle swarm optimization and fuzzy C-means clustering algorithm for the adhesive layer defect detection
- Optimization of student learning status by instructional intervention decision-making techniques incorporating reinforcement learning
- Fuzzy model-based stabilization control and state estimation of nonlinear systems
- Optimization of distribution network scheduling based on BA and photovoltaic uncertainty
- Tai Chi movement segmentation and recognition on the grounds of multi-sensor data fusion and the DBSCAN algorithm
- Special Issue: Dynamic Engineering and Control Methods for the Nonlinear Systems - Part III
- Generalized numerical RKM method for solving sixth-order fractional partial differential equations