Quantitative evaluation of college music teaching pronunciation based on nonlinear feature extraction
-
Aiping Wang


Abstract
The complexity and diversity of different music styles created by different composers make music evaluation a very difficult problem. To quantitatively evaluate the quality of music pronunciation, this work proposes a method for extracting nonlinear features of music signals. By selecting different styles of music signals, based on chaos theory, fractal theory, and Lyapunov exponent, the change in correlation dimension of different kinds of music signals is analyzed from a nonlinear perspective, so as to realize vocal music evaluation and training in music teaching. The results showed that the filter used in the study has a good noise-reduction effect. The power spectrum of the music signal was qualitatively analyzed, and the music signal was characterized by chaos. The difference between the maximum and minimum values of the Lyapunov exponent of the For Alice music signal was 0.244, which is larger than the other music signals. After the correlation dimension analysis, the correlation dimension of the Croatian Rhapsody music signal varied strongly. The average correlation dimension of the five music signals fluctuated above and below the corresponding average correlation dimension value at order 0, and the music signals had stable nonlinear features. The research method of the article is conducive to deepening the understanding of music signal patterns and has a certain promotion effect on music teaching.
1 Introduction
As an important cognitive mode, music can reflect the characteristics of the cerebral nervous system, because the cerebral nervous system is a highly complex nonlinear system, and its nonlinear characteristics will change with changes in emotions or physical states [1]. When a nonlinear system is in a bifurcation or chaotic state, external excitation plays a crucial role in changing the operating state of the system, and the system is easily affected by the initial state [2]. When a nonlinear system is in a bifurcation or chaotic state, the external excitation plays a crucial role in changing the operating state of the system, that is, the nonlinear system is easily affected by the initial state [3]. From the perspective of system, music signal is a nonlinear dynamic system with time delay, which has the characteristics of multiple degrees of freedom and high dimension. In the process of system evolution, the constant switching of stability will cause Hopf bifurcation [4]. Hopf bifurcation is a bifurcation phenomenon in dynamic systems, which refers to the transition process from the equilibrium point to the periodic solution when the parameters change. When the parameter passes the critical value, the stability of the equilibrium point changes, and a periodic solution is generated, which is manifested as the oscillation behavior of the system. In music signals, Hopf bifurcation will cause complex periodic motion, accompanied by weak chaos [5,6]. Therefore, applying nonlinear scientific thought and method to study music signal can reveal its essential law and nonlinear characteristics, so that it can be better applied to music signal retrieval and teaching practice evaluation. Traditional methods such as short-time analysis and Fourier transform usually divide musical signals into small fragments for processing based on stationary assumption, but ignore the uncertainty and fuzziness in the signals and lack rigorous mathematical models [7,8]. In view of the above problems, the characteristics and analysis methods of nonlinear signals are introduced, and the nonlinear characteristics of music signals are extracted by analyzing the calculated correlation dimension and Lyapunov exponential spectrum.
2 Related work
Music teaching is an important part of higher education, expanding students’ musical knowledge and improving their musicality, while harmonizing their emotions and providing them with a healthy state of mind. Yang designed a mobile classroom based on a cloud computing platform, upgrading the music cloud database to meet the needs of students and teachers for music socialization, music sharing, and commenting. After testing, it was found that the designed platform has certain practicality to meet students’ personalized learning and promote the quality of music teaching [9]. Fu reformed traditional music teaching to be able to strengthen students’ professional competence, by reconstructing the teaching model, so that the quality of reformed teaching can be improved substantially, and pointed out the positive aspects of vocal music teaching reform [10]. Tejada et al. conducted an analysis of in-service generalist music teachers through a mixed method to analyze the relationship between music training and teaching practice and its impact on teachers’ self-perception of effectiveness. After a questionnaire analysis, it was found that teachers who lacked musical training had low self-efficacy, which was not conducive to effective self-perceptions of vocal teachers and their level of teaching practice was inadequate [11]. Parada-Cabaleiro et al. conducted a study on acoustic music characteristics to analyze their impact on self-perceived anxiety and conducted a related experiment. The analysis of the results obtained revealed that tonal music facilitates the alleviation of self-perceived anxiety and that the harmonic situation of the music should also be taken into account when making the choice of relaxation music [12]. Gomez-Canon et al. explored musical emotion recognition, pointing out that it would be interesting to carry out research on relevant algorithms. Various aspects are involved in the process of music emotion feature extraction, such as neuroscience, music theory, etc. [13].
Ghanbarisabagh et al. faced the problem of noise in digital images and carried out noise removal by means of a compound filter based on the Kaiser window. After relevant tests, the method was found to be effective in removing noise and improving the quality of images to a greater extent [14]. Horan analyzed the Perron-Frobenius operator and studied the characteristics of its Lyapunov exponent as a means of dynamic force information. The analysis showed that there is asymptotic linearity in the second largest Lyapunov exponent among the scaling parameters [15]. Li et al. faced the problem of predictability of cold and warm events and used a quantitative analysis to correlate it by improving the Lyapunov exponent method. From the results obtained, it can be seen that cold events are more difficult to predict compared to warm events [16]. Huang and Lu used a DC–DC converter as the object of study, constructed a correlated iterative mapping model and analyzed its nonlinear dynamical behavior by the Lyapunov exponent method. Based on the analysis results, it can be seen that the method used is valid [17]. Djilali et al. used the quadratic Lyapunov function to solve the calculation of the non-compactedness of the spread of spatially heterogeneous viruses, and verified the validity of the results through indicators such as uniform persistence, presence of viral homeostasis, and global stability of viral homeostasis [18]. Hsu et al. developed an automatic emotion recognition algorithm based on electroencephalogram to identify human emotions caused by listening to music. Through physiological ECG features extracted in time domain and frequency domain and nonlinear analysis of electrocardiogram signals, they found emotion-related features and correlated them with emotional states. Finally, the recognition result with high accuracy was obtained by the least square support vector machine identifier [19].
In summary, computational analysis based on digital music has many applications in the field of digital music research. However, in the field of music creation, when different composers create different styles of music, there are usually obvious differences in the music information only in the symbol domain, and the existing music signal feature extraction methods cannot find out the differences. In order to objectively evaluate different styles of music, research selects different styles of music, and demonstrates the features of music signals from the perspective of nonlinear through the steps of “frame segmentation,” analysis of power spectrum, calculation of Lyapunov exponent, and calculation of correlation dimension. To realize the quantitative evaluation of pronunciation in music teaching, the nonlinear characteristic changes in music signals of different styles are analyzed.
3 Simulation and characterization of music teaching in higher education based on nonlinear equations
3.1 Selection of experimental equipment and materials
In the teaching of music in higher education, teachers will train students with sight-singing and ear training, enabling them to sing accurate pitches according to the score and gain the ability to identify musical rhythms, improve their memory and gain a stronger sense of music, allowing them to experience the beauty of music and immerse themselves in the atmosphere created by music [6,20,21]. During this time, different types of music will allow students to have different emotional experiences. Research has shown that there is a specific area of the brain that is sensitive to musical signals and that when music is received by the ear and communicated to the brain, it stimulates the excitement of some cells to produce beneficial hormones or enzymes that mediate the secretion of body fluids, improve immunity, and strengthen metabolism. The function of music in the human body is based on the characteristics of the musical signal itself. This means that, to a certain extent, the musical characteristics can better reflect the motor characteristics of the brain’s nervous system. Given the complexity of the musical signal and the fact that it is a time-lagged, nonlinear dynamical system, the article is a good example of how music can be taught in higher education. Therefore, in the article, in order to analyze the music signal in music teaching in universities, the music signal is selected as the object of study, and the nonlinear features of different music signals are studied through the nonlinear method. The Lyapunov exponent corresponding to the music signal is enough to have chaotic features for judgement, based on the different nonlinear equations.
Before the analysis of the nonlinear features of the music signal, the choice of experimental equipment is carried out. The experimental equipment mainly uses two kinds of software, MATLAB and Format Factory. The former is a computer software that processes data by means of matrices. The software has a visual interface, integrates high performance values and is able to provide a number of mathematical algorithms that are powerful, easy to learn, and widely used. The latter is able to transcode video and audio or picture files, and users can set the video screen size, subtitles, etc. according to their choice. When converting, Format Factory is also able to repair damaged video or audio. While in the article, the format of Moving Picture Experts Group Audio Layer-3 (MP3) was converted to WAV format through Format Factory, and music clips of different music were intercepted through the interception function of Format Factory to prepare for the analysis of the relevant music signal characteristics. To carry out the selection of experimental materials, five types of music signals to be analyzed were selected, with three types of music, namely, pure piano pieces, Disco and Dirge, and the specific music signal information are shown in Figure 1.
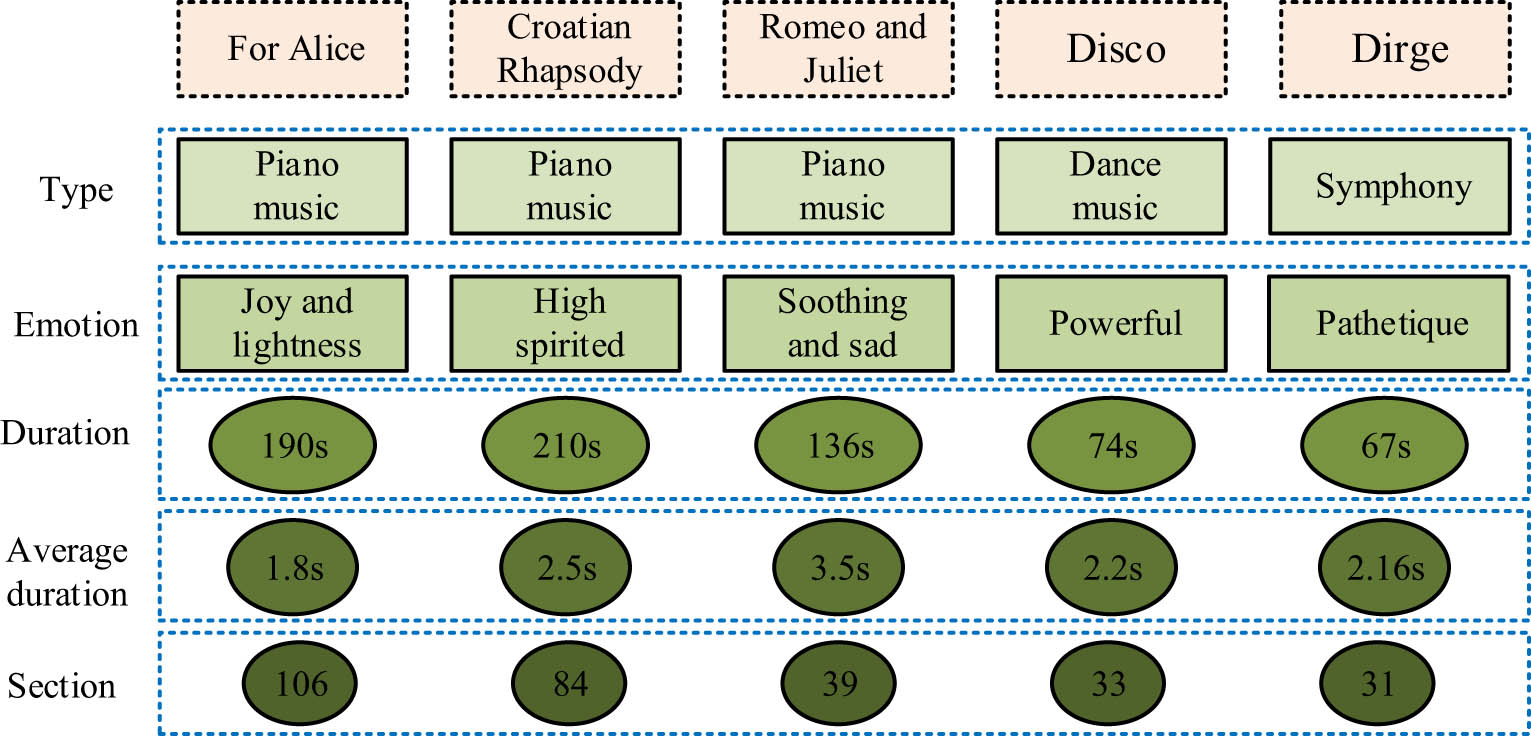
Specific information of five music signals.
Figure 1 contains five signals, For Alice, Croatian Rhapsody, Romeo and Juliet, Disco, and Dirge, presenting information on the type, emotional type, duration, and average duration of these signals. Among them, For Alice has a cheerful and relaxed mood, with the music starting with a simple and friendly theme, interspersed with two different interludes. The first interlude has a bright tone, creating a cheerful mood, while the second interlude has a bright rhythm, creating a relatively low mood, making the interlude appear serious and firm. The theme appears three times in a row. The Croatian Rhapsody has a high melody and a bright rhythm, showcasing the tragic scenes of war ruins. The melody of Romeo and Juliet is soothing and beautiful, telling the girl’s dissatisfaction with love. The long and non-urgent melody expresses the girl’s helplessness and sadness.
3.2 Simulation and characterization of music signals based on nonlinear equations
Nonlinear feature extraction is widely used in pattern recognition, image processing, text analysis, time series data analysis, and other fields. People use this method to screen out noise and redundant information in order to better understand complex data structures in the real world such as images, video, audio, text, and so on [22]. Lyapunov exponent is an important parameter in nonlinear dynamical system, which represents the divergence or convergence of adjacent orbits in phase space, and is an important index to measure the nonlinear features of the system [23]. Therefore, the Lyapunov exponent is of great significance in chaotic systems, and the Lyapunov exponent of music signal is calculated to determine whether the music signal has chaotic characteristics.
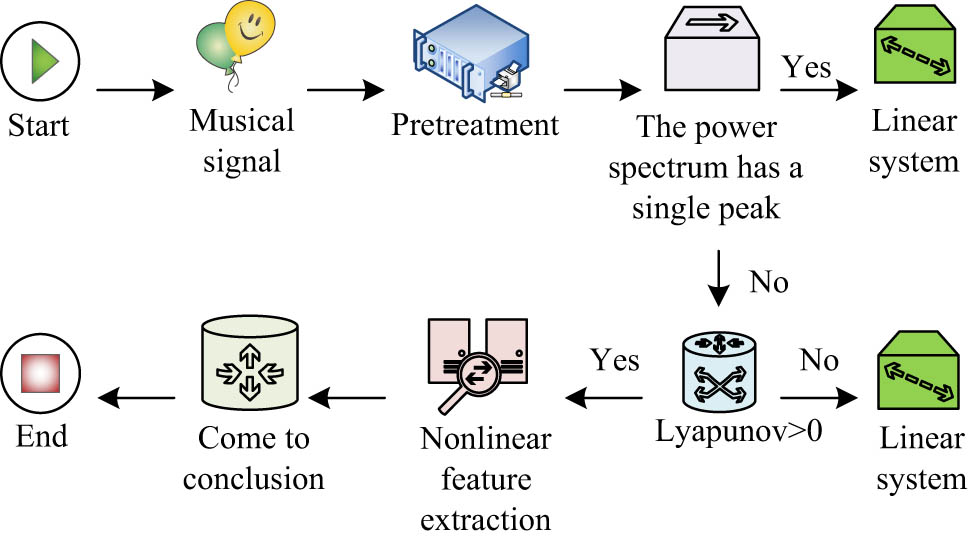
The nonlinear feature extraction process of music signal is shown in Figure 2. In Figure 2, the music signal is preprocessed first, and then the Lyapunov exponent is quantitatively calculated to determine whether the signal has chaotic characteristics. The classical GP algorithm is used to calculate the correlation dimension of the music signal. The size of the correlation dimension often reflects the fractal complexity of the nonlinear system. Finally, the correlation dimension of the whole music signal is obtained by means of the average and the mean square value, and the characteristics of the correlation dimension of different types of music signal and the relationship between them are analyzed.
Nonlinear feature extraction process of music signal.
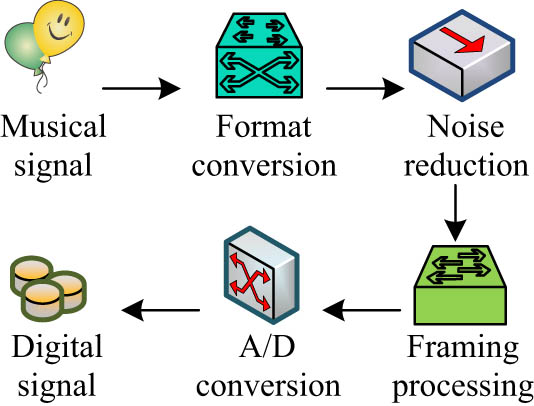
The preprocessing steps of music signal are shown in Figure 3, including format conversion, noise reduction, frame segmentation, and A/D conversion. In the experiment, the MP3 format music works are first converted into WAV format by the Format Factory, which can facilitate the direct reading of MATLAB. Then, noise reduction is carried out on the music signal to filter the noise in the music signal, and the music signal is divided into bars according to the division method determined by the experiment. A musical work is divided into small fragments according to the structure of the musical form, and finally the divided musical signal is converted into A/D to make preparation for processing.
Music signal preprocessing process.
Since music signals other than those from recording studios carry a certain amount of noise, the format-converted music signal needs to be processed for noise reduction. However, the music signal with noise contains pure music and noise, and noise can be divided into two kinds, namely, additive and non-additive, in the noise reduction processing of non-additive noise, by changing non-additive noise into additive noise. One of the mathematical expressions for the music signal with noise
where
where
where
After the music signal has been pre-processed, the chaotic features are judged and the nonlinear characteristics of the music signal are analyzed. Before the analysis, it is necessary to know whether the music signal has nonlinear features, and when it has nonlinear features, the judgment of chaotic characteristics can be made. Since it is difficult to judge chaotic features directly through the definition of chaos, the article uses the power spectrum of the music signal to judge whether the signal has nonlinear features. When the power spectrum of a music signal is coherent, it indicates that the music signal has chaotic characteristics. On the contrary, if there is only a single peak or multiple peaks in the power spectrum of a music signal, it indicates that the music signal has no chaotic characteristics. After the qualitative analysis, the Lyapunov exponent is calculated to quantify whether the signal is chaotic or not [24,25]. Where, in the definition of the Lyapunov exponent, the one-dimensional discrete mapping is shown in Eq. (4).
where
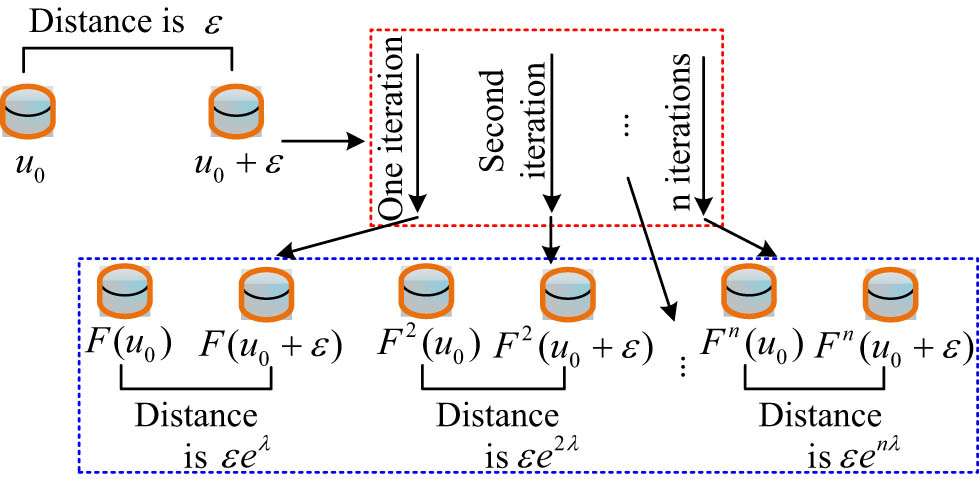
Signal iteration diagram.
In Figure 4,
From the above equation, Eq. (6) is obtained.
where
where
where
4 Analysis of the nonlinear characteristics of the music signal
To verify the effectiveness of the music signal noise-reduction processing method, 50 Hz hum was introduced into the selected For Alice music to form a music signal with noise, and noise reduction was carried out on the music signal with noise. The relevant results were obtained after the high-pass digital filter with set parameters.
Figure 5a shows a selected section of the pure music signal waveform of For Alice, Figure 5b shows the music signal with the introduction of the 50 Hz I/F signal, and Figure 5c shows the music signal with the elimination of the 50 Hz I/F signal. Comparing Figure 5a with Figure 5b, only a few parts of the pure music signal waveform of For Alice could be seen after the introduction of the 50 Hz I/F signal, while other parts were obscured by the 50 Hz I/F signal, indicating that the noise For Alice music signal will affect the analysis process of the characteristics of the music signal. In Figure 5c, with the high-pass digital filter, the noise For Alice music signal was basically eliminated from the 50 Hz frequency signal, and the waveform was basically the same as the pure For Alice music signal waveform in Figure 5a. To determine whether the music signal has chaotic characteristics, the study used a qualitative perspective, through the power spectrum of the music signal. According to this method, the study judged the noise reduction and framing of the For Alice music signal fragment, and produced its corresponding power spectrum, as shown in Figure 6.
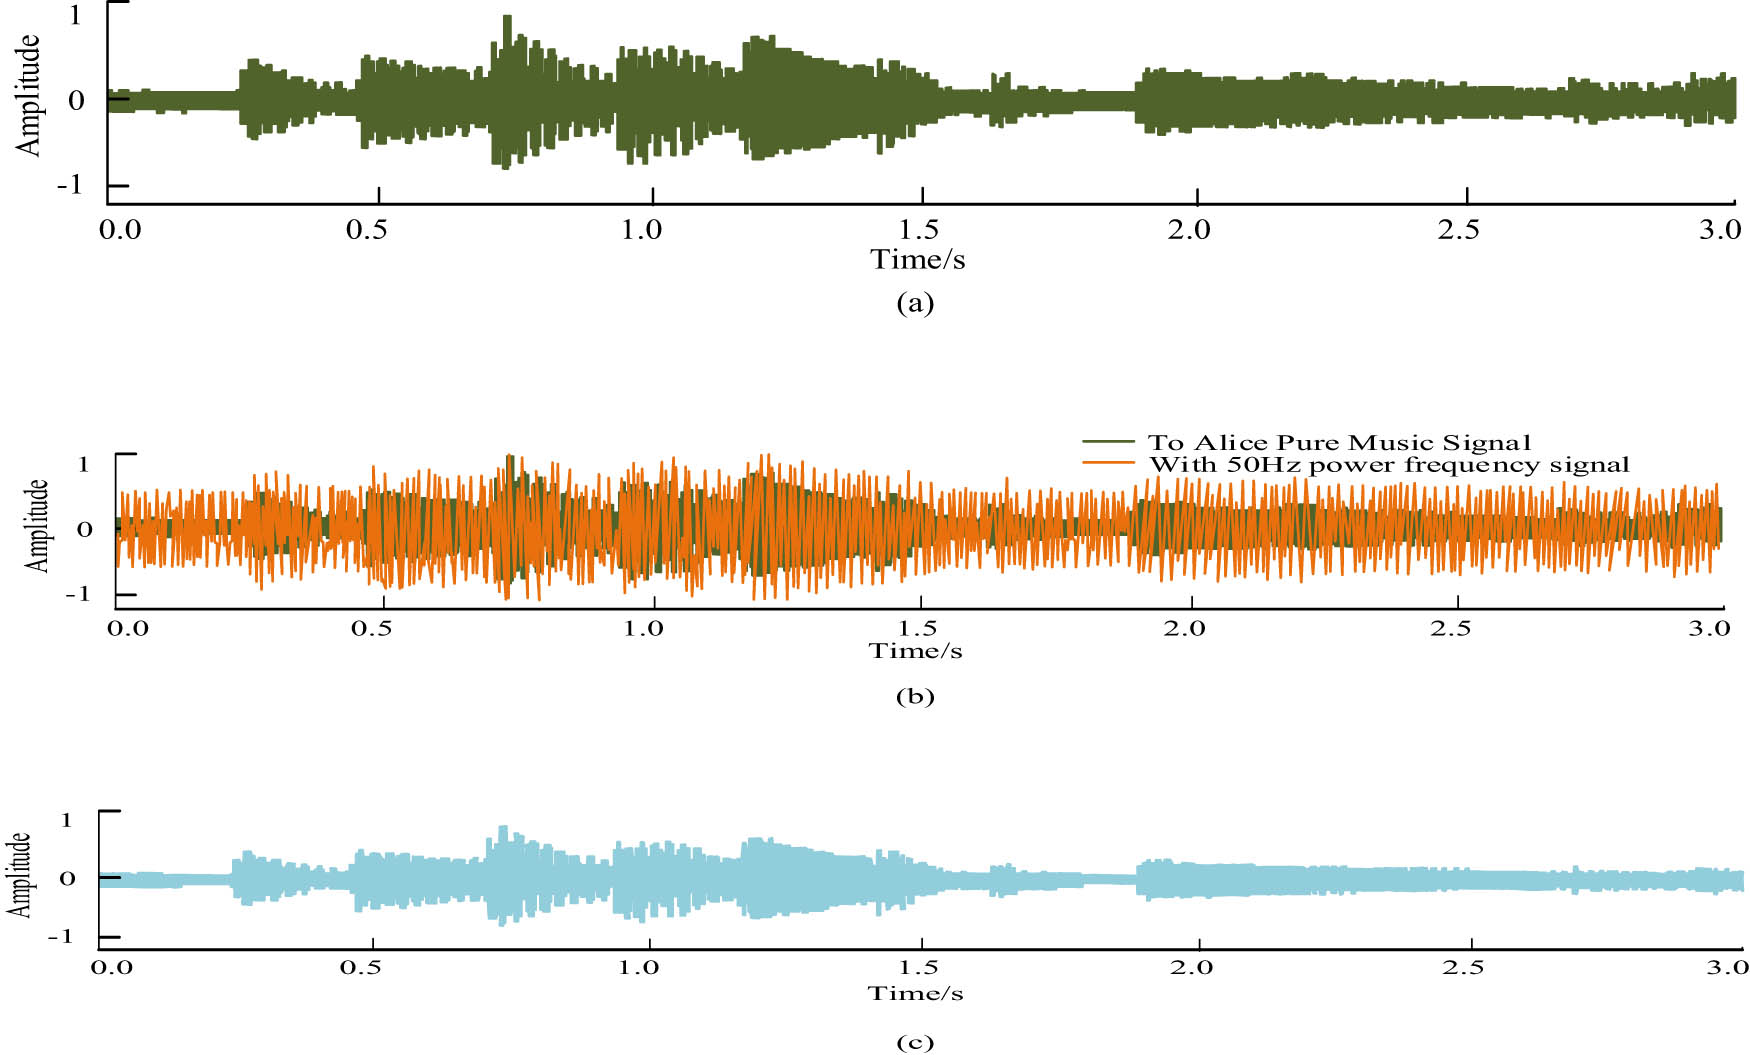
Analysis of noise introduction and noise reduction process of music signal in For Alice. (a) Pure music signal to Alice, (b) music signal with 50 Hz power frequency signal, and (c) music signal after eliminating 50 Hz power frequency signal.
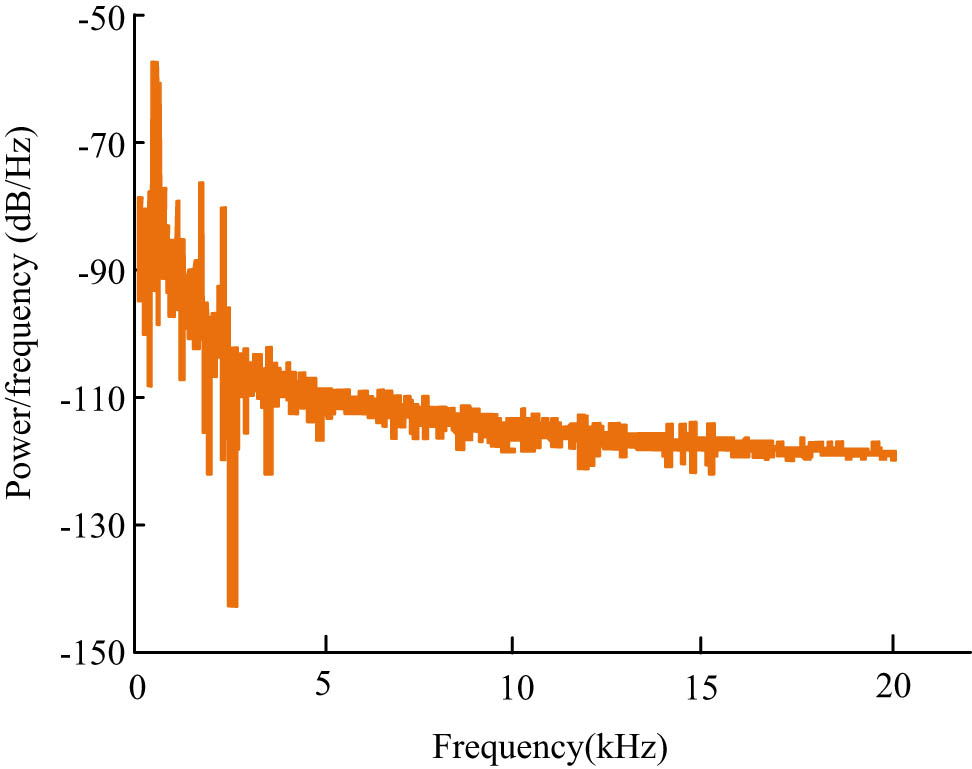
Power spectrum of For Alice music signal after noise reduction and framing.
In Figure 6, the power spectra of the noise reduction and framing segments of the For Alice music signal showed that the power spectra are coherent and do not have a single distinct peak, which means that the music signal has a chaotic character. At frequencies less than 3.68 kHz, the power spectrum of the For Alice music signal fluctuated considerably, with a maximum power spectrum of −57.41 dB/Hz. At a frequency of 2.65 kHz, the power spectrum of the For Alice music signal was at its lowest, with a power spectrum of −142.86 dB/Hz. The amplitude of the fluctuation became smaller and slowly stabilized. At frequencies above 15 kHz, the power spectral density of the For Alice music signal fluctuated slightly around 111.944 dB/Hz. On the basis of this, the Lyapunov exponent was used to quantify the chaotic characteristics of different music signals, and the relevant results are shown in Figure 7.
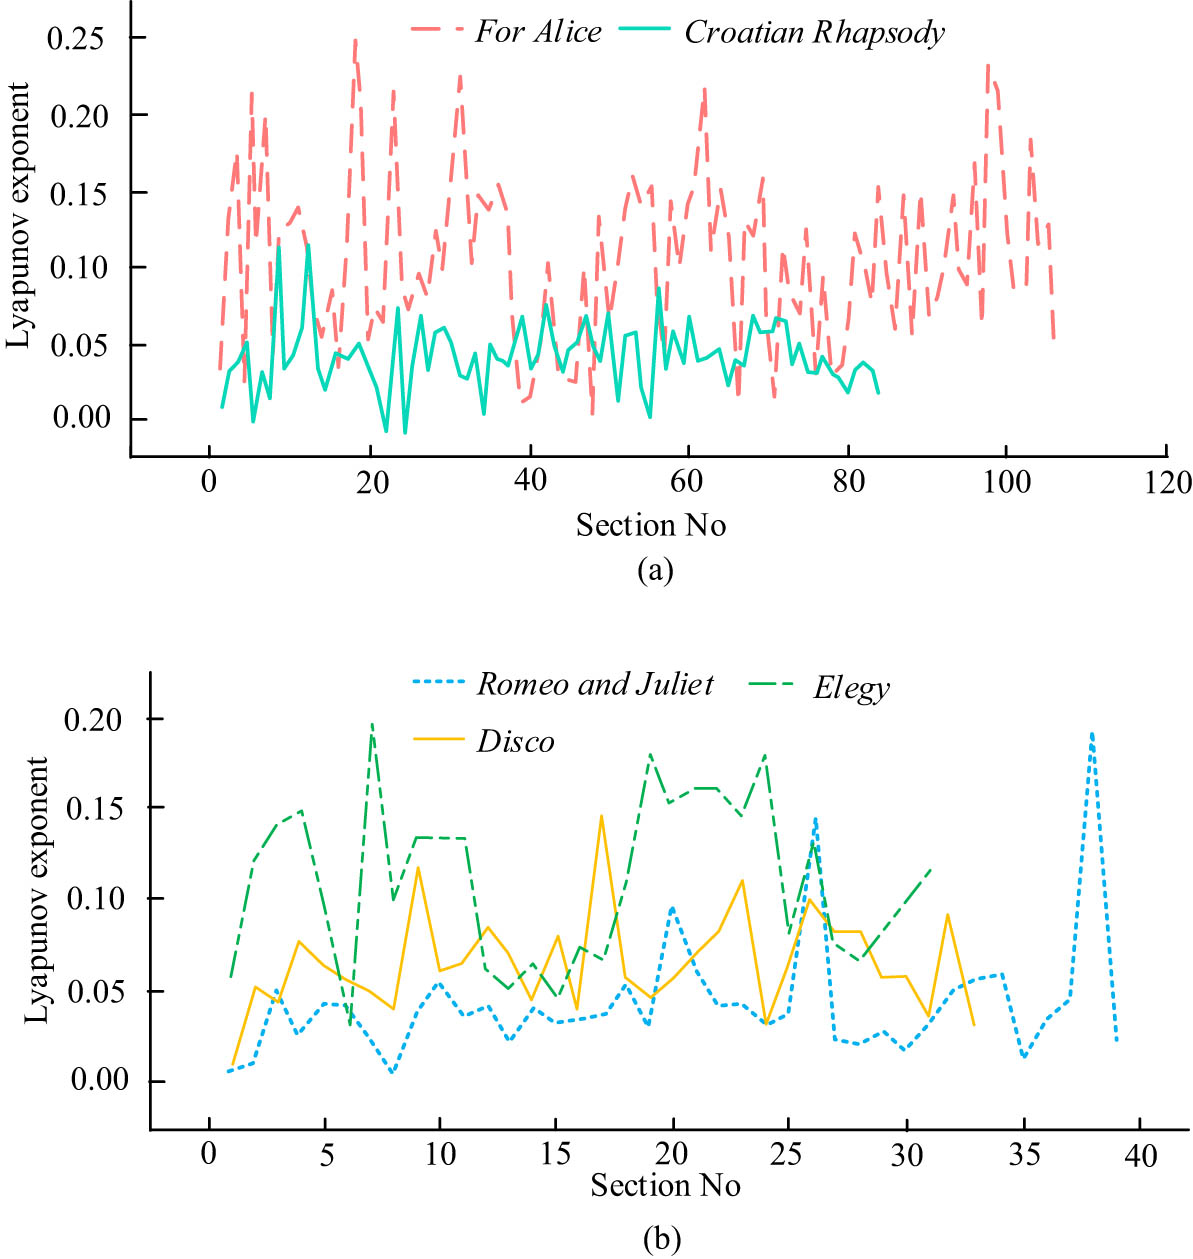
Lyapunov index and chaos characteristic analysis of different music signals. (a) Lyapunov exponent of For Alice and Croatian Rhapsody and (b) Correlation dimension of three kinds of music signals.
Figure 7a shows the Lyapunov exponents of two music signals, For Alice and Croatian Rhapsody, and Figure 7b shows the Lyapunov exponents of three music signals, Romeo and Juliet, Disco, and Elegy. In Figure 7a and b, the Lyapunov exponents of the music signals under different bar numbers were different, and the Lyapunov exponents of different music signals under the same bar number were different. The number of bar numbers of different music signals were different. The Lyapunov exponents of each of the five music signals were greater than 0, which means that all these music signal bars have chaotic characteristics. In Figure 7a, the maximum Lyapunov exponent of the For Alice signal was 0.246 at bar number 18, the minimum Lyapunov exponent was 0.002 at bar number 48, the minimum Lyapunov index was 0.157 at bar number 69, which is 0.036 larger than that at bar number 100, and the maximum Lyapunov exponent of the Croatian Rhapsody signal was 0.036 at bar number 12. In Figure 7b, at bar number 15, the Lyapunov exponent of Romeo and Juliet, Disco, and Elegy were 0.033, 0.078, and 0.045, respectively. The section in For Alice that has the largest Lyapunov exponent was the section with the strongest chaotic features. The bar with the smallest Lyapunov exponent was still the bar in For Alice, indicating that it has the weakest chaotic feature. For Alice also had the maximum–minimum Lyapunov exponent, indicating that its chaotic characteristics have the largest variation range and strong nonlinear characteristics, while Croatian Rhapsody had relatively weak nonlinear characteristics. To further analyze the chaotic characteristics of the music, the statistical analysis of the Lyapunov exponents of the five music signals is shown in Figure 8.
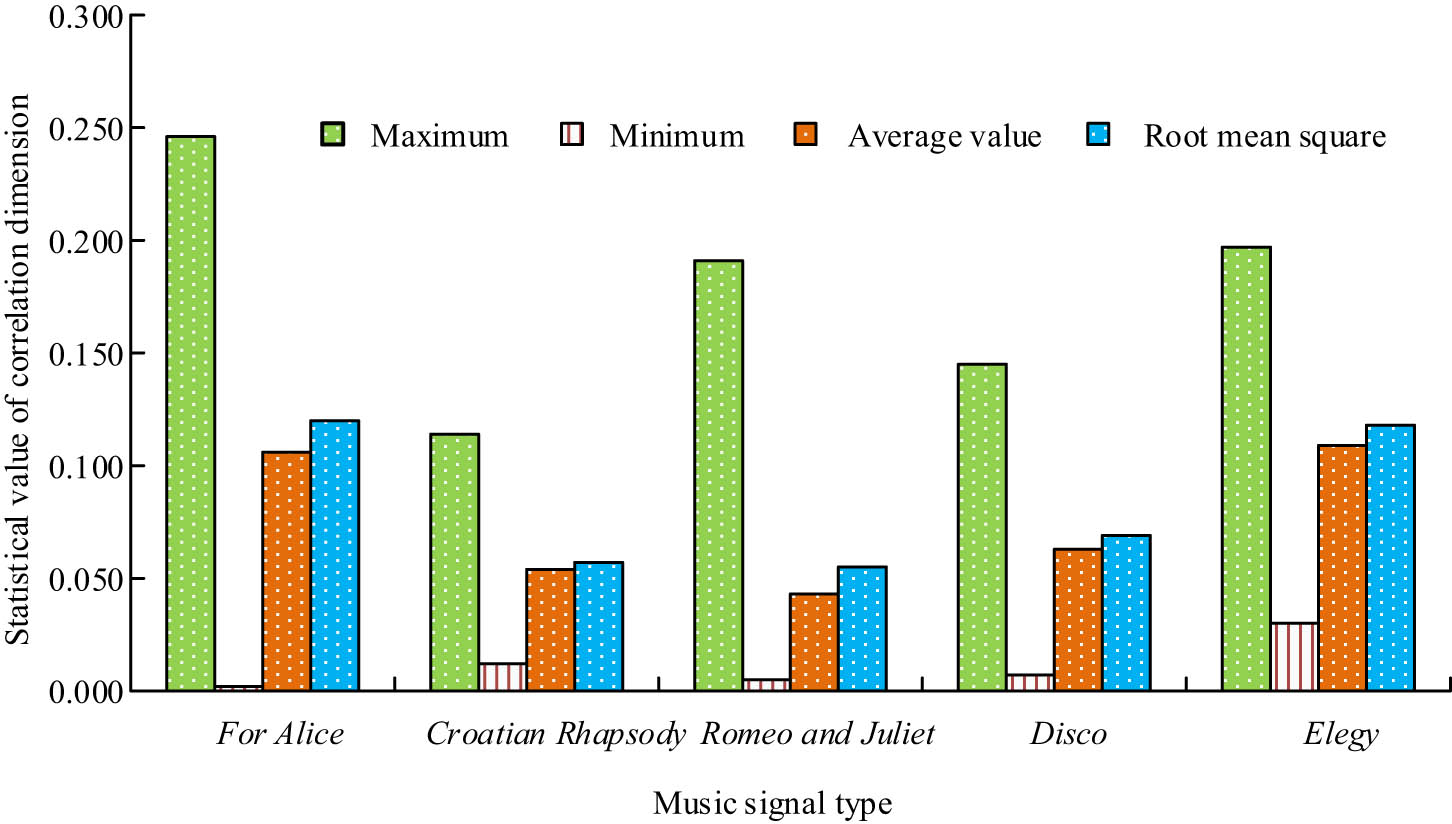
Lyapunov exponent statistics of different music signals.
In Figure 8, the four statistical values of the Lyapunov exponents of the different music signals were different. Among the maximum values of the Lyapunov exponents, the maximum value of the Lyapunov exponent of the For Alice music signal was the largest, with a maximum value of 0.246. The maximum value of the Lyapunov exponent of the Croatian Rhapsody music signal was the smallest, with a maximum value of 0.1136. The smallest values of the Lyapunov index were 0.005, 0.030, and 0.007 for Romeo and Juliet, Lament, and Disco, respectively, while the smallest value of the Lyapunov exponent was 0.002 For Alice. The size of the Lyapunov exponent indicated that the music is a weakly chaotic system, and the nonlinear features are within a controlled range. The correlation dimensions for different music were calculated and the statistics are shown specifically in Figure 9.
Correlation dimension of different music signals. (a) Correlation dimension of Piano music signal, (b) correlation dimension of three kinds of music signals, and (c) the correlation dimension of five kinds of music signals.
In Figure 9a, the trend of the three association dimension lines showed that compared to the other two piano pieces, the Croatian Rhapsody had a stronger change in association dimension, and the relatively moderate one was Romeo and Juliet. At bar number 4, the correlation dimensions of the Croatian Rhapsody For Alice and Romeo and Juliet were 20.982, 14.452, and 16.482, respectively. In Figure 9b, the correlation dimensions of the Disco and Dirge signals changed more moderately than those of Romeo and Juliet, especially the Dirge. At bar number 5, the correlation dimensions of the music signals of Romeo and Juliet, Disco, and Elegy were 16.829, 13.388, and 11.788, respectively, with Romeo and Juliet having a larger correlation dimension than Elegy by 5.041. The difference between the two was 14.376, while for Elegy, the maximum and minimum values were 15.769 and 9.173, respectively, with a difference of 6.596.
In Figure 10, there were only slight differences in the mean correlation dimension values for the five music signals at different differential orders. The average correlation dimension at order 0 was 15.131, which was smaller than the average correlation dimension at all other orders, while the average correlation dimension at order 10 was 15.315. The average correlation dimension at orders 5 and 10 for the mournful music signal was 11.501 and 11.437, respectively. The average correlation dimension fluctuated up and down from the 0th order, i.e., the correlation dimension was basically constant, and the nonlinear characteristics of the music signals were stable.
Mean value of correlation dimension of music signal under different difference orders.
To verify the superiority of the research method compared with other methods, three parameters were introduced to measure the performance of feature extraction, namely, Source-to-Distortion Ratio (SDR), Source-to-Interference ratio (SIR), and Source-to-Artifacts Ratio (SAR) [26]. Two piano pieces, Croatian Rhapsody and For Alice, were selected and the average values of SDR, SAR, and SIR were calculated. The comparison results with previous studies [26,27] are shown in Table 1. From Table 1, the study by Przyczyna et al. [27] had poor feature extraction performance for both songs, the study by Chiu et al. [26] was deficient in the separation of For Alice, and the research extraction algorithm improved SDR, SIR, and SAR in both songs. The results showed that the proposed method is robust and improves the extraction performance of nonlinear features significantly.
Comparison of extraction performance of nonlinear features
| Method | Croatian rhapsody | For Alice | ||||
|---|---|---|---|---|---|---|
| SDR | SIR | SAR | SDR | SIR | SAR | |
| Reference [26] | 3.03 | 3.50 | 15.0 | −14.03 | −6.37 | −6.62 |
| Reference [27] | −8.31 | 4.09 | −6.71 | −3.97 | −2.36 | 9.79 |
| This study | 6.19 | 15.11 | 17.24 | 5.67 | 6.78 | 8.94 |
To further enhance the generalizability of the findings, more datasets on musical styles were included, such as jazz, electronic dance music (EDM), and folk music. By increasing the diversity of samples, we can more comprehensively verify the performance of nonlinear features in different musical genres. Table 2 shows the results of comparison between the proposed method and other music evaluation methods. Among them, the signal-to-noise ratio improvement (ΔSNR) measures the noise suppression effect of a signal processing algorithm, reflecting the ability of the algorithm to remove noise while retaining useful signals. The algorithm with high ΔSNR value can effectively improve signal quality and reduce noise interference. Root mean square error (RMSE) measures the difference between the algorithm output and the true value, reflecting the accuracy and error level of the algorithm. A low RMSE value means that the algorithm output is closer to the true value and the accuracy is higher. Correlation dimension standard deviation (SD) measures the complexity and dynamics of nonlinear systems. The high SD value indicates that the nonlinear characteristics of the system are significant and the dynamic changes are severe.
Results of comparison between the proposed method and other music evaluation methods
| Lyapunov | ΔSNR (dB) | RMSE | SD | ||
|---|---|---|---|---|---|
| Jazz (Take Five) | Ref. [26] | 0.28 | 10.5 | 0.22 | 1.85 |
| Ref. [27] | 0.3 | 11.2 | 0.2 | 1.9 | |
| This study | 0.31 | 12.7 | 0.18 | 2.15 | |
| Folk Music (Jasmine) | Ref. [26] | 0.27 | 10.0 | 0.23 | 1.8 |
| Ref. [27] | 0.29 | 11.0 | 0.21 | 1.88 | |
| This study | 0.32 | 12.5 | 0.17 | 2.1 | |
| EDM | Ref. [26] | 0.26 | 9.8 | 0.24 | 1.75 |
| Ref. [27] | 0.28 | 10.8 | 0.22 | 1.82 | |
| This study | 0.3 | 12.0 | 0.19 | 2.05 |
As can be seen from Table 2, the proposed method is superior to previous studies [26,27] in all key indicators, showing its superior performance. First, in terms of Lyapunov index, the values of the proposed method (0.31, 0.32, 0.30) are higher than those of ref. [26] (0.28, 0.27, 0.26) and ref [27] (0.30, 0.29, 0.28), indicating that the proposed method is more significant in capturing the nonlinear characteristics of music signals. Second, in terms of ΔSNR, the values of the proposed method (12.7, 12.5, and 12.0 dB) are significantly higher than those of ref. [26] (10.5, 10.0, and 9.8 dB) and ref. [27] (11.2, 11.0, and 10.8 dB). It shows that the method in this paper has better performance in noise suppression. In addition, in terms of RMSE, the values of the proposed method (0.18, 0.17, 0.19) are lower than those of ref. [26] (0.22, 0.23, 0.24) and ref. [27] (0.20, 0.21, 0.22), indicating that the proposed method has smaller errors and higher precision. Finally, in terms of SD, the values of the proposed method (2.15, 2.10, 2.05) are higher than those of ref. [26] (1.85, 1.80, 1.75) and ref. [27] (1.90, 1.88, 1.82), which further proves the comprehensiveness and robustness of the proposed method in the analysis of nonlinear dynamic changes. In summary, the proposed method shows significant advantages in nonlinear feature extraction, noise suppression, precision improvement, and dynamic analysis, and has high application value.
5 Conclusion
Music teaching is a part of university education, and music is an important carrier of music teaching. To realize the objective evaluation of music, the power spectrum of music signal and Lyapunov exponent were utilized to judge whether the music signal has chaotic characteristics. By using correlation dimension and difference method, the correlation dimension characteristics of different music signals and their relationships were analyzed. The results showed that the minimum values of Lyapunov exponent of the five musical signals were all greater than 0, which proves that the musical signal has the characteristics of chaos, while the Lyapunov exponent is not large, which is more than 0.25, which proves that the chaos of the musical signal belongs to controllable weak chaos. The mean correlation dimension of the five musical signals fluctuated around the mean correlation dimension of order 0, among which the piano signal fluctuated most obviously, which is also consistent with the style of the musical work itself. Piano music is the most difficult work, the creation process is very complicated, and the composer is very demanding. Disco belongs to one of the electric music styles, and its creation is relatively simple, so the change in its correlation dimension is not as drastic as the piano music. Mourning music is usually the expression of mourning for the deceased, its rhythm changes within a certain range, and the theme of expression is relatively simple. Therefore, its correlation dimension changed the least. Piano music in the process of performance, the change in form is the most uncontrollable, so it also has the strongest nonlinear characteristics.
This method has been proved to be effective for piano music, disco music, and lament music. To expand the application scenario, the study also tested jazz, electronic music, and folk music. By comparing the structural classification with the quantitative index, the experiment shows that the Lyapunov index range of the new musical styles (jazz, folk music) is significantly higher than that of the original sample, which verifies the complexity difference of the nonlinear features. ΔSNR (up to 12.7 dB) and RMSE (down to 0.18 dB) indicate that the proposed method performs well in noise suppression and feature retention. The music signal analysis based on nonlinear features in this study can provide quantitative feedback for vocal music training and help teachers evaluate students’ pronunciation quality more accurately. For example, by monitoring changes in the Lyapunov index in real time, teachers can identify student instability in singing (such as pitch fluctuations or rhythm deviations) and adjust training strategies accordingly. In addition, this research method can also be used to develop an intelligent music teaching system, which can automatically analyze the nonlinear characteristics of students’ playing or singing, provide personalized learning suggestions, and improve teaching efficiency. In this study, noise suppression technology may cause loss of high-frequency components of the original music signal, especially when processing high-frequency rich music (such as electronic music), which may affect the accuracy of nonlinear features. Future research could explore more advanced noise suppression algorithms, such as deep learning-based spectrum repair techniques, to balance noise removal with signal fidelity.
-
Funding information: The research is supported by: Henan Vocational Education Teaching Reform Research and Practice Project, Project name: Research on Musicology of Secondary and Higher Vocational Education and Music Culture Development of Puyang Community, No.: Yujiao (2021) 58188.
-
Author contributions: The author has accepted responsibility for the entire content of this manuscript and approved its submission.
-
Conflict of interest: Author states no conflict of interest.
-
Data availability statement: All data generated or analyzed during this study are included in this published article.
References
[1] Ma J. Russian music education concept and its enlightenment to Chinese music teaching. Arts Stud Crit. 2022;3(1):102–5.Search in Google Scholar
[2] Wolfe HE, Munroe A, Waters HD. Self-examination of music methods teaching in a Reggio Emilia-inspired learning community. J Music Teach Educ. 2021;31(1):54–68.10.1177/10570837211038034Search in Google Scholar
[3] Goshvarpour A, Goshvarpour A. Innovative Poincare’s plot asymmetry descriptors for EEG emotion recognition. Cogn Neurodyn. 2022;8(3):16–21.10.1007/s11571-021-09735-5Search in Google Scholar PubMed PubMed Central
[4] Bentout S, Djilali S, Atangana A. Bifurcation analysis of an age-structured prey-predator model with infection developed in prey. Math Methods Appl Sci. 2022;45(3):1189–208.10.1002/mma.7846Search in Google Scholar
[5] Djilali S, Cattani C. Patterns of a superdiffusive consumer-resource model with hunting cooperation functional response. Chaos Solitons Fractals. 2021;151:111258.10.1016/j.chaos.2021.111258Search in Google Scholar
[6] Bentout S, Djilali S, Kuniya T, Wang JL. Mathematical analysis of a vaccination epidemic model with nonlocal diffusion. Math Methods Appl Sci. 2023;46(9):10970–94.10.1002/mma.9162Search in Google Scholar
[7] Muhlestein MB, Gee KL. A characteristic nonlinear distortion length for broadband Gaussian noise. J Acoust Soc Am. 2023;153(4):2262–70.10.1121/10.0017858Search in Google Scholar PubMed
[8] Biswas D, Lund K, Szocs C. Sounds like a healthy retail atmospheric strategy: Effects of ambient music and background noise on food sales. J Acad Mark Sci. 2019;47(1):37–55.10.1007/s11747-018-0583-8Search in Google Scholar
[9] Yang Q. Cloud music teaching database based on OpenCL design and neural network. Microprocess Microsyst. 2021;82:103897.10.1016/j.micpro.2021.103897Search in Google Scholar
[10] Fu L. Research on the reform and innovation of vocal music teaching in colleges. Reg Educ Res Rev. 2020;2(4):37–40.10.32629/rerr.v2i4.202Search in Google Scholar
[11] Tejada J, Thayer T, Arenas M. In-service music teaching performance of Chilean generalist teachers: A mixed methods exploratory study. Didacticae. 2020;7:30–56.10.1344/did.2020.7.30-56Search in Google Scholar
[12] Parada-Cabaleiro E, Batliner A, Schedl M. An exploratory study on the acoustic musical properties to decrease self-perceived anxiety. Int J Environ Res Public Health. 2022;19(2):1–17.10.3390/ijerph19020994Search in Google Scholar PubMed PubMed Central
[13] Gomez-Canon JS, Cano E, Eerola T, Herrera P, Hu X, Yang YH, et al. Music emotion recognition: Toward new, robust standards in personalized and context-sensitive applications. IEEE Signal Process Mag. 2021;38(6):106–14.10.1109/MSP.2021.3106232Search in Google Scholar
[14] Ghanbarisabagh M, Vetharatnam G, Babak S. Noise removal using HWD implemented by Dmeyer and Kaiser window. Wireless Pers Commun. 2019;108(4):2103–15.10.1007/s11277-019-06511-xSearch in Google Scholar
[15] Horan J. Asymptotics for the second-largest Lyapunov exponent for some Perron-Frobenius operator cocycles. Nonlinearity. 2021;34(4):2563–610.10.1088/1361-6544/abb5deSearch in Google Scholar
[16] Li X, Ding R, Li J. Quantitative comparison of predictabilities of warm and cold events using the backward nonlinear local Lyapunov exponent method. Adv Atmos Sci. 2020;37(9):951–8.10.1007/s00376-020-2100-5Search in Google Scholar
[17] Huang L, Lu Y. A method for calculating the Lyapunov exponent spectrum of DC-DC converter feeding with a switching constant power load. IEEJ Trans Electr Electron Eng. 2020;15(6):1040–7.10.1002/tee.23148Search in Google Scholar
[18] Djilali S, Bentout S, Zeb A. Dynamics of a diffusive delayed viral infection model in a heterogeneous environment. Math Methods Appl Sci. 2023;46(16):16596–624.10.1002/mma.9463Search in Google Scholar
[19] Hsu YL, Wang JS, Chiang WC, Hung CH. Automatic ECG-based emotion recognition in music listening. IEEE Trans Affect Comput. 2020;11(1):85–99.10.1109/TAFFC.2017.2781732Search in Google Scholar
[20] Chi YL, Looi V, Thompson WF, McMahon CM. Beyond audition: Psychosocial benefits of music training for children with hearing loss. Ear Hear. 2021;43(1):128–42.10.1097/AUD.0000000000001083Search in Google Scholar PubMed
[21] Garrido S, Markwell H, Andreallo F, Hatcher D. Developing online training in using music for carers of people with dementia: A focus group study. Australas J Ageing. 2022;41(2):151–8.10.1111/ajag.13029Search in Google Scholar PubMed
[22] Forti S, Colombo B, Clark J, Bonfanti, Molteni M. Soundbeam imitation intervention: Training children with autism to imitate meaningless body gestures through music. Adv Autism. 2020;6(3):227–40.10.1108/AIA-07-2019-0023Search in Google Scholar
[23] Blumenthal A, Yang Y. Positive Lyapunov exponent for random perturbations of predominantly expanding multimodal circle maps. Ann Inst Henri Poincaré C. 2022;39(2):419–55.10.4171/aihpc/11Search in Google Scholar
[24] Bedrossian J, Blumenthal A, Punshon-Smith S. A regularity method for lower bounds on the Lyapunov exponent for stochastic differential equations. Invent Math. 2022;227(2):429–516.10.1007/s00222-021-01069-7Search in Google Scholar
[25] Kielstra PM, Lemm M. On the finite-size Lyapunov exponent for the Schrödinger operator with skew-shift potential. Commun Math Sci. 2020;18(5):1305–14.10.4310/CMS.2020.v18.n5.a6Search in Google Scholar
[26] Chiu CY, Su WY, Yang YH. Drum-aware ensemble architecture for improved joint musical beat and downbeat tracking. IEEE Signal Process Lett. 2021;28(1):1100–4.10.1109/LSP.2021.3084504Search in Google Scholar
[27] Przyczyna D, Szacilowska M, Przybylski M, Strzelecki M, Szacilowski K Recognition of musical dissonance and consonance in a simple neuromorphic computing system. Int J Unconv Comput. 2022;17(2):81–104.Search in Google Scholar
© 2025 the author(s), published by De Gruyter
This work is licensed under the Creative Commons Attribution 4.0 International License.
Articles in the same Issue
- Research Articles
- Generalized (ψ,φ)-contraction to investigate Volterra integral inclusions and fractal fractional PDEs in super-metric space with numerical experiments
- Solitons in ultrasound imaging: Exploring applications and enhancements via the Westervelt equation
- Stochastic improved Simpson for solving nonlinear fractional-order systems using product integration rules
- Exploring dynamical features like bifurcation assessment, sensitivity visualization, and solitary wave solutions of the integrable Akbota equation
- Research on surface defect detection method and optimization of paper-plastic composite bag based on improved combined segmentation algorithm
- Impact the sulphur content in Iraqi crude oil on the mechanical properties and corrosion behaviour of carbon steel in various types of API 5L pipelines and ASTM 106 grade B
- Unravelling quiescent optical solitons: An exploration of the complex Ginzburg–Landau equation with nonlinear chromatic dispersion and self-phase modulation
- Perturbation-iteration approach for fractional-order logistic differential equations
- Variational formulations for the Euler and Navier–Stokes systems in fluid mechanics and related models
- Rotor response to unbalanced load and system performance considering variable bearing profile
- DeepFowl: Disease prediction from chicken excreta images using deep learning
- Channel flow of Ellis fluid due to cilia motion
- A case study of fractional-order varicella virus model to nonlinear dynamics strategy for control and prevalence
- Multi-point estimation weldment recognition and estimation of pose with data-driven robotics design
- Analysis of Hall current and nonuniform heating effects on magneto-convection between vertically aligned plates under the influence of electric and magnetic fields
- A comparative study on residual power series method and differential transform method through the time-fractional telegraph equation
- Insights from the nonlinear Schrödinger–Hirota equation with chromatic dispersion: Dynamics in fiber–optic communication
- Mathematical analysis of Jeffrey ferrofluid on stretching surface with the Darcy–Forchheimer model
- Exploring the interaction between lump, stripe and double-stripe, and periodic wave solutions of the Konopelchenko–Dubrovsky–Kaup–Kupershmidt system
- Computational investigation of tuberculosis and HIV/AIDS co-infection in fuzzy environment
- Signature verification by geometry and image processing
- Theoretical and numerical approach for quantifying sensitivity to system parameters of nonlinear systems
- Chaotic behaviors, stability, and solitary wave propagations of M-fractional LWE equation in magneto-electro-elastic circular rod
- Dynamic analysis and optimization of syphilis spread: Simulations, integrating treatment and public health interventions
- Visco-thermoelastic rectangular plate under uniform loading: A study of deflection
- Threshold dynamics and optimal control of an epidemiological smoking model
- Numerical computational model for an unsteady hybrid nanofluid flow in a porous medium past an MHD rotating sheet
- Regression prediction model of fabric brightness based on light and shadow reconstruction of layered images
- Dynamics and prevention of gemini virus infection in red chili crops studied with generalized fractional operator: Analysis and modeling
- Qualitative analysis on existence and stability of nonlinear fractional dynamic equations on time scales
- Fractional-order super-twisting sliding mode active disturbance rejection control for electro-hydraulic position servo systems
- Analytical exploration and parametric insights into optical solitons in magneto-optic waveguides: Advances in nonlinear dynamics for applied sciences
- Bifurcation dynamics and optical soliton structures in the nonlinear Schrödinger–Bopp–Podolsky system
- User profiling in university libraries by combining multi-perspective clustering algorithm and reader behavior analysis
- Exploring bifurcation and chaos control in a discrete-time Lotka–Volterra model framework for COVID-19 modeling
- Review Article
- Haar wavelet collocation method for existence and numerical solutions of fourth-order integro-differential equations with bounded coefficients
- Special Issue: Nonlinear Analysis and Design of Communication Networks for IoT Applications - Part II
- Silicon-based all-optical wavelength converter for on-chip optical interconnection
- Research on a path-tracking control system of unmanned rollers based on an optimization algorithm and real-time feedback
- Analysis of the sports action recognition model based on the LSTM recurrent neural network
- Industrial robot trajectory error compensation based on enhanced transfer convolutional neural networks
- Research on IoT network performance prediction model of power grid warehouse based on nonlinear GA-BP neural network
- Interactive recommendation of social network communication between cities based on GNN and user preferences
- Application of improved P-BEM in time varying channel prediction in 5G high-speed mobile communication system
- Construction of a BIM smart building collaborative design model combining the Internet of Things
- Optimizing malicious website prediction: An advanced XGBoost-based machine learning model
- Economic operation analysis of the power grid combining communication network and distributed optimization algorithm
- Sports video temporal action detection technology based on an improved MSST algorithm
- Internet of things data security and privacy protection based on improved federated learning
- Enterprise power emission reduction technology based on the LSTM–SVM model
- Construction of multi-style face models based on artistic image generation algorithms
- Research and application of interactive digital twin monitoring system for photovoltaic power station based on global perception
- Special Issue: Decision and Control in Nonlinear Systems - Part II
- Animation video frame prediction based on ConvGRU fine-grained synthesis flow
- Application of GGNN inference propagation model for martial art intensity evaluation
- Benefit evaluation of building energy-saving renovation projects based on BWM weighting method
- Deep neural network application in real-time economic dispatch and frequency control of microgrids
- Real-time force/position control of soft growing robots: A data-driven model predictive approach
- Mechanical product design and manufacturing system based on CNN and server optimization algorithm
- Application of finite element analysis in the formal analysis of ancient architectural plaque section
- Research on territorial spatial planning based on data mining and geographic information visualization
- Fault diagnosis of agricultural sprinkler irrigation machinery equipment based on machine vision
- Closure technology of large span steel truss arch bridge with temporarily fixed edge supports
- Intelligent accounting question-answering robot based on a large language model and knowledge graph
- Analysis of manufacturing and retailer blockchain decision based on resource recyclability
- Flexible manufacturing workshop mechanical processing and product scheduling algorithm based on MES
- Exploration of indoor environment perception and design model based on virtual reality technology
- Tennis automatic ball-picking robot based on image object detection and positioning technology
- A new CNN deep learning model for computer-intelligent color matching
- Design of AR-based general computer technology experiment demonstration platform
- Indoor environment monitoring method based on the fusion of audio recognition and video patrol features
- Health condition prediction method of the computer numerical control machine tool parts by ensembling digital twins and improved LSTM networks
- Establishment of a green degree evaluation model for wall materials based on lifecycle
- Quantitative evaluation of college music teaching pronunciation based on nonlinear feature extraction
- Multi-index nonlinear robust virtual synchronous generator control method for microgrid inverters
- Manufacturing engineering production line scheduling management technology integrating availability constraints and heuristic rules
- Analysis of digital intelligent financial audit system based on improved BiLSTM neural network
- Attention community discovery model applied to complex network information analysis
- A neural collaborative filtering recommendation algorithm based on attention mechanism and contrastive learning
- Rehabilitation training method for motor dysfunction based on video stream matching
- Research on façade design for cold-region buildings based on artificial neural networks and parametric modeling techniques
- Intelligent implementation of muscle strain identification algorithm in Mi health exercise induced waist muscle strain
- Optimization design of urban rainwater and flood drainage system based on SWMM
- Improved GA for construction progress and cost management in construction projects
- Evaluation and prediction of SVM parameters in engineering cost based on random forest hybrid optimization
- Museum intelligent warning system based on wireless data module
- Optimization design and research of mechatronics based on torque motor control algorithm
- Special Issue: Nonlinear Engineering’s significance in Materials Science
- Experimental research on the degradation of chemical industrial wastewater by combined hydrodynamic cavitation based on nonlinear dynamic model
- Study on low-cycle fatigue life of nickel-based superalloy GH4586 at various temperatures
- Some results of solutions to neutral stochastic functional operator-differential equations
- Ultrasonic cavitation did not occur in high-pressure CO2 liquid
- Research on the performance of a novel type of cemented filler material for coal mine opening and filling
- Testing of recycled fine aggregate concrete’s mechanical properties using recycled fine aggregate concrete and research on technology for highway construction
- A modified fuzzy TOPSIS approach for the condition assessment of existing bridges
- Nonlinear structural and vibration analysis of straddle monorail pantograph under random excitations
- Achieving high efficiency and stability in blue OLEDs: Role of wide-gap hosts and emitter interactions
- Construction of teaching quality evaluation model of online dance teaching course based on improved PSO-BPNN
- Enhanced electrical conductivity and electromagnetic shielding properties of multi-component polymer/graphite nanocomposites prepared by solid-state shear milling
- Optimization of thermal characteristics of buried composite phase-change energy storage walls based on nonlinear engineering methods
- A higher-performance big data-based movie recommendation system
- Nonlinear impact of minimum wage on labor employment in China
- Nonlinear comprehensive evaluation method based on information entropy and discrimination optimization
- Application of numerical calculation methods in stability analysis of pile foundation under complex foundation conditions
- Research on the contribution of shale gas development and utilization in Sichuan Province to carbon peak based on the PSA process
- Characteristics of tight oil reservoirs and their impact on seepage flow from a nonlinear engineering perspective
- Nonlinear deformation decomposition and mode identification of plane structures via orthogonal theory
- Numerical simulation of damage mechanism in rock with cracks impacted by self-excited pulsed jet based on SPH-FEM coupling method: The perspective of nonlinear engineering and materials science
- Cross-scale modeling and collaborative optimization of ethanol-catalyzed coupling to produce C4 olefins: Nonlinear modeling and collaborative optimization strategies
- Unequal width T-node stress concentration factor analysis of stiffened rectangular steel pipe concrete
- Special Issue: Advances in Nonlinear Dynamics and Control
- Development of a cognitive blood glucose–insulin control strategy design for a nonlinear diabetic patient model
- Big data-based optimized model of building design in the context of rural revitalization
- Multi-UAV assisted air-to-ground data collection for ground sensors with unknown positions
- Design of urban and rural elderly care public areas integrating person-environment fit theory
- Application of lossless signal transmission technology in piano timbre recognition
- Application of improved GA in optimizing rural tourism routes
- Architectural animation generation system based on AL-GAN algorithm
- Advanced sentiment analysis in online shopping: Implementing LSTM models analyzing E-commerce user sentiments
- Intelligent recommendation algorithm for piano tracks based on the CNN model
- Visualization of large-scale user association feature data based on a nonlinear dimensionality reduction method
- Low-carbon economic optimization of microgrid clusters based on an energy interaction operation strategy
- Optimization effect of video data extraction and search based on Faster-RCNN hybrid model on intelligent information systems
- Construction of image segmentation system combining TC and swarm intelligence algorithm
- Particle swarm optimization and fuzzy C-means clustering algorithm for the adhesive layer defect detection
- Optimization of student learning status by instructional intervention decision-making techniques incorporating reinforcement learning
- Fuzzy model-based stabilization control and state estimation of nonlinear systems
- Optimization of distribution network scheduling based on BA and photovoltaic uncertainty
- Tai Chi movement segmentation and recognition on the grounds of multi-sensor data fusion and the DBSCAN algorithm
- Special Issue: Dynamic Engineering and Control Methods for the Nonlinear Systems - Part III
- Generalized numerical RKM method for solving sixth-order fractional partial differential equations