Optimization design of urban rainwater and flood drainage system based on SWMM
-
Xihan Cao


Abstract
As global climate change and urbanization accelerate, urban rainwater and flood drainage systems are facing increasingly severe challenges. Traditional drainage system design methods are no longer able to meet the complex needs of modern cities. To improve the overall performance of urban rainwater and flood drainage system, a coupling model of multiobjective optimization algorithm and rainstorm management model is constructed. This model has been used for comprehensive optimization of urban rainwater and flood drainage systems. In the comparative analysis of the proposed coupling model, the standard deviation of the total overflow of the nodes was 65 million yuan. Then, the empirical analysis of the urban stormwater drainage system proposed in the study shows that the total discharge of the drainage outlet of the study model is 4428.73 and 1386.49, respectively, with the increase in time in the recurrence period of 2 and 50-year rainfall. In addition, the research model achieved remarkable results in the reduction in peak flow and water depth, increasing the drainage efficiency by 15.7% on average. This research not only provides new theoretical basis and practical guidance for the optimization design of urban rainwater and flood drainage systems, but also has important significance for enhancing the ability of cities to respond to extreme climate events and reducing urban water-logging disasters.
1 Introduction
In the process of urbanization, the urban rainwater and flood drainage is becoming increasingly prominent, especially in the context of high-density population and rapid urbanization [1,2]. The design and operation of urban rainwater and flood drainage systems are crucial for ensuring the normal operation of cities and the quality of life of residents [3]. However, due to factors such as the continuous expansion of urban scale and climate change, traditional urban rainwater and flood drainage systems often find it difficult to cope with the increasing pressure of rainwater and flood [4]. To effectively address urban storm-water drainage issues, a comprehensive and sustainable optimization design method must be adopted. Storm Water Management Model (SWMM) is used to simulate and analyze the urban rainwater and flood discharge [5]. It is widely used in fields such as hydrology, hydrogeology, and environmental engineering to predict and manage rainwater and flood problems in urban areas [6]. In addition, the SWMM can also simulate the drainage performance of urban drainage systems, including pipeline flow rate, pump station operation, sewage treatment, and other aspects [7]. Simulating the performance of drainage systems in different scenarios can provide decision support for urban planning and design, such as optimizing drainage system design, improving the operation and maintenance of drainage facilities, etc. [8]. Based on the SWMM, different design schemes can be simulated and evaluated to select the optimal solution. This study applies the SWMM to the optimization design of urban rainwater and flood drainage systems, aiming to improve the drainage and flood prevention performance of the drainage system, while reducing the construction and maintenance costs of infrastructure. Previous studies have comprehensively considered the multi-dimensional influence of stormwater drainage in the process of urbanization, and combined SWMM model with the optimal design of urban stormwater drainage system. The limitation of the definition lies in that the model may not be able to completely restore the real scene when simulating the stormwater situation under complex terrain and extreme climate conditions, and there are some idealized assumptions. Through the implementation of this research, it is hoped that new ideas and methods can be provided for the optimal design of urban rainwater and flood drainage systems.
2 Related works
Urban storm-water drainage system refers to the facilities and engineering used in the city to collect, transport, and discharge rainwater. Its purpose is to effectively discharge rainwater from the city during rainfall, to prevent problems such as water-logging and flooding and ensure the normal operation and safety of the city. Many experts have conducted relevant research on urban rainwater and flood drainage systems. Mohammadiun et al. proposed a method to explore the impact of bottleneck blockage on the resilience of urban rainwater drainage systems. Empirical analysis showed that bottleneck blockage had a significant impact on the resilience of urban rainwater drainage systems [9]. Hussain et al. built a SWMM simulation method to explore the impact of land use and climate change on the performance of rainwater drainage systems. The research results indicated that these two had a significant impact on the performance of rainwater drainage systems. With the process of urbanization, the increase in impermeable area results in an increase in runoff coefficient and an increased burden on drainage systems [10]. Shepley et al. proposed an evaluation method for the impact of the interaction between farmland drainage systems and groundwater on urban karst. The research results indicated that the interaction between agricultural drainage systems and groundwater had a significant impact on the formation and development of urban karst. Adopting this research method could effectively implement soil and water conservation measures, increase surface vegetation coverage, reduce soil erosion, and thus reduce negative impacts on groundwater [11]. Saata et al. conducted in-depth research on the impact of the interaction between agricultural drainage systems and groundwater on sediment in rainwater drainage systems. The agricultural drainage system indirectly affected the sediment in the rainwater drainage system by affecting the quality and flow of groundwater. These sediments could serve as adsorbents for organic pollutants in the natural environment, separating pollutants from water and reducing water pollution [12].
The SWMM can simulate and predict various rainwater runoff management measures. Its effectiveness and benefits in practical environments provide scientific basis for decision-makers. Some domestic and foreign researchers have made outstanding achievements in the SWMM. Jin-Mei et al. proposed a rainfall control scheme for urban roads in spillway ground on the SWMM for urban rainwater and flood drainage systems. The research results indicated that the SWMM could accurately simulate the operation of urban rainwater and flood drainage systems, providing a reliable tool for optimizing design. The accuracy and reliability of the model were verified through comparison and analysis with actual data [13]. Arjenaki et al. developed a SWMM-based low impact development (LID) modeling method for the design and impact of urban runoff collection networks. The SWMM could accurately simulate the operation of urban runoff collection networks, providing a reliable tool for optimizing design. Through parameter settings and model construction, the problems and challenges of the system were identified [14]. For the evaluation of urban permeable surface infiltration methods, Parnas et al. combined SWMM and the hydrological rainfall-runoff model for evaluation. The research results indicated that the SWMM could accurately simulate urban surface runoff and infiltration processes, providing strong support for the evaluation of permeable surface infiltration methods. Through parameter settings and model construction, the effects were compared. Meanwhile, combined with the hydrological rainfall-runoff model, the advantages and disadvantages of different infiltration methods were evaluated and compared [15]. Randall et al. used the SWMM to simulate and compare on-site observations on the evaporation and flow issues of lined permeable pavement. Comparing the simulation results of the SWMM with on-site observations, the model could accurately simulate the evaporation and flow processes of the lined permeable pavement [16].
In summary, numerous domestic and foreign scholars have conducted extensive research and analysis on the optimization of urban rainwater and flood drainage systems based on the SWMM. There have been significant breakthroughs in the improvement and application of the SWMM. In this study, based on the SWMM, the urban rainwater and flood drainage system has been optimized, which has strong potential application value.
3 Optimal design of urban rainwater and flood drainage system based on SWMM
3.1 Construction of urban drainage system based on SWMM
SWMM is a dynamic precipitation runoff simulation model primarily applied to simulate a single precipitation event or long-term water quantity and quality simulation in a city. This model can simulate runoff, water quality, hydrology, and hydraulic conditions, track and simulate the water quality and quantity of runoff, as well as the flow rate, depth, and quality of water in each pipeline and river. Figure 1 displays the schematic diagram of the SWMM.
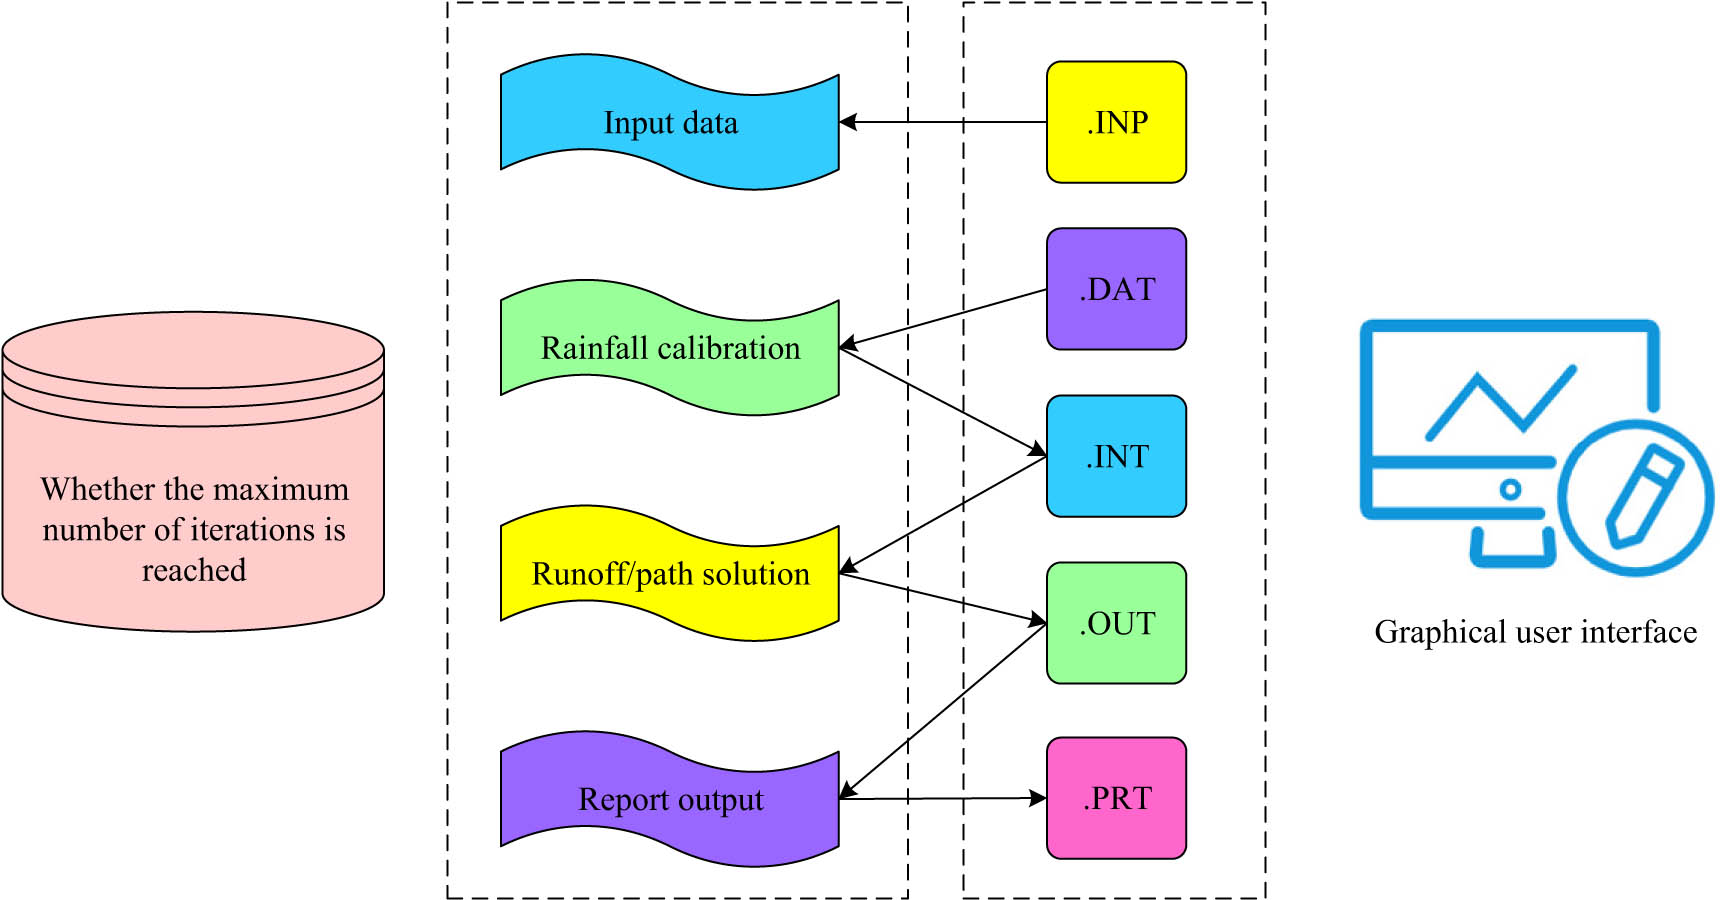
Schematic diagram of SWMM.
The infiltration model is an important component of the SWMM, used to calculate the water infiltration from the surface into the soil after rainfall [17]. In the SWMM, three infiltration models are available for selection: Horton model, Green-Ampt model, and SCS-CN model [18]. The Horton model is an empirical formula ground on rich soil infiltration experimental data, which is suitable for describing the changes in infiltration rate during long-term rainfall processes [19]. This model assumes that the infiltration rate decreases exponentially over time until it reaches the minimum. The infiltration rate is shown in Eq. (1).
where
where
where
where
where
where
where
Characteristics and application range of SWMM infiltration and surface convergence modules
| Module name | Calculation method | Method characteristics | Scope of application |
|---|---|---|---|
| Infiltration module | Horton equation | Assume that rainfall intensity is always greater than infiltration rate; infiltration rate changes with time. Soil storage capacity is not considered | It is suitable for small watershed and has few parameters to be determined |
| Green-Ampt equation | The soil layer contains a rapidly changing dry and wet interface. Soil saturation and unsaturated infiltration were calculated separately. Infiltration varies with time | The requirements of soil parameters are high, but the parameters to be determined are few | |
| SCS-CN method | The CN of the underlying surface is different. The effect of initial water content on the flow-producing process is considered | It is suitable for calculation of large river basin and heavy rainstorm intensity | |
| Surface convergence module | Nonlinear reservoir method | Assume that each sub catchment area is a rectangle of width W: there is a physical conceptual basis | The parameters are easy to determine and the calculation results are of high precision |
In the SWMM, the research area is first divided to multiple sub catchment areas. After dividing sub catchment areas, the topology structure of the pipeline is constructed. By establishing the topology structure of the pipeline, the runoff direction and flow distribution of each sub catchment area can be clarified. Finally, based on the topology of the pipeline, the runoff from each sub catchment area is allocated to the nearest inspection wells.
3.2 Improved multiobjective optimization algorithm coupled with SWMM
In the SWMM drainage model, the cost and hydraulic performance of the pipeline network need to be considered simultaneously, which are two interrelated but mutually restrictive goals. Therefore, the study selects pipeline diameter and pipeline slope as optimization variables to construct a Multiobjective Optimization Problem (MOP) model. It is composed of multiple conflicting objectives. These goals are often not optimal simultaneously. Therefore, a balanced approach is applied to address these objectives [25]. The mathematical expression for MOP is shown in Eq. (8).
where

Pareto optimal solution diagram.
The Pareto optimal solution set is displayed in Eq. (9).
where
where
where
The flow chart of improved multiobjective optimization algorithm coupled with rainstorm management model.
From Figure 3, after generating the initial population, for each individual, the study extracts relevant information by running SWMM simulations. This study focuses on parameters such as node burial depth and pipeline diameter, which are used to calculate pipeline costs. At the same time, the overload time of each node is extracted to determine the overall overload time. In addition, data such as node overflow and burial depth are extracted to evaluate constraint conditions. Finally, it is evaluated based on the individual’s objective function and constraints.
3.3 Optimization design of urban rainwater and flood drainage system based on coupling model
LID is a storm water management technique that controls storm water runoff and pollution through decentralized and small-scale source control, bringing development closer to natural hydrological cycles. Cost investment is an important consideration when choosing the scale of LID measures. Therefore, when formulating the LID deployment plan, various factors should be comprehensively considered, including technical feasibility, environmental impact, economic benefits, etc., to determine the optimal scale and configuration. Concave green space is a LID technology that utilizes open spaces to receive and store rainwater [26,27]. This green space utilizes open spaces, such as green spaces and roads, to naturally infiltrate rainwater and reduce runoff discharge. The cost of concave green space is as shown in Eq. (12).
where
where

Semi-permeable pavement structure diagram.
Semi-permeable pavement lays a layer of impermeable material on top of permeable material, allowing rainwater to partially penetrate underground and partially flow toward drainage pipes, which is suitable for areas with poor drainage. The cost of penetration pavement is shown in Eq. (14).
where
where
where

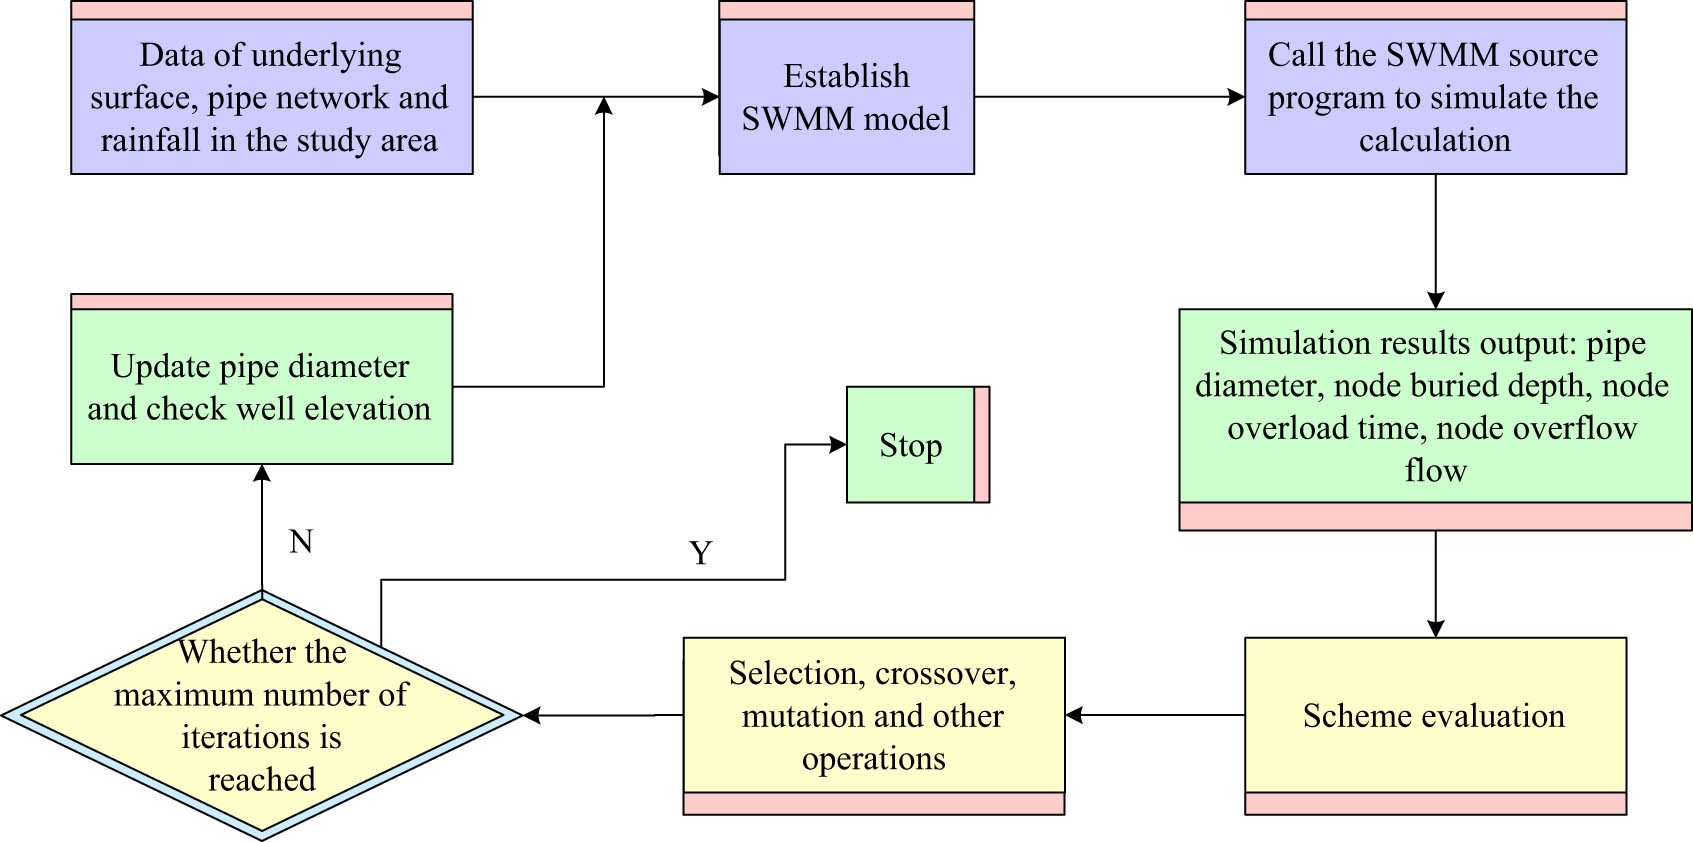
Flowchart of urban rainwater drainage system based on coupled model.
In Figure 5, the system flow of this study takes the following steps: First, the initial population is generated to cover the possible solution space, while avoiding premature convergence to the local optimal solution. Each individual is then simulated by SWMM, which accurately reflects the effects of stormwater management measures in different sub catchments, thus extracting the specific area of various types of green infrastructure under each scenario. After obtaining the simulation results, the study further calculated the implementation cost of each scheme and extracted the corresponding total runoff. Then, the scheme was evaluated according to two objective functions: total runoff and cost. Next through genetic operations such as selection, crossover, and variation, new populations are generated to simulate mechanisms such as natural selection, gene recombination, and gene mutation in the process of biological evolution, so that new populations can introduce new variations and diversity on the basis of retaining the original good genes. Finally, the process repeats until a preset number of iterations is reached.
4 Analysis of optimal design results based on the SWMM
4.1 Optimization result comparative analysis of the coupled model
The runoff coefficient reflects the surface runoff generated and the design, construction, and operation status of urban drainage systems. Point total overflow refers to the amount of water that overflows at a node under certain rainfall conditions. If the total overflow is large, it indicates that the drainage capacity is insufficient. It is necessary to increase drainage facilities or strengthen the maintenance and repair of pipeline networks, which also increases the total cost of infrastructure. The relationship between the runoff coefficient, total node overflow, and total cost of infrastructure of the research model is shown in Figure 6.

Relationship between runoff coefficient, total node overflow, and total cost of infrastructure. (a) Simulated runoff coefficient and (b) Q–E curve.
Figure 6(a) shows the simulated runoff coefficient of the research scheme. According to Figure 6(a), when the total cost of infrastructure increased, the cost of runoff coefficient was lower. The results indicate that while increasing infrastructure investment, the cost of runoff coefficient is effectively controlled. Figure 6(b) displays the runoff coefficient of the research scheme. In Figure 6 (b), when the total cost of infrastructure increased, the cost of total node overflow was lower. In the infrastructure construction, reasonable planning and design can reduce the cost of runoff coefficient, thereby achieving more efficient water resource management and utilization. The total cost of the designed infrastructure and the standard deviation of the total overflow of nodes vary with the number of iterations, as shown in Figure 7.
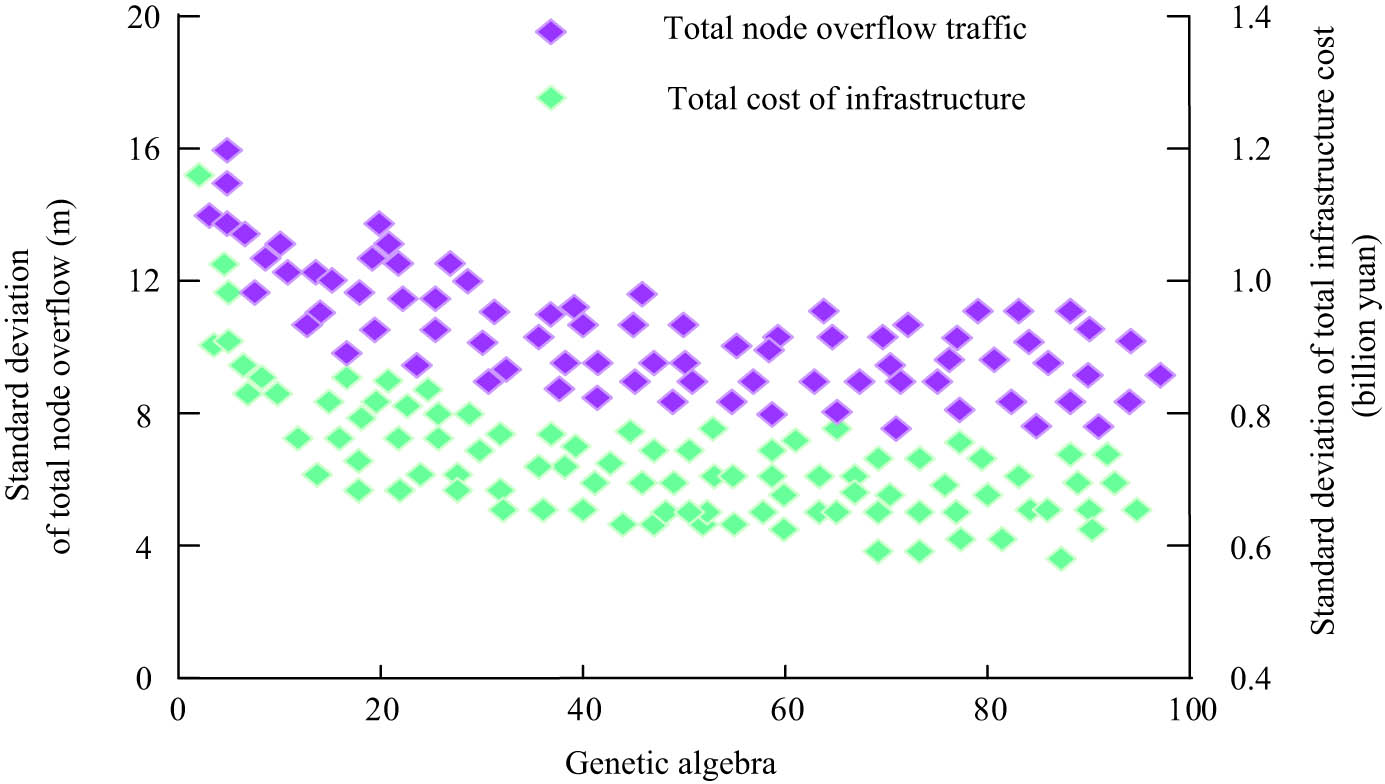
The total cost of the infrastructure and the standard deviation of the total node overflow with the number of iterations.
From Figure 7, the standard deviation of the total overflow of nodes in this research scheme tended to stabilize when the genetic algebra was 20, which was 3.58 m3. The total infrastructure cost in this research plan tended to stabilize when the genetic algebra was 30. The standard deviation of the total node overflow at this time was 65 million yuan. These data indicate that genetic algebra exerts a crucial function in the convergence and stability of scheme optimization. The objective function varies with the number of iterations, as shown in Figure 8.
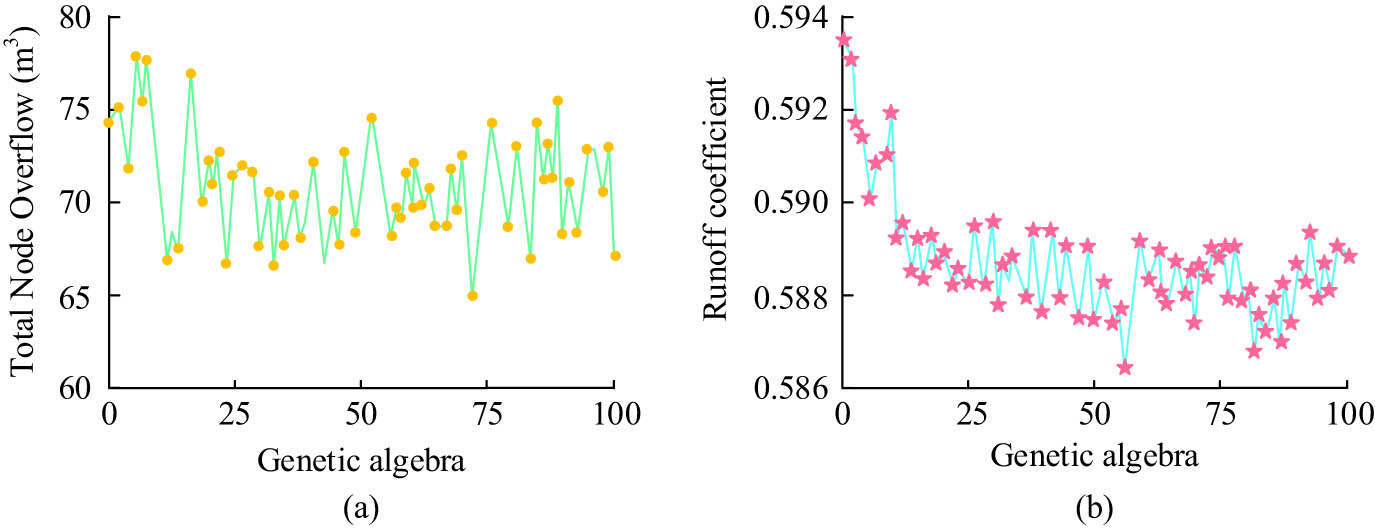
The objective function changes with the number of iterations. (a) Study of the total cost of infrastructure for the total overflow of scheme cost and (b) runoff coefficient diagram of the study scheme.
Figure 8(a) shows the total infrastructure cost of node total overflow. In Figure 8(a), with the increase in genetic algebra, the total infrastructure cost of node total overflow showed a downward trend, ultimately reducing by 68 million yuan. This optimization effect is mainly attributed to the effective control of the total amount of water-logging by the plan. Figure 8(b) displays the runoff coefficient of the research scheme. From Figure 8(b), with the increase in genetic algebra, the runoff coefficient showed a gradually decreasing trend, ultimately decreasing by 0.008. This significant change further confirms the effectiveness of the research plan in reducing runoff coefficient and optimizing rainwater discharge.
4.2 Empirical analysis of new urban rainwater and flood drainage system
To verify the stability of the research model, the rainfall event in August 2021 in District A of a certain city is selected for validation. The Nash Coefficient (ENS) is selected as the evaluation index to simulate the load of outlet flow. The ENS coefficient is an important indicator for evaluating model performance. A large value usually means that the model has higher optimization during the simulation process. More accurate predictions are guaranteed. The load simulation results of outlet flow are shown in Figure 9.

Load simulation diagram of outlet flow.
In Figure 9, with the increase in time, the actual rainfall curve of District A in August 2021 showed two peaks. The simulated curve in this study closely matched the load of the actual outlet flow, without significant deviation. This result not only validates the effectiveness of the model, but also highlights its accuracy in traffic simulation. In addition, the ENS coefficient value of the model was greater than 0.7, indicating a higher model optimization. To verify the superiority of the research plan in the application of actual urban storm water drainage, comparative hydrological simulation experiments are conducted between the coupling model and traditional urban rainwater and flood drainage models such as InfoWorks CS model and SUSTAIN model. The experiment is conducted during the rainfall recurrence period of 2 years and 50 years. The total discharge of different models is compared, as shown in Figure 10.

Comparison diagram of total discharge flow process for different models. (a) P = 2a and (b) P = 50a.
Figure 10(a) shows the total discharge flow process of different models during the 2-year recurrence period of rainfall. According to Figure 10(a), the total discharge flow was 4428.73. Figure 10(b) shows the total discharge flow process of different models during the 50-year recurrence period of rainfall. According to Figure 10(b), the total discharge flow was 1386.49. Under these two conditions, comparative experiments are conducted on the main indicators of pollutants at the road outlet, including Suspended Solids (SS), Chemical Oxygen Demand (COD), Total Nitrogen (TN), and Total Phosphorus (TP). The pollution load reduction rates for different recurrence periods of each model are shown in Figure 11.
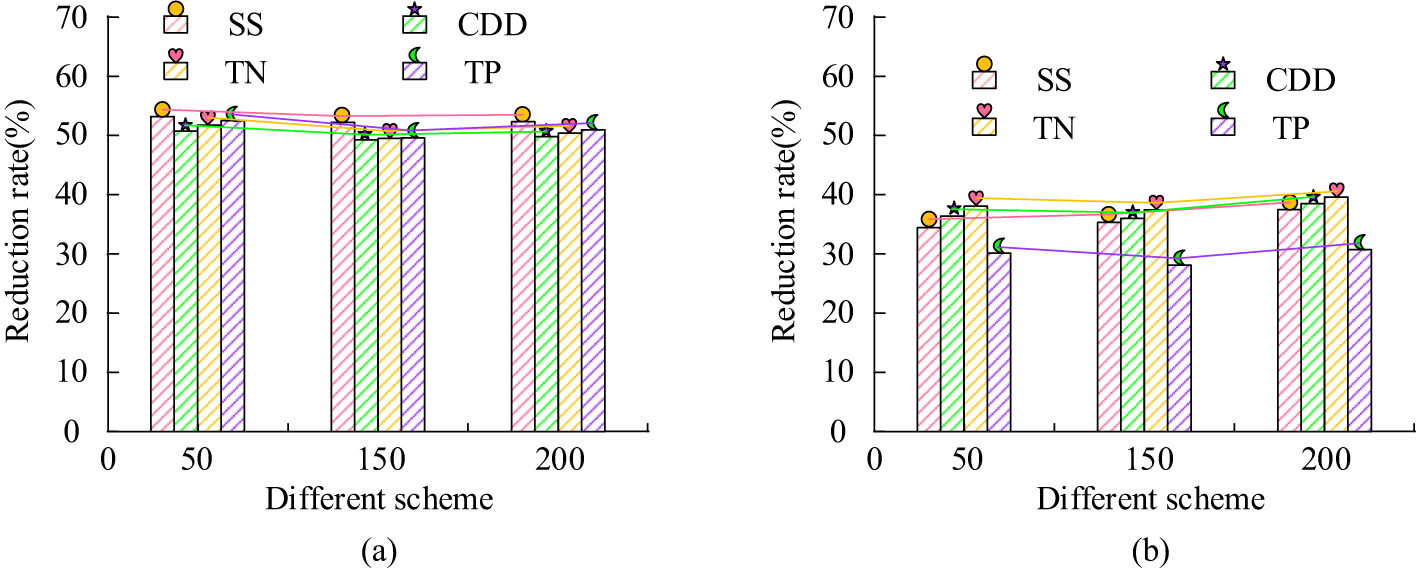
Comparison of pollution load reduction rates of different models in different recurrence periods. (a) P = 2a and (b) P = 50a.
Figure 11(a) shows the pollution load reduction rate during a 2-year recurrence period of rainfall. In Figure 11(a), the research model achieved significant reductions in SS, COD, TN, and TP loads. Among them, the reduction rate of SS load was relatively high, while the reduction rates of COD and TN load were also relatively stable. The reduction rate of TP load fluctuated, but overall it also showed a clear downward trend. Figure 11(b) shows the pollution load reduction rate during a 50-year recurrence period of rainfall. According to Figure 11(b), the SS, COD, TN, and TP loads of the research model all decreased. In terms of SS load, the reduction range of the study model was between 38.2 and 51.9%. In terms of COD load, the proportion of reduction ranges from 39.8 to 50.8%. For TN loads, the reduction rate ranged from 37.0 to 50.1%. In terms of TP load, the reduction was between 35.2 and 50.3%. This indicates that the research model has different effects on reducing pollution loads when dealing with different rainfall recurrence periods, but overall, they have achieved significant reductions.
5 Conclusion
Aiming at the frequent water-logging and poor drainage faced by urban rainwater and flood drainage systems, the SWMM was used to optimize the urban rainwater and flood drainage system. From the research results, the standard deviation of the total overflow rate of the research scheme tended to stabilize at a genetic algebra of 20, with a value of 3.58 m³. The standard deviation of the total cost of infrastructure tended to stabilize at a genetic algebra of 30, which was 65 million yuan. This indicated that genetic algebra had a significant impact on the convergence and stability of the optimization scheme. In the empirical analysis of the new urban rainwater and flood drainage system, the simulated curve closely matched the load of the actual outlet flow, without significant deviation. This result verified its effectiveness and accuracy. During the 2-year recurrence period of rain, the total discharge flow of the study model was 4428.73. Meanwhile, SS, COD, TN, and TP loads decreased by 51.8, 51.3, 50.2, and 51.1%, respectively. During the 50-year recurrence period of rainfall, the SS, COD, TN, and TP loads decreased by 51.9, 50.8, 50.1, and 50.3%, respectively. These data fully demonstrate the significant effect of this research plan in reducing pollutant loads. The limitation of this study is that the research area is still in the planning stage, and there is a lack of measured data to carefully calibrate and verify the model parameters. Therefore, further research needs to strengthen cooperation and communication with experts and practical operators in relevant fields to obtain more practical experience and feedback, and continuously optimize the model.
-
Funding information: Author states no funding involved.
-
Author contributions: Xihan Cao: conceptualization, data curation, formal analysis, investigation, methodology, project administration, resources, software, supervision, validation, visualization, writing – original draft, and writing – review and editing. Author has accepted responsibility for the entire content of this manuscript and approved its submission.
-
Conflict of interest: Author states no conflict of interest.
-
Data availability statement: All data generated or analyzed during this study are included in this published article.
References
[1] Hall NC, Sikaroodi M, Hogan D. The presence of denitrifiers in bacterial communities of urban stormwater best management practices (BMPs). Environ Manage. 2022;69(1):89–110.10.1007/s00267-021-01529-zSearch in Google Scholar PubMed PubMed Central
[2] Li J. Research on the construction and development of ecological city in yiyang high-tech zone under the background of smart city. Adv Ind Eng Manag. 2022;11(1):51–3.Search in Google Scholar
[3] Wang J, Cao SJ, Yu CW. Development trend and challenges of sustainable urban design in the digital age. Indoor Built Environ. 2021;30(1):3–6.10.1177/1420326X20976058Search in Google Scholar
[4] Razaq A, Hayat T, Khan SA, Momani S. ATSS model based upon applications of Cattaneo-Christov thermal analysis for entropy optimized ternary nanomaterial flow with homogeneous-heterogeneous chemical reactions. Alex Eng J. 2023;79:390–401.10.1016/j.aej.2023.08.013Search in Google Scholar
[5] Khan SA, Razaq A, Alsaedi A, Hayat T. Modified thermal and solutal fluxes through convective flow of Reiner-Rivlin material. Energy. 2023;283(15):128516.10.1016/j.energy.2023.128516Search in Google Scholar
[6] Sufiyan I, Alkali M, Sagir IM. 3D modeling and assessment of flood risk zones using GIS and remote sensing in catchment area Terengganu, Malaysia. Malays. J Geosci. 2022;6(2):97–100.10.26480/mjg.02.2022.97.100Search in Google Scholar
[7] Khan SA, Hayat T, Alsaedi A. KHA model comprising MoS4 and CoFe2O3 in engine oil invoking non-similar Darcy–Forchheimer flow with entropy and Cattaneo–Christov heat flux. Nanoscale Adv. 2023;5(22):6135–47.10.1039/D3NA00441DSearch in Google Scholar PubMed PubMed Central
[8] Chen Z, Jin W, Yin H. Performance evaluation on the pollution control against wet weather overflow based on on-site coagulation/flocculation in terminal drainage pipes. Front Environ Sci Eng. 2021;15(6):201–10.10.1007/s11783-021-1400-zSearch in Google Scholar
[9] Mohammadiun S, Yazdi J, Hager J. Effects of bottleneck blockage on the resilience of an urban stormwater drainage system. Hydrol Sci J. 2020;65(2):281–95.10.1080/02626667.2019.1690657Search in Google Scholar
[10] Hussain SN, Zwain HM, Nile BK. Modeling the effects of land-use and climate change on the performance of stormwater sewer system using SWMM simulation: case study. J Water Clim Change. 2022;13(1):125–38.10.2166/wcc.2021.180Search in Google Scholar
[11] Shepley MG, Schmidt N, Senior MJ. Assessing “Urban Karst” effects from groundwater–storm sewer system interaction in a till aquitard. Ground Water. 2020;58(2):269–77.10.1111/gwat.12908Search in Google Scholar PubMed
[12] Saata A, Bk U, Muszyńska J. Sediments from storm water drainage system as sorbents of organic pollutants. Desalin Water Treat. 2020;199:179–87.10.5004/dwt.2020.26193Search in Google Scholar
[13] Jin-Mei H, Pei D, Li-Jun P. Research on spillway urban road rainfall control scheme based on SWMM model [in Chinese]. China Rural Water Hydropower. 2020;8:29–33.Search in Google Scholar
[14] Arjenaki MO, Sanayei HRZ, Heidarzadeh H. Modeling and investigating the effect of the LID methods on collection network of urban runoff using the SWMM model (case study: Shahrekord City). Model Earth Syst Environ. 2021;7(1):1–16.10.1007/s40808-020-00870-2Search in Google Scholar
[15] Parnas FEA, Abdalla EMH, Muthanna TM. Evaluating three commonly used infiltration methods for permeable surfaces in urban areas using the SWMM and STORM. Hydrol Res. 2021;52(1):160–75.10.2166/nh.2021.048Search in Google Scholar
[16] Randall M, Støvring J, Henrichs M. Comparison of SWMM evaporation and discharge to in-field observations from lined permeable pavements. Urban Water J. 2020;17(6):491–502.10.1080/1573062X.2020.1776737Search in Google Scholar
[17] Khanaum MM, Borhan MS. Evaluating model effectiveness for soil infiltration attribute: comparison of Green-Ampt, Horton and modified Green-Ampt infiltration models. J Earth Sci Environ Prot. 2023;11(2):57–68.10.4236/gep.2023.112005Search in Google Scholar
[18] Kushige H, Amano Y, Yagi H. Injectable extracellular matrix hydrogels contribute to native cell infiltration in a rat partial nephrectomy model. J Biomed Mater Res B Appl Biomater. 2023;111(1):184–93.10.1002/jbm.b.35144Search in Google Scholar PubMed
[19] Zhu M, Tianyi XU, Zhang H. Characterization of prognosis and immune infiltration by a novel glutamine metabolism-related model in cutaneous melanoma. Biol Cell. 2023;47(9):1931–45.10.32604/biocell.2023.028968Search in Google Scholar
[20] Li S, Cui P, Cheng P. Modified Green–Ampt Model considering vegetation root effect and redistribution characteristics for slope stability analysis. Water Resour Manag. 2022;36(7):2395–410.10.1007/s11269-022-03149-6Search in Google Scholar
[21] Verma RK, Verma S, Mishra SK. SCS-CN-based improved models for direct surface runoff estimation from large rainfall events. Water Resour Manag. 2021;35(7):2149–75.10.1007/s11269-021-02831-5Search in Google Scholar
[22] Chabokpour J, Azamathulla HM. Numerical simulation of pollution transport and hydrodynamic characteristics through the river confluence using FLOW 3D. Water Supply. 2022;22(10):7821–32.10.2166/ws.2022.237Search in Google Scholar
[23] Shi ZR, Ai CF, Jin S. 3D numerical simulation of curved open channel confluence flow with partially non-submerged rigid vegetation. J Hydrodyn. 2021;33(5):992–1006.10.1007/s42241-021-0088-7Search in Google Scholar
[24] Moody AH, Lerch RN, Goyne KW. Vegetative buffer strips show limited effectiveness for reducing antibiotic transport in surface runoff. J Environ Qual. 2023;52(1):137–48.10.1002/jeq2.20441Search in Google Scholar PubMed
[25] Gadhi NA, Rahou FZ. Sufficient optimality conditions and Mond-Weir duality results for a fractional multiobjective optimization problem. J Ind Manag Optim. 2023;19(2):1001–14.10.3934/jimo.2021216Search in Google Scholar
[26] Cao H, Wu Y, Bao Y, Feng X, Wan S, Qian C. UTrans-net: a model for short-term precipitation prediction. Artif Intell Appl. 2023;1(2):106–13.10.47852/bonviewAIA2202337Search in Google Scholar
[27] Zhang X Characteristics and impacts of extreme precipitation under climate change: based on CNKI literature investigation. Earth Sci Malays. 2022;6(2):112–3.10.26480/esmy.02.2022.112.113Search in Google Scholar
© 2025 the author(s), published by De Gruyter
This work is licensed under the Creative Commons Attribution 4.0 International License.
Articles in the same Issue
- Research Articles
- Generalized (ψ,φ)-contraction to investigate Volterra integral inclusions and fractal fractional PDEs in super-metric space with numerical experiments
- Solitons in ultrasound imaging: Exploring applications and enhancements via the Westervelt equation
- Stochastic improved Simpson for solving nonlinear fractional-order systems using product integration rules
- Exploring dynamical features like bifurcation assessment, sensitivity visualization, and solitary wave solutions of the integrable Akbota equation
- Research on surface defect detection method and optimization of paper-plastic composite bag based on improved combined segmentation algorithm
- Impact the sulphur content in Iraqi crude oil on the mechanical properties and corrosion behaviour of carbon steel in various types of API 5L pipelines and ASTM 106 grade B
- Unravelling quiescent optical solitons: An exploration of the complex Ginzburg–Landau equation with nonlinear chromatic dispersion and self-phase modulation
- Perturbation-iteration approach for fractional-order logistic differential equations
- Variational formulations for the Euler and Navier–Stokes systems in fluid mechanics and related models
- Rotor response to unbalanced load and system performance considering variable bearing profile
- DeepFowl: Disease prediction from chicken excreta images using deep learning
- Channel flow of Ellis fluid due to cilia motion
- A case study of fractional-order varicella virus model to nonlinear dynamics strategy for control and prevalence
- Multi-point estimation weldment recognition and estimation of pose with data-driven robotics design
- Analysis of Hall current and nonuniform heating effects on magneto-convection between vertically aligned plates under the influence of electric and magnetic fields
- A comparative study on residual power series method and differential transform method through the time-fractional telegraph equation
- Insights from the nonlinear Schrödinger–Hirota equation with chromatic dispersion: Dynamics in fiber–optic communication
- Mathematical analysis of Jeffrey ferrofluid on stretching surface with the Darcy–Forchheimer model
- Exploring the interaction between lump, stripe and double-stripe, and periodic wave solutions of the Konopelchenko–Dubrovsky–Kaup–Kupershmidt system
- Computational investigation of tuberculosis and HIV/AIDS co-infection in fuzzy environment
- Signature verification by geometry and image processing
- Theoretical and numerical approach for quantifying sensitivity to system parameters of nonlinear systems
- Chaotic behaviors, stability, and solitary wave propagations of M-fractional LWE equation in magneto-electro-elastic circular rod
- Dynamic analysis and optimization of syphilis spread: Simulations, integrating treatment and public health interventions
- Visco-thermoelastic rectangular plate under uniform loading: A study of deflection
- Threshold dynamics and optimal control of an epidemiological smoking model
- Numerical computational model for an unsteady hybrid nanofluid flow in a porous medium past an MHD rotating sheet
- Regression prediction model of fabric brightness based on light and shadow reconstruction of layered images
- Dynamics and prevention of gemini virus infection in red chili crops studied with generalized fractional operator: Analysis and modeling
- Qualitative analysis on existence and stability of nonlinear fractional dynamic equations on time scales
- Fractional-order super-twisting sliding mode active disturbance rejection control for electro-hydraulic position servo systems
- Analytical exploration and parametric insights into optical solitons in magneto-optic waveguides: Advances in nonlinear dynamics for applied sciences
- Bifurcation dynamics and optical soliton structures in the nonlinear Schrödinger–Bopp–Podolsky system
- User profiling in university libraries by combining multi-perspective clustering algorithm and reader behavior analysis
- Exploring bifurcation and chaos control in a discrete-time Lotka–Volterra model framework for COVID-19 modeling
- Review Article
- Haar wavelet collocation method for existence and numerical solutions of fourth-order integro-differential equations with bounded coefficients
- Special Issue: Nonlinear Analysis and Design of Communication Networks for IoT Applications - Part II
- Silicon-based all-optical wavelength converter for on-chip optical interconnection
- Research on a path-tracking control system of unmanned rollers based on an optimization algorithm and real-time feedback
- Analysis of the sports action recognition model based on the LSTM recurrent neural network
- Industrial robot trajectory error compensation based on enhanced transfer convolutional neural networks
- Research on IoT network performance prediction model of power grid warehouse based on nonlinear GA-BP neural network
- Interactive recommendation of social network communication between cities based on GNN and user preferences
- Application of improved P-BEM in time varying channel prediction in 5G high-speed mobile communication system
- Construction of a BIM smart building collaborative design model combining the Internet of Things
- Optimizing malicious website prediction: An advanced XGBoost-based machine learning model
- Economic operation analysis of the power grid combining communication network and distributed optimization algorithm
- Sports video temporal action detection technology based on an improved MSST algorithm
- Internet of things data security and privacy protection based on improved federated learning
- Enterprise power emission reduction technology based on the LSTM–SVM model
- Construction of multi-style face models based on artistic image generation algorithms
- Research and application of interactive digital twin monitoring system for photovoltaic power station based on global perception
- Special Issue: Decision and Control in Nonlinear Systems - Part II
- Animation video frame prediction based on ConvGRU fine-grained synthesis flow
- Application of GGNN inference propagation model for martial art intensity evaluation
- Benefit evaluation of building energy-saving renovation projects based on BWM weighting method
- Deep neural network application in real-time economic dispatch and frequency control of microgrids
- Real-time force/position control of soft growing robots: A data-driven model predictive approach
- Mechanical product design and manufacturing system based on CNN and server optimization algorithm
- Application of finite element analysis in the formal analysis of ancient architectural plaque section
- Research on territorial spatial planning based on data mining and geographic information visualization
- Fault diagnosis of agricultural sprinkler irrigation machinery equipment based on machine vision
- Closure technology of large span steel truss arch bridge with temporarily fixed edge supports
- Intelligent accounting question-answering robot based on a large language model and knowledge graph
- Analysis of manufacturing and retailer blockchain decision based on resource recyclability
- Flexible manufacturing workshop mechanical processing and product scheduling algorithm based on MES
- Exploration of indoor environment perception and design model based on virtual reality technology
- Tennis automatic ball-picking robot based on image object detection and positioning technology
- A new CNN deep learning model for computer-intelligent color matching
- Design of AR-based general computer technology experiment demonstration platform
- Indoor environment monitoring method based on the fusion of audio recognition and video patrol features
- Health condition prediction method of the computer numerical control machine tool parts by ensembling digital twins and improved LSTM networks
- Establishment of a green degree evaluation model for wall materials based on lifecycle
- Quantitative evaluation of college music teaching pronunciation based on nonlinear feature extraction
- Multi-index nonlinear robust virtual synchronous generator control method for microgrid inverters
- Manufacturing engineering production line scheduling management technology integrating availability constraints and heuristic rules
- Analysis of digital intelligent financial audit system based on improved BiLSTM neural network
- Attention community discovery model applied to complex network information analysis
- A neural collaborative filtering recommendation algorithm based on attention mechanism and contrastive learning
- Rehabilitation training method for motor dysfunction based on video stream matching
- Research on façade design for cold-region buildings based on artificial neural networks and parametric modeling techniques
- Intelligent implementation of muscle strain identification algorithm in Mi health exercise induced waist muscle strain
- Optimization design of urban rainwater and flood drainage system based on SWMM
- Improved GA for construction progress and cost management in construction projects
- Evaluation and prediction of SVM parameters in engineering cost based on random forest hybrid optimization
- Museum intelligent warning system based on wireless data module
- Optimization design and research of mechatronics based on torque motor control algorithm
- Special Issue: Nonlinear Engineering’s significance in Materials Science
- Experimental research on the degradation of chemical industrial wastewater by combined hydrodynamic cavitation based on nonlinear dynamic model
- Study on low-cycle fatigue life of nickel-based superalloy GH4586 at various temperatures
- Some results of solutions to neutral stochastic functional operator-differential equations
- Ultrasonic cavitation did not occur in high-pressure CO2 liquid
- Research on the performance of a novel type of cemented filler material for coal mine opening and filling
- Testing of recycled fine aggregate concrete’s mechanical properties using recycled fine aggregate concrete and research on technology for highway construction
- A modified fuzzy TOPSIS approach for the condition assessment of existing bridges
- Nonlinear structural and vibration analysis of straddle monorail pantograph under random excitations
- Achieving high efficiency and stability in blue OLEDs: Role of wide-gap hosts and emitter interactions
- Construction of teaching quality evaluation model of online dance teaching course based on improved PSO-BPNN
- Enhanced electrical conductivity and electromagnetic shielding properties of multi-component polymer/graphite nanocomposites prepared by solid-state shear milling
- Optimization of thermal characteristics of buried composite phase-change energy storage walls based on nonlinear engineering methods
- A higher-performance big data-based movie recommendation system
- Nonlinear impact of minimum wage on labor employment in China
- Nonlinear comprehensive evaluation method based on information entropy and discrimination optimization
- Application of numerical calculation methods in stability analysis of pile foundation under complex foundation conditions
- Research on the contribution of shale gas development and utilization in Sichuan Province to carbon peak based on the PSA process
- Characteristics of tight oil reservoirs and their impact on seepage flow from a nonlinear engineering perspective
- Nonlinear deformation decomposition and mode identification of plane structures via orthogonal theory
- Numerical simulation of damage mechanism in rock with cracks impacted by self-excited pulsed jet based on SPH-FEM coupling method: The perspective of nonlinear engineering and materials science
- Cross-scale modeling and collaborative optimization of ethanol-catalyzed coupling to produce C4 olefins: Nonlinear modeling and collaborative optimization strategies
- Unequal width T-node stress concentration factor analysis of stiffened rectangular steel pipe concrete
- Special Issue: Advances in Nonlinear Dynamics and Control
- Development of a cognitive blood glucose–insulin control strategy design for a nonlinear diabetic patient model
- Big data-based optimized model of building design in the context of rural revitalization
- Multi-UAV assisted air-to-ground data collection for ground sensors with unknown positions
- Design of urban and rural elderly care public areas integrating person-environment fit theory
- Application of lossless signal transmission technology in piano timbre recognition
- Application of improved GA in optimizing rural tourism routes
- Architectural animation generation system based on AL-GAN algorithm
- Advanced sentiment analysis in online shopping: Implementing LSTM models analyzing E-commerce user sentiments
- Intelligent recommendation algorithm for piano tracks based on the CNN model
- Visualization of large-scale user association feature data based on a nonlinear dimensionality reduction method
- Low-carbon economic optimization of microgrid clusters based on an energy interaction operation strategy
- Optimization effect of video data extraction and search based on Faster-RCNN hybrid model on intelligent information systems
- Construction of image segmentation system combining TC and swarm intelligence algorithm
- Particle swarm optimization and fuzzy C-means clustering algorithm for the adhesive layer defect detection
- Optimization of student learning status by instructional intervention decision-making techniques incorporating reinforcement learning
- Fuzzy model-based stabilization control and state estimation of nonlinear systems
- Optimization of distribution network scheduling based on BA and photovoltaic uncertainty
- Tai Chi movement segmentation and recognition on the grounds of multi-sensor data fusion and the DBSCAN algorithm
- Special Issue: Dynamic Engineering and Control Methods for the Nonlinear Systems - Part III
- Generalized numerical RKM method for solving sixth-order fractional partial differential equations