Research on surface defect detection method and optimization of paper-plastic composite bag based on improved combined segmentation algorithm
-
Yan Guoping
 ,
Han Yimeng
,
Han Yimeng

Abstract
At present, the detection of surface defects of paper-plastic composite bags still mainly depends on manual visual inspection, which is very inefficient and easy to cause false detection. Based on the algorithm which combines edge detection and adaptive region growth, binary images of the surface defect areas is extracted, six types of shape features and seven types of invariant moment features are defined by calculation as the basis to complete the effective extraction of the surface features, then a paper-plastic composite bags surface defect detection platform is built to complete the defect detection experiment, the defect screening experiment was completed by the rapid screening method of its surface defect image based on gradient projection difference. At the same time, based on Genetic Algorithm (GA), Particle Swarm Optimization, and Grey Wolf Optimization, parameter optimization models of Support Vector Machine were established, respectively. Through experimental comparison, some results show that the defect detection and classification accuracy rate reach 96.83% based on the GA, and the detection speed with the screening method is 3.75 times faster than that without the screening method. Therefore, the reliability of the image classification and screening method for bags surface defects proposed in this study is verified.
1 Introduction
Paper-plastic composite bags are widely used in various fields such as industry, food packaging, and electronics [1] as practical general carriers. Due to the effect of production equipment, raw materials, and processing processes, it is difficult to avoid that there are more types of defects on the bag’s surfaces, which seriously affect the beauty and quality of the bag products. Some common surface defects are shown in Figure 1. In order to ensure the final quality of the paper-plastic composite bag, the surface quality must be detected in the production process.

Common defect patterns on the surface of paper-plastic composite bags.
At present, most of the intelligent automatic monitoring systems used in surface quality detection are developed based on machine vision systems with imaging processing and recognition technology as the core. Based on this technology, some researchers have carried out a lot of studies on defect detection of rolling elements, leather, fabrics, tiles, pipes, etc. For example, Ren et al. [2] conducted research on the study status of defect detection technology based on machine vision, and expounded the latest progress of machine vision in the field of industrial defect detection. Prappacher et al. [3] carried out scanning defect detection on rolling element surfaces based on neural image segmentation. Based on fast convergence particle group optimization integrated classifier, Jawahar et al. [4] studied the visual inspection system of leather surface defects. Fouda [5], Daniel et al. [6], Lizarraga-Morales et al. [7], and Yassine and Mohamed [8] studied fabric flaw spots and pattern fabric defects based on some related methods of machine vision such as image analysis. Hanzaei et al. [9] used a multi-class support vector machine (SVM) classifier based on statistical pattern recognition theory to accurately identify the surface defects of ceramic tiles. Mohamed et al. [10] monitored physical defects such as dents, cracks, corrosion in oil and gas pipelines based on image classification of decision tree. Mengkun et al. [11] detected defects of irregular industrial products with some methods of machine vision, it successfully realized the defect detection of Bluetooth headset and the defect recognition accuracy reached 98%. Cong et al. [12] proposed an improved Sobel algorithm for the edge detection of image defects, which split the defects in the image with Gaussian window adaptive threshold segmentation method. After morphological processing was performed, the outline of defects was accurately drawn. Wu and Lu [13] detected the surface defects of printing boxes by the way of the SVM training model with the multi-layer perception kernel function. Thakkar et al. [14] performed an image classification method based on data analysis to detect longitudinal surface crack defects generated in the continuous casting stage. All these studies have achieved good applications in the respective fields, which have laid a good theoretical and empirical foundation for surface defects of paper-plastic composite bags, although there are few on such kind of research. However, due to the different detection objects and defect detection methods, accuracy and classification effects will be quite different.
One fast image screening and processing method based on the gradient projection difference was adopted for paper-plastic composite surface defects in this article, which is combined with the algorithm [1] of edge detection and adaptive region growing combined segmentation. As a result, five common defects including broken skin, holes, dirty spots, and convex ribs were handled and compared with the normal surface images, so as to realize the fast and effective screening of defect images. Aiming at the classification problem of surface defect images of paper-plastic composite bags, effective feature selection was carried out, and three parameter optimization models of SVM classifiers for surface defects of paper-plastic composite bags were established; in the meantime, the most suitable kernel function was selected by means of comparative calculation to improve the accuracy of the classifier. Finally, one detection platform for the paper-plastic composite bags surface defect was performed and the defect detection method proposed in this article was verified by experiment.
2 Theoretical basis of improved combinatorial algorithms
In this study, through a series of pre-experiments, it is found that, compared with other edge detection operators, the edges of Sobel operator are relatively clear, most of them are real defect edges, and the calculation speed of Sobel operator [15] is faster. While removing the surface image noise of paper-plastic composite bags, Gaussian filter retains relatively complete edge details of the defective part, which has the same denoising effect as bilateral filter, but the running speed is much faster than bilateral filter. Therefore, Sobel operator and Gaussian filter algorithm are selected as the algorithms for image edge detection and denoising. The Sobel operator is often used for edge detection and, in coarse precision, is the most commonly used edge detection operator to be widely used for decades. The Sobel operator consists of two 3 × 3 convolution kernels, which are used to calculate the gray weight difference of the center pixel neighborhood. It is divided into vertical and horizontal Sauber filters Gx and Gy. Gaussian filter is a kind of linear smoothing filter whose value is selected according to the shape of Gaussian function. Gaussian smoothing filters are very effective for suppressing noise that follows a normal distribution. Second, this paper inherits the basic idea of combining pixels with similar qualities in the traditional region growth method. The initial seed points of the traditional region growth algorithm [16] need to be manually selected or specified, which cannot meet the requirements of automatic segmentation. In addition, the image after segmentation is affected by image noise, resulting in uneven edges and holes, which can lead to a decrease in image quality the adaptive region growing method with the combined segmentation algorithm of edge detection and adaptive region growing can reduce these problems and improve the performance of the algorithm.
At first, it is found that the flatness can distinguish the fold and rib images from the other three kinds of defect images, and this article uses Sobel operator to distinguish the wrinkle and convex rib images from the other three defect images with Gauss filtering. After that, the adaptive region growing method with the combined segmentation algorithm of edge detection and adaptive region growing is used to segment the images of broken skin, hole, and dirty point defects. Then, the minimum circumscribed rectangle is extracted to achieve accurate segmentation of the other three types of defect images of broken skin, hole, and dirty spot. At the same time, edge detection segmentation algorithm is used to accurately segment the images of convex ribs and wrinkles. Mean filtering and median filtering [17] are also two denoising algorithms often used in image denoising. OTSU method [18] is an algorithm to determine the threshold of binary image segmentation, which was proposed by the Japanese scholar OTSU in 1979, and it is considered to be the best algorithm for threshold selection in image segmentation. It is simple to calculate and is not affected by image brightness and contrast, so it has been widely used in digital image processing. In order to quantitatively evaluate the performance of various segmentation algorithms, the segmentation algorithm described in this study is now compared with the OTSU, the Sobel operator combined with the median filter algorithm, and the traditional region growing algorithm (the initial seed point is manually selected at the centroid), and introduce the evaluation index – Dice coefficient. The closer the value is to 1, the higher the accuracy of defect segmentation. The calculation formula is as follows:
where
The quantitative evaluation of the quality of segmentation results of different algorithms is shown in Figure 2, where the Dice coefficient is the average of 20 sets of experimental results.

Quality assessment of segmentation results of different algorithms.
As can be seen from Figure 2, OTSU method and Sobel combined median filter algorithm perform poorly in defect detection. Although the traditional regional growth method has a high detection accuracy for broken skin, holes, and dirty spots, it has a very low accuracy in detecting convex rib and fold defects and cannot meet the requirements. In contrast, the algorithm proposed in this work has a good performance in the evaluation indicators of various defects, the Dice coefficients are all above 0.93, and the advantages of the algorithm proposed in this work for image segmentation of surface defects of paper-plastic composite bags are shown.
After accurately segmenting the surface defect areas, the shape feature and invariant moment feature of the defects from the extracted binary images are studied as the object, so as to complete the defect feature extraction. The area of the defect region is given by the following formula:
where
The perimeter of the defect region is represented by the following formula:
Flatness is expressed as
where H and W are the height and width of the smallest circumscribed rectangle of the defect area, respectively.
Duty Ratio calculation formula is as follows:
The formula for calculating the circumference ratio is as follows:
The circularity calculation formula is as follows:
The central moment
where
The normalized central moment of order
where
Based on the moments of the region defined above, the normalized second-order central moments
It can be seen from Eq. (9) that when calculating the normalized central moment of the image, the number of powers of different orders varies with the order, so the obtained central moments of different orders will be quite different in magnitude. In order to reduce the sensitivity of high-order central moments to pixel coordinate changes, the logarithm of seven invariant moments is used to describe the target. In this way, the final seven invariant moment feature vectors can be expressed as follows:
The calculation flow chart in detail is shown in Figure 3.

Calculation flow chart.
3 Feature extraction and selection
According to the above feature calculation formulas, the binary images of the surface defect areas on the paper-plastic composite bags are extracted by the method of image segmentation, then the shape features and invariant moment features of five types of defects are extracted. This article conducts feature extraction experiments on five types of defect samples such as wrinkle, broken skin, hole, dirty spot, and convex rib. Binary images of some samples are shown in Figure 4. The 6 shape features and 7 invariant moment features of the corresponding samples are list in Table 1.

Two groups of common defects of binary image. From left to right are wrinkles, broken skins, holes, dirty spots, and convex ribs.
Two groups of binary images corresponding to characteristic parameters
| Sample |
|
|
|
|
|
|
|
|
|
|
|
|
|
|---|---|---|---|---|---|---|---|---|---|---|---|---|---|
| Wrinkle | 1094 | 756 | 0.026 | 0.2736 | 1.0646 | 0.0241 | 2.4513 | 4.9011 | 2.7546 | 2.3331 | 5.7689 | 4.5482 | 4.1542 |
| Broken skin | 698 | 143 | 0.3065 | 0.5925 | 1.1329 | 0.4289 | 1.0572 | 2.4785 | 1.3651 | 7.5418 | 12.5595 | 8.8786 | 13.1208 |
| Hole | 436 | 75 | 0.7545 | 0.7486 | 1.2999 | 0.974 | 1.7548 | 5.752 | 0.2115 | 1.977 | 4.2483 | 4.8793 | 10.2153 |
| Dirty spot | 225 | 57 | 0.5562 | 0.7082 | 1.305 | 0.8702 | 1.4964 | 3.8905 | 1.0039 | 3.2757 | 6.2886 | 6.6364 | 6.4257 |
| Convex rib | 292 | 290 | 0.0131 | 0.3077 | 1.8795 | 0.0436 | 3.0817 | 6.163 | 1.8702 | 1.1918 | 2.6965 | 3.9704 | 2.6576 |
| Sample |
|
|
|
|
|
|
|
|
|
|
|
|
|
|---|---|---|---|---|---|---|---|---|---|---|---|---|---|
| Wrinkle | 744 | 433 | 0.0442 | 0.3115 | 1.1208 | 0.0499 | 1.8003 | 3.5953 | 5.1073 | 3.3781 | 8.151 | 4.9713 | 6.1792 |
| Broken skin | 1550 | 284 | 0.1872 | 0.5416 | 1.0338 | 0.2415 | 0.3257 | 0.7246 | 1.7345 | 2.9839 | 5.3449 | 3.3503 | 7.0167 |
| Hole | 1428 | 193 | 0.6091 | 0.6297 | 1.0174 | 0.4818 | 1.5961 | 4.6888 | 3.0614 | 5.276 | 9.9757 | 7.7285 | 14.1035 |
| Dirty spot | 110 | 35 | 0.5231 | 0.8462 | 1.3721 | 1.1284 | 1.5968 | 4.2448 | 4.1568 | 1.9573 | 5.9172 | 3.1741 | 0.2211 |
| Convex rib | 250 | 234 | 0.014 | 0.3925 | 1.8462 | 0.0574 | 2.8804 | 5.7602 | 5.261 | 5.2539 | 10.5113 | 8.1338 | 6.3406 |
It can be seen from Table 1 that due to the relatively slender shape of the wrinkle and the convex rib, the corresponding flatness is smaller than that of the three types of defects such as broken skin, hole, and dirty spot. In addition, the defects such as broken skin and hole most appear in large blocks, so their areas are generally larger than that of wrinkle, dirty spot, and convex rib as well. The dirty spot defect area is small, so its perimeter is generally smaller than that of other defects. Hole and dirty point defect areas are more compact than that of wrinkle and convex rib defects, so their circularity is larger. For the feature of perimeter ratio, most of all kinds of defects are gathered in the same small range, and it is not separable. Although the duty ratios of wrinkle and convex rib defects are basically smaller than that of other defects, their distinguishing characteristics and flatness are repeated. The first two items of the invariant moment of the same type defect image are relatively close, and those for the different types defect images are quite different. In addition, the value of the last five items of the invariant moment of the same type defect image varies greatly, which is unreliable. Therefore, six feature parameters in the defect areas are finally selected such as the area, perimeter, flatness, circularity,
4 Surface defect classification of SVM based on optimization model
Because the probability of surface defects of paper-plastic composite bags is small, only limited defect samples can be obtained on site, so the classification of surface defects of paper-plastic composite bags can only be carried out in the state of small samples. Support Vector Machine (SVM) [19] is based on statistical learning theory, Vapnik-Chervonenkis Dimension (VC dimension) theory and structural risk minimization principle. The basic idea is to find the optimal classification surface to obtain the maximum classification interval between two types of samples. The SVM method is based on the optimal classification surface in the case of linear separability. SVM has the strong promotion ability in solving the problems of small sample decision-making, so when classifying the surface defects of paper-plastic composite bags in the state of small samples, it can be used to classify the surface defect images. At the same time, the choice of kernel function is also one of the key factors to achieve the best performance of the classifier. The classification model is trained with four kernel functions, respectively, under the same penalty factor (penalty factor is 2). After comparing the influence of different kernel functions on the accuracy of the classifier, the Radial basis function (RBF) kernel function
The classifier performance is first validated by K-Cross Validation (K-CV). The general steps are as follows: First, the original data are equally divided into K disjoint subsets, then each subset data are used as a verification set, and the remaining K-1 subset data are used as a training set to obtain K models. Finally, the average classification accuracy rate of the final verification set of the K models is used as the performance index of the K-CV classifier. It effectively avoids over-learning and under-learning and the final results obtained are also more convincing.
In current research, Genetic Algorithm (GA) [21,22,23] and the emerging Grey Wolf Optimization (GWO) [24,25,26] are widely used in optimizing SVM parameters. In the article, Particle Swarm Optimization (PSO) [27,28,29] is used to improve the results of SVM parameter optimization, which makes the results more convincing.
4.1 GA-based SVM parameter optimization
GA, also known as evolutionary optimization algorithm, simulates the evolutionary mechanism of organisms and the natural law of survival of the fittest, through its selection operator, crossover operator, and mutation operator, and it continuously evolves the original population to obtain the optimal solution of the optimization problem. It is a heuristic global search algorithm with wide application, high efficiency and strong robustness. The process of parameter optimization for SVM classifier with the help of GA is shown in Figure 5.

GA optimization SVM parameter flow chart.
Selection operator, crossover operator, and mutation operator are used in three basic links of GA, respectively: heredity, crossover, and mutation. The selection operator is used to select individuals from the population, and the crossover operator is used to cross two individuals to generate a new individual. Mutation operators are used to mutate individuals to increase the diversity of the population. Selection operators, crossover operators, and mutation operators in GA are an organic whole, and their rational use is the key to achieve GA.
According to the parameter optimization idea of GA, the model parameters of SVM are optimized and selected. Here 285 samples are used to train the SVM model. The specific parameters of the model are set as follows: the maximum evolutionary generation is set to 200, the population size is 20, the penalty factor
GA optimization results for SVM parameters
| Number of experiments | Best c | Best g | CV accuracy (%) | Average running time (s) |
|---|---|---|---|---|
| 1 | 30.0728 | 6.1778 | 95.3333 | 18.78337 |
| 2 | 51.6945 | 9.3692 | 94.0862 | |
| 3 | 21.0836 | 28.8268 | 95.3333 | |
| 4 | 22.9131 | 8.3937 | 95.3333 | |
| 5 | 35.0282 | 11.6646 | 94.0862 | |
| 6 | 28.7776 | 27.7609 | 95.3333 | |
| 7 | 41.9443 | 1.0428 | 96.6274 | |
| 8 | 34.0490 | 12.2337 | 93.8265 | |
| 9 | 60.0082 | 0.8847 | 93.8265 | |
| 10 | 25.5672 | 29.2689 | 95.3333 |
4.2 PSO-based SVM parameter optimization
PSO is an optimization based on swarm intelligence. Similar to GA, it is an evolutionary algorithm, which realizes the search for the optimal solution in a complex space through competition and cooperation between individuals. The flowchart of PSO optimizing SVM parameters is shown in Figure 6.

PSO optimization SVM parameter flow chart.
According to the parameter optimization idea of PSO, the model parameters of SVM are optimized and selected. Here 285 samples are used to train the SVM model. The specific parameters of the model are set as follows: the maximum evolutionary generation is set to 200, the population size is 20, the penalty factor
PSO optimization results for SVM parameters
| Number of experiments | Best c | Best g | CV accuracy (%) | Average running time (s) |
|---|---|---|---|---|
| 1 | 29.7124 | 12.6681 | 95.3333 | 39.30805 |
| 2 | 40.5832 | 28.2934 | 95.3333 | |
| 3 | 22.3836 | 27.9543 | 94.6481 | |
| 4 | 52.2047 | 9.7179 | 96.0536 | |
| 5 | 15.9174 | 14.8806 | 95.3333 | |
| 6 | 83.1571 | 6.1733 | 93.8629 | |
| 7 | 21.4805 | 15.4898 | 95.3333 | |
| 8 | 31.8098 | 23.1130 | 95.3333 | |
| 9 | 26.9917 | 8.2189 | 96.2427 | |
| 10 | 17.9965 | 10.2794 | 96.2427 |
4.3 GWO-based SVM parameter optimization
GWO is a group intelligence optimization algorithm proposed by Mirjalili et al. to simulate the unique hierarchical system and collective hunting behavior of gray wolf populations in nature. Compared with the early intelligent optimization algorithms, it has extremely significant advantages in terms of convergence, and at the same time, the algorithm has lower complexity and fewer control parameters, and takes into account the ability of individual and global optimal solutions. To a certain extent, it can avoid the problem of falling into local optimum in the optimization process, so it is also widely used in various practical optimization problems.
In the gray wolf group, there are mainly four levels:

GWO optimization SVM parameter flow chart.
According to the parameter optimization idea of GWO, the model parameters of SVM are optimized and selected. Here, 285 samples are used to train the SVM model. The specific parameters of the model are set as follows: the maximum evolutionary generation is set to 200, the population size is 20, the penalty factor
GA optimization results for SVM parameters
| Number of experiments | Best c | Best g | CV accuracy (%) | Average running time (s) |
|---|---|---|---|---|
| 1 | 97.5852 | 0.0460 | 98.6094 | 7.34617 |
| 2 | 100 | 0.0460 | 98.6094 | |
| 3 | 100 | 0.0460 | 98.6094 | |
| 4 | 97.8856 | 0.0460 | 98.6094 | |
| 5 | 98.2243 | 0.0460 | 98.6094 | |
| 6 | 100 | 0.0460 | 98.6094 | |
| 7 | 100 | 0.0460 | 98.6094 | |
| 8 | 100 | 0.0460 | 98.6094 | |
| 9 | 96.1015 | 0.0460 | 98.6094 | |
| 10 | 100 | 0.0460 | 98.6094 |
After the calculated comparison of the three algorithms, it is found that the SVM model based on GWO has the highest accuracy and the shortest running time; however, the penalty factor C of the model is always close to the maximum value of the boundary, which indicates that the generalization ability of the model is poor. For most paper-plastic composite bag surface defects, the accuracy of the SVM model based on GA is the same as that of the SVM model based on PSO. But the running time of the model based on GA is nearly 1/2 shorter than that of the model based on PSO.
In order to finally explore the influence of the three optimization algorithms on the classification performance of the SVM model of the paper-plastic composite bag surface defects, the SVM models established based on GA, PSO, and GWO were used to classify the test set data, respectively. The training set containing 285 samples was used to train the SVM model (c = 2, g = 1), and the test set containing 95 samples was used for model testing. The classification results of the best parameter training classifier obtained by using GA is shown in Figure 8, respectively. The abscissas 1–95 in the figure are the sample numbers of the test set. The abscissas 1–95 in the figure are the sample numbers of the test set, and the ordinates “1,” “2,” “3,” “4,” and “5” numbers represent wrinkles, broken skins, holes, dirty spots, and convex ribs, respectively. For the ease of comparison, the classification results of the three different optimization algorithms are summarized in Table 5.
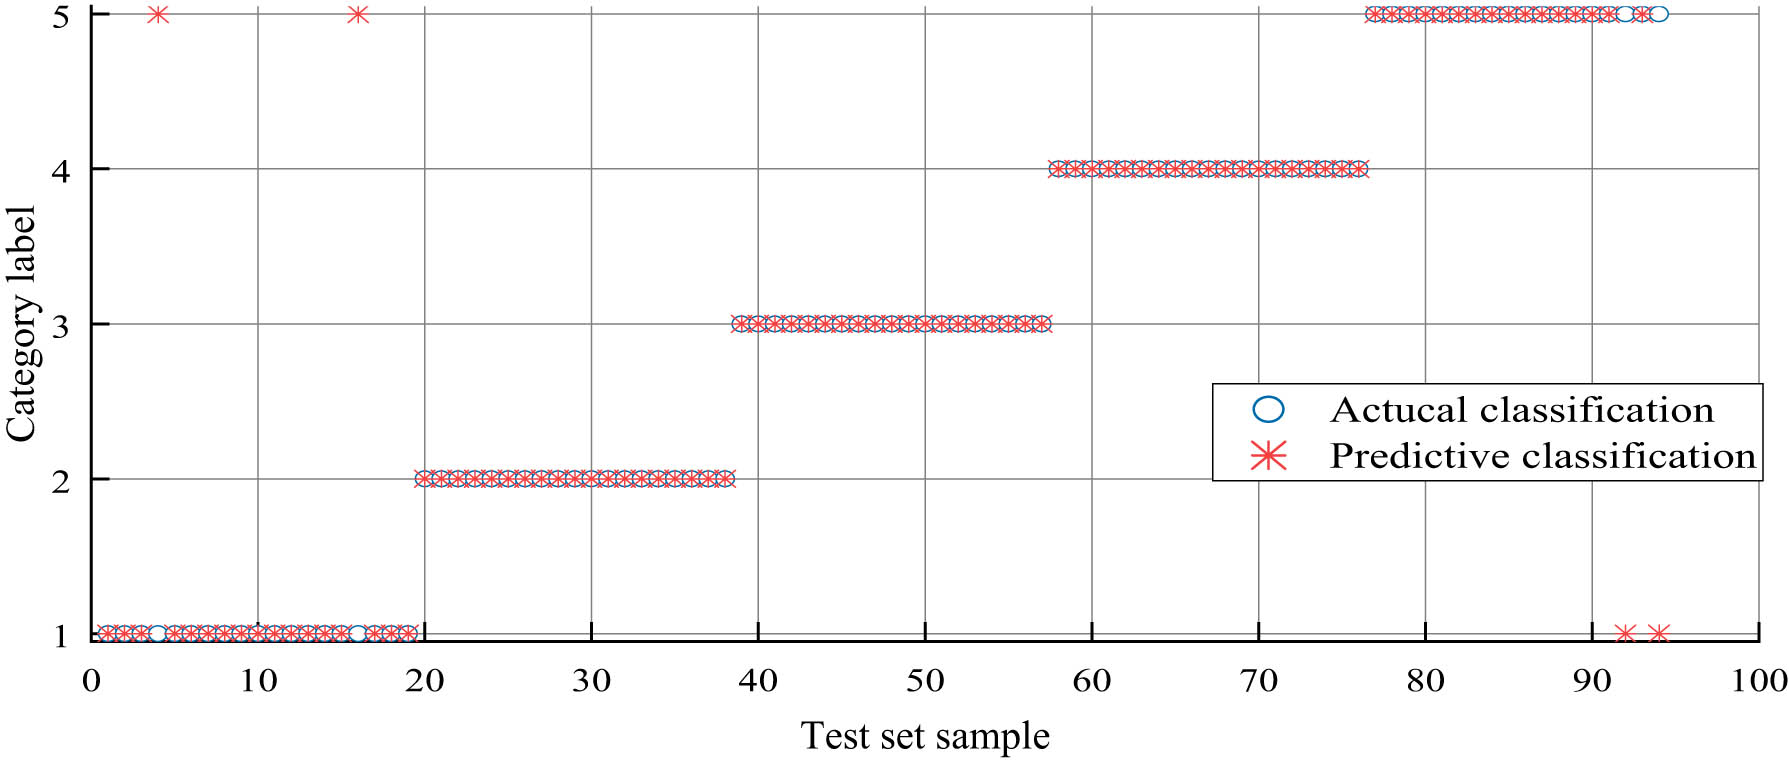
Test set classification results based on GA.
Comparison of classification results of different optimization algorithms
| Optimization method | Best c | Best g | Test set accuracy |
|---|---|---|---|
| GA | 22.9131 | 8.3937 | 95.7894% (91/95) |
| PSO | 26.9917 | 8.2189 | 94.7368% (90/95) |
| GWO | 100 | 0.0460 | 92.6316% (88/95) |
From the above chart and figures, it can be seen that the SVM model based on GWO for the surface defects of paper-plastic composite bags has a poor performance on the test samples under the condition of high model accuracy, it may be that the defect feature extraction is not perfect, resulting in the poor generalization ability of the model. Considering the huge advantages of GA in the process of parameter optimization, time-consuming, and generalization ability, for the detection of surface defects of paper-plastic composite bags which require strict algorithm robustness and running time, it might be more suitable to adopt GA as the parameter optimization algorithm of SVM, where the recognition accuracy and speed, and the most ideal test results in a shorter time can be obtained.
5 Experimental test
The paper-plastic composite bag surface defects detection platform is mainly composed of industrial cameras, industrial lenses, light sources, motors, etc. The schematic diagram of the detection platform structure is shown in Figure 9. The motor controls the conveyor belt to transport the uncut paper-plastic composite bag to the detection area, the encoder measures the position of the paper-plastic composite bag, and determines whether the paper-plastic composite bag reaches the detection area. When it is determined that the paper-plastic composite bag reaches the detection area, the camera is triggered to obtain the surface image of the paper-plastic composite bag and is transmitted to the upper computer to complete the detection of the surface image of the paper-plastic composite bag.

Schematic diagram of the surface defect detection platform for paper-plastic composite bags.
In order to verify the theory and platform feature requirements in the article, a paper-plastic composite bag defect detection platform is designed and built as shown in Figure 10. The experimental equipment is shown in Table 6.
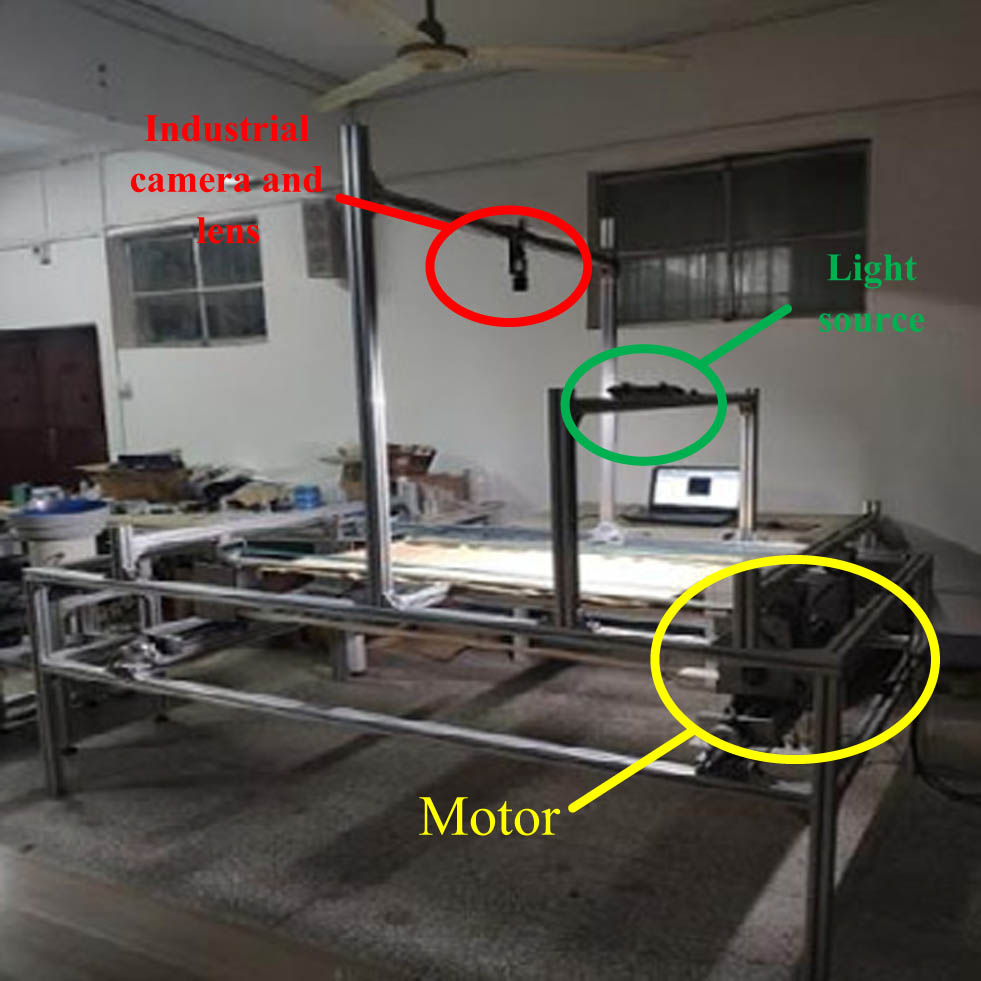
Experimental platform for defect detection of paper-plastic composite bags.
Experimental equipment
| Experiment equipment | Type |
|---|---|
| Industrial camera | Hikvision MV-CE100-30GM black and white aerial array lens |
| Industrial lens | Wickmark-M1406-3MP Industrial Lens |
| Light source | DY-30-24V Power Controller |
| Motor | Mitsubishi FX5U-32MT/ES PCL controller |
5.1 Defect classification experiment
Some paper-plastic composite bags were used for defect testing experiment on the above built platform, and 600 pictures are collected, including 473 normal images and 127 defect images. The experimental test results are shown in Table 7.
Surface defect test results of paper-plastic composite bags
| Category | Quantity | Normal image | Wrinkle | Broken skin | Hole | Dirty spot | Convex rib | Classification accuracy (%) |
|---|---|---|---|---|---|---|---|---|
| Normal image | 473 | 456 | 0 | 0 | 0 | 17 | 0 | 96.41 |
| Wrinkle | 36 | 0 | 35 | 0 | 0 | 0 | 1 | 97.22 |
| Broken skin | 14 | 0 | 0 | 14 | 0 | 0 | 0 | 100 |
| Hole | 17 | 0 | 0 | 0 | 17 | 0 | 0 | 100 |
| Dirty spot | 28 | 0 | 0 | 0 | 0 | 28 | 0 | 100 |
| Convex rib | 32 | 0 | 1 | 0 | 0 | 0 | 31 | 96.87 |
It can be seen from Table 7 that the detection effect of broken skin, hole, and dirty spot defects is ideal, and the classification accuracy is 100%. There is a small amount of normal images to be misused as dirty defects, which may be subject to field environmental interference, with different degrees of dust particles temporarily falling on the surface of the paper-plastic composite bag, thus causing false detection. At the same time, it is also indicated that the detection method is slightly insufficient in identifying and judging the defects of wrinkle and convex rib, one case of mutual false detection is found. The main possible reason is that the shape and appearance of wrinkle and convex rib defects are relatively similar, so it is difficult to distinguish them, which illustrates that further optimization and improvement are needed in their features extraction. Although there is a certain degree of false detection, the overall defect detection and classification accuracy rate still reaches 96.83%, which verifies the reliability of the surface defect image classification method for the paper-plastic composite bags proposed in this work.
5.2 Defect screening experiment
The probability of defects on the surface of paper-plastic composite bags is relatively low. In order to avoid wasting time, the rapid screening method of surface defect images of paper-plastic composite bags based on gradient projection difference is adopted in this study for preliminary screening of massive images. This method is an algorithm based on the difference shadow method combined with the feature of large gradient amplitude of surface defect images to screen defect images, and the following experiments are designed for verification.
600 pictures are collected in the experimental platform (3,840 pixels × 2,748 pixels) and some tests are done with the screening method (a gradient projection difference-based fast image screening and processing method for paper-plastic composite surface defect images) and non-screening method, respectively. The results obtained are shown in Table 8.
Experimental results
| Method | All pictures detection time (s) | Each picture detection average time (s) | Classification accuracy (%) |
|---|---|---|---|
| Without screening method | 846.03 | 1.41003 | 96.83 |
| With screening method | 225.61 | 0.37601 | 96.83 |
It can be seen from Table 8 that the detection and classification accuracy are the same with the screening method and without the screening method, but the experiment speed with the screening method is 3.75 times faster than that without the screening method. Therefore, after the image screening method is added, the detection speed is greatly improved in the case where the detection accuracy is unchanged, and the effectiveness and accuracy of the surface image screening method will be verified for the paper-plastic composite bags.
6 Conclusion and prospects
This work studies the segmentation, screening, feature selection, and SVM model optimization of surface defect images of paper-plastic composite bags. The main conclusions are as follows:
The segmentation algorithm combining edge detection and adaptive region growth is used to realize the accurate classification of various typical defect images on the surface of paper plastic composite bags, which improves the problem that a single segmentation method can not achieve the ideal segmentation effect for various surface defect images of paper plastic composite bags, and has practical significance.
The research compares the optimization effects of the SVM models established by GA, PSO, and GWO, respectively. The test finds that although GWO has the highest model accuracy and the shortest running time, its generalization ability is poor. PSO runs for a long time. GA can take into account the recognition speed and accuracy, so it is more suitable for the optimization of the SVM model.
This study established a paper-plastic composite bag defect detection platform, and experiments are carried out on the theory proposed in this work. The experimental results show that the overall defect detection and classification accuracy rate reaches 96.83%, which meets the actual production requirements and the algorithm proposed in this study has a good performance in the evaluation indicators of various defects, the Dice coefficients are all above 0.93, which is superior to other comparison algorithms.
A sample screening experiment was carried out by using one fast image screening, and processing method based on the gradient projection difference was adopted for paper-plastic composite surface defects. Experimental results show that the detection and classification accuracy rates without the screening method or with the screening method are the same, but the detection speed with the screening method is 3.75 times faster than that without the screening method, it verifies the reliability of the theory about the screening method in this work.
-
Funding information: This work was funded by major project for technological innovation of Hubei Province of China (2018AAA026); National Natural Science Foundation of China (52005168); Hubei Provincial Technical Innovation Project (Major Project) (2018AAA026); Hubei Natural Science reFoundation (2019CFB326); Hubei Province Support Enterprise Technological Innovation and Development Project (2021BAB010); the 2024 Wuhan Metropolitan Circle Collaborative Innovation Science and Technology Project of China (2024070904020435).
-
Author contributions: Conceptualization: G.Y. and F.Z.; methodology: S.W.; software: G.Y. and S.W.; validation: G.Y., Y.H., J.Z., and F.Z.; formal analysis: G.Y. and S.W.; investigation: Y.H. and F.Z.; resources, G.Y., Y.H., and S.W.; writing – original draft preparation: S.W.; and writing – review and editing: G.Y., Y.H., and X.L. All authors have read and agreed to the published version of the manuscript.
-
Conflict of interest: The authors declare no conflict of interest.
-
Data availability statement: All data generated or analysed during this study are included in this published article.
References
[1] Wu S, Yan G, Yang X. Design and implementation of image segmentation algorithm for surface defects of paper plastic composite bag. Packag Eng. 2021;42(1):244–9.10.1109/IPEC51340.2021.9421324Suche in Google Scholar
[2] Ren Z, Fang F, Yan N, Wu Y. State of the art in defect detection based on machine vision. Int J Precis Eng Manuf-Green Technol. 2022;9(2):661–91.10.1007/s40684-021-00343-6Suche in Google Scholar
[3] Prappacher N, Bullmann M, Bohn G, Deinzer F, Linke A. Defect detection on rolling element surface scans using neural image segmentation. Appl Sci. 2020;10(9):3290.10.3390/app10093290Suche in Google Scholar
[4] Jawahar M, Babu NC, Vani KL, Anbarasi LJ, Geetha S. Vision based inspection system for leather surface defect detection using fast convergence particle swarm optimization ensemble classifier approach. Multimed Tools Appl. 2020;80(3):4203–35.10.1007/s11042-020-09727-3Suche in Google Scholar
[5] Fouda YM. Integral images-based approach for fabric defect detection. Opt Laser Technol. 2022;147:107608.10.1016/j.optlastec.2021.107608Suche in Google Scholar
[6] Daniel Y, Said AM, Nadia B. Automatic fabric defect detection using learning-based local textural distributions in the contourlet domain. IEEE Trans Autom Sci Eng. 2018;15(3):1014–26.10.1109/TASE.2017.2696748Suche in Google Scholar
[7] Lizarraga-Morales RA, Correa-Tome FE, Sánchez-Yáñez RE, Cepeda-Negrete J. On the use of binary features in a rule-based approach for defect detection on patterned textiles. IEEE Access. 2019;7:18042–9.10.1109/ACCESS.2019.2896078Suche in Google Scholar
[8] Yassine BS, Mohamed A. Texture classification of fabric defects using machine learning. Int J Electr Computer Eng (IJECE). 2020;10(4):4390.10.11591/ijece.v10i4.pp4390-4399Suche in Google Scholar
[9] Hanzaei SH, Afshar A, Barazandeh F. Automatic detection and classification of the ceramic tiles surface defects. Pattern Recognit. 2017;66:174–89.10.1016/j.patcog.2016.11.021Suche in Google Scholar
[10] Mohamed A, Hamdi MS, Tahar S. Decision tree-based approach for defect detection and classification in oil and gas pipelines. In: Proceedings of the Future Technologies Conference (FTC), Springer International Publishing. Vol. 1; 2019. p. 490–504.10.1007/978-3-030-02686-8_37Suche in Google Scholar
[11] Mengkun L, Junying J, Xin L, Yue Z. A method of surface defect detection of irregular industrial products based on machine vision. Wirel Commun Mob Comput. 2021;2021(1):6630802.10.1155/2021/6630802Suche in Google Scholar
[12] Cong L, Qing LH, Nan SY, Qiang WJ. Detection algorithm of defects on polyethylene gas pipe using image recognition. Int J Press Vessel Pip. 2021;191:104381.10.1016/j.ijpvp.2021.104381Suche in Google Scholar
[13] Wu Y, Lu Y. An intelligent machine vision system for detecting surface defects on packing boxes based on support vector machine. Meas Control. 2019;52(7–8):1102–10.10.1177/0020294019858175Suche in Google Scholar
[14] Thakkar K, Ambekar SS, Hudnurkar M. Prediction of longitudinal facial crack in steel thin slabs funnel mold using different machine learning algorithms. Int J Innov Sci. 2020;13(1):67–86.10.1108/IJIS-09-2020-0172Suche in Google Scholar
[15] Ravivarma G, Gavaskar K, Malathi D, Asha KG, Ashok B, Aarthi S. Implementation of Sobel operator based image edge detection on FPGA. Mater Today: Proc. 2021;45:2401–7.10.1016/j.matpr.2020.10.825Suche in Google Scholar
[16] Sun XX, Qu W. Comparison between mean filter and median filter algorithm in image denoising field. Appl Mech Mater. 2014;3468:644–50.10.4028/www.scientific.net/AMM.644-650.4112Suche in Google Scholar
[17] Levine MD, Nazif AM. Dynamic measurement of computer generated image segmentations. IEEE Trans Pattern Anal Mach Intell. 1985;7(2):155–64.10.1109/TPAMI.1985.4767640Suche in Google Scholar PubMed
[18] Huang C, Li X, Wen Y. AN OTSU image segmentation based on fruitfly optimization algorithm. Alex Eng J. 2021;60(1):183–8.10.1016/j.aej.2020.06.054Suche in Google Scholar
[19] Shawe-Taylor J, Sun S. A review of optimization methodologies in support vector machines. Neurocomputing. 2011;74(17):3609–18.10.1016/j.neucom.2011.06.026Suche in Google Scholar
[20] Cherkassky V. The nature of statistical learning theory. IEEE trans neural netw. 1997;8(6):1564.10.1109/TNN.1997.641482Suche in Google Scholar PubMed
[21] Yiming H, Di W, Zhifen Z, Huabin C, Shanben C. EMD-based pulsed TIG welding process porosity defect detection and defect diagnosis using GA-SVM. J Mater Process Tech. 2016;239:92–102.10.1016/j.jmatprotec.2016.07.015Suche in Google Scholar
[22] Shanyue G, Xiaokai W, Lin H, Li L. Quantitative ultrasonic testing for near-surface defects of large ring forgings using feature extraction and GA-SVM. Appl Acoust. 2021;173:107714.10.1016/j.apacoust.2020.107714Suche in Google Scholar
[23] Li K, Wang L, Wu J, Zhang Q, Liao G, Su L. Using GA-SVM for defect inspection of flip chips based on vibration signals. Microelectron Reliab. 2018;81:159–66.10.1016/j.microrel.2017.12.032Suche in Google Scholar
[24] Barman M, Choudhury NBD. A similarity based hybrid GWO-SVM method of power system load forecasting for regional special event days in anomalous load situations in Assam, India. Sustain Cities Soc. 2020;61:102311.10.1016/j.scs.2020.102311Suche in Google Scholar
[25] Li P. Fault diagnosis of motor rolling bearing based on GWO-SVM. Int Core J Eng. 2019;5(10):238–45.Suche in Google Scholar
[26] Bian X-Q, Zhang L, Du Z-M, Chen J, Zhang J-Y. Prediction of sulfur solubility in supercritical sour gases using grey wolf optimizer-based support vector machine. J Mol Liq. 2018;261:431–8.10.1016/j.molliq.2018.04.070Suche in Google Scholar
[27] Xiaokai W, Sanyue G, Lin H, Bin W, Ximing H. Classification of spot-welded joint strength using ultrasonic signal time-frequency features and PSO-SVM method. Ultrasonics. 2018;91:161–9.10.1016/j.ultras.2018.08.014Suche in Google Scholar PubMed
[28] Tu C-J, Chuang L-Y, Chang J-Y, Yang C-H. Feature selection using PSO-SVM. IAENG Int J Computer Sci. 2007;33(1).Suche in Google Scholar
[29] Liu W, Guo G, Chen F, Chen Y. Meteorological pattern analysis assisted daily PM2.5 grades prediction using SVM optimized by PSO algorithm. Atmos Pollut Res. 2019;10(5):1482–91.10.1016/j.apr.2019.04.005Suche in Google Scholar
© 2025 the author(s), published by De Gruyter
This work is licensed under the Creative Commons Attribution 4.0 International License.
Artikel in diesem Heft
- Research Articles
- Generalized (ψ,φ)-contraction to investigate Volterra integral inclusions and fractal fractional PDEs in super-metric space with numerical experiments
- Solitons in ultrasound imaging: Exploring applications and enhancements via the Westervelt equation
- Stochastic improved Simpson for solving nonlinear fractional-order systems using product integration rules
- Exploring dynamical features like bifurcation assessment, sensitivity visualization, and solitary wave solutions of the integrable Akbota equation
- Research on surface defect detection method and optimization of paper-plastic composite bag based on improved combined segmentation algorithm
- Impact the sulphur content in Iraqi crude oil on the mechanical properties and corrosion behaviour of carbon steel in various types of API 5L pipelines and ASTM 106 grade B
- Unravelling quiescent optical solitons: An exploration of the complex Ginzburg–Landau equation with nonlinear chromatic dispersion and self-phase modulation
- Perturbation-iteration approach for fractional-order logistic differential equations
- Variational formulations for the Euler and Navier–Stokes systems in fluid mechanics and related models
- Rotor response to unbalanced load and system performance considering variable bearing profile
- DeepFowl: Disease prediction from chicken excreta images using deep learning
- Channel flow of Ellis fluid due to cilia motion
- A case study of fractional-order varicella virus model to nonlinear dynamics strategy for control and prevalence
- Multi-point estimation weldment recognition and estimation of pose with data-driven robotics design
- Analysis of Hall current and nonuniform heating effects on magneto-convection between vertically aligned plates under the influence of electric and magnetic fields
- A comparative study on residual power series method and differential transform method through the time-fractional telegraph equation
- Insights from the nonlinear Schrödinger–Hirota equation with chromatic dispersion: Dynamics in fiber–optic communication
- Mathematical analysis of Jeffrey ferrofluid on stretching surface with the Darcy–Forchheimer model
- Exploring the interaction between lump, stripe and double-stripe, and periodic wave solutions of the Konopelchenko–Dubrovsky–Kaup–Kupershmidt system
- Computational investigation of tuberculosis and HIV/AIDS co-infection in fuzzy environment
- Signature verification by geometry and image processing
- Theoretical and numerical approach for quantifying sensitivity to system parameters of nonlinear systems
- Chaotic behaviors, stability, and solitary wave propagations of M-fractional LWE equation in magneto-electro-elastic circular rod
- Dynamic analysis and optimization of syphilis spread: Simulations, integrating treatment and public health interventions
- Visco-thermoelastic rectangular plate under uniform loading: A study of deflection
- Threshold dynamics and optimal control of an epidemiological smoking model
- Numerical computational model for an unsteady hybrid nanofluid flow in a porous medium past an MHD rotating sheet
- Regression prediction model of fabric brightness based on light and shadow reconstruction of layered images
- Dynamics and prevention of gemini virus infection in red chili crops studied with generalized fractional operator: Analysis and modeling
- Qualitative analysis on existence and stability of nonlinear fractional dynamic equations on time scales
- Fractional-order super-twisting sliding mode active disturbance rejection control for electro-hydraulic position servo systems
- Analytical exploration and parametric insights into optical solitons in magneto-optic waveguides: Advances in nonlinear dynamics for applied sciences
- Bifurcation dynamics and optical soliton structures in the nonlinear Schrödinger–Bopp–Podolsky system
- User profiling in university libraries by combining multi-perspective clustering algorithm and reader behavior analysis
- Exploring bifurcation and chaos control in a discrete-time Lotka–Volterra model framework for COVID-19 modeling
- Review Article
- Haar wavelet collocation method for existence and numerical solutions of fourth-order integro-differential equations with bounded coefficients
- Special Issue: Nonlinear Analysis and Design of Communication Networks for IoT Applications - Part II
- Silicon-based all-optical wavelength converter for on-chip optical interconnection
- Research on a path-tracking control system of unmanned rollers based on an optimization algorithm and real-time feedback
- Analysis of the sports action recognition model based on the LSTM recurrent neural network
- Industrial robot trajectory error compensation based on enhanced transfer convolutional neural networks
- Research on IoT network performance prediction model of power grid warehouse based on nonlinear GA-BP neural network
- Interactive recommendation of social network communication between cities based on GNN and user preferences
- Application of improved P-BEM in time varying channel prediction in 5G high-speed mobile communication system
- Construction of a BIM smart building collaborative design model combining the Internet of Things
- Optimizing malicious website prediction: An advanced XGBoost-based machine learning model
- Economic operation analysis of the power grid combining communication network and distributed optimization algorithm
- Sports video temporal action detection technology based on an improved MSST algorithm
- Internet of things data security and privacy protection based on improved federated learning
- Enterprise power emission reduction technology based on the LSTM–SVM model
- Construction of multi-style face models based on artistic image generation algorithms
- Research and application of interactive digital twin monitoring system for photovoltaic power station based on global perception
- Special Issue: Decision and Control in Nonlinear Systems - Part II
- Animation video frame prediction based on ConvGRU fine-grained synthesis flow
- Application of GGNN inference propagation model for martial art intensity evaluation
- Benefit evaluation of building energy-saving renovation projects based on BWM weighting method
- Deep neural network application in real-time economic dispatch and frequency control of microgrids
- Real-time force/position control of soft growing robots: A data-driven model predictive approach
- Mechanical product design and manufacturing system based on CNN and server optimization algorithm
- Application of finite element analysis in the formal analysis of ancient architectural plaque section
- Research on territorial spatial planning based on data mining and geographic information visualization
- Fault diagnosis of agricultural sprinkler irrigation machinery equipment based on machine vision
- Closure technology of large span steel truss arch bridge with temporarily fixed edge supports
- Intelligent accounting question-answering robot based on a large language model and knowledge graph
- Analysis of manufacturing and retailer blockchain decision based on resource recyclability
- Flexible manufacturing workshop mechanical processing and product scheduling algorithm based on MES
- Exploration of indoor environment perception and design model based on virtual reality technology
- Tennis automatic ball-picking robot based on image object detection and positioning technology
- A new CNN deep learning model for computer-intelligent color matching
- Design of AR-based general computer technology experiment demonstration platform
- Indoor environment monitoring method based on the fusion of audio recognition and video patrol features
- Health condition prediction method of the computer numerical control machine tool parts by ensembling digital twins and improved LSTM networks
- Establishment of a green degree evaluation model for wall materials based on lifecycle
- Quantitative evaluation of college music teaching pronunciation based on nonlinear feature extraction
- Multi-index nonlinear robust virtual synchronous generator control method for microgrid inverters
- Manufacturing engineering production line scheduling management technology integrating availability constraints and heuristic rules
- Analysis of digital intelligent financial audit system based on improved BiLSTM neural network
- Attention community discovery model applied to complex network information analysis
- A neural collaborative filtering recommendation algorithm based on attention mechanism and contrastive learning
- Rehabilitation training method for motor dysfunction based on video stream matching
- Research on façade design for cold-region buildings based on artificial neural networks and parametric modeling techniques
- Intelligent implementation of muscle strain identification algorithm in Mi health exercise induced waist muscle strain
- Optimization design of urban rainwater and flood drainage system based on SWMM
- Improved GA for construction progress and cost management in construction projects
- Evaluation and prediction of SVM parameters in engineering cost based on random forest hybrid optimization
- Museum intelligent warning system based on wireless data module
- Optimization design and research of mechatronics based on torque motor control algorithm
- Special Issue: Nonlinear Engineering’s significance in Materials Science
- Experimental research on the degradation of chemical industrial wastewater by combined hydrodynamic cavitation based on nonlinear dynamic model
- Study on low-cycle fatigue life of nickel-based superalloy GH4586 at various temperatures
- Some results of solutions to neutral stochastic functional operator-differential equations
- Ultrasonic cavitation did not occur in high-pressure CO2 liquid
- Research on the performance of a novel type of cemented filler material for coal mine opening and filling
- Testing of recycled fine aggregate concrete’s mechanical properties using recycled fine aggregate concrete and research on technology for highway construction
- A modified fuzzy TOPSIS approach for the condition assessment of existing bridges
- Nonlinear structural and vibration analysis of straddle monorail pantograph under random excitations
- Achieving high efficiency and stability in blue OLEDs: Role of wide-gap hosts and emitter interactions
- Construction of teaching quality evaluation model of online dance teaching course based on improved PSO-BPNN
- Enhanced electrical conductivity and electromagnetic shielding properties of multi-component polymer/graphite nanocomposites prepared by solid-state shear milling
- Optimization of thermal characteristics of buried composite phase-change energy storage walls based on nonlinear engineering methods
- A higher-performance big data-based movie recommendation system
- Nonlinear impact of minimum wage on labor employment in China
- Nonlinear comprehensive evaluation method based on information entropy and discrimination optimization
- Application of numerical calculation methods in stability analysis of pile foundation under complex foundation conditions
- Research on the contribution of shale gas development and utilization in Sichuan Province to carbon peak based on the PSA process
- Characteristics of tight oil reservoirs and their impact on seepage flow from a nonlinear engineering perspective
- Nonlinear deformation decomposition and mode identification of plane structures via orthogonal theory
- Numerical simulation of damage mechanism in rock with cracks impacted by self-excited pulsed jet based on SPH-FEM coupling method: The perspective of nonlinear engineering and materials science
- Cross-scale modeling and collaborative optimization of ethanol-catalyzed coupling to produce C4 olefins: Nonlinear modeling and collaborative optimization strategies
- Unequal width T-node stress concentration factor analysis of stiffened rectangular steel pipe concrete
- Special Issue: Advances in Nonlinear Dynamics and Control
- Development of a cognitive blood glucose–insulin control strategy design for a nonlinear diabetic patient model
- Big data-based optimized model of building design in the context of rural revitalization
- Multi-UAV assisted air-to-ground data collection for ground sensors with unknown positions
- Design of urban and rural elderly care public areas integrating person-environment fit theory
- Application of lossless signal transmission technology in piano timbre recognition
- Application of improved GA in optimizing rural tourism routes
- Architectural animation generation system based on AL-GAN algorithm
- Advanced sentiment analysis in online shopping: Implementing LSTM models analyzing E-commerce user sentiments
- Intelligent recommendation algorithm for piano tracks based on the CNN model
- Visualization of large-scale user association feature data based on a nonlinear dimensionality reduction method
- Low-carbon economic optimization of microgrid clusters based on an energy interaction operation strategy
- Optimization effect of video data extraction and search based on Faster-RCNN hybrid model on intelligent information systems
- Construction of image segmentation system combining TC and swarm intelligence algorithm
- Particle swarm optimization and fuzzy C-means clustering algorithm for the adhesive layer defect detection
- Optimization of student learning status by instructional intervention decision-making techniques incorporating reinforcement learning
- Fuzzy model-based stabilization control and state estimation of nonlinear systems
- Optimization of distribution network scheduling based on BA and photovoltaic uncertainty
- Tai Chi movement segmentation and recognition on the grounds of multi-sensor data fusion and the DBSCAN algorithm
- Special Issue: Dynamic Engineering and Control Methods for the Nonlinear Systems - Part III
- Generalized numerical RKM method for solving sixth-order fractional partial differential equations