Intelligent implementation of muscle strain identification algorithm in Mi health exercise induced waist muscle strain
-
Wei Hu
 ,
Hao Zhong
,
Hao Zhong

Abstract
Due to the need for doctors to assist in making treatment strategies for the diagnosis results of B-ultrasound medical images, the diagnostic efficiency is relatively low. In order to improve the accuracy and efficiency of identifying lumbar muscle strain, based on the You Only Look Once version 3 algorithm, an intelligent recognition filtering algorithm combining sliding window and histogram of oriented gradient features is proposed to avoid misdiagnosis caused by artifact interference. The results show that the proposed algorithm has an accuracy of 95.2% and a recall rate of 94.7% when applied to hospital standard equipment. The proposed algorithm can effectively reduce the possibility of misdiagnosis and improve the reliability of clinical diagnosis. At the same time, this algorithm can effectively identify cases of lumbar muscle strain, reduce missed diagnosis, and ensure that patients can receive timely treatment. The proposed algorithm has an F1 score of 94.9% for standard devices, 95.7% for high-resolution devices, and 93.4% for mobile ultrasound devices. This algorithm can maintain good recognition performance on different devices and has strong adaptability. This algorithm can be widely applied in the ultrasound diagnosis of lumbar muscle strains in hospitals, providing effective decision support for doctors and ensuring that patients can receive the necessary medical services in a timely manner. Meanwhile, it provides important support for precision medicine and personalized treatment in the medical field, which is expected to improve the health and life quality of patients.
1 Introduction
Mi health exercise can enhance body coordination and flexibility. However, excessive exercise or forced training without sufficient warm-up can lead to waist muscle strain (WMS). WMS refers to muscle or tendon damage caused by excessive or incorrect use of lower back muscles. Early and accurate identification of muscle strains is crucial for effective intervention and prevention of further damage [1]. In current clinical practice, the identification of WMS mainly relies on the experience and subjective evaluation of doctors. This manual recognition method is easily influenced by factors such as doctor experience and fatigue level, which may lead to misdiagnosis or missed diagnosis. The current You Only Look Once version 3 (Yolov3) object detection method has the problem of low accuracy in processing B-ultrasound images, and may not be able to accurately identify the specific location and degree of damage. Yolov3 can only serve as a preliminary identification tool and has certain limitations in terms of high precision and efficient diagnosis [2]. The histogram of oriented gradient (HOG) feature is a feature descriptor used for object detection in computer vision and image processing. HOG features are constructed by calculating and statistically analyzing the gradient direction histograms of local regions in an image, mainly used for object detection and recognition. Sliding window (SW) and HOG feature descriptors are a commonly used combination of techniques for object detection and recognition in image processing and computer vision [3]. Due to the problem of artifact interference that traditional YOLOv3 methods are prone to when processing B-ultrasound images, an innovative research proposes a hierarchical intelligent recognition method based on YOLOv3 by combining SW and HOG features. This innovative method can greatly improve the diagnostic accuracy of WMS while ensuring efficiency, effectively reducing misdiagnosis and missed diagnosis. The research aims to provide a more efficient and accurate WMS diagnostic method, providing a new approach for intelligent diagnosis of medical impact and promoting the development of precision medicine. This research mainly includes the following content. Section 2 is a review of medical image recognition technology and Yolov3 related research. Section 3 introduces the intelligent implementation of WMS recognition algorithm combining Yolov3 and HOG features. Section 3.1 is based on Yolov3 for WMS detection and recognition. Section 3.2 is the WMS filtering method for SW and HOG features. Section 4 is the analysis of the intelligent implementation results of the WMS recognition algorithm that integrates Yolov3 and HOG features. Section 4.1 is about the WMS recognition and detection performance based on Yolov3. Section 4.2 shows the WMS filtering effect of SW and HOG features. Section 5 is the conclusion of intelligent implementation of WMS recognition algorithm combining Yolov3 and HOG features.
2 Related works
In current medicine, image recognition technology is an important research direction. Some researchers have conducted extensive research on disease prevention and personalized treatment. Yang et al. developed an automatic image recognition software to evaluate slit lamp photos at different magnifications for measuring tear meniscus height. This software had good effectiveness and high accuracy [4]. Gu et al. constructed a learning framework for metastasis to improve the diagnostic efficiency of epithelial cancer. This method learned the distinguishing features of a single confocal laser endoscopic framework. The variable length and irregular shape processing of feature concatenation was carried out, indicating that the accuracy of the framework was 84.1% [5]. Dourado et al. developed a framework for open medical Internet of Things to address the online medical image recognition. This method analyzed images of cerebrovascular accidents, pulmonary nodules, and skin. This framework had an accuracy rate of 92% and had a certain reliability and effectiveness [6]. To classify COVID-19 in chest X-ray images, Abbas et al. proposed a convolutional neural network (CNN) for decomposition, transfer, and synthesis. Any irregularity in the image dataset was processed, and the accuracy of this method was 93.1% [7]. Zhang et al. aimed at the effective diagnosis of carotid atherosclerosis disease, used geodesic star constraint graph to cut and segment lumen boundaries to improve the accuracy, and recognized the lumen through support vector machine. This method had certain accuracy and flexibility [8]. Valkonen et al. designed a digital mask for automatic epithelial cell detection using deep CNN to facilitate the diagnosis of breast cancer. The visual evaluation of images achieved good differentiation of epithelial cells, indicating the practicality and effectiveness of this method [9].
Yolov3 has great application value in video surveillance, traffic detection, and medical image analysis. Various researchers have studied this topic. Wang and Liu designed a Yolov3 combined with hybrid dilated convolution method to address background noise in the recognition of partially occluded targets in complex backgrounds. The increase in parameter quantity was suppressed, and the system’s recognition ability for occluded targets was improved, indicating that the accuracy of this method was 90.36% [10]. Cao et al. used MobileNet and spatial pyramid pooling to improve Yolov3 for identifying microalgae species, reducing positional errors in detecting small targets and enhancing detection performance. The average accuracy of this method was 98.90% [11]. Jia et al. developed an improved Yolov3 network to enhance the model’s generalization ability to pixel features for the detection of abnormal cervical cells. The sensitivity of this network was improved, indicating a mAP rate of 78.87% [12]. Zou et al. used Yolov3 and CNN encoders to detect and extract license plate positions for license plate detection and recognition. Accurate positioning and character recognition were achieved, indicating that this method performed well [13]. Chun et al. focused on the face detection problem in complex environments and used Yolov3 to search for classification datasets and set score values to find prior boxes. Multiple sets of images were predicted and the optimal score value was found, indicating that this method had good performance [14]. Taheri Tajar et al. developed a lightweight Tiny Yolov3 vehicle detecting method to recognize, locate, and classify vehicles in video sequences. After pruning, simplifying training, and eliminating unnecessary layers, the MAP of this method reached 95.05% [15].
In summary, the current medical image recognition technology has made remarkable progress. However, there are still some challenges and limitations. To enhance the WMS medical image recognition’s accuracy and efficiency, an intelligent recognition algorithm for Yolov3 and HOG features is designed. The aim of this study is to expand the application of intelligent algorithms in disease diagnosis, treatment planning, and surgical assistance, in combination with clinical practical needs.
3 Yolov3 combined with HOG feature WMS intelligent detection algorithm design
This study achieves detection and recognition of WMS medical images based on Yolov3. Simultaneously combining SW and HOG features, a WMS filtering method is determined to ensure intelligent recognition of WMS medical images. The workflow of the proposed algorithm is shown in Figure 1.
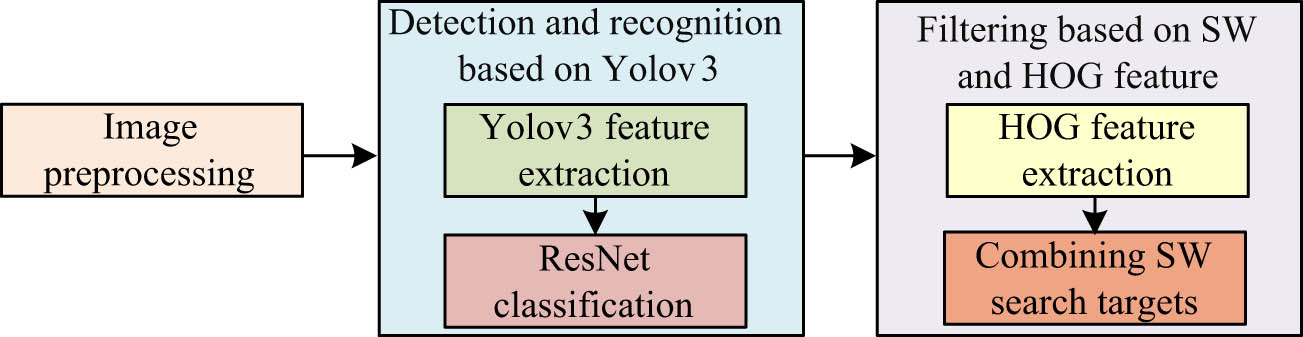
The workflow of the proposed algorithm.
3.1 Detection and recognition of WMS based on Yolov3
The general method for examining WMS caused by Mi health exercise is for doctors to press on the patient’s lower back and perform B-ultrasound examination on the tenderness points. For the obtained B-ultrasound images, the study chose to extract key feature information through the Yolov3 algorithm to achieve preliminary recognition of WMS. The advantage of this method is that it can recognize multiple targets simultaneously and has high accuracy and real-time performance. Figure 2 shows the WMS recognition algorithm.

Identification process of WMS.
In Figure 2, in the object detection network, the collected B-ultrasound images are received as input, and low confidence and high confidence regions are filtered out. In the filtering network, low confidence regions and reference regions are input and filtered again. The ultimate goal is to obtain the area and high confidence areas after re-filtering, where the high confidence areas are the recognition regions that still meet the confidence threshold after filtering. Yolov3 is selected for preliminary identification, and its backbone network structure is Darknet-53. Darknet-53 mainly has convolutional layers, residual modules, and fully connected layers. The design of Darknet-53 draws inspiration from ResNet and DenseNet, with a deeper network structure and stronger feature extraction capabilities. This enables Yolov3 to better capture semantic information in images and improve the object detecting accuracy [16]. Compared to Yolov2, Yolov3 has changes in using residual models and the Feature Pyramid Network (FPN) for multi-scale object detection. Yolov3’s feature extractor is a residual model, containing 53 convolutional layers. Compared to Darknet-19, which uses residual units, Yolov3 is able to construct deeper structures. Figure 3 shows the Yolov3 network structure.
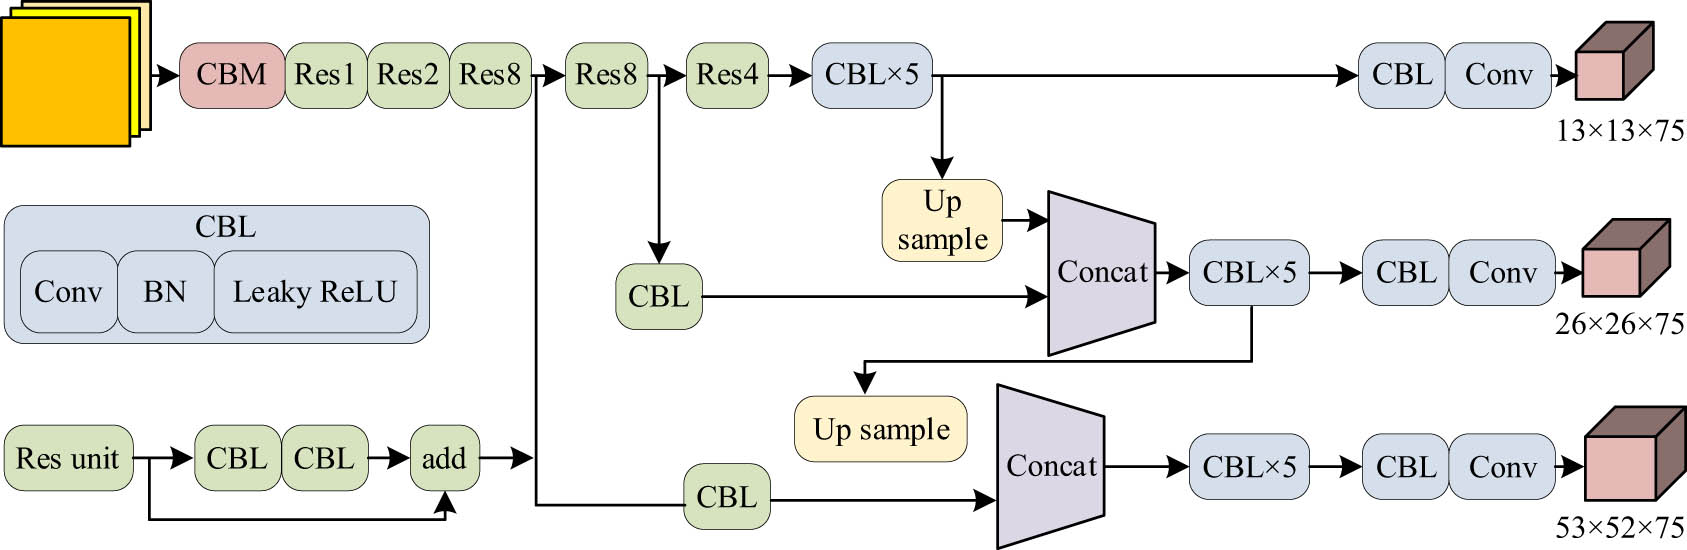
Schematic diagram of Yolov3 network structure.
In Figure 3, input a B-ultrasound image with a size of 544 × 544, and the Yolov3 network extracts feature maps of different scales and fuses them with the upsampled feature maps to output three predicted feature maps of different sizes. Yolov3 mostly has convolutional layers, batch processing, and Leaky ReLU activation functions, namely, CBL blocks. Leaky ReLU can prevent neuronal necrosis in the ReLU function. The initialization neuron selects a small value similar to 0.01 to ensure that ReLU remains active in the negative region. There are three prediction layers, and candidate boxes are evenly allocated to each prediction layer. Each candidate box information includes a tensor of bounding box position and confidence, as well as target category information. The loss function of Yolov3 includes candidate box position loss
where
where
where
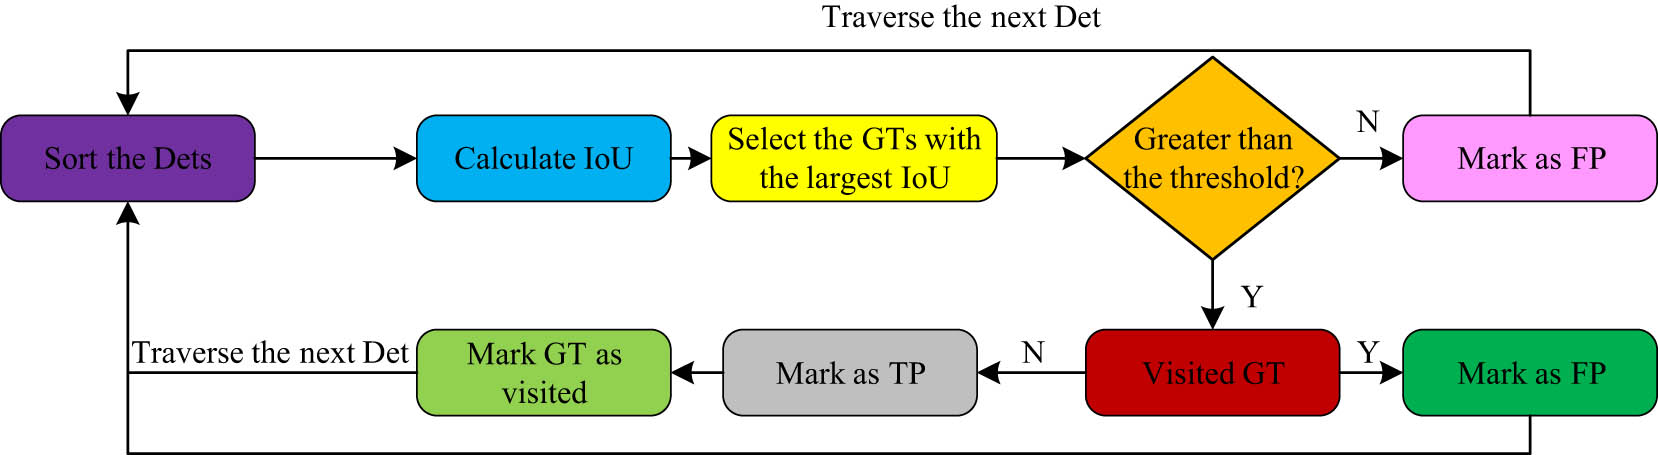
Schematic diagram of the AP value solving process.
In Figure 4, the evaluation of object detection requires the predicted box and corresponding true label box for each image. For each image, the true label values (GTs) mainly include the four true values of the border position and the object category. Its predicted values (Dets) mainly include four predicted values: confidence, object category, and border position. By determining Dets and the actual GTs, AP can be calculated.
3.2 Method for filtering WMS based on SW and HOG features
In the WMS recognition process, the target detection network preliminarily identifies the possible strain areas of each muscle ultrasound image, and then filters the low confidence areas in the target detection network again through a filtering network. HOG is a method used to describe images’ local texture features. It divides the image into small local regions and calculates the gradient direction histogram within each region. These histograms can represent the texture features of local regions, used to represent the shape and appearance of the target object. Figure 5 shows the HOG feature extraction.

Schematic diagram of the HOG feature extraction process.
In Figure 5, the image is first pre-processed in the detection window, and then normalized to increase data diversity and prevent overfitting. After completing the gradient calculation, each block is projected with a specified weight, and the overlapping blocks are normalized for contrast. The histogram vectors within all blocks are combined to form HOG feature vectors. The horizontal and vertical gradients of pixels with position
where
The direction of gradient values is represented by Eq. (6).
Considering the unsigned range limitation in the gradient direction, the gradient direction is represented by Eq. (7).
In order to ensure consistency between the candidate area and its corresponding reference area in spatial location, the study chose to add SW to search for reference areas. SW is a search technique used to move a fixed size window in an image and perform object detection at each position. This window is usually rectangular, but its shape and size are arbitrary. At each position in SW, to determine the presence of the target object, feature extraction and classification are performed on the image regions within the window. SW is a search technique used to move a fixed size window in an image and perform object detection at each position. This window is usually rectangular, but its shape and size are arbitrary. At each position in SW, to determine the presence of the target object, feature extraction and classification are performed on the image regions within the window. When using SW and HOG feature descriptors for object detection, first define a fixed size window, and then slide this window to each position in the image. At each position, the image area within the window will be used to extract HOG feature descriptors. The classifier determines the presence of the target object in the window based on the trained model and provides corresponding discrimination results. The combination of SW and HOG feature descriptors can effectively search for target objects in images. Train the HOG feature extractor and SW to extract effective features from the detected regions. Figure 6 shows the WMS medical image reference and candidate regions.
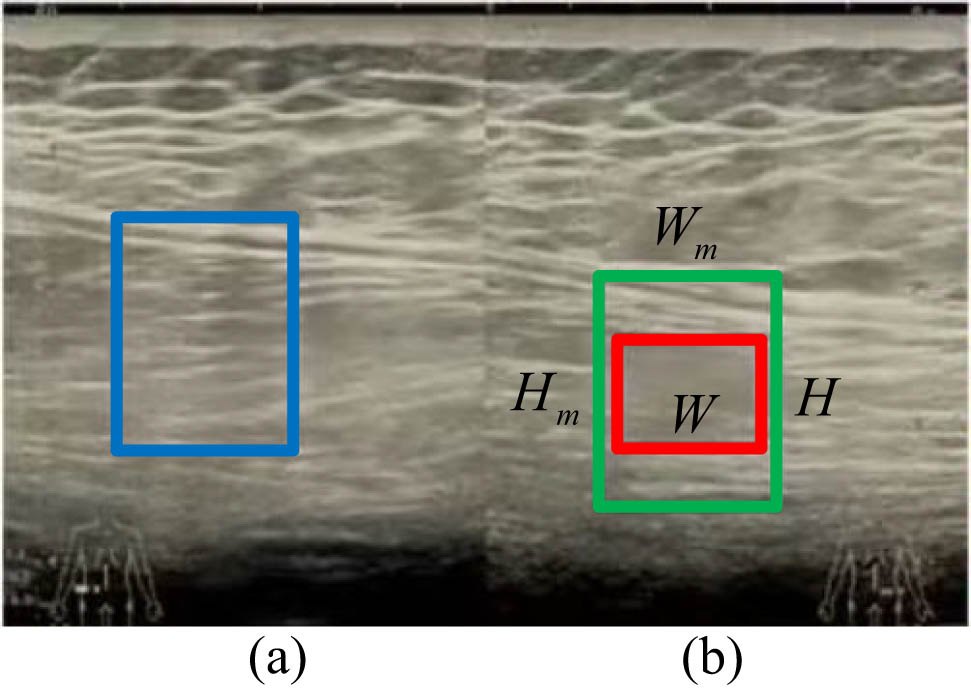
Candidate area (a) and reference area (b) for damaged areas.
In Figure 6, the red box in the reference area expands outward to a green box. The height of the outward expansion is twice the blue box’s height
where h
m refers to the green box’s height magnification in the reference area on the candidate area’s height.
where w
m is a magnification factor of the green box’s width in the reference area on the width of the candidate area.
where
After the initial recognition network of Yolov3, as well as the training and testing of HOG features and SW filtering networks, the best integrated model was obtained. The integrated model is jointly trained and optimized to identify the strain area in medical images of lumbar muscle strain, ensuring the efficiency and accuracy of the overall algorithm. Input WMS image samples
where
4 Performance analysis of WMS recognition system based on multimodal features
The study separately tested the WMS recognition performance based on Yolov3 and the WMS filtering performance combining SW and HOG features, and finally validated the Yolov3 HOG algorithm.
4.1 Recognition and detection effect of WMS based on Yolov3
This study conducted experiments on object detection and filtering networks on a server in the laboratory. This experiment was conducted using the CentOS Linux release 7.6.1810 system, with Intel Xeon E5-2683 v3 CPU processor, NVIDIA Geforce GTX 1080 GPU, Python 3.7.9, MXnet 1.7.0 installation, and Adam optimization algorithm. The training and testing sets were divided into 80 and 20%, respectively. The input image size is 544 × 544, the batch size value for training is 20, the iteration is 400, the weight attenuation is 0.0005, and the momentum is 0.9. This study selected the COCO dataset to determine the research method’s detecting effectiveness. Figure 7 shows the mAP results of five detections and the training loss changes under different learning rates.
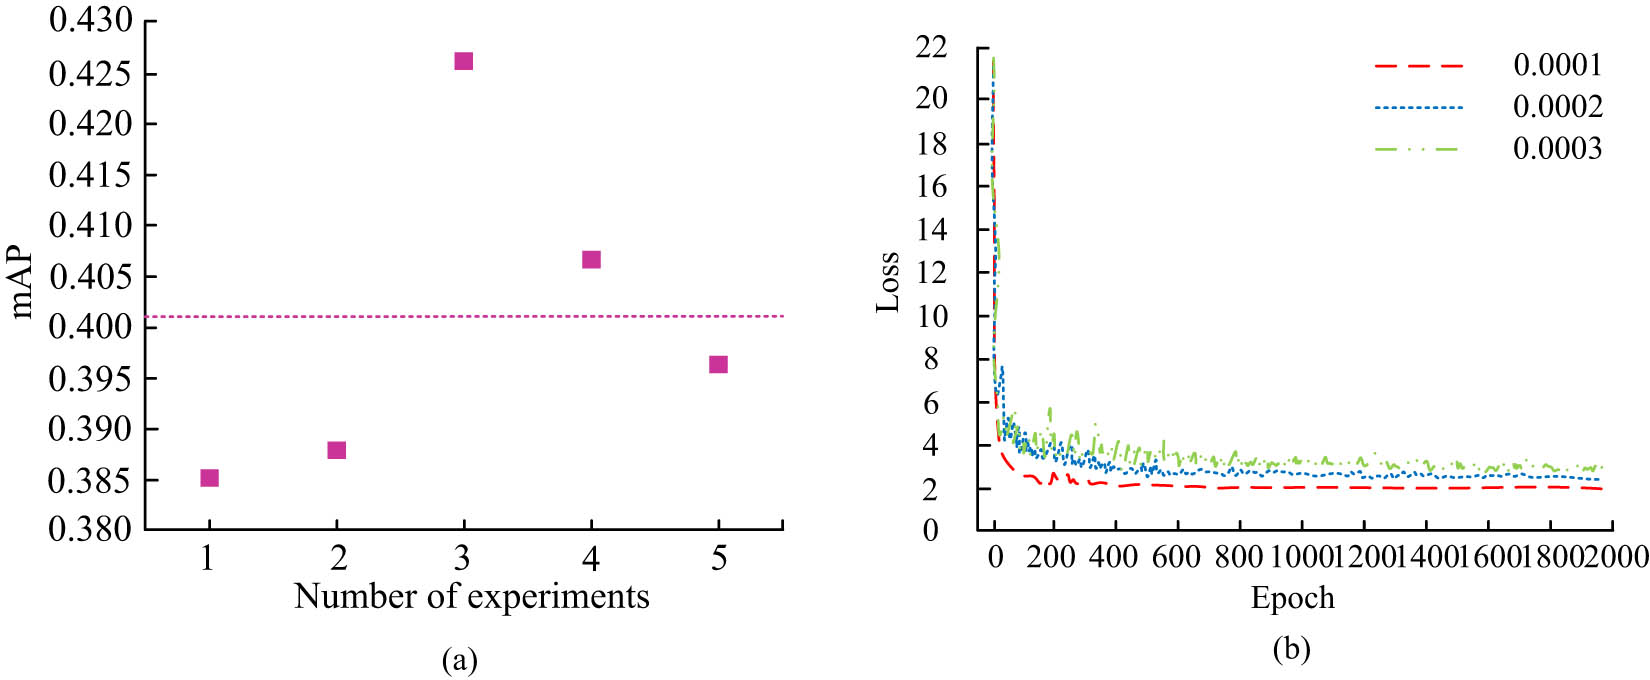
The detection effect of the research method. (a) mAP comparison. (b) The value of the loss at different learning rates.
In Figure 7(a), the mAP was 0.4006, indicating that Yolov3 had a good ability to detect WMS regions. In Figure 7(b), regardless of the learning rate, the loss curve decreased rapidly before five iterations. When the learning rate was 0.0001, the convergence loss was about 2.1, and the change curve was relatively smooth, indicating a relatively stable convergence. When the learning rate was 0.0002, the convergence loss was approximately 2.8. When the learning rate was 0.0003, the convergence loss was about 3.0, and the change curve was relatively smooth. Therefore, when the learning rate was 0.0001, the algorithm performance improved significantly. To verify the training and testing sets of Yolov3, all other experimental settings were kept consistent and compared with Yolov2. Figure 8 shows a comparison of accuracy results.
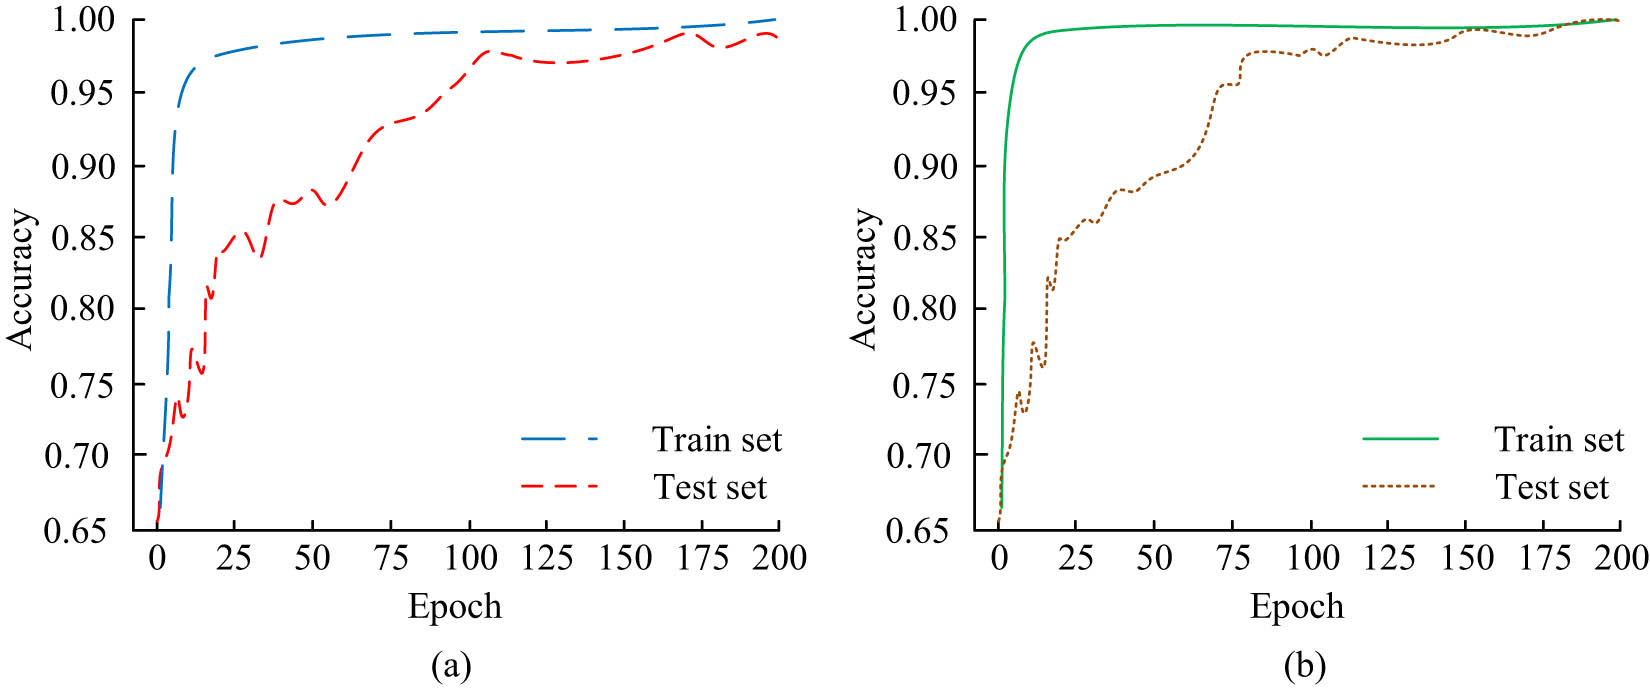
Accuracy results for different model training sets and test sets. (a) Yolov2. (b) Yolov3.
In Figure 8(a), the accuracy in the Yolov2 training set was 98.73%. There was an abnormal improvement in the curve changes during 75 iterations in the test set, considering the randomness of these detection results. In Figure 8(b), the accuracy value in the Yolov3 training set was 99.25%. The convergence was achieved with an accuracy value of 93.42% in the test set, indicating good detection performance of Yolov3.
4.2 WMS comprehensive model filtering effect
In the test, to ensure that the reference area green box’s height and width range were appropriate, this experimental settings were
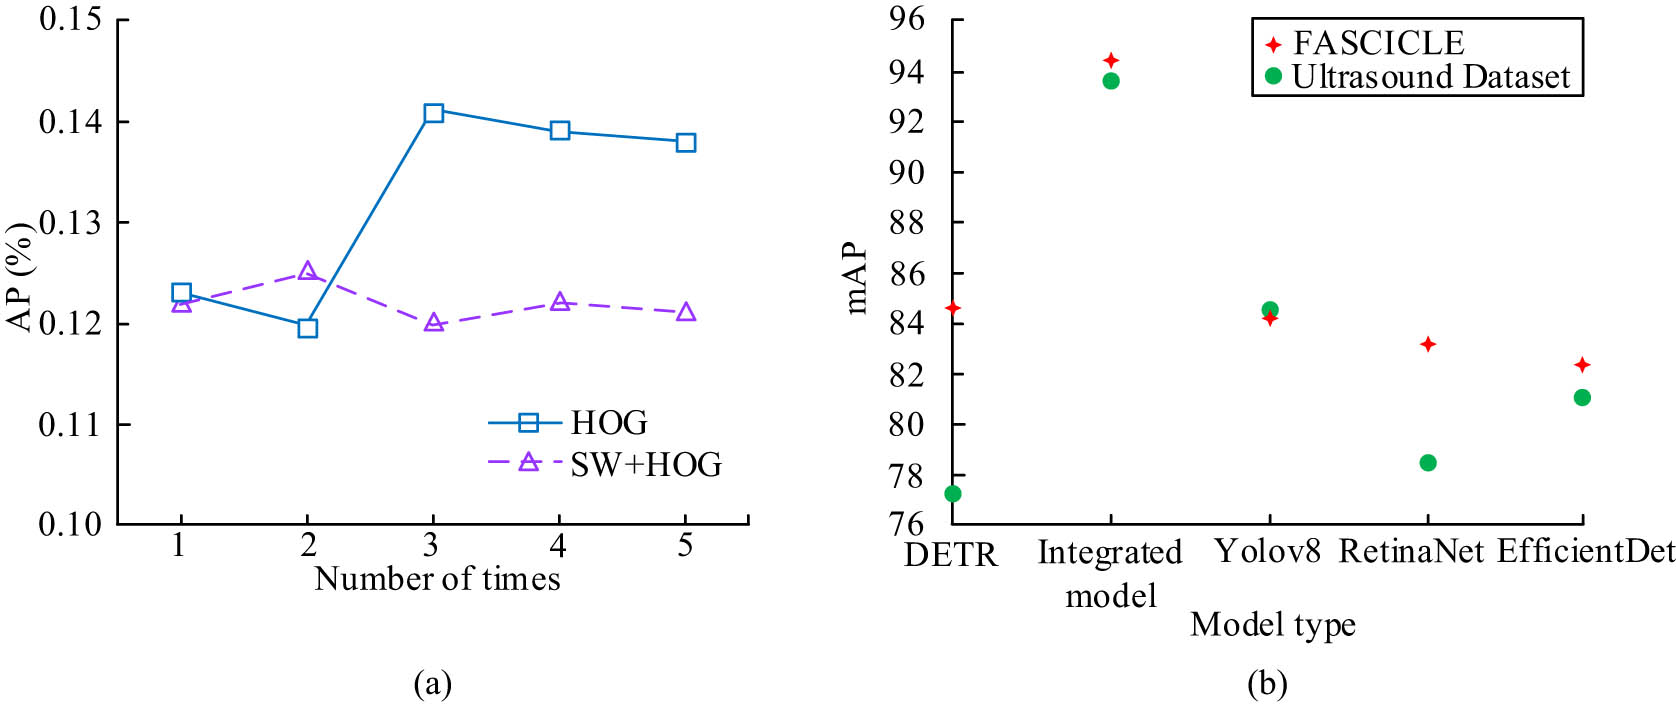
Comparison of AP loss value and mAP result. (a) Comparison of AP. (b) Comparison of different datasets.
In Figure 9(a), the multiple detection AP of SW and HOG features on the image was 82.5%, indicating that this method had high accuracy in detecting the position and shape of the target in the image. Compared to HOG features, the missed detection rate of SW and HOG features was relatively low, with an average of 0.122% of targets mistakenly judged as undetected. The measurement results showed little variation under different frequencies and were relatively stable. Multiple uses of HOG features for detection could yield consistent results, which had certain reliability and stability. In Figure 9(b), the comprehensive model has the highest mAP on the Ultrasound Dataset and FASCICLE, with values of 93.6 and 94.5%, respectively. Compared to Yolov8, the SW of the integrated model can supplement Yolov3's blind spot in detecting small targets. In both datasets, the HOG features of the integrated model excel at capturing local texture and edge information. The YOLOv8 model is relatively advanced, but it requires high device configuration and large memory, making it unsuitable for detecting image details. The Yolov2 model has the smallest mAP on the Ultrasound Dataset, only 77.7%. But RetinaNet model training is slow and the computation time is long. To achieve preliminary detection and classification of WMS, the integrated model was pre-trained on the dataset. Figure 10 shows the training accuracy and loss variation curves obtained.
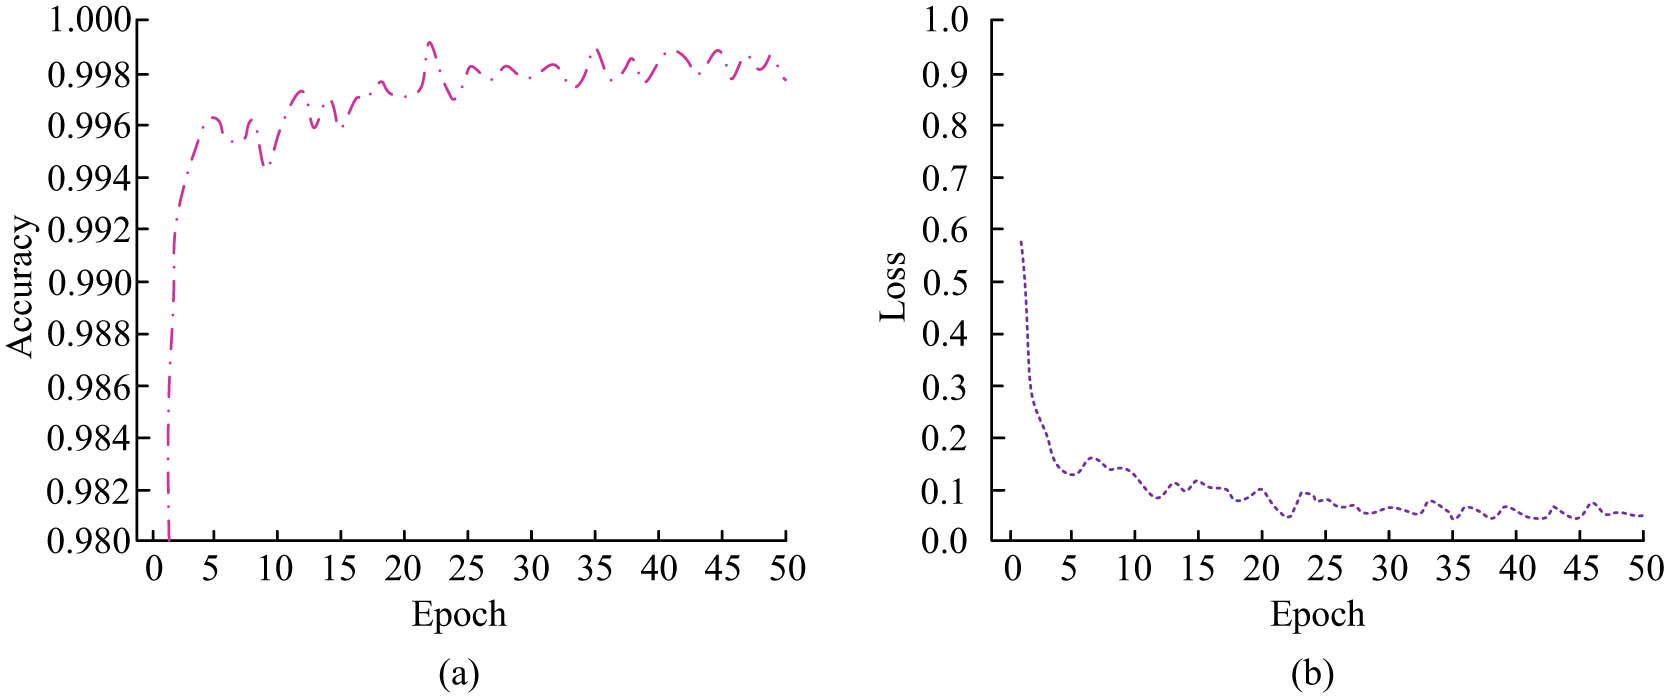
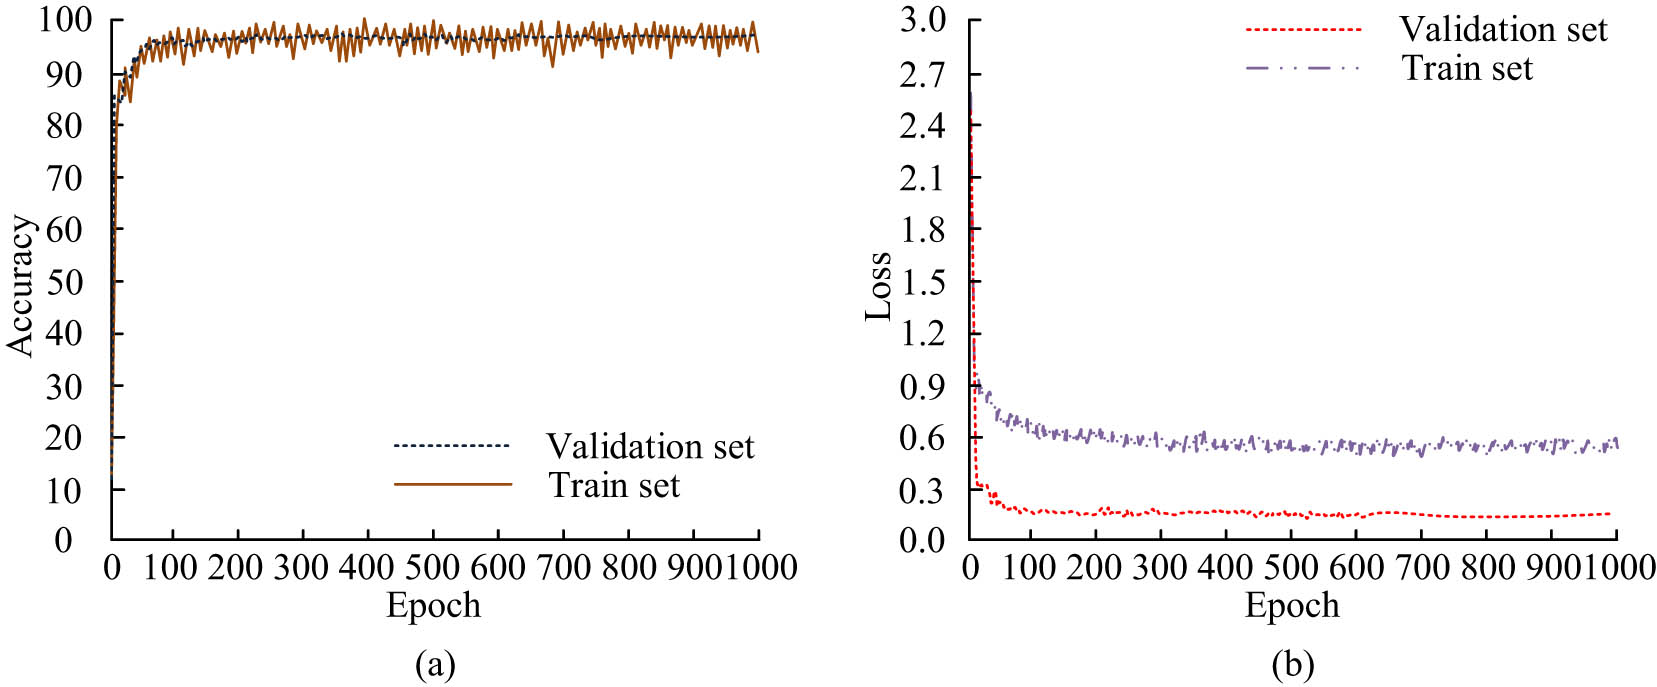
Training accuracy and loss curves. (a) Training accuracy. (b) Training loss.
In Figure 10(a), the accuracy of the Yolov3-HOG model improves rapidly after five iterations, and the model begins to effectively learn features from the data. Due to the adaptability of the model to changes in data distribution and characteristics during the gradual optimization process, it exhibits fluctuating changes within 50 iterations. At 35 iterations, the accuracy of the model began to steadily increase and eventually reached a high accuracy of 99.80% at the 35th iteration. At this point, the training of the model is approaching convergence and can stably perform high-precision WMS detection. The change in the loss curve in Figure 10(b) can further validate the effectiveness of the model. In the early stages of training, the loss value rapidly decreases, and the model can quickly optimize and reduce prediction errors in the initial stage. At 35 iterations, the loss value converged to 0.006. At this point, the model has fully learned the features of the data and has strong generalization ability. To verify the integrated model’s effectiveness, the detection and filtering network Yolov3 HOG was compared with Faster R-CNN, U-Net, and EfficientDet detection networks. The training and validation accuracy of different models are compared in Figure 11.
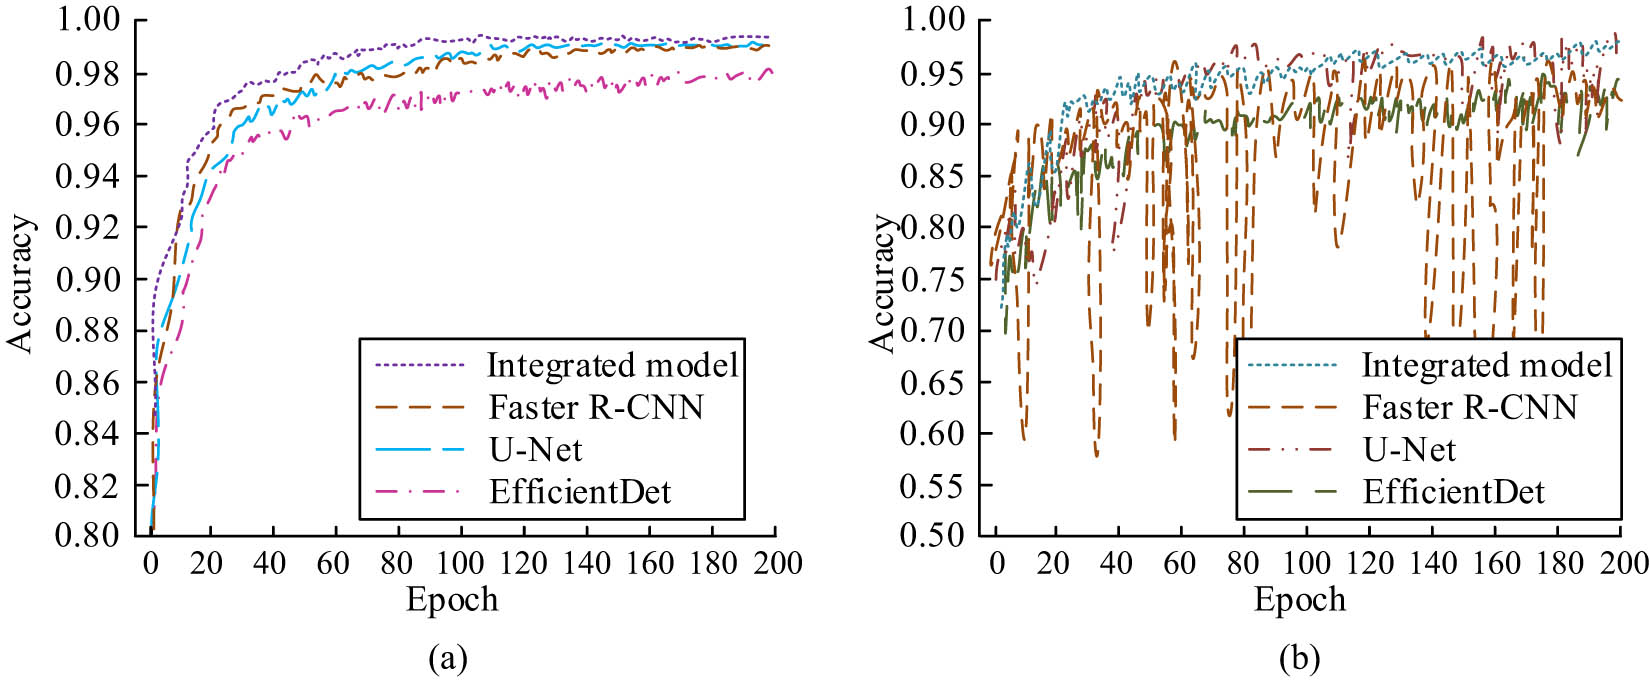
Comparison of training and validation accuracy. (a) Training accuracy. (b) Verify accuracy.
In Figure 11(a), the training accuracy of the integrated model showed little fluctuation and was relatively stable, with an accuracy of 98.25%, indicating the best performance. Faster R-CNN, U-Net, and EfficientDet were 97.17, 97.58, and 96.73%, respectively. In Figure 11(b), the validation accuracy of the integrated model was 97.63%, indicating the best generalization performance. However, Faster R-CNN exhibited significant fluctuations in validation accuracy due to excessive noise and exhibited an unstable state as iterations increased. The validation accuracy curves of U-Net and EfficientDet models were relatively stable, with validation accuracies of 91.64 and 94.63%, respectively. Table 1 presents the
Comparison of various types of loss values for different models
| Model | Integrated model | Faster R-CNN | U-Net | EfficientDet |
|---|---|---|---|---|
|
|
0.0270 | 0.0269 | 0.0271 | 0.0272 |
|
|
0.0338 | 0.0341 | 0.0344 | 0.0341 |
|
|
0.0067 | 0.0070 | 0.0068 | 0.0069 |
| Total losses | 0.0676 | 0.0681 | 0.0684 | 0.0683 |
In Table 1, the integrated model had the smallest
Accuracy and loss results of the integrated model. (a) Accuracy comparison. (b) Loss comparison.
In Figure 12(a), when the iteration was 10, the accuracy rapidly improved. At this point, the integrated model had a faster learning speed. The reason is that HOG features further enhance the model’s ability to understand the shape and texture of objects in the image. The accuracy showed significant fluctuations in the training set, which was relatively smooth in the other set. The integrated model’s accuracy in the validation set was 97.63%. In Figure 12(b), the integrated model loss curve was relatively smooth in the validation set, converging to a final loss value of 0.16, indicating good generalization ability. The fluctuation in the training set was significant because the model was in a learning state and its parameters were constantly adjusted to adapt to the training data. It gradually converged after 100 iterations, and the final loss value was 0.58.
The study chose to collect 1,000 ultrasound image data from different hospitals and equipment, including samples of patients of different ages, genders, and body types. Before conducting model training, the image data underwent standardized processing steps such as resizing, denoising, and enhancement. In order to ensure data quality, all images have undergone strict screening and inspection, removing some low-quality images caused by equipment failures, image blurring, or patient movement. All filtered images meet the standards to ensure data consistency during the training process. Divide the training and testing sets in a 4:1 ratio. The proposed algorithm is applied to practical medical assistance, and WMS diagnosis is performed on standard equipment, high-resolution equipment, and mobile B-ultrasound equipment, respectively. The evaluation index results obtained are shown in Table 2.
Test results
| Equipment | Standard equipment | High resolution equipment | Mobile B-ultrasound equipment |
|---|---|---|---|
| Accuracy | 0.952 | 0.961 | 0.938 |
| Recall | 0.947 | 0.954 | 0.931 |
| F1 score | 0.949 | 0.957 | 0.934 |
In Table 2, the accuracy of the proposed algorithm in recognizing B-ultrasound image data in different devices exceeds 90%, indicating that the algorithm exhibits good scalability and adaptability. Under high-resolution equipment, the proposed algorithm achieved the highest accuracy of 96.1%, indicating that high-quality imaging equipment can further enhance the recognition ability of the algorithm.
5 Conclusion
This study designed an intelligent recognition algorithm for Yolov3 and HOG features to enhance WMS medical image recognition’s accuracy and efficiency. Among these results, the mAP of Yolov3 detection method was 0.4006, indicating its good ability to detect WMS regions. The proposed model has good performance during the training phase, with a training accuracy of 98.25%. The training accuracies of Faster R-CNN, U-Net, and EfficientDet are 97.17, 97.58, and 96.73%, respectively, all lower than the proposed models. In comparison, the proposed models improved by 1.08, 0.67, and 1.52%, respectively. In terms of validation accuracy, the proposed model still has the highest accuracy compared to other models, reaching 96.81%. This result is not only higher than the volatility validation accuracy of Faster R-CNN, but also significantly better than U-Net’s 91.64% and EfficientDet’s 94.63%. The proposed model has stronger generalization ability and stability when dealing with complex data. This indicated that the accuracy and efficiency of the proposed model were improved in WMS medical image recognition. This method has important clinical significance and can provide medical professionals with more efficient and accurate diagnostic tools, thereby shortening diagnosis time, reducing human errors, and ultimately improving patient treatment outcomes. However, due to the short experimental time, the study did not use Transformer or graph neural network architectures to process complex image data. Meanwhile, the real-time implementation of the model also faces challenges of data transmission and processing delays. In medical settings, timely diagnosis is crucial for the treatment of patients. In the future, integration methods of different models can be considered to promote the development of precision medicine. And optimize data flow and processing flow to reduce latency and improve response speed.
-
Funding information: Authors state no funding involved.
-
Author contributions: Wei Hu: Wei Hu is the primary author and corresponding author of this study. He contributed significantly to the conceptualization, methodology, and overall design of the research. He also took the lead in data analysis and manuscript writing. Hao Zhong: Hao Zhong contributed to the data collection and analysis process. He also assisted in the development of the research framework and in the writing and revision of the manuscript. Changyong Wang: Changyong Wang contributed to the literature review and helped refine the methodology. He also played a key role in reviewing and editing the manuscript for clarity and consistency. All authors have accepted responsibility for the entire content of this manuscript and approved its submission.
-
Conflict of interest: Authors state no conflict of interest.
-
Data availability statement: All data generated or analyzed during this study are included in this published article.
References
[1] Li YJ, Zhuang WS, Cai XG, Yang Y, Han MM, Zhang DW. Effect of acupuncture at “three points of iliolumbar” on lumbar function and pain in patients with iliopsoas muscle strain. Zhongguo Zhen jiu = Chin Acupunct Moxibustion. 2019;39(12):1279–82.Suche in Google Scholar
[2] Khan D, Pandey A, Kumar PR, Khan S. Analysis of human detection system. Ann Rom Soc Cell Biol. 2021;25(6):7239–45.Suche in Google Scholar
[3] Talukdar RG, Mukhopadhyay KK, Dhara S, Gupta S. Numerical analysis of the mechanical behaviour of intact and implanted lumbar functional spinal units: Effects of loading and boundary conditions. Proc Inst Mech Eng Part H: J Eng Med. 2021;235(7):792–804.10.1177/09544119211008343Suche in Google Scholar PubMed
[4] Yang J, Zhu X, Liu Y, Jiang X, Fu J, Ren X, et al. TMIS: a new image-based software application for the measurement of tear meniscus height. Acta Ophthalmol. 2019;97(7):e973–80.10.1111/aos.14107Suche in Google Scholar PubMed
[5] Gu Y, Vyas K, Yang J, Yang GZ. Transfer recurrent feature learning for endomicroscopy image recognition. IEEE Trans Med Imaging. 2019;38(3):791–801.10.1109/TMI.2018.2872473Suche in Google Scholar PubMed
[6] Dourado CMJM, Silva SPPD, Nobrega RVMD, Filho PPR, Muhammad K, Albuquerque VHCD. An open IoHT-based deep learning framework for online medical image recognition. IEEE J Sel Areas Commun. 2021;39(2):541–8.10.1109/JSAC.2020.3020598Suche in Google Scholar
[7] Abbas A, Abdelsamea M, Gaber MM. Classification of COVID-19 in chest X-ray images using DeTraC deep convolutional neural network. Appl Intell. 2021;51(2):854–64.10.1007/s10489-020-01829-7Suche in Google Scholar PubMed PubMed Central
[8] Zhang J, Teng Z, Guan Q, He J, Abutaleb W, Patterson AJ, et al. Automatic segmentation of MR depicted carotid arterial boundary based on local priors and constrained global optimisation. IET Image Process. 2019;13(3):506–14.10.1049/iet-ipr.2018.5330Suche in Google Scholar
[9] Valkonen M, Isola J, Ylinen O, Muhonen V, Saxlin A, Tolonen T, et al. Cytokeratin-supervised deep learning for automatic recognition of epithelial cells in breast cancers stained for ER, PR, and Ki-67. IEEE Trans Med Imaging. 2020;39(2):534–42.10.1109/TMI.2019.2933656Suche in Google Scholar PubMed
[10] Wang K, Liu M. YOLOv3-MT: A YOLOv3 using multi-target tracking for vehicle visual detection. Appl Intell. 2022;52(2):2070–91.10.1007/s10489-021-02491-3Suche in Google Scholar
[11] Cao M, Wang J, Chen Y, Wang Y. Detection of microalgae objects based on the Improved YOLOv3 model. Environ Sci: Process Impacts. 2021;23(10):1516–30.10.1039/D1EM00159KSuche in Google Scholar PubMed
[12] Jia D, He Z, Zhang C, Yin W, Wu N, Li Z. Detection of cervical cancer cells in complex situation based on improved YOLOv3 network. Multimed Tools Appl. 2022;81(6):8939–61.10.1007/s11042-022-11954-9Suche in Google Scholar
[13] Zou Y, Zhang Y, Yan J, Jiang X, Huang T, Fan H, et al. License plate detection and recognition based on YOLOv3 and ILPRNET. Signal Image Video Process. 2022;16(2):473–80.10.1007/s11760-021-01981-8Suche in Google Scholar
[14] Chun LZ, Dian L, Zhi JY, Jing W, Zhang C. YOLOv3: face detection in complex environments. Int J Comput Intell Syst. 2020;13(1):1153–60.10.2991/ijcis.d.200805.002Suche in Google Scholar
[15] Taheri Tajar A, Ramazani A, Mansoorizadeh M. A lightweight Tiny-YOLOv3 vehicle detection approach. J Real-Time Image Process. 2021;18(6):2389–401.10.1007/s11554-021-01131-wSuche in Google Scholar
[16] Hasanvand M, Nooshyar M, Moharamkhani E, Selyari A. Machine learning methodology for identifying vehicles using image processing. Artif Intell Appl. 2023;1(3):170–8.10.47852/bonviewAIA3202833Suche in Google Scholar
[17] Wang S, Hai X, Cao Y. Reflective safety clothes wearing detection in hydraulic engineering using YOLOv3-CCD. Asian J Res Comput Sci. 2023;15(2):11–24.10.9734/ajrcos/2023/v15i2316Suche in Google Scholar
[18] Zabihzadeh D, Tuama A, Karami-Mollaee A, Mousavirad SJ. Low-rank robust online distance/similarity learning based on the rescaled hinge loss. Appl Intell (Dordrecht, Netherlands). 2023;53(1):634–57.10.1007/s10489-022-03419-1Suche in Google Scholar PubMed PubMed Central
[19] Wen Z, Curran JM, Wevers HGE. Classification of firing pin impressions using HOG‐SVM. J Forensic Sci. 2023;68(6):1946–57.10.1111/1556-4029.15377Suche in Google Scholar PubMed
[20] Pu S, Zhang F, Fu SW. Microscopic image recognition of diatoms based on deep learning. J Phycol. 2023;59(6):1166–78.10.1111/jpy.13390Suche in Google Scholar PubMed
© 2025 the author(s), published by De Gruyter
This work is licensed under the Creative Commons Attribution 4.0 International License.
Artikel in diesem Heft
- Research Articles
- Generalized (ψ,φ)-contraction to investigate Volterra integral inclusions and fractal fractional PDEs in super-metric space with numerical experiments
- Solitons in ultrasound imaging: Exploring applications and enhancements via the Westervelt equation
- Stochastic improved Simpson for solving nonlinear fractional-order systems using product integration rules
- Exploring dynamical features like bifurcation assessment, sensitivity visualization, and solitary wave solutions of the integrable Akbota equation
- Research on surface defect detection method and optimization of paper-plastic composite bag based on improved combined segmentation algorithm
- Impact the sulphur content in Iraqi crude oil on the mechanical properties and corrosion behaviour of carbon steel in various types of API 5L pipelines and ASTM 106 grade B
- Unravelling quiescent optical solitons: An exploration of the complex Ginzburg–Landau equation with nonlinear chromatic dispersion and self-phase modulation
- Perturbation-iteration approach for fractional-order logistic differential equations
- Variational formulations for the Euler and Navier–Stokes systems in fluid mechanics and related models
- Rotor response to unbalanced load and system performance considering variable bearing profile
- DeepFowl: Disease prediction from chicken excreta images using deep learning
- Channel flow of Ellis fluid due to cilia motion
- A case study of fractional-order varicella virus model to nonlinear dynamics strategy for control and prevalence
- Multi-point estimation weldment recognition and estimation of pose with data-driven robotics design
- Analysis of Hall current and nonuniform heating effects on magneto-convection between vertically aligned plates under the influence of electric and magnetic fields
- A comparative study on residual power series method and differential transform method through the time-fractional telegraph equation
- Insights from the nonlinear Schrödinger–Hirota equation with chromatic dispersion: Dynamics in fiber–optic communication
- Mathematical analysis of Jeffrey ferrofluid on stretching surface with the Darcy–Forchheimer model
- Exploring the interaction between lump, stripe and double-stripe, and periodic wave solutions of the Konopelchenko–Dubrovsky–Kaup–Kupershmidt system
- Computational investigation of tuberculosis and HIV/AIDS co-infection in fuzzy environment
- Signature verification by geometry and image processing
- Theoretical and numerical approach for quantifying sensitivity to system parameters of nonlinear systems
- Chaotic behaviors, stability, and solitary wave propagations of M-fractional LWE equation in magneto-electro-elastic circular rod
- Dynamic analysis and optimization of syphilis spread: Simulations, integrating treatment and public health interventions
- Visco-thermoelastic rectangular plate under uniform loading: A study of deflection
- Threshold dynamics and optimal control of an epidemiological smoking model
- Numerical computational model for an unsteady hybrid nanofluid flow in a porous medium past an MHD rotating sheet
- Regression prediction model of fabric brightness based on light and shadow reconstruction of layered images
- Dynamics and prevention of gemini virus infection in red chili crops studied with generalized fractional operator: Analysis and modeling
- Qualitative analysis on existence and stability of nonlinear fractional dynamic equations on time scales
- Fractional-order super-twisting sliding mode active disturbance rejection control for electro-hydraulic position servo systems
- Analytical exploration and parametric insights into optical solitons in magneto-optic waveguides: Advances in nonlinear dynamics for applied sciences
- Bifurcation dynamics and optical soliton structures in the nonlinear Schrödinger–Bopp–Podolsky system
- User profiling in university libraries by combining multi-perspective clustering algorithm and reader behavior analysis
- Exploring bifurcation and chaos control in a discrete-time Lotka–Volterra model framework for COVID-19 modeling
- Review Article
- Haar wavelet collocation method for existence and numerical solutions of fourth-order integro-differential equations with bounded coefficients
- Special Issue: Nonlinear Analysis and Design of Communication Networks for IoT Applications - Part II
- Silicon-based all-optical wavelength converter for on-chip optical interconnection
- Research on a path-tracking control system of unmanned rollers based on an optimization algorithm and real-time feedback
- Analysis of the sports action recognition model based on the LSTM recurrent neural network
- Industrial robot trajectory error compensation based on enhanced transfer convolutional neural networks
- Research on IoT network performance prediction model of power grid warehouse based on nonlinear GA-BP neural network
- Interactive recommendation of social network communication between cities based on GNN and user preferences
- Application of improved P-BEM in time varying channel prediction in 5G high-speed mobile communication system
- Construction of a BIM smart building collaborative design model combining the Internet of Things
- Optimizing malicious website prediction: An advanced XGBoost-based machine learning model
- Economic operation analysis of the power grid combining communication network and distributed optimization algorithm
- Sports video temporal action detection technology based on an improved MSST algorithm
- Internet of things data security and privacy protection based on improved federated learning
- Enterprise power emission reduction technology based on the LSTM–SVM model
- Construction of multi-style face models based on artistic image generation algorithms
- Research and application of interactive digital twin monitoring system for photovoltaic power station based on global perception
- Special Issue: Decision and Control in Nonlinear Systems - Part II
- Animation video frame prediction based on ConvGRU fine-grained synthesis flow
- Application of GGNN inference propagation model for martial art intensity evaluation
- Benefit evaluation of building energy-saving renovation projects based on BWM weighting method
- Deep neural network application in real-time economic dispatch and frequency control of microgrids
- Real-time force/position control of soft growing robots: A data-driven model predictive approach
- Mechanical product design and manufacturing system based on CNN and server optimization algorithm
- Application of finite element analysis in the formal analysis of ancient architectural plaque section
- Research on territorial spatial planning based on data mining and geographic information visualization
- Fault diagnosis of agricultural sprinkler irrigation machinery equipment based on machine vision
- Closure technology of large span steel truss arch bridge with temporarily fixed edge supports
- Intelligent accounting question-answering robot based on a large language model and knowledge graph
- Analysis of manufacturing and retailer blockchain decision based on resource recyclability
- Flexible manufacturing workshop mechanical processing and product scheduling algorithm based on MES
- Exploration of indoor environment perception and design model based on virtual reality technology
- Tennis automatic ball-picking robot based on image object detection and positioning technology
- A new CNN deep learning model for computer-intelligent color matching
- Design of AR-based general computer technology experiment demonstration platform
- Indoor environment monitoring method based on the fusion of audio recognition and video patrol features
- Health condition prediction method of the computer numerical control machine tool parts by ensembling digital twins and improved LSTM networks
- Establishment of a green degree evaluation model for wall materials based on lifecycle
- Quantitative evaluation of college music teaching pronunciation based on nonlinear feature extraction
- Multi-index nonlinear robust virtual synchronous generator control method for microgrid inverters
- Manufacturing engineering production line scheduling management technology integrating availability constraints and heuristic rules
- Analysis of digital intelligent financial audit system based on improved BiLSTM neural network
- Attention community discovery model applied to complex network information analysis
- A neural collaborative filtering recommendation algorithm based on attention mechanism and contrastive learning
- Rehabilitation training method for motor dysfunction based on video stream matching
- Research on façade design for cold-region buildings based on artificial neural networks and parametric modeling techniques
- Intelligent implementation of muscle strain identification algorithm in Mi health exercise induced waist muscle strain
- Optimization design of urban rainwater and flood drainage system based on SWMM
- Improved GA for construction progress and cost management in construction projects
- Evaluation and prediction of SVM parameters in engineering cost based on random forest hybrid optimization
- Museum intelligent warning system based on wireless data module
- Optimization design and research of mechatronics based on torque motor control algorithm
- Special Issue: Nonlinear Engineering’s significance in Materials Science
- Experimental research on the degradation of chemical industrial wastewater by combined hydrodynamic cavitation based on nonlinear dynamic model
- Study on low-cycle fatigue life of nickel-based superalloy GH4586 at various temperatures
- Some results of solutions to neutral stochastic functional operator-differential equations
- Ultrasonic cavitation did not occur in high-pressure CO2 liquid
- Research on the performance of a novel type of cemented filler material for coal mine opening and filling
- Testing of recycled fine aggregate concrete’s mechanical properties using recycled fine aggregate concrete and research on technology for highway construction
- A modified fuzzy TOPSIS approach for the condition assessment of existing bridges
- Nonlinear structural and vibration analysis of straddle monorail pantograph under random excitations
- Achieving high efficiency and stability in blue OLEDs: Role of wide-gap hosts and emitter interactions
- Construction of teaching quality evaluation model of online dance teaching course based on improved PSO-BPNN
- Enhanced electrical conductivity and electromagnetic shielding properties of multi-component polymer/graphite nanocomposites prepared by solid-state shear milling
- Optimization of thermal characteristics of buried composite phase-change energy storage walls based on nonlinear engineering methods
- A higher-performance big data-based movie recommendation system
- Nonlinear impact of minimum wage on labor employment in China
- Nonlinear comprehensive evaluation method based on information entropy and discrimination optimization
- Application of numerical calculation methods in stability analysis of pile foundation under complex foundation conditions
- Research on the contribution of shale gas development and utilization in Sichuan Province to carbon peak based on the PSA process
- Characteristics of tight oil reservoirs and their impact on seepage flow from a nonlinear engineering perspective
- Nonlinear deformation decomposition and mode identification of plane structures via orthogonal theory
- Numerical simulation of damage mechanism in rock with cracks impacted by self-excited pulsed jet based on SPH-FEM coupling method: The perspective of nonlinear engineering and materials science
- Cross-scale modeling and collaborative optimization of ethanol-catalyzed coupling to produce C4 olefins: Nonlinear modeling and collaborative optimization strategies
- Unequal width T-node stress concentration factor analysis of stiffened rectangular steel pipe concrete
- Special Issue: Advances in Nonlinear Dynamics and Control
- Development of a cognitive blood glucose–insulin control strategy design for a nonlinear diabetic patient model
- Big data-based optimized model of building design in the context of rural revitalization
- Multi-UAV assisted air-to-ground data collection for ground sensors with unknown positions
- Design of urban and rural elderly care public areas integrating person-environment fit theory
- Application of lossless signal transmission technology in piano timbre recognition
- Application of improved GA in optimizing rural tourism routes
- Architectural animation generation system based on AL-GAN algorithm
- Advanced sentiment analysis in online shopping: Implementing LSTM models analyzing E-commerce user sentiments
- Intelligent recommendation algorithm for piano tracks based on the CNN model
- Visualization of large-scale user association feature data based on a nonlinear dimensionality reduction method
- Low-carbon economic optimization of microgrid clusters based on an energy interaction operation strategy
- Optimization effect of video data extraction and search based on Faster-RCNN hybrid model on intelligent information systems
- Construction of image segmentation system combining TC and swarm intelligence algorithm
- Particle swarm optimization and fuzzy C-means clustering algorithm for the adhesive layer defect detection
- Optimization of student learning status by instructional intervention decision-making techniques incorporating reinforcement learning
- Fuzzy model-based stabilization control and state estimation of nonlinear systems
- Optimization of distribution network scheduling based on BA and photovoltaic uncertainty
- Tai Chi movement segmentation and recognition on the grounds of multi-sensor data fusion and the DBSCAN algorithm
- Special Issue: Dynamic Engineering and Control Methods for the Nonlinear Systems - Part III
- Generalized numerical RKM method for solving sixth-order fractional partial differential equations