Optimization of thermal characteristics of buried composite phase-change energy storage walls based on nonlinear engineering methods
-
Rongdan Diao
 ,
Mushagalusa Murhambo Michel
,
Mushagalusa Murhambo Michel

Abstract
Nonlinear engineering methods improve the thermal insulation of building walls and save energy. This study proposes multiple construction forms of embedded composite phase-change energy storage walls to study heat transfer and its impact on indoor environments based on nonlinear engineering methods. The study reveals heat transfer laws and mechanisms affecting indoor environments. The results show a <10% error between measurements and numerical simulations, validating numerical methods for studying phase-change walls. Without water flow, temperature differences at the base of ordinary, S-font, U-font, and back-font phase change walls are 8.70, 8.80, 8.83, and 8.94°C, respectively. With water flow, these differences are 5.00, 5.18, and 6.51°C. Smaller coil spacing enhances heat storage. Phase-change walls reduce indoor air temperature by up to 3.2°C, improving thermal comfort. By combining nonlinear engineering methods, technical support is provided for achieving green buildings and sustainable development.
1 Introduction
The traditional wall thermal insulation layer often struggles to meet energy-saving requirements. However, combining phase-change materials (PCMs) with the envelope can enhance not only the building’s thermal insulation performance but also its thermal storage capacity [1]. By applying PCMs to the building envelope, the heat transfer characteristics can be altered through the absorption or release of latent heat. This increases the thermal inertia of the envelope, thereby reducing the cooling or heating load of the building. Ultimately, this improves the indoor thermal environment and serves the purpose of building energy conservation.
Currently, the PCMs most widely used in buildings are solid–solid and solid–liquid PCMs [2]. Scholars worldwide have conducted numerous studies on phase-change wall materials. Jia [3], for instance, combined PCMs with the building envelope to enhance its thermal inertia. This led to reduced energy consumption of indoor heating and ventilation equipment, minimized indoor temperature fluctuations, and improved human body comfort. Similarly, Tian et al. [4] developed a phase-change wall heat transfer test device for outdoor alternating temperatures. They concluded that phase-change energy storage walls exhibit better heat preservation, insulation properties, and heat storage capacity compared to ordinary walls. These phase-change walls effectively reduce indoor temperature fluctuations, enhance indoor thermal comfort, and decrease the summer air-conditioning load of the building. Sari [5] investigated the thermal regulation ability of wall panels made of PCMs, finding that bentonite wall panels with PCMs better prevent the transfer of external heat into the room. Hyun et al. [6] analyzed the use of phase-change wall panels in winter using three lightweight units erected outside. They found that the temperature control and energy-saving effect of phase-change wall panels vary depending on the installation area and location, with better results when applied to areas receiving direct solar radiation. Cui et al. [7] assured the phase transition temperature and latent heat of four fatty acids and four fatty alcohols. The results showed that the dodecanoic acid and octadecanol composite PCM had the highest latent heat of phase change. Kenal et al. [8] studied the thermal regulation effect of phase change concrete walls, revealing that they do not regulate temperature in summer but reduce indoor temperature fluctuations in winter. Ju et al. [9] numerically investigated the phase-change heat storage properties of paraffin wax reinforced by graphite/aluminum alloy composite heat transfer plate with a “sandwich” structure and investigated the effects of three heat transfer structures, namely, foam metal, flat plate fins, and composite heat transfer plate, on the phase-change heat storage process of paraffin wax. The study shows that the performance of graphite/aluminum alloy composite heat-conducting plate reinforced paraffin phase-change heat storage is significantly better than other heat transfer structures, presenting a decreasing temperature distribution from the heat-conducting plate to the direction perpendicular to the two sides of the plate, which results in the most uniform melting in the cavity and the smallest temperature rise of the chip. Yang et al. [10] investigated the effect of double-layer phase-change walls on indoor thermal comfort and building energy consumption, demonstrating their ability to suppress indoor temperature fluctuations and enhance comfort. Zhang et al. [11] analyzed the heat transfer process of double-layer phase-change walls with different structures. They found that when the phase change layer is located in the middle of the multilayer envelope, it exhibits the largest attenuation multiplier, resulting in the most stable temperature of the inner surface of the building wall. Li et al. [12] investigated the effect of composite phase-change walls on the indoor thermal environment and intermittent heating energy consumption. They observed that composite phase change buildings maintain a higher indoor air temperature, reducing annual heating energy consumption by 4.74%. Mourid et al. [13] conducted comparative energy consumption tests on two heated residential buildings, finding that the use of a 5.3 mm-thick PCM layer in walls reduced building energy consumption by 20% while maintaining indoor thermal comfort. Li et al. [14] pared decanoic acid-palmitic acid/expanded perlite phase change gypsum using decanoic acid-palmitic acid as phase change composite material. The results showed that after 100 thermal cycles, the phase change temperature of decanoic acid–palmitic acid-stereotyped phase change particles did not change, the enthalpy of phase change decreased by about 1.4%, and the decanoic acid–palmitic acid-stereotyped phase change particles had a better cycling thermal stability. Hua [15] investigated the appropriate phase-change temperature of phase-change envelopes with different configurations in hot summer and cold winter regions. They concluded that combined phase change envelopes have the best energy-saving effect, with potential efficiency gains of over 20%. Zhang et al. [16] investigated the thermal behavior of PCES walls and evaluated the thermal insulation performance of buildings with these wall structures. The results show that the use of PCES walls can effectively improve the thermal insulation performance of buildings in the summer months. Qiao et al. [17] investigated the thermal performance and energy efficiency of an active solar heating wall with a PCM system. The experimental results show that the PCM is highly utilized, and the temperature distribution is quite uniform. Cheng et al. [18] Integrated PCMs and CP into the building envelope to compare and analyze the thermal performance of an autumn building in Hefei, China. It is concluded that the combination of PCMs and CP is best laid on the south wall and roof, respectively. Nair et al. [19] used different methods of heat transfer enhancement, including fins, expanded graphite (EG), and a combination of fins and EG. The results showed that the combination of EG and circular fins showed the best performance in terms of charging and discharging. When the PCM/EG/fin heat exchanger system was fully charged, the energy stored in the system was 109% higher than the energy stored in the PCM heat exchanger for the same period of time. Li et al. [20] introduced a dynamic strategy for mobile PCM (DSMPCM). This approach allows the PCM layer to move its position within the envelope by compressing the air layer according to weather conditions. The results show that DSMPCM performs better in both summer and winter. From 135.53 to 535.73% and from 2.92 to 58.76%, respectively. Cui et al. [21] investigated a new method called “fine aggregate polymerization” for the development of thermal energy storage aggregates using salt hydrate PCMs. The results showed that reducing the particle size of the aggregate can both increase the energy storage capacity and the compressive strength of the TESC. Choi et al. [22] proposed a novel PCM wall device using the bubble injection method for the application of PCM in building envelopes. It was found that the latent heat energy stored in the PCM using the bubble injection method increased by 11%, and the amount of heat passing through the PCM wall decreased by 28%. Li et al. [23] investigated the melting process of composite PCMs embedded in nylon, stainless steel, and aluminum alloy skeletons, respectively. The results showed that the complete melting time and energy storage rate of the aluminum alloy composite PCM are 53% less and 59.6% higher than that of the pure PCM, respectively. The maximum thermal non-equilibrium effect of the composite PCM with an aluminum alloy skeleton during the melting process is 1.59°C.
In the context of the national continuous promotion of building energy efficiency standards upgrade, the optimization of the thermal insulation performance of the building envelope has become a key link to achieving the energy efficiency goals. Wenzhou City, Zhejiang Province, is located in a subtropical monsoon climate zone with hot and humid summers and cold and wet winters, which puts forward high requirements for the thermal insulation performance and thermal stability of building envelopes. On this basis, combining phase-change energy storage technology with building walls provides an innovative technical path to solve the above problems. The technology significantly improves the thermal insulation performance and heat storage capacity of the wall through the energy storage properties of PCMs, thus effectively regulating the heat transfer characteristics of the wall.
Specifically, the phase-change energy storage wall can absorb excess heat from indoors and outdoors during the day, slowing down the heat transfer and reducing the indoor temperature peak; release the stored heat at night, reducing the indoor temperature fluctuations, thus improving the stability of the indoor thermal environment of the building and enhancing the comfort of living. At the same time, the technology significantly reduces building energy consumption by reducing building heating and cooling loads, providing strong support for realizing building energy efficiency goals. Therefore, the application of phase-change energy storage technology to building walls not only meets the strategic needs of national energy conservation and emission reduction but also provides an important technical reference for the optimized design of building envelopes in Wenzhou and its similar climatic conditions.
2 Simulation and validation of thermal performance of small phase-change energy storage walls
2.1 Architectural overview
The test site is on the ground floor of B109, College of Architecture and Engineering, Wenzhou University, and the size of the test space is 3,910 mm × 2,300 mm × 1,980 mm, and the middle part of the test site is constructed with a small phase-change energy-storage wall of 1,710 mm × 1,980mm × 480 mm and a small door of 490 mm × 1,620 mm to achieve the separation of indoor and outdoor spaces. The left side is the outdoor space; according to the meteorological data collected from the meteorological station, the XL-21 power cabinet is used to control the circulating fans, fan coils, and other equipment to make the air temperature, humidity, and wind speed of the outdoor space consistent with the actual outdoor environment. The right side is the indoor space, and the air conditioner is set to 26°C to control the indoor air temperature to ensure the indoor/outdoor temperature difference; the test space is shown in Figure 1.

Built-up test space. (a) Outdoor space. (b) Indoor space. (c) XL-21 power cabinet.
A small phase-change energy storage wall from outside to inside is a 75 mm thick external plaster layer, a 30 mm thick composite phase-change energy storage layer, and a 300 mm thick wall base layer. The internal plaster layer is 75 mm thick, the material of the plaster layer is cement mortar, the material of the wall base layer is aerated concrete block, and the size of the block is 600 mm × 300 mm × 150 mm. The composite phase-change energy storage layer consists of cement mortar and a phase-change energy storage coil; the structure of the coil layer is 800 mm × 840 mm, the coil mode is U-type, the cross-section size of the coil is 20 mm × 10 mm, and the horizontal pipe spacing is 20, 40 and 60 mm. The size of the coil layer is 800 mm × 840 mm; the coil mode is U-type; the cross-section size of the coil is 20 mm × 10 mm; the spacing of the horizontal pipe is 20, 40, and 60 mm; the phase-change energy storage coil is filled with the composite PCM, the composite PCM is the phase change paraffin wax of 20°C, and the 400 mesh of the copper powder mixed according to the ratio of 2%, and the structure of the coil is as shown in Figure 2.

Coil construction.
The phase-change energy storage tubes with different spacings are embedded into three different heat transfer regions of the same wall: upper left, upper right, and lower left; the remaining lower right region of the wall is not embedded with energy storage tubes, i.e., it is the basic wall. The above four heat transfer zones have the same size. Each zone is separated by an aerogel felt with a thermal conductivity of 0.018 W/(m K), so that the heat transfer process between the different zones is not affected by each other. Finally, the external surface of the phase-change energy storage tubes is plastered.
2.2 Experimental setup
In order to study the thermal performance of the small phase-change energy storage wall, four thermocouples are arranged on the inner and outer surfaces of the wall in each heat transfer region to monitor the temperature changes of the inner and outer surfaces of the wall, and the locations of the measurement points are shown in Figure 3.

Layout of measuring points on the wall surface.
As can be seen from Figure 3, the thermocouples are arranged in positions 1–4 of the wall, 1# measuring point is arranged in the horizontal mortar joint, 2# measuring point is arranged in the T-type mortar joint, 3# measuring point is arranged in the vertical mortar joint, and 4# measuring point is arranged in the center of the block, and the thermocouples are arranged on the surface of the wall at one end, and the other end is connected to the building thermodynamic temperature and heat flow automatic detection system. The test instrument for the wall thermal performance test is shown in Figure 4, and the specific parameters of the instrument are shown in Table 1.

Indoor air parameter test apparatus. (a) Handheld single electronic temperature gun, (b) temperature and humidity sensors, (c) 5TC-TT-K thermocouple, (d) building heat temperature heat flow automatic test system, (e) electricity record sheet, and (f) thermocouple connector for automatic building temperature testing system.
Test instrument performance parameters
| Instrument name | Model number | Performance | Test parameter |
|---|---|---|---|
| Temperature gun | GM700 | Accuracy: ±(0.3 ± 0.03)°C | Indoor wall temperature |
| Temperature and humidity sensors | JXBS-3001-TH | Measurement range: −50 to 750°C; | Indoor air temperature and relative humidity |
| Resolution: 0.1°C | |||
| Measurement range: 0–to 100% RH | |||
| Resolution: 0.1% RH | |||
| Thermocouples | 5TC-TT-K | Operating temperature: −20 to 100°C; | Indoor air temperature |
| Response time: 0.5 S | |||
| Building thermal temperature and heat flow automatic detection system | JTRG-II | Acquisition of 36 channels of temperature data and 18 channels of heat flow data | Indoor air temperature |
| Measurement range: −40 to 80°C | |||
| Accuracy: ±0.2°C |
2.3 Test cycle
Wenzhou belongs to the subtropical monsoon climate, May is in the transition period of spring and summer and is the core period after the equinox to the summer solstice before and after the change. The sun’s point of direct sunlight continues to move towards the north, the temperature rises significantly, and the temperature difference between day and night gradually narrowed. Winter was dominated by a cold, high-pressure recession; the summer subtropical high pressure began to northward westward, warm and humid air activity increased, precipitation frequency and intensity increased significantly, but typhoon activity has not yet entered the peak period. Therefore, May presents alternating cold and warm air, wet and dry conversion accelerated features, both the continuation of the spring of the warm, but also for the upcoming rain and summer high-temperature accumulation of energy, which has a typical seasonal transition.
This test selected the test time for the transition season in May, the specific test date for May 3 to 5, the test period of 72 consecutive hours to monitor the temperature of the wall inside and outside the surface, the collection frequency of 5 min/times, and a total of 864 times the collection of valid data.
2.4 Numerical simulation
In this study, ANSYS Fluent 19.2 numerical simulation software is used to numerically simulate the heat transfer process of the phase-change energy storage wall. The numerical calculations are based on the enthalpy-porosity method (EPM), which describes the phase-change process of PCMs by establishing a unified energy conservation equation. The core idea of the EPM model is to solve the enthalpy field distribution throughout the computational domain and reconstruct the temperature field through the correspondence between enthalpy and temperature to determine the location of the phase interface. Without considering the internal heat source, the control equation can be expressed as
where H is the enthalpy and is related to the temperature T, as shown in Eq. (2) [24]:
The density and thermal conductivity are shown in Eq. (3) [25]:
where s is the solid phase, l is the liquid phase, T m is the phase transition temperature of PCMs (K), H s is the specific enthalpy of saturation when the PCM is solid (J kg−1), H l is the specific enthalpy of saturation when the PCM is in the liquid state (J kg−1), ρ s is the density in the solid-phase region (kg/m3), c s is the average specific heat capacity of a PCM when it is a solid state (J/kg K), c l is the average specific heat capacity of a PCM when it is in the liquid state (J/kg K), τ is the time (s), and λ s is thermal conductivity in the solid-phase region (W/m K).
The heat transfer process of the phase-change wall contains the heat conduction process of each structure inside the wall in addition to the heat absorption and exothermic of the PCM [26]. According to the phase-change wall construction, from the inside to the outside are the inner plastered cement mortar layer, the base wall layer, the phase-change energy storage layer, and the outer plastered cement mortar layer. As shown in Figure 5, the positional relationships are as follows: X mor,11 = 0, X mor,12 = X bm,11, X bm,12 = X pm,11, X pm,12 = X mor,21.
The temperatures of the inner plastered cement mortar layer, the base wall layer, the phase-change energy storage layer, and the outer plastered cement mortar layer are defined as T1, T2, T3, and T4, respectively, and their controlling equations as energy equations (Figure 5).

Schematic diagram of phase-change wall composition.
When 0 < x < X mor,12, it is an internal plastered cement mortar layer as shown in Eq. (4):
When X bm,11 < x < X bm,12, it is the base wall layer as shown in Eq. (5):
When X pm,11 < x < X pm,12, it is the phase-change energy storage layer as shown in Eq. (6):
When X mor,21 < x < X mor,22 it is an external plastered cement mortar layer as shown in Eq. (7):
2.5 Comparative analysis of test and simulation results
To ensure the reliability and reproducibility of the experimental data, the experimental environmental parameters were strictly controlled in this study. All environmental parameters were continuously recorded through the data acquisition system, and the specific environmental parameter trends are shown in Figure 6. During the experiment, the feedback adjustment mechanism of the environmental control system was used to ensure the consistency of the experimental conditions and minimize the influence of environmental factors on the experimental results.

Temperature, wind speed, and humidity.
In order to study the thermal characteristics of the small phase-change energy storage wall, the internal and external surface temperatures of the wall collected by thermocouples are analyzed, and the measured temperatures of the internal and external surfaces of each piece of the heat transfer region, Nos. 1–4 measuring points are averaged. The average of the internal and external surface temperatures of each piece of the region is obtained as the representative temperature of the wall in that region. The representative temperatures of the external/internal surfaces of the wall are shown in Figure 7. In the simulation results of the internal surface temperature of the phase-change wall, the internal surface temperatures of the wall in Cases 1 and 2 are shown in Figure 8.

Phase-change wall internal/external surface temperature test results. (a) Outer surface temperature of the phase-change wall. (b) Internal surface temperature of phase-change walls.

Internal surface temperature of phase-change walls. (a) Working condition 1. (b) Working condition 2.
The reliability of the simulation results was verified by using the relative error maximum and the relative error mean [27], which were calculated as shown in Eqs. (8) and (9).
where x sim is the simulated value, and x ref is the pilot test value.
The measured maximum, minimum, and average temperatures of the inner surface of the phase-change wall obtained from the tests were compared with the maximum, minimum, and average temperatures of the inner surface of the wall under simulated conditions, and the results are shown in Figure 7.
In this study, the statistical properties and regression relationships between experimental observations and numerical simulation data are systematically evaluated by constructing a linear discrete data set with noise. As shown in Figure 9, simulated observations with Gaussian white noise (σ = 1.5) are generated based on the Markov chain Monte Carlo method, and a linear regression model is constructed, and parameter estimation is performed, where X_trial and Y_sim characterize the experimental baseline values and the corresponding simulation outputs, respectively. The Bootstrap method (sample size N = 104) was used to assess the model goodness-of-fit and calculate the 95% confidence intervals. For multidimensional statistical metrics (maximum/minimum/mean), the quantile mapping matrix was built and distributional consistency was verified by the Kolmogorov–Smirnov test. In the final quantification of modeling error, the calibration coefficient R 2 = 0.962 (p < 0.01) proved the model significance. The relative error rate of each covariate stabilized in the interval of [8.24%, 9.63%]. The visualization module was implemented by using Curve Fitting Toolbox of MATLAB 2021b for the rendering of transparency overlap of confidence domains.

Line graph of confidence intervals.
As can be seen from Figure 10, the maximum error between the experimentally measured value and the theoretically calculated value is 9.63%, which is less than 10% and within the acceptable permissible range [28], indicating that numerical simulation can be used to study the heat transfer characteristics of phase-change walls.

Error of test and simulation comparison results.
3 Simulation study of heat transfer in buried composite phase-change energy storage walls
3.1 Forms of construction of phase-change walls
In order to analyze the heat transfer performance of the energy complementary buried composite phase-change energy storage wall, based on the traditional sandwich wall structure, the composite phase-change energy storage tubes are buried in the wall matrix with the arrangement of the outside of the wall to construct the buried composite phase-change energy storage wall, the wall structure is shown in Figure 11.
Structural drawing of embedded composite phase-change energy storage wall.
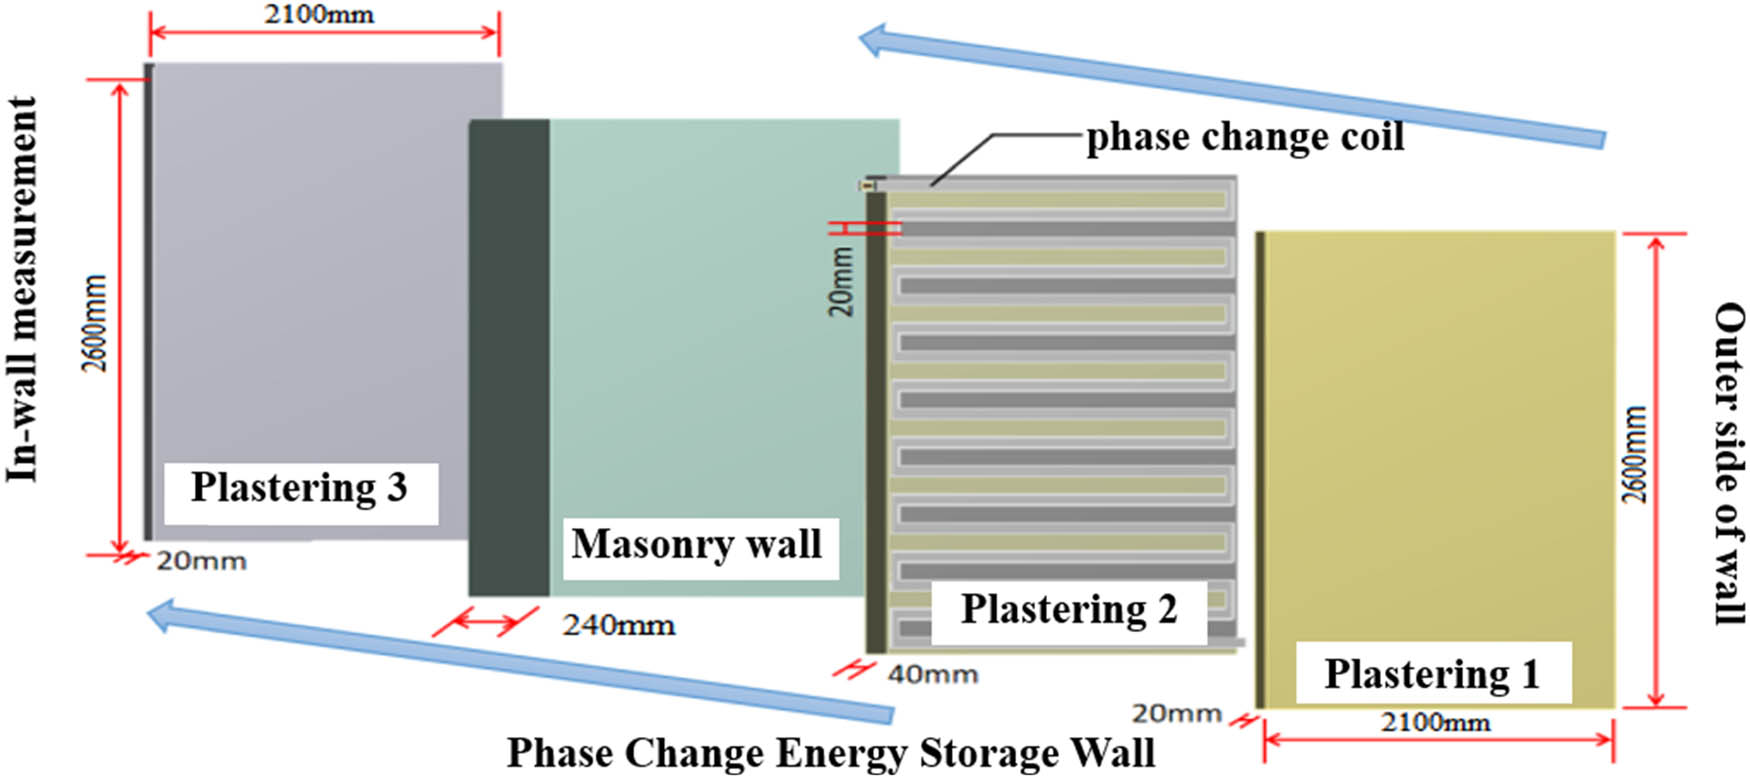
As can be seen from Figure 11, the size of the phase-change wall is 2,100 mm × 2,600 mm × 320 mm. The wall structure from inside to outside is a 20 mm-thick inner plaster layer, 240 mm-thick wall base layer, 40 mm-thick composite phase-change energy storage layer, and 20 mm-thick outer plaster layer. The material of the plaster layer is cement mortar, and the material of the base layer is aerated concrete block, and the size of the block is 600 mm × 240 mm × 240 mm. The PCM is a composite of paraffin wax and EG powder, and the phase-change temperature of the phase-change paraffin wax is 20°C (the average annual temperature of the Wenzhou area is 20°C), the particle size of the EG is 500 mesh, and the mass fraction of the EG is 5% of the paraffin wax [29], and the latent heat of the phase change is 240 kJ/kg. The composite phase-change energy storage layer consists of the inner mortar layer and composite phase-change energy storage tube, the composite phase-change energy storage tube by the double-layer coil combination, the double-layer coil for the composite PCM energy storage layer, and water heat transfer layer. As shown in Figures 9–12, the coil mode has a back type, S type, and U type, and the horizontal pipe spacing is 20, 40, and 60 mm. The double layer coils to rectangle up and down and rectangle inside and outside of the form of the juxtaposition of the combination of the coil material for stainless steel, with a wall thickness of 1 mm.
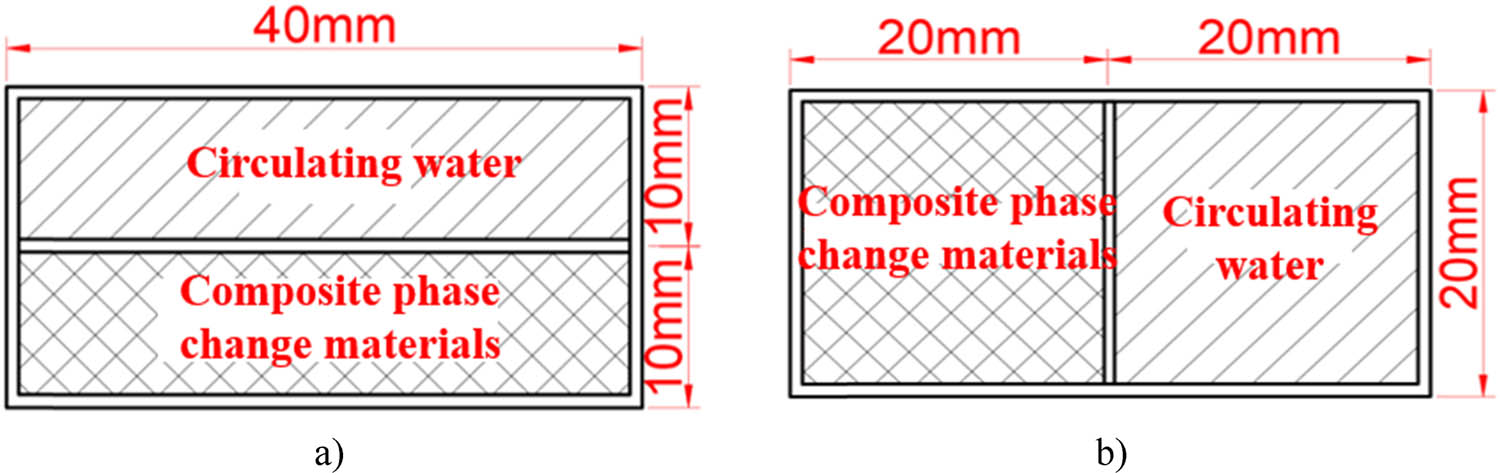
Coil cross-sectional type. (a) Juxtaposition of rectangles. (b) Juxtaposition inside and outside the rectangle.
As depicted in Figures 12–15, there are 18 types of composite phase-change energy storage tube construction forms. These forms include the S-type, back-to-the-word type, and U-type energy storage tube configurations. Each type features horizontal coil spacing options of 60, 40, and 20 mm. Additionally, each composite phase-change energy storage configuration comprises double-layer metal coils arranged in rectangular formations, both vertically and horizontally. The first layer of coils is filled with the composite phase-change energy storage material, while the second layer contains recycled water. The ends of the coil are connected to an insulation tank via inlet and outlet pipes, which store the recycled water. Circulating pumps and flow control valves are installed along the inlet and outlet pipes to replenish heat to the composite phase-change energy storage layer. This setup maximizes the utilization of the material’s phase-change energy storage mechanism and enhances the heat transfer performance between different materials. By fully leveraging the coupling relationship between the phase-change energy storage mechanism and the heat transfer performance of different materials, the heat storage capacity and heat transfer efficiency of the composite wall are improved, thereby enhancing the indoor thermal environment.
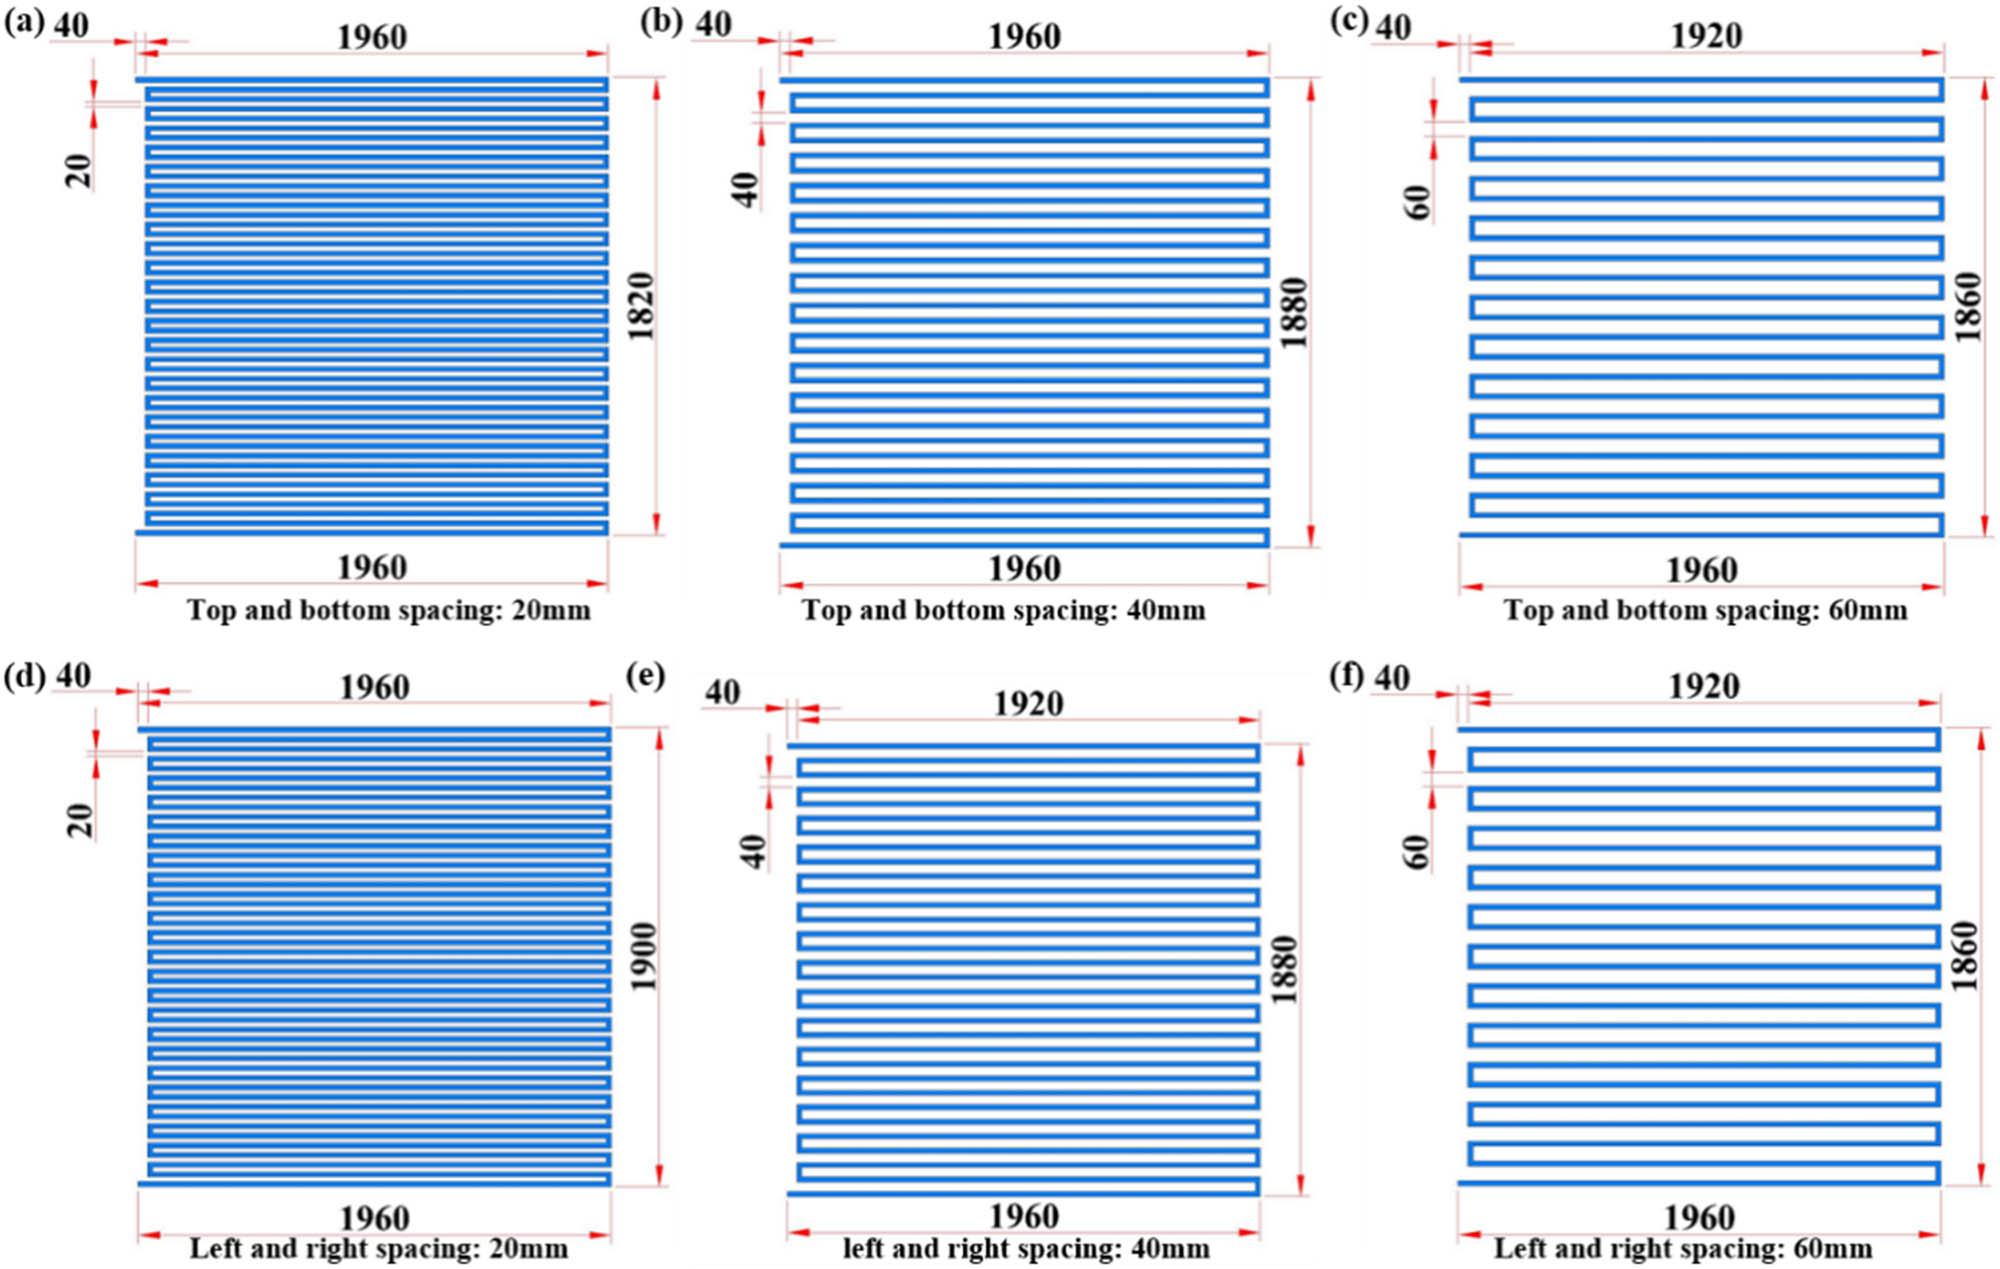
S-type top and bottom parallel coil cross-section composite phase-change energy storage tube: (a) up and bottom 20 mm, (b) up and bottom 40 mm, (c) up and bottom 60 mm, (d) left and right 20 mm, (e) left and right 40 mm, and (f) left and right 60 mm.

Zigzag-type top and bottom parallel coil cross-section composite phase-change energy storage tube: (a) up and bottom 20 mm, (b) up and bottom 40 mm, (c) up and bottom 60 mm, (d) left and right 20 mm, (e) left and right 40 mm, and (f) left and right 60 mm.

U-type top and bottom parallel coil cross-section composite phase-change energy storage tube: (a) up and bottom 20 mm, (b) up and bottom 40 mm, (c) up and bottom 60 mm, (d) left and right 20 mm, (e) left and right 40 mm, and (f) left and right 60 mm.
3.2 Phase-change energy storage building model
In order to more accurately study the thermal performance of the buried composite phase-change energy storage wall and the influence mechanism of the phase-change wall on the indoor thermal environment, this study establishes a buried composite phase-change energy storage building for research, the building according to the ‘Building Ground Level Design Specification’ [30], ‘Roofing Engineering Technical Specification’ [31], as well as the ‘Building Construction General Atlas’ [32] and other national standards and norms to build. The building size is 5,360 mm × 2,580 mm × 2,944 mm; the air conditioner size is 910 mm × 210 mm × 290 mm; the window size is 1,500 mm × 1,200 mm; the height of the window sill is 900 mm, the door size is 1,200 mm × 2,100 mm, and the distance from the east wall is 500 mm. The indoor area is 10.08 m2, and the different constructional forms of phase-change energy storage building are shown in Figure 16, and the basic practices of the building envelope are shown in Table 2.

Buried composite phase-change energy storage building.
Construction of the basic envelope of a monolithic building
| Structure | Method |
|---|---|
| Roof (inverted) | From top to bottom in order: 50 mm-thick water fine stone concrete smoothing, 4 mm-thick modified bitumen flexible linoleum waterproofing layer, 40 mm-thick extruded polystyrene board, 20 mm-thick cement mortar protective layer, 80 mm-thick reinforced concrete, and 20 mm-thick cement mortar plastering |
| Walls | In order from outside to inside: 10 mm-thick cement mortar plaster, 240 mm-thick aerated concrete blocks, and 10 mm-thick cement mortar plaster |
| Floors | From top to bottom: 70 mm-thick concrete compacted and driven, and 80 mm-thick fine stone concrete |
| Solid wood exterior door | 25 mm thick pine and spruce doors |
| Window | 6 mm plain single-glazed and plain insulated metal profile window frames |
3.3 Analogue parameter settings
The composite phase-change energy storage building is modeled and meshed using Gambit software, and the results of the meshing are shown in Figure 17, and the mesh sizes, categories, and quantities are shown in Table 3. The mesh quality evaluation is shown in Table 4, and the mesh types are all hexahedral structured meshes.
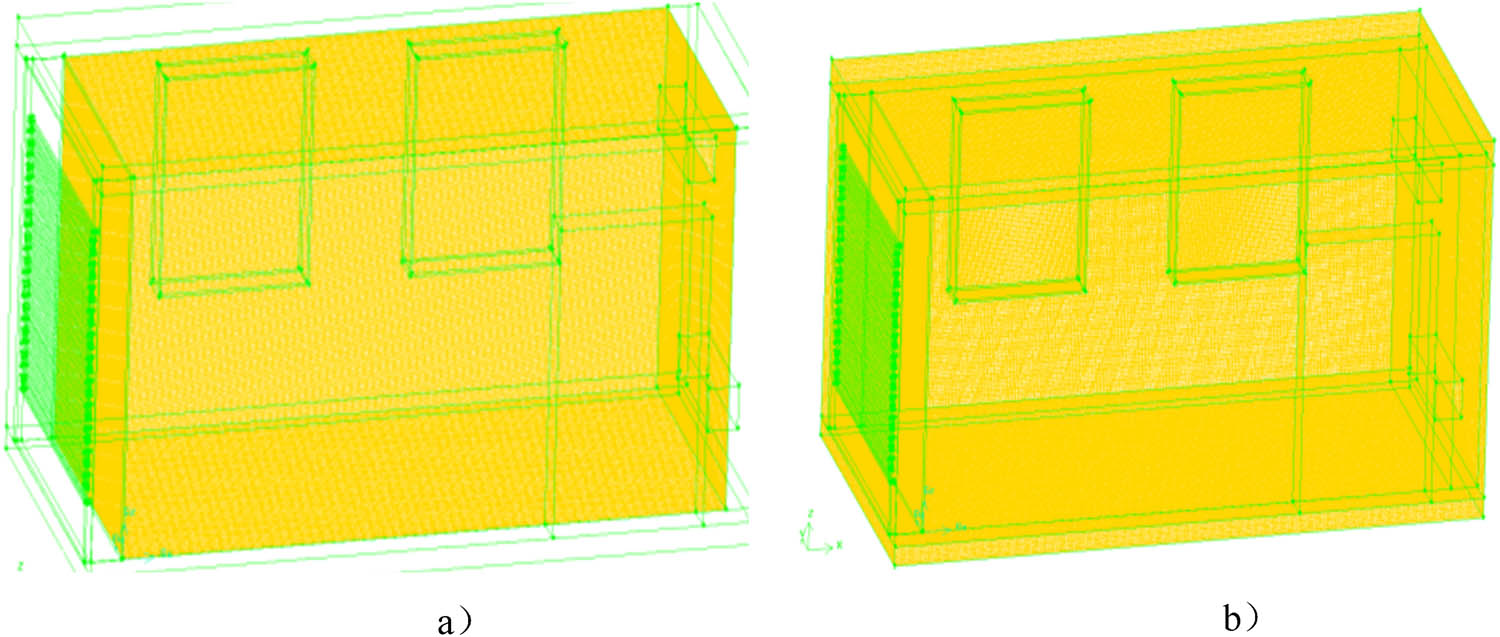
Phase-change energy storage building meshing. (a) Schematic diagram of indoor air domain meshing. (b) Schematic diagram of building envelope mesh division.
Mesh size and number
| Structural part | Mesh size (mm) | Grid classification | Number of grids | |||
|---|---|---|---|---|---|---|
| 1 | Northwest wall | Phase-change energy storage layer | Water coil | 10 | Hexahedral mesh | 19,016 |
| 2 | Composite phase-change paraffin coil | 10 | 19,016 | |||
| 3 | Cement mortar plaster | 20 | 22,546 | |||
| 4 | Exterior cement mortar plaster | 20 | 13,650 | |||
| 5 | Internal cement mortar plaster | 20 | 13,650 | |||
| 6 | Base of wall | 20 | 163,800 | |||
| 7 | Eastwest wall | 25 | 129,600 | |||
| 8 | Southwest wall | 25 | 182,240 | |||
| 9 | Northeastern wall | 30 | 92,584 | |||
| 12 | Air domain | 20 | 3,268,410 | |||
Mesh quality assessment indicators
| Norm | Aspect ratio | Diagonal ratio | Equiangular skew | Equisized skew |
|---|---|---|---|---|
| Numerical value | 1.06 | 1.08 | 0.15 | 0.15 |
To ensure the reliability of numerical simulations, grid independence verification was conducted by comparing simulation results under three mesh densities: coarse (50% of baseline), medium (baseline, as shown in Table 5), and fine (150% of baseline). The temperature at the inner surface of the phase-change wall and heat flux through the wall were selected as key parameters for comparison.
Grid independence analysis results
| Mesh density | Number of elements | Inner surface temperature (°C) | Heat flux (W/m2) | Relative error (%)* |
|---|---|---|---|---|
| Coarse | 1,634,205 | 25.8 | 18.6 | 4.3 |
| Medium | 3,268,410 | 26.5 | 17.2 | 1.1 |
| Fine | 4,902,615 | 26.7 | 17.0 | — |
*Relative error compared to fine mesh results.
As shown in Table 5, the relative error between medium and fine meshes was less than 1.5% for both temperature and heat flux, while the coarse mesh exhibited a 4.3% deviation. This confirms that the baseline mesh (medium density) achieves grid independence, ensuring computational accuracy without excessive resource consumption. The temperature distribution contours for all three mesh densities are shown in Figure 15, demonstrating convergence in results.
As can be seen from Table 4, the maximum aspect ratio of the overall mesh is 1.06, and the value is equal to 1 is the best cell; in general, it does not exceed 4:1; the maximum diagonal ratio of the overall mesh is 1.08, and the value applies only to quadrilateral and hexahedral cells. The default is greater than or equal to 1, and the higher the value, the more irregular the cell, the better equal to 1, which is positive quadrilateral or positive hexahedron. The maximum equiangular skew (calculated by the cell angle) and EquiSize Skew of the overall mesh is equal to 1. The higher the value, the more irregular the cell is; it is better to be equal to 1, that is, positive tetragonal or positive hexahedral; the maximum Equiangular Skew (skewness calculated by the angle of the cell) and EquiSize Skew (skewness calculated by the size of the cell) value of the overall mesh are both 0.15, the two indexes are in the range of 0–1, 0 is the best quality, 1 is the worst quality, and it is best to control the quality in the 0–0.8 range. In summary, it can be seen that all the evaluation indices of this model are within the limited range, indicating that the quality of this model grid is better.
3.4 Internal temperature distribution laws of phase-change walls
From the structure of the buried composite phase-change energy storage wall, it is apparent that the phase-change wall is primarily categorized into S-type, Zigzag-type, U-type, and 18 other types. Additionally, through an analysis of the heat transfer process of the phase-change wall, it is evident that the summer heat transfer process of the phase-change wall comprises two phases. Initially, the circulating pump is deactivated, allowing the PCM to absorb heat, transitioning from a solid to a liquid state. Subsequently, once heat saturation is achieved, the circulating pump is activated, facilitating convective heat transfer. The heated fluid is then conveyed to the water tank, and this heat transfer process repeats to ensure sufficient heat transfer within the energy complementary composite phase-change energy storage wall system, thereby maintaining a comfortable indoor environment within the building.
According to the heat transfer process of the phase-change wall, it can be seen that the phase-change wall heat transfer is divided into circulating water pump off and circulating water pump in two phases, S-type, U-type, and back to the type of phase-change wall in the water flow, and the temperature of the water flow and no flow conditions are shown in Figure 18, and the analysis of the data is shown in Table 6.


Longitudinal temperature distribution (X-axis) of different types of phase-change wall buildings. (a) 60 mm between up and down of the S-type. (b) 40 mm between up and down of S-type. (c) 20 mm between up and down of S-type. (d) 60 mm between left and right of S-type. (e) 40 mm between left and right of S-type. (f) 20 mm between left and right of S-type. (g) 60 mm between up and down of U-type. (h) 40 mm between up and down of U-type. (i) 20 mm between up and down of U-type. (j) 60 mm between left and right of U-type. (k) 40 mm between left and right of U-type. (l) 20 mm between left and right of U-type. (m) 60 mm between up and down of Zigzag-type. (n) 40 mm between up and down of Zigzag-type. (o) 20 mm between up and down of Zigzag-type. (p) 60 mm between left and right of Zigzag-type. (q) 40 mm between left and right of Zigzag-type. (r) 20 mm between left and right of Zigzag-type.
Temperature analysis of walls of different types
| Waterless | Spacing (mm) | Temperature difference – up and down (°C) | Temperature difference – left and right (°C) | ||
|---|---|---|---|---|---|
| Wall substrates | Composite phase-change energy storage layer | Wall substrates | Composite phase-change energy storage layer | ||
| S-type | 20 | 8.94 | 5.00 | 8.86 | 6.00 |
| 40 | 8.80 | 4.80 | 8.90 | 5.28 | |
| 60 | 8.81 | 2.02 | 8.98 | 3.66 | |
| U-type | 20 | 8.86 | 2.13 | 8.86 | 5.18 |
| 40 | 8.83 | 4.08 | 8.83 | 4.08 | |
| 60 | 8.76 | 5.18 | 8.76 | 2.13 | |
| Zigzag | 20 | 6.51 | 8.95 | 8.95 | 6.51 |
| 40 | 4.91 | 8.94 | 8.94 | 4.91 | |
| 60 | 2.46 | 8.82 | 8.82 | 2.46 | |
In order to ensure the reliability of the experimental data and the rigor of the analytical results, the temperature measurement data of different types of walls were statistically analyzed in this study using one-way ANOVA. After confirming that the data in each group met the assumption of chi-square by Levene’s test at the significance level of α = 0.05, the temperature data of the three independent samples were tested for the significance of the differences using the SPSS 26.0 statistical software, and the corresponding F-statistics and p-values were calculated in order to assess the statistical differences in the temperature distributions of the different types of wall surfaces. As shown in Table 7, the “column” factor is the key variable affecting the experimental results (F = 7.648, P < 0.001), which is in full agreement with the hypothesis that “different treatment conditions/spatial locations significantly change the dependent variable” proposed in the article. The “party” factor was not statistically significant (P = 0.910), indicating that it had no substantial effect on the results of the experiment, further eliminating potential confounding variables and enhancing the relevance of the article’s conclusions. The low mean square value of the error term indicates that the experiment was reproducible and the data were less noisy, supporting the article’s description of the rationality of the experimental design and the stability of the results.
ANOVA table
| Source of variation | SS | df | MS | F | P-value | F crit |
|---|---|---|---|---|---|---|
| Party | 14.43515 | 8 | 1.804394 | 0.398823 | 0.910179 | 2.355081 |
| Columns | 103.8009 | 3 | 34.60029 | 7.647667 | 0.000933 | 3.008787 |
| Inaccuracies | 108.5831 | 24 | 4.524294 |
From Table 6, it can be seen that the buried composite phase-change energy storage wall performs well in terms of temperature reduction, comfort enhancement, enhanced thermal insulation, and storage performance, especially the return type phase-change wall, whose performance advantages provide a strong basis for the optimal design of the wall. The idea of comparative analysis in this brief is shown in Figures 19 and 20.

Comparative analysis of the thermal performance of the same type of phase-change wall.
Comparative analysis of the thermal performance of different types of phase-change walls.
As observed in Figures 19 and 20, when comparing and analyzing the thermal performance among phase-change walls of the same type regarding the cross-sectional form of the energy storage tubes and the tube spacing, it becomes apparent that smaller spacing of the phase-change energy storage tubes results in better heat storage performance and thermal insulation of the wall. Additionally, it is noted that the thermal performance of the left and right types of phase-change walls surpasses that of the upper and lower types. Moreover, upon comparing the thermal performance among different types of walls, it is evident that phase-change walls outperform ordinary walls. Specifically, U-type phase-change walls exhibit superior thermal performance compared to S-type phase-change walls, and zigzag-type phase-change walls perform better than U-type phase-change walls.
By comparatively analyzing the thermal performance of S-type, U-type, and return-type composite phase-change energy storage walls under different working conditions, the correlation law between their heat transfer mechanism and structural parameters is revealed. Under static conditions (water does not flow), the phase-change wall significantly improves the thermal insulation performance through the latent heat absorption of the PCM. The temperature difference at the base level of the ordinary wall is 8.70°C. In contrast, the temperature difference at the base level of the back-type, U-type, and S-type walls at the minimum spacing (20 mm) reaches 9.01, 8.99, and 8.94°C, respectively, which suggests that the closed runner design (back-type) inhibits the thermal bridging effect by prolonging the thermal conductivity path. The extension of the thermal bridge effect improves its thermal insulation performance, and the thermal bridging effect is improved by the extension of the thermal conductivity path. The thermal insulation performance is optimized by extending the thermal bridge effect. Under dynamic (water flow) conditions, the convective heat transfer dominated thermal storage performance is closely related to the runner structure: the maximum temperature difference of the composite phase change layer in the return-type wall reaches 6.51°C (left-right spacing of 20 mm) due to the closed runners to promote the development of turbulence and homogeneous heat transfer, which is 81.8 and 8.5% higher than that of the U-type (3.58°C) and the S-type (6.00°C), confirming that it is the most efficient in terms of thermal storage. It is further shown that reducing the buried pipe spacing can simultaneously enhance thermal insulation and thermal storage performance. For example, when the spacing of the return-type wall is reduced from 60 to 20 mm, the thermal storage temperature difference increases by 66.2%, which originates from the fact that the small spacing layout increases the frequency of the contact between the PCM and the fluid as well as the complexity of the heat flow paths. In addition, the horizontal (left–right) arrangement is more conducive to thermal performance than the vertical (up-down) arrangement because it conforms to the natural convection trend, e.g., the temperature difference between the left–right and right–right arrangements of the zigzag pattern (6.50°C) is closer to the value of the up-down arrangement (6.51°C), but it shows more stable heat transfer characteristics. This study provides a theoretical basis for phase-change wall optimization.
The geometric topology innovation of the zigzag coil realizes heat conduction path extension, convection enhancement, synergistic optimization of the phase-change process, and stability enhancement of the heat-force coupling, and its physical essence is to break the symmetry and unidirectional limitation of the U-shape structure and to construct a multi-scale and multi-dimensional heat flow regulation network. This design paradigm provides a key solution for the high efficiency and engineering reliability of phase-change energy storage systems.
4 Analysis of indoor temperature field in buried composite phase-change energy storage buildings
4.1 Influence law of phase-change walls on the indoor temperature field
The temperature distributions of indoor air domains in ordinary building indoor temperature fields with different combinations of forms of left–right spacing 20 mm phase-change buildings under water flow/water immobility are shown in Figure 21.

Temperature distribution in the indoor air domain (water immobilization/water flow) for different combinations of left–right spacing 20 mm phase-change buildings: (a) 20 mm between left and right of S-type (water does not flow), (b) 20 mm between left and right of S-type (water flows), (c) 20 mm between left and right of U-type (water does not flow), (d) 20 mm between left and right of U-type (water flows), (e) 20 mm between left and right of back-type (water does not flow), (f) 20 mm between left and right of back-type (water flows), and (g) ordinary buildings.
As can be seen from Figure 18, the maximum indoor temperature of the ordinary building is reduced by 8.48% compared with the S-type left-right–right spacing 20 mm phase-change energy storage building, which indicates that the phase-change energy storage building can reduce the temperature of the indoor air domain and improve the indoor comfort. The flow of water inside the phase-change energy storage tube reduces the maximum indoor temperature by1.47% in the S-type phase-change energy storage building with 20 mm left–right spacing, indicating that the convective heat transfer of water inside the wall can improve the indoor thermal environment. Under the condition of no water flow, the maximum indoor temperature of the U-type phase-change energy storage building with a spacing of 20 mm between the left and right of the S-type is reduced by 0.75%, which indicates that the effect of the U-type phase-change energy storage building on the indoor temperature field is greater than that of the S-type. At the same time, the flow of water inside the phase-change energy storage tube reduces the maximum indoor temperature of the U-type phase-change energy storage building with a spacing of 20 mm between the left and right sides by 0.4%, which indicates that the indoor thermal environment can be improved by the convective heat transfer of water inside the wall. Under the condition of no water flow, the maximum indoor temperature of the phase-change energy storage building with a spacing of 20 mm between the left and right sides of the U-type is reduced by 0.58% compared to the U-type, which indicates that the effect of the phase-change energy storage building with a spacing of 20 mm between the left and right sides of the U-type has a greater effect on the indoor temperature field than that of the U-type. Meanwhile, through the flow of water inside the phase-change energy storage tube, the maximum indoor temperature of the phase-change energy storage building with 20 mm left–right spacing of the return type is reduced by 0.08%, which indicates that the indoor thermal environment can be improved through the convective heat transfer of water inside the wall.
The inhomogeneity coefficient was used to evaluate the uniformity of the indoor temperature field distribution [33], and the head-to-toe vertical air temperature difference was used to evaluate the thermal comfort level of the indoor temperature field [34], which was calculated using the formulas shown below:
Select n measurement points in the horizontal plane of the indoor temperature field. This study in the horizontal plane of the indoor temperature field uniformly arranged n = 3 measurement points, respectively, measured the temperature of each point to find the arithmetic mean:
The root mean square deviation is
The inhomogeneity coefficient is defined as
where t i is the temperature value at a point in the horizontal plane of the temperature field (°C) and the temperature inhomogeneity coefficient K t is a dimensionless number; the smaller the value of K t , the better the uniformity of the indoor temperature distribution.
The vertical air temperature difference between head and foot is
where t 1.1 is the temperature value at a height of 1.1 m (°C) and t 0.1 is the temperature value at a height of 0.1 m (°C); the smaller the temperature difference, the greater the comfort of the personnel. ISO7730 The International Standard for Thermal Comfort [35] stipulates that for air-conditioned rooms, the air temperature difference between the head and the ankle when the person is seated should not exceed 3°C.
4.2 Temperature inhomogeneity coefficient analysis
In order to facilitate the observation of the interior of the indoor air domain, cross sections of the building interior with heights Z = 0.1 m, 0.6 m, 1.1 m, 1.6 m, and 1.85 m are taken for the study (0.1 m corresponds to the height of the human foot, 0.6 m corresponds to the height of the human knee, 1.1 m corresponds to the height of the human waist, 1.6 m corresponds to the height of the human chest, and 1.85 m corresponds to the height of the human head). Along the room depth direction (Y-axis), three horizontal lines were taken at equal intervals, named Y1 (Y = 525 mm), Y2 (Y = 1,050 mm), and Y3 (Y = 1,575 mm), respectively, and the temperature coefficients of the horizontal lines of Y1, Y2, and Y3 were calculated, respectively, in order to analyze the uniformity of the indoor temperature distribution, and the location of each cross-section is shown in Figure 22.

Diagram of each section of the building interior. (a) Section position. (b) Horizontal line position.
The temperature inhomogeneity coefficients for the horizontal lines of each section in each building room under water immobility conditions are shown in Figure 22.
From Figure 23, it can be seen that the temperature non-uniformity coefficient of ordinary building Z = 1.1 m section is 0.0126, which is smaller than the temperature non-uniformity coefficients of other sections; the temperature non-uniformity coefficient of S-type left–right spacing 20 mm phase-change building Z = 1.1 m section is 0.0122, which is smaller than the temperature non-uniformity coefficients of other sections; the temperature non-uniformity coefficient of U-type right–right spacing 20 mm phase-change building Z = 1.1 m section. The unevenness coefficient is 0.0120, which is smaller than the temperature unevenness coefficient of other sections; the temperature unevenness coefficient of Z = 1.1 m cross-section of U-type left-right spacing 20 mm phase-change building is 0.0105, which is smaller than the temperature unevenness coefficient of other cross-section; the smaller the temperature unevenness coefficient, it indicates that the uniformity of the temperature distribution in the room is better, that is to say, the uniformity of the temperature distribution of Z = 1.1 m cross-section is good. Analyzed from the vertical direction, it can be seen that the uniformity of the indoor temperature field in the building indoor temperature field in the height range of 0.1–1.1 m increases with the increase of the height, and the uniformity of the indoor temperature field in the building indoor temperature field in the height range of 1.1–1.85 m increases with the increase of the height. The uniformity of the indoor temperature field decreases, which is due to the fact that the air conditioning outlet is located at a height of 2 m, the return air outlet is located at a height of 0.5 m, and the air in these two parts of the air. This is because the air conditioning outlet is located at a height of 2 m and the return air outlet is located at a height of 0.5 m. These two parts of the air have strong convective heat transfer, which leads to poor uniformity of its temperature distribution, so the temperature distribution at the height of 1.1 m is more uniform.
Indoor inhomogeneity factor for buildings.
The temperature non-uniformity coefficients of Z = 1.1 m and Z = 1.6 m sections of S-type phase-change buildings with left–right and right–right spacing of 20 mm are smaller than those of ordinary buildings, which indicates that the indoor temperature field of S-type phase-change buildings with left-right and right-right spacing of 20 mm is more uniformly distributed; the temperature non-uniformity coefficients of Z = 0.6 m, Z = 1.1 m, Z = 1.6 m, and Z = 1.85 m sections of U-type phase-change buildings with left-right and right-right spacing of 20 mm are smaller than those of S. The temperature non-uniformity coefficients of Z = 1.1 m, Z = 1.6 m, and Z = 1.85 m cross sections of the 20 mm phase-change building are smaller than those of the 20 mm phase-change building of S, indicating that the indoor temperature field of the 20 mm phase-change building is more uniformly distributed in the U. The temperature non-uniformity coefficients of Z = 0.6 m, Z = 1.1 m, Z = 1.6 m, and Z = 1.85 m cross-sections in the 20 mm phase-change building are smaller than those of the 20 mm phase-change building in the U. The indoor temperature field of the 20 mm phase-change building is more evenly distributed, and distribution is more uniform.
The idea of comparative analysis of this vignette is shown in Figure 24.

Comparative analysis of indoor temperature fields in buildings.
As can be seen from Figure 24, the effect of different types of walls on the indoor temperature field of the building is investigated in terms of the temperature inhomogeneity coefficient and the vertical temperature difference between head and foot. It is obtained that the embedded composite phase-change energy-storage wall makes the indoor temperature field distribution more uniform and improves indoor comfort in the building. The benefit side of this is that the return-type phase-change building is better than the U-type phase-change building, the U-type phase-change building is better than the S-type phase-change building, and the S-type phase-change building is better than the ordinary building.
5 Conclusion
In this study, 18 types of phase-change walls, such as S-type, zigzag-type, and U-type, were simulated using Fluent software. The distribution law of the internal temperature of the buried composite phase-change energy storage wall, as well as the influence of the phase-change wall on the indoor thermal environment, were analyzed. The following conclusions were obtained:
(1) Water static condition (no flow), compared with the ordinary wall base layer 8.70°C temperature difference performance: S-type, U-type, back to the type of phase-change wall base layer temperature differences were 8.80, 8.83, and 8.94°C, which indicates that the back to the type of structure of the greatest resistance to the heat transfer, and its thermal insulation performance advantages and disadvantages of the order of the back to the word type > U-type > S-type. At the same time, the experiment verifies that the smaller the spacing of coil distribution, the more significant the improvement of the heat storage efficiency of PCM.
(2) Under the dynamic working conditions of water (flow), the temperature control ability of the energy storage layer is reflected by the average temperature difference: the temperature differences of S-type, U-type, and back-type are 5.00, 5.18, and 6.51°C, respectively, and then the back-type exhibits stronger thermal energy storage and control ability under the flow condition, and the order of thermal energy storage performance is still retained in the order of back-type > U-type > S-type. Meanwhile, it is further verified that reducing the spacing of coils is conducive to strengthening the thermal energy trapping. At the same time, it is further verified that the reduction of coil spacing is beneficial to the enhancement of thermal energy capture and storage.
As a result of the two experimental conditions, it can be seen that the return-type phase-change wall has the best performance in thermal insulation and thermal storage, and the best thermal performance combination can be achieved with the smaller coil spacing parameter. Therefore, it is recommended to adopt the design scheme of zigzag construction with minimum coil spacing to achieve the optimization of the thermal environment of the building envelope.
(3) The indoor temperature field of phase-change energy storage buildings with left and right coil configurations, 20 mm pipe spacing, and different coil methods was analyzed. It was concluded that under conditions of water immobility, the indoor temperature distribution of zigzag-type phase-change buildings was the most uniform when coils were constructed on the left and right sides with a spacing of 20 mm. Furthermore, comparison with common walls indicated that phase-change energy-storage walls could reduce the highest indoor air temperature by 3.21°C and decrease the average indoor temperature by 0.44°C, thereby enhancing indoor thermal comfort.
This study provides a preliminary exploration of the application of buried composite phase-change energy storage walls in buildings, but there are still many limitations. Future research should further optimize the description of the physical parameters of PCMs, improve the accuracy of the convective heat transfer model, and deeply analyze its impact on building energy consumption, as well as expand to the overall building application research. In practical applications, issues such as material cost, long-term performance, and design complexity need to be addressed in order to fully utilize the energy-saving potential of this wall and to promote its wide application in the building sector.
6 Discussion
In the subsequent research, more practical physical parameters should be selected, focusing on the consideration of practical application scenarios, and the connection between building energy consumption and the wall should be studied in depth, with a view to further optimizing the design of the buried composite phase-change energy storage wall, and enhancing the application effect in terms of building energy efficiency.
-
Funding information: This project was financially supported by VILLUM FONDEN under the VILLUM Investigator Grant: Center for Research on Microgrids, National Science Fund Project under Grant No. 51878511, Natural Science Foundation Youth Fund Project of Zhejiang under Grant No. LQ19E080019, and Project of Wenzhou Science and Technology Bureau under Grant No. G20190025. The authors would like to thank the personnel who participated in this study.
-
Author contributions: Rongdan Diao: investigation, data curation, and writing-original draft preparation. Hao Feng: conceptualization, methodology, and supervision. Congwen Chi: conceptualization, methodology, investigation, validation, and funding acquisition. Mushagalusa Murhambo Michel: writing-review & editing. Yajuan Guan: conceptualization, methodology, and supervision. Josep M. Guerrero: resources, supervision, funding acquisition, and writing-review & editing. All authors have accepted responsibility for the entire content of this manuscript and approved its submission.
-
Conflict of interest: Authors state no conflict of interest.
-
Data availability statement: All data generated or analyzed during this study are included in this published article.
References
[1] Tian GH. Research on heat transfer characteristics and energy consumption impact of phase change energy storage building walls [dissertation]. Xuzhou (China): China University of Mining and Technology; 2018.Search in Google Scholar
[2] Zhang RY. Phase change materials and phase change energy storage technology. Beijing: Science Press; 2009.Search in Google Scholar
[3] Jia JZ. Progress of phase change building materials for near-zero energy buildings. HVAC. 2021;51(2):47–54.Search in Google Scholar
[4] Tian GH, Lv HL, Huang JE, Liu P, Feng W. Experimental study on the thermal performance of a wall coated with a phase change, energy-storing mortar layer during summer. Appl Therm Eng. 2017;124:279–85.10.1016/j.applthermaleng.2017.05.178Search in Google Scholar
[5] Sari A. Thermal energy storage properties and laboratory-scale thermoregulation performance of bentonite/paraffin composite phase change material for energy-efficient buildings. J Mater Civ Eng. 2017;29(6):04017001.10.1061/(ASCE)MT.1943-5533.0001775Search in Google Scholar
[6] Hyun BK, Masayuki M, Youngjin C, Takeshi K. Experimental analysis of thermal performance in buildings with shape-stabilized phase change materials. Energy Build. 2017;152:524–33.10.1016/j.enbuild.2017.07.076Search in Google Scholar
[7] Cui MD, Liu DP, Yang L. Experimental study on thermal properties of phase transition process in binary organic composite phase change materials. Energy Res Inf. 2022;38(1):53–60.Search in Google Scholar
[8] Kenal C, Beyhan B, Konuklu Y, Cengiz D, Okan K, Caner G, et al. 2 years of monitoring results from passive solar energy storage in test cabins with phase change materials. Sol Energy. 2020;200:29–36.10.1016/j.solener.2019.01.045Search in Google Scholar
[9] Ju ZH, Yu KY, Li Q. Study on phase change heat storage in paraffin wax reinforced by graphite/aluminum alloy composite heat-conducting plate. J Eng Thermophys. 2023;44(12):3399–406.Search in Google Scholar
[10] Yang HX, Zhang GH, Dou BL, Yan XY, Liu ZQ, Qi WC. Investigations of double layer phase change walls with expanded graphite on the temperature and energy consumption. Energy Rep. 2021;7:9023–34.10.1016/j.egyr.2021.11.237Search in Google Scholar
[11] Zhang Y, Wu ZW, Ge FH. Thermal performance analysis of double-layer phase change material walls in hot summer and cold winter regions. J Jiangsu Univ. 2019;40(4):465–71.Search in Google Scholar
[12] Li Y, Long E, Zhang L, Dong X. Energy-saving potential of intermittent heating system: Influence of composite phase change wall and optimization strategy. Energy Explor Exploit. 2021;39(1):426–43.10.1177/0144598720969217Search in Google Scholar
[13] Mourid A, El Alami M, Kuznik F. Experimental investigation on thermal behavior and reduction of energy consumption in a real scale building by using phase change materials on its envelope. Sustain Cities Soc. 2018;41:35–43.10.1016/j.scs.2018.04.031Search in Google Scholar
[14] Li X, Liu ZC, Zhang YC. Study on thermal properties of decanoic acid-palmitic acid/expanded perlite phase change gypsum. China Build Mater Sci Technol. 2023;32(2):51–4.Search in Google Scholar
[15] Hua XM. Analysis of heat transfer performance and energy consumption of combined phase change materials in building envelope in hot summer and cold winter regions. [dissertation]. Shanghai (China): Donghua University; 2017.Search in Google Scholar
[16] Zhang Y, Zhou C, Liu M, Li X, Liu T, Liu Z. Thermal insulation performance of buildings with phase-change energy-storage wall structures. J Clean Prod. 2024;438:140749.10.1016/j.jclepro.2024.140749Search in Google Scholar
[17] Qiao X, Kong X, Li H, Wang L, Long H. Performance and optimization of a novel active solar heating wall coupled with phase change material. J Clean Prod. 2020;250:119470.10.1016/j.jclepro.2019.119470Search in Google Scholar
[18] Cheng Y, Chen X, Xu B, Pei G, Jiao D. Experimental analysis of building envelope integrating phase change material and cool paint under a real environment in autumn. J Clean Prod. 2024;461:142674.10.1016/j.jclepro.2024.142674Search in Google Scholar
[19] Nair AM, Wilson C, Kamkari B, Locke J, Huang MJ, Griffiths P. Advancing thermal performance in PCM-based energy storage: a comparative study with fins, expanded graphite, and combined configurations. Energy Convers Manag X. 2024;23:100627.10.1016/j.ecmx.2024.100627Search in Google Scholar
[20] Li WD, Rahim M, Wu D, Ganaoui ME, Bennacer R. Dynamic integration of phase change material in walls for enhancing building thermal performance – A novel self-adaptive method for moving PCM layer. Energy Convers Manag. 2024;308:118401.10.1016/j.enconman.2024.118401Search in Google Scholar
[21] Cui HZ, Zou Y, Yang HB, Bao XH. Thermal-mechanical behaviors of concrete with innovative salt hydrate PCM-based thermal energy storage aggregate. Energy Convers Manag. 2023;293:117477.10.1016/j.enconman.2023.117477Search in Google Scholar
[22] Choi SH, Park J, Ko HS, Karng SW. Heat penetration reduction through PCM walls via bubble injections in buildings. Energy Convers Manag. 2020;221:113187.10.1016/j.enconman.2020.113187Search in Google Scholar
[23] Li XY, Chen BM, Liu F, Jian Y, Wang HL. Experimental study on the melting performance of phase change materials embedded with different material skeletons. Appl Therm Eng. 2024;236:121873.10.1016/j.applthermaleng.2023.121873Search in Google Scholar
[24] Yu Z, Chang KK. Enhanced numerical simulation of heat storage process in phase change materials. Energy Conserv. 2020;40(7):24–8.Search in Google Scholar
[25] Zhang Z, Fang J, Xi L. Performance evaluation of paraffin phase change microcapsules based on response surface methodology. Mater Rep. 2019;24(33):4181–7.Search in Google Scholar
[26] Tian GH, Heng LL, Huang JN. Numerical simulation of heat transfer performance of phase change wall and determination of phase change temperature suitability. Build Energy Effic. 2021;49(12):52–7.Search in Google Scholar
[27] Wang M, Peng JQ, Li NP, Yang HX, Wang CL, Li X, et al. Comparison of energy performance between PV double skin facades and PV insulating glass units. Appl Energy. 2017;194:148–60.10.1016/j.apenergy.2017.03.019Search in Google Scholar
[28] ASHRAE. ASHRAE Guideline 14–2014: Measurement of energy demand and savings [Internet]. Atlanta: ASHRAE; 2014 [cited 2024 Jun 1]. https://www.ashrae.org.Search in Google Scholar
[29] Li YT, Hua Y, Wang Q. Influence of expanded graphite on thermal properties of paraffin/expanded graphite composite phase change materials. Chem N Mater. 2017;45(5):215–7.Search in Google Scholar
[30] GB50037. Code for the design of building floors. Beijing (China): China National Standardization Administration; 2013.Search in Google Scholar
[31] GB50207. Technical specification for roofing works [Internet]. Beijing: Ministry of Housing and Urban-Rural Development of China; 2002 [cited 2024 Jun 1]. http://www.mohurd.gov.cn.Search in Google Scholar
[32] 19BJ1-1. General drawing set for building construction [Internet]. Beijing: China Architecture & Building Press; 2019 [cited 2024 Jun 1]. http://www.cabp.com.cn.Search in Google Scholar
[33] Lian XT. Artificial environment. Beijing: China Architecture & Building Press; 2006.Search in Google Scholar
[34] Chen Y, Li BZ, Feng ZG. Influence of laminar flow ventilation air supply angle of same side arrangement of supply and return air outlets on heating effect in winter. Build Sci. 2017;33(10):120–7.Search in Google Scholar
[35] ISO7730. International standard for thermal comfort environments [Internet]. Geneva: International Organization for Standardization; 2005 [cited 2024 Jun 1]. https://www.iso.org.Search in Google Scholar
© 2025 the author(s), published by De Gruyter
This work is licensed under the Creative Commons Attribution 4.0 International License.
Articles in the same Issue
- Research Articles
- Generalized (ψ,φ)-contraction to investigate Volterra integral inclusions and fractal fractional PDEs in super-metric space with numerical experiments
- Solitons in ultrasound imaging: Exploring applications and enhancements via the Westervelt equation
- Stochastic improved Simpson for solving nonlinear fractional-order systems using product integration rules
- Exploring dynamical features like bifurcation assessment, sensitivity visualization, and solitary wave solutions of the integrable Akbota equation
- Research on surface defect detection method and optimization of paper-plastic composite bag based on improved combined segmentation algorithm
- Impact the sulphur content in Iraqi crude oil on the mechanical properties and corrosion behaviour of carbon steel in various types of API 5L pipelines and ASTM 106 grade B
- Unravelling quiescent optical solitons: An exploration of the complex Ginzburg–Landau equation with nonlinear chromatic dispersion and self-phase modulation
- Perturbation-iteration approach for fractional-order logistic differential equations
- Variational formulations for the Euler and Navier–Stokes systems in fluid mechanics and related models
- Rotor response to unbalanced load and system performance considering variable bearing profile
- DeepFowl: Disease prediction from chicken excreta images using deep learning
- Channel flow of Ellis fluid due to cilia motion
- A case study of fractional-order varicella virus model to nonlinear dynamics strategy for control and prevalence
- Multi-point estimation weldment recognition and estimation of pose with data-driven robotics design
- Analysis of Hall current and nonuniform heating effects on magneto-convection between vertically aligned plates under the influence of electric and magnetic fields
- A comparative study on residual power series method and differential transform method through the time-fractional telegraph equation
- Insights from the nonlinear Schrödinger–Hirota equation with chromatic dispersion: Dynamics in fiber–optic communication
- Mathematical analysis of Jeffrey ferrofluid on stretching surface with the Darcy–Forchheimer model
- Exploring the interaction between lump, stripe and double-stripe, and periodic wave solutions of the Konopelchenko–Dubrovsky–Kaup–Kupershmidt system
- Computational investigation of tuberculosis and HIV/AIDS co-infection in fuzzy environment
- Signature verification by geometry and image processing
- Theoretical and numerical approach for quantifying sensitivity to system parameters of nonlinear systems
- Chaotic behaviors, stability, and solitary wave propagations of M-fractional LWE equation in magneto-electro-elastic circular rod
- Dynamic analysis and optimization of syphilis spread: Simulations, integrating treatment and public health interventions
- Visco-thermoelastic rectangular plate under uniform loading: A study of deflection
- Threshold dynamics and optimal control of an epidemiological smoking model
- Numerical computational model for an unsteady hybrid nanofluid flow in a porous medium past an MHD rotating sheet
- Regression prediction model of fabric brightness based on light and shadow reconstruction of layered images
- Dynamics and prevention of gemini virus infection in red chili crops studied with generalized fractional operator: Analysis and modeling
- Qualitative analysis on existence and stability of nonlinear fractional dynamic equations on time scales
- Fractional-order super-twisting sliding mode active disturbance rejection control for electro-hydraulic position servo systems
- Analytical exploration and parametric insights into optical solitons in magneto-optic waveguides: Advances in nonlinear dynamics for applied sciences
- Bifurcation dynamics and optical soliton structures in the nonlinear Schrödinger–Bopp–Podolsky system
- User profiling in university libraries by combining multi-perspective clustering algorithm and reader behavior analysis
- Exploring bifurcation and chaos control in a discrete-time Lotka–Volterra model framework for COVID-19 modeling
- Review Article
- Haar wavelet collocation method for existence and numerical solutions of fourth-order integro-differential equations with bounded coefficients
- Special Issue: Nonlinear Analysis and Design of Communication Networks for IoT Applications - Part II
- Silicon-based all-optical wavelength converter for on-chip optical interconnection
- Research on a path-tracking control system of unmanned rollers based on an optimization algorithm and real-time feedback
- Analysis of the sports action recognition model based on the LSTM recurrent neural network
- Industrial robot trajectory error compensation based on enhanced transfer convolutional neural networks
- Research on IoT network performance prediction model of power grid warehouse based on nonlinear GA-BP neural network
- Interactive recommendation of social network communication between cities based on GNN and user preferences
- Application of improved P-BEM in time varying channel prediction in 5G high-speed mobile communication system
- Construction of a BIM smart building collaborative design model combining the Internet of Things
- Optimizing malicious website prediction: An advanced XGBoost-based machine learning model
- Economic operation analysis of the power grid combining communication network and distributed optimization algorithm
- Sports video temporal action detection technology based on an improved MSST algorithm
- Internet of things data security and privacy protection based on improved federated learning
- Enterprise power emission reduction technology based on the LSTM–SVM model
- Construction of multi-style face models based on artistic image generation algorithms
- Research and application of interactive digital twin monitoring system for photovoltaic power station based on global perception
- Special Issue: Decision and Control in Nonlinear Systems - Part II
- Animation video frame prediction based on ConvGRU fine-grained synthesis flow
- Application of GGNN inference propagation model for martial art intensity evaluation
- Benefit evaluation of building energy-saving renovation projects based on BWM weighting method
- Deep neural network application in real-time economic dispatch and frequency control of microgrids
- Real-time force/position control of soft growing robots: A data-driven model predictive approach
- Mechanical product design and manufacturing system based on CNN and server optimization algorithm
- Application of finite element analysis in the formal analysis of ancient architectural plaque section
- Research on territorial spatial planning based on data mining and geographic information visualization
- Fault diagnosis of agricultural sprinkler irrigation machinery equipment based on machine vision
- Closure technology of large span steel truss arch bridge with temporarily fixed edge supports
- Intelligent accounting question-answering robot based on a large language model and knowledge graph
- Analysis of manufacturing and retailer blockchain decision based on resource recyclability
- Flexible manufacturing workshop mechanical processing and product scheduling algorithm based on MES
- Exploration of indoor environment perception and design model based on virtual reality technology
- Tennis automatic ball-picking robot based on image object detection and positioning technology
- A new CNN deep learning model for computer-intelligent color matching
- Design of AR-based general computer technology experiment demonstration platform
- Indoor environment monitoring method based on the fusion of audio recognition and video patrol features
- Health condition prediction method of the computer numerical control machine tool parts by ensembling digital twins and improved LSTM networks
- Establishment of a green degree evaluation model for wall materials based on lifecycle
- Quantitative evaluation of college music teaching pronunciation based on nonlinear feature extraction
- Multi-index nonlinear robust virtual synchronous generator control method for microgrid inverters
- Manufacturing engineering production line scheduling management technology integrating availability constraints and heuristic rules
- Analysis of digital intelligent financial audit system based on improved BiLSTM neural network
- Attention community discovery model applied to complex network information analysis
- A neural collaborative filtering recommendation algorithm based on attention mechanism and contrastive learning
- Rehabilitation training method for motor dysfunction based on video stream matching
- Research on façade design for cold-region buildings based on artificial neural networks and parametric modeling techniques
- Intelligent implementation of muscle strain identification algorithm in Mi health exercise induced waist muscle strain
- Optimization design of urban rainwater and flood drainage system based on SWMM
- Improved GA for construction progress and cost management in construction projects
- Evaluation and prediction of SVM parameters in engineering cost based on random forest hybrid optimization
- Museum intelligent warning system based on wireless data module
- Optimization design and research of mechatronics based on torque motor control algorithm
- Special Issue: Nonlinear Engineering’s significance in Materials Science
- Experimental research on the degradation of chemical industrial wastewater by combined hydrodynamic cavitation based on nonlinear dynamic model
- Study on low-cycle fatigue life of nickel-based superalloy GH4586 at various temperatures
- Some results of solutions to neutral stochastic functional operator-differential equations
- Ultrasonic cavitation did not occur in high-pressure CO2 liquid
- Research on the performance of a novel type of cemented filler material for coal mine opening and filling
- Testing of recycled fine aggregate concrete’s mechanical properties using recycled fine aggregate concrete and research on technology for highway construction
- A modified fuzzy TOPSIS approach for the condition assessment of existing bridges
- Nonlinear structural and vibration analysis of straddle monorail pantograph under random excitations
- Achieving high efficiency and stability in blue OLEDs: Role of wide-gap hosts and emitter interactions
- Construction of teaching quality evaluation model of online dance teaching course based on improved PSO-BPNN
- Enhanced electrical conductivity and electromagnetic shielding properties of multi-component polymer/graphite nanocomposites prepared by solid-state shear milling
- Optimization of thermal characteristics of buried composite phase-change energy storage walls based on nonlinear engineering methods
- A higher-performance big data-based movie recommendation system
- Nonlinear impact of minimum wage on labor employment in China
- Nonlinear comprehensive evaluation method based on information entropy and discrimination optimization
- Application of numerical calculation methods in stability analysis of pile foundation under complex foundation conditions
- Research on the contribution of shale gas development and utilization in Sichuan Province to carbon peak based on the PSA process
- Characteristics of tight oil reservoirs and their impact on seepage flow from a nonlinear engineering perspective
- Nonlinear deformation decomposition and mode identification of plane structures via orthogonal theory
- Numerical simulation of damage mechanism in rock with cracks impacted by self-excited pulsed jet based on SPH-FEM coupling method: The perspective of nonlinear engineering and materials science
- Cross-scale modeling and collaborative optimization of ethanol-catalyzed coupling to produce C4 olefins: Nonlinear modeling and collaborative optimization strategies
- Unequal width T-node stress concentration factor analysis of stiffened rectangular steel pipe concrete
- Special Issue: Advances in Nonlinear Dynamics and Control
- Development of a cognitive blood glucose–insulin control strategy design for a nonlinear diabetic patient model
- Big data-based optimized model of building design in the context of rural revitalization
- Multi-UAV assisted air-to-ground data collection for ground sensors with unknown positions
- Design of urban and rural elderly care public areas integrating person-environment fit theory
- Application of lossless signal transmission technology in piano timbre recognition
- Application of improved GA in optimizing rural tourism routes
- Architectural animation generation system based on AL-GAN algorithm
- Advanced sentiment analysis in online shopping: Implementing LSTM models analyzing E-commerce user sentiments
- Intelligent recommendation algorithm for piano tracks based on the CNN model
- Visualization of large-scale user association feature data based on a nonlinear dimensionality reduction method
- Low-carbon economic optimization of microgrid clusters based on an energy interaction operation strategy
- Optimization effect of video data extraction and search based on Faster-RCNN hybrid model on intelligent information systems
- Construction of image segmentation system combining TC and swarm intelligence algorithm
- Particle swarm optimization and fuzzy C-means clustering algorithm for the adhesive layer defect detection
- Optimization of student learning status by instructional intervention decision-making techniques incorporating reinforcement learning
- Fuzzy model-based stabilization control and state estimation of nonlinear systems
- Optimization of distribution network scheduling based on BA and photovoltaic uncertainty
- Tai Chi movement segmentation and recognition on the grounds of multi-sensor data fusion and the DBSCAN algorithm
- Special Issue: Dynamic Engineering and Control Methods for the Nonlinear Systems - Part III
- Generalized numerical RKM method for solving sixth-order fractional partial differential equations