Fault diagnosis of agricultural sprinkler irrigation machinery equipment based on machine vision
-
Xinping Wu
 ,
Rongnian He
,
Rongnian He

Abstract
The traditional fault diagnosis of agricultural sprinkler irrigation machinery and equipment has the disadvantages of low accuracy and time-consuming. To solve these problems, the study designs a machine vision (MV)-based fault diagnosis model for agricultural sprinkler irrigation machinery and equipment. The study first investigates MV in sprinkler irrigation equipment fault diagnosis, then constructs a fault diagnosis model using improved convolutional neural network, and finally compares it with other methods to verify the performance of the model. The results showed that in the Iris dataset, the accuracy of the proposed algorithm was 95.13%, the training accuracy was 0.95, and the recall rate was 89.7%, which were better than the comparison methods. In the mechanical fault diagnosis dataset, the highest accuracy of the proposed model could reach 98.45%. This indicates that the MV model constructed in the study has higher accuracy and efficiency in the fault diagnosis of agricultural sprinkler irrigation mechanical equipment, which provides convenience for maintenance and repair.
1 Introduction
With the advancement of agricultural modernization, agricultural sprinkler irrigation machinery equipment (ASIME) plays an important role in farmland irrigation [1]. However, due to long-term use and environmental factors, ASIME may face various failure problems, such as pump clogging and sensor failure [2]. Therefore, it is important to detect and diagnose the failure problems of ASIME in a timely and accurate manner. Traditional fault diagnosis (FD) methods usually rely on manual experience and professional technicians to make judgments, but this method has problems such as low diagnostic accuracy and low efficiency [3]. With the rapid development of machine vision (MV) technology, it has achieved remarkable results in FD in the industrial field. MV technology can realize automatic detection and diagnosis of equipment faults by real-time monitoring and image processing of equipment operation status [4,5]. The aim of this study is to improve the FD accuracy of ASIME through improved MV technology, ensure the safe and reliable operation of machinery and equipment, and further improve the efficiency of agricultural irrigation and promote agricultural development. The study first uses stacked autoencoder (SAE) to extract the image data, and then inputs the acquired data into the convolutional neural network (CNN) based on the training, so as to determine the fault of the relevant equipment. The application of MV technology in the FD of agricultural sprinkler irrigation (SI) and equipment can realize the real-time monitoring and early warning of machinery and equipment, and improve the reliability and safety of the equipment. The contribution of the research lies in the application of MV technology in the FD of ASIME, and the development of corresponding FD algorithms and models. These results are expected to improve the efficiency and quality of agricultural production and contribute to the process of agricultural modernization.
The first part of the study is to analyze the current research status in the field of ASIME as well as in the field of MV. The second part is to construct a FD model for agricultural machinery design based on MV technology. The third part is to compare and analyze the performance of the FD methods as well as the FD models proposed in the study. The fourth part is to summarize the content of the article.
2 Related works
To promote China’s economy and society growth, improve the efficiency of water resource utilization, and actively develop water-saving, irrigation plays a crucial role, some researchers have made numerous outstanding contributions in the field of sprinkler irrigation. To simulate the design and evaluation of watershed, border, and furrow irrigations, the Akbari team used the evaluation, design, and optimization of surface sprinkler irrigation models as the simulation and optimization models for surface sprinkler irrigation systems. Data obtained from 15 experimental sites were used to validate the simulation, algorithm parameter settings, and optimization validation. The outcomes denoted the superiority of simulation optimization models for surface sprinkler irrigation systems in optimization [6]. Chavez et al. proposed an environmental policy integrated climate (EPIC) model to calibrate and evaluate environmental policies and weather conditions for energy sorghum production under different sprinkler irrigation levels. Through simulation calculations, the study indicated that the EPIC model could be utilized to evaluate crop water use and total biomass under limited sprinkler irrigation degrees, especially in semi-arid regions [7]. To improve the capacity of sprinkler irrigation in community land model version 4.5, the Felfelani team proposed a sprinkler irrigation simulation system integrating the SMAP satellite’s large-scale soil moisture data. Through empirical analysis, the findings expressed that data assimilation enhanced the sprinkler irrigation simulation in CLM4.5, providing a basis for improving the simulation of sprinkler irrigation and land atmosphere interaction [8]. To use various nozzle diameters on the linear mobile sprinkler irrigation system, Liu et al. proposed a different model to simulate the water distribution and uniformity of the linear motor system. The results illustrated that the minimum error between simulation and test was 1.6%, and the max error was 13.0%. The simulation model can be utilized for other sprinkler irrigation systems [9]. Zhang et al. established a bilateral stochastic chance constrained linear fractional programming model for sprinkler irrigation water management under uncertain conditions to optimize its framework. Empirical analysis was conducted on the model, and the outcomes denoted that the model had strong advantages and feasibility, and could provide decision support for managers in arid areas [10].
Along the rapid advancement of computer technology, MV technology has many advantages in object detection and image classification, and is widely applied in disease detection and classification processing in the crop industry. Domestic and foreign scholars have continuously applied MV and deep learning to level detection and automatic sorting, and have achieved research results. Abhyankar et al. designed a system for measuring soil pH and moisture value in order to ensure proper growth of crops. The system contained components such as microcontroller, sensors, etc., and was studied using tomato as an experimental subject. The results showed that the system could be applied to systems such as sulfur supply and soil moisture monitoring based on the data obtained [11]. Gavade et al., to enhance the recycling capacity of the discarded waste, designed a low-cost infrastructure in the scavenger-Kabadiwallah-trader-recycler. This infrastructure was able to sort the recyclable waste in the area where it is located efficiently and further process it to reduce the space required and after completion of these processes, the recyclable waste was good to be sent to the corresponding work. The results showed that this infrastructure could significantly increase the utilization of recyclable waste and enhance the overall environment of the neighborhood [12]. Daoliang et al. proposed an MV model in the field of fish classification for automatic classification of different fish species, and conducted empirical analysis on the model. The outcomes indicated that the model helped researchers and practitioners understand the applicability of MV in fish classification and solved complex problems in fish classification practice [13]. To reduce the production losses caused by needle failures on knitting machines, Zhang et al. proposed a knitting machine needle failure detection system based on a collaborative combination of laser detection and MV. Through image preprocessing, the experiment outcomes showed that the classifier could complete the classification of a single image within 0.002 s, with excellent classification speed [14]. Liu et al. developed an intelligent sorting system based on MV to improve the efficiency of manual sorting of missing parts. They applied radial basis function neural network learning algorithm to obtain defect features and locate defective components moving forward on the conveyor belt. The research findings expressed that the average removal rate of defective parts in the system was 91.7%, with extreme high efficiency [15]. Aiming at the significance of mechanical FD in preventing mechanical equipment failure, Hou et al. analyzed the basic structure and working principle of CNN, proposed basic methods to achieve better training effects, and analyzed the mechanical FD technology combining transfer learning and CNN. This study provides a basic reference for the application scenarios and methods of transfer learning and CNN in FD [16]. To solve the problem of low accuracy caused by lack of characteristic conditions in rotating machinery FD process, Cai et al. developed a knowledge graph-driven equipment FD method, combined with Bayesian theory, detected the system state and located the fault source, and realized fault cause inference through the relationship between mechanical equipment structures. The results showed that the accuracy of this method reached 91.1%, which significantly improved the diagnostic accuracy [17]. In view of system failures caused by rolling bearing defects, Maurya et al. created a condition monitoring and FD system with good coordination to evaluate the severity and fault mode, and proposed appropriate maintenance strategies to further maintain stable operation of equipment through cloud computing and artificial intelligence, providing technical ideas for multiple FD research [18].
In summary, many domestic and foreign scholars have conducted rich research and analysis in the field of sprinkler irrigation, and have made significant breakthroughs in the usage of MV technology. However, the usage of MV in the field of FD of ASIME is quite rare. Therefore, this study proposed the building of an FD model for ASIME based on MV, breaking the limitations of previous qualitative research. It has strong potential application value.
3 FD of agricultural machinery design based on MV technology
Efficient and reasonable agricultural sprinkler irrigation systems are crucial for crop growth, and the normal operation of sprinkler irrigation equipment is its key. However, traditional FD methods cannot accurately and timely diagnose mechanical faults. Based on this background, this study proposes the usage of MV technology and deep learning algorithms to diagnose faults in agricultural sprinkler machinery.
3.1 FD based on MV technology
ASIME is a device that sprays water with a certain pressure into the air through specialized machinery and equipment, scattering it into small water droplets that evenly fall on the field like a drizzle, providing water for crops, flowers, seedlings, and other plants. Connecting devices such as pressurization, water delivery, spraying, and walking into a movable whole is called sprinkler irrigation machinery. Sprinkler irrigation systems are machinery and equipment used to spray irrigation water resources in fields. They come in many forms, and their main accessories include supporting power machines, pipeline systems, nozzles, and other components [19]. There are many commonly used types of sprinkler irrigation machines, which can be divided into rolling type, translation type, etc. The specific classification is shown in Figure 1.
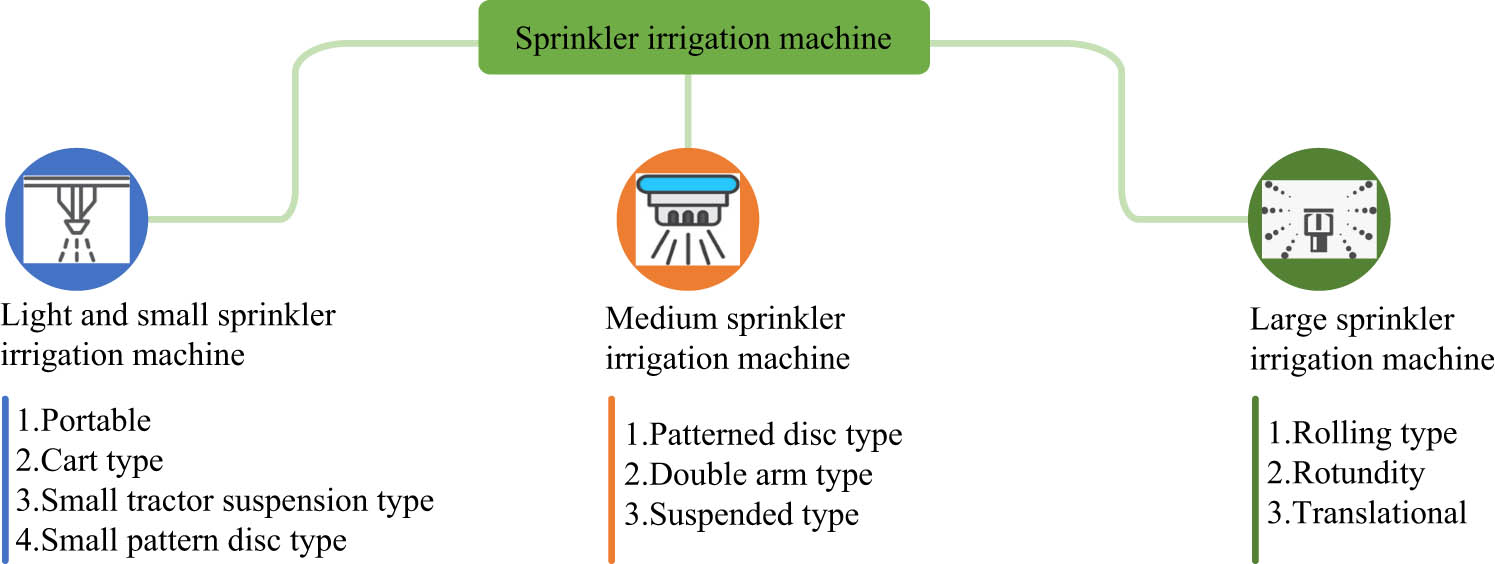
Classification of sprinkler.
In Figure 1, among all types of sprinkler irrigation machines, light sprinkler irrigation machines mainly consist of nozzles, spray racks, outlet pipes, power machines, sprinkler pumps, inlet pipes, filters, racks, etc. The rotating bearings in components such as power machines, water pumps, and sprinklers have the highest probability of failure due to factors such as temperature and acid-base substances. Therefore, research will focus on diagnosing the faults of these components in sprinkler irrigation machines. Rotary power in sprinkler systems comes primarily from water pressure and secondarily from the design of the sprinkler head. That is, sprinkler heads in sprinkler systems are usually driven to rotate water jets by water flow pressure. Therefore, in the design of the sprinkler system, the water supply pressure of the water source is considered to ensure that the sprinkler head can obtain enough water pressure to achieve rotation. In the study, the water pressure is controlled to 0.6 MPa and the sprinkler head can be designed as a rotating jet, fan jet, or spray jet and other forms in order to produce a rotating effect through the power of the water flow. MV technology is an interdisciplinary field that involves artificial intelligence, image processing, and many other fields. MV mainly utilizes computers to imitate human visual functions, extracts information from images, processes and understands it, and ultimately, applies it for practical detection, measurement, and control. This technology has the characteristics of fast speed and large amount of information, so the research will use it to detect faults in ASIME. Due to the fact that mechanical faults are often accompanied by vibration changes, when using MV technology for FD, the type of fault can be determined by judging the changes in mechanical vibration signals. The collection of mechanical vibration signal images can be achieved using a visual acquisition system, which is composed of high-speed industrial cameras, non-stroboscopic light sources, multi-channel transmission cables, etc. The ordinary camera in a vision acquisition system is affected by pixel resolution, frame rate, exposure time, and light source conditions during the process of image acquisition. Therefore, the camera used in the study is a high-speed industrial camera and provides a non-frequency flash source. High-speed industrial camera has the advantages of high resolution, high-speed shooting, good stability, programmable control, fast data transmission and suitable for automated production lines, which can reduce the impact of the abovementioned influencing factors on image acquisition. Based on this, the research for collecting images of mechanical vibration signals can use the visual acquisition system, which is mainly composed of a high-speed industrial camera, a strobe-free flash source, a multi-channel transmission cable and so on. The workflow is shown in Figure 2 [20].
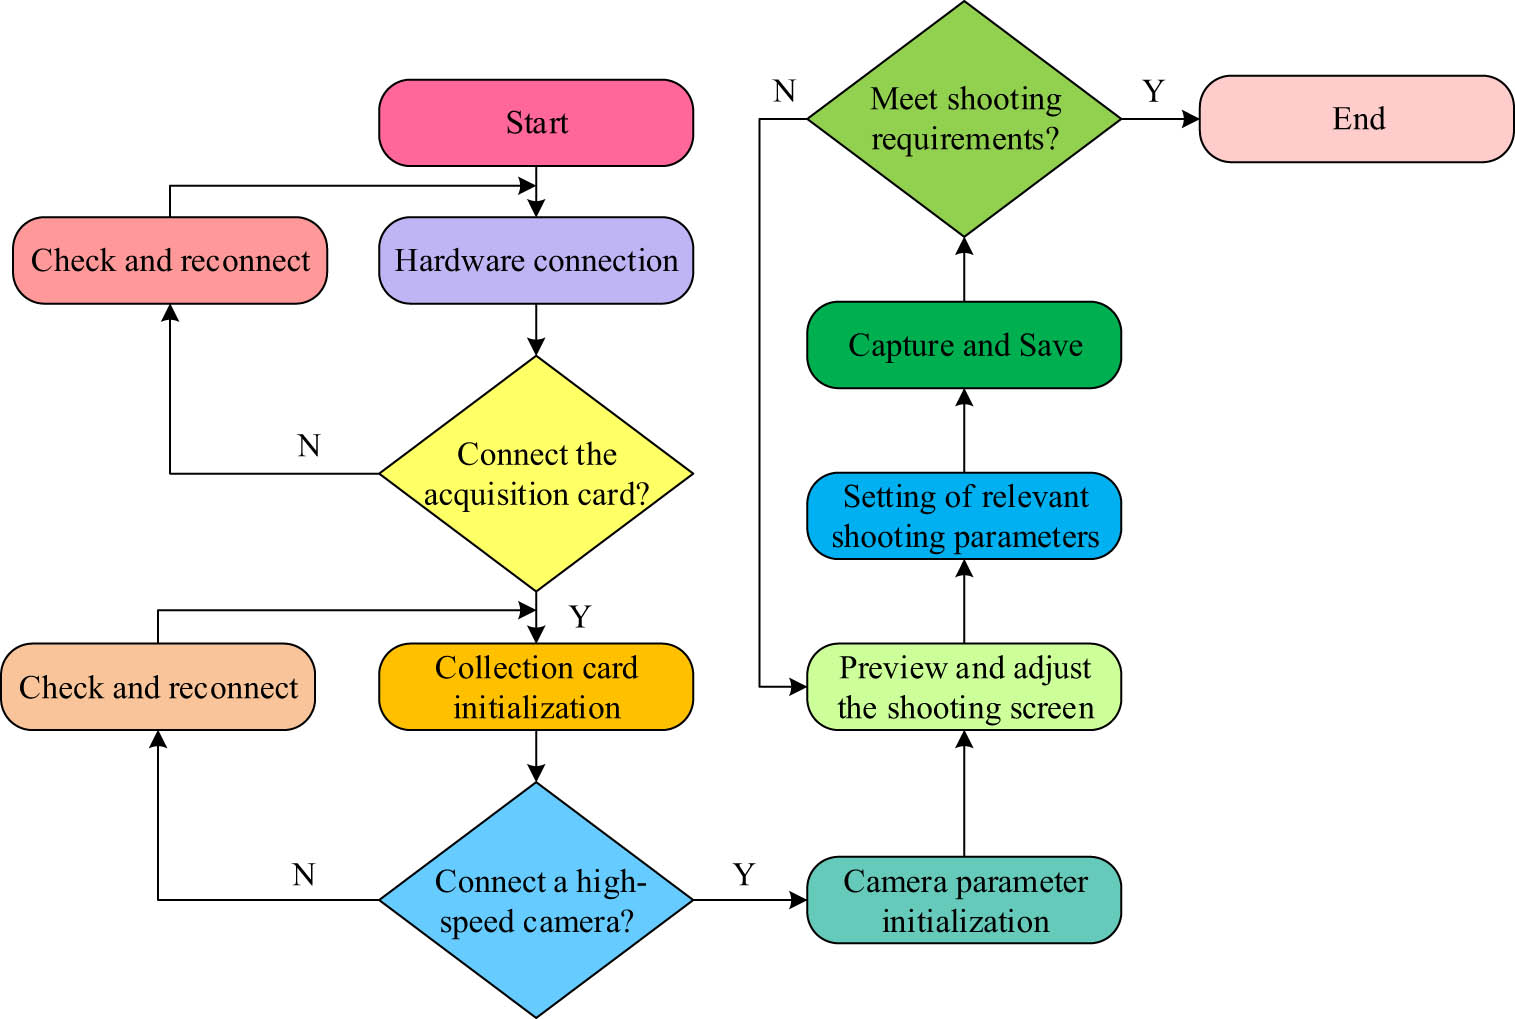
Workflow of the visual acquisition system.
In Figure 2, when the visual acquisition system is working, the software is connected to the hardware device, and then the acquisition card is connected and initialized. Next the high-speed camera is connected and the camera parameters are initialized. After connecting various components, it is necessary to check if the connection is successful. If it is not successful, it needs to be reconnected. The image captured by the camera is checked and adjusted, relevant parameters are set, and finally the image is captured and saved. When the image meets the shooting requirements, the collection work is finished. If it does not satisfy the demands, it needs to be retaken. After collecting mechanical vibration images using a visual acquisition system, a phase-based motion extraction method is utilized to extract the vibration acceleration signal. The calculation method is shown in formulas (1)–(4).
where
where
where
where
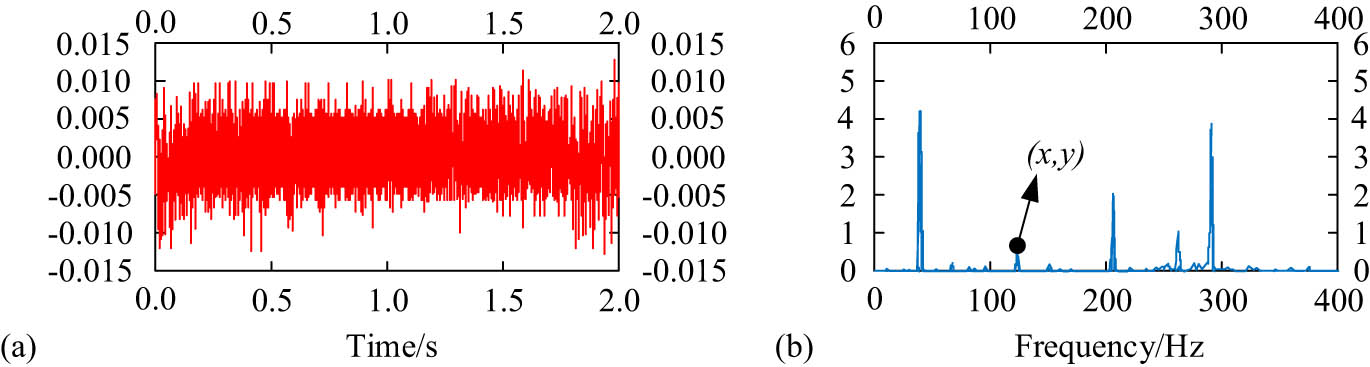
Spectrum diagram of the vibration signal. (a) Vibration time-domain signal. (b) Vibration frequency-domain signal.
In Figure 3, the vibration signal is converted into frequency-domain information, and the peak coordinate information in the frequency-domain is recorded to form a vector matrix, as shown in formula (5).
where the frequency-domain peak coordinate information is recorded by
where
3.2 FD of agricultural machinery design based on joint deep learning and MV
When using MV technology for FD of ASIME, mechanical photos are converted into frequency-domain data for diagnosis. However, during the diagnosis, it is found that the processing of a large amount of fault data is very complex and prone to diagnostic errors. In the FD of ASIME, the MV system can be used to recognize whether there is a fault in the equipment by monitoring the motion state, vibration, sound, and other information. Among them, the momentum principle can be used to analyze the kinetic characteristics of the equipment in the process of movement, and then determine whether there is a fault in the equipment. For example, when the equipment operates normally, its motion state should comply with the law of conservation of momentum, i.e., the sum of external and internal forces on the equipment is zero. When the equipment is faulty, due to the problem of faulty components, it may lead to changes in the mechanical properties of the equipment in the process of movement, making the law of conservation of momentum no longer hold. By analyzing the kinetic characteristics of the equipment in the process of movement, the type of fault that exists in the equipment can be identified, and then carry out the corresponding maintenance and treatment. CNN is a mathematical model simulating biological neural network, which has great advantages in data processing [21,22]. Therefore, the study combines it with MV technology for FD of ASIME. CNN mainly includes convolution, excitation, pooling, and fully connected layers. The structural diagram is shown in Figure 4.
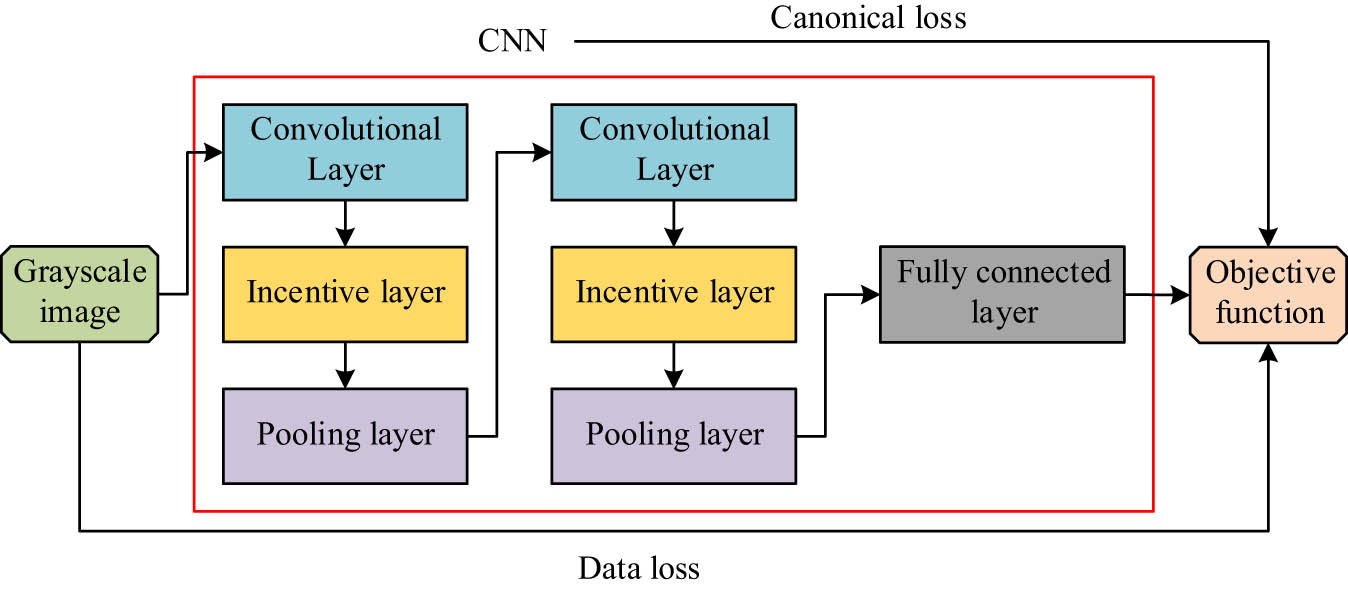
Schematic representation of the CNN structure.
Convolutional operation is the core of CNN algorithm, and its main function is to filter the input signal, extract feature information, and then transmit it to the pooling layer to form a feature map. In the network structure of CNN, there are a large number of convolutional layers, and the latter layer reprocesses the input data of the previous layer to obtain deeper features. The convolution calculation is shown in formula (7).
where
where
where
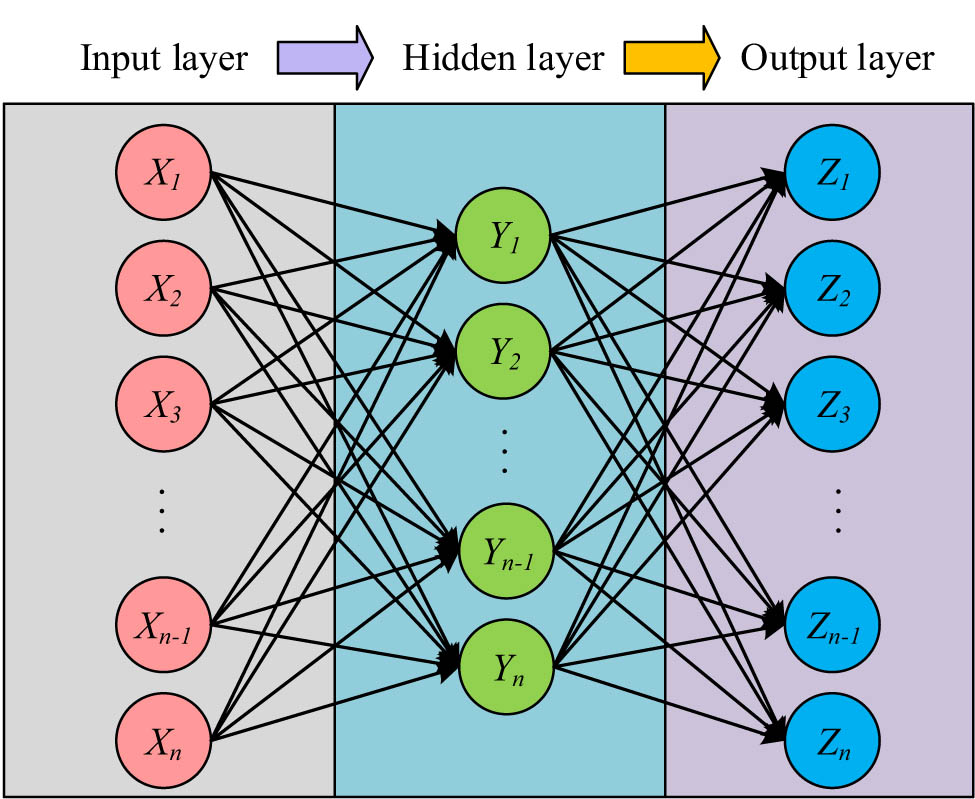
Schematic diagram of AE structure.
In Figure 5, the entire AE process can also be represented mathematically, as shown in formulas (10) and (11).
where
where
where
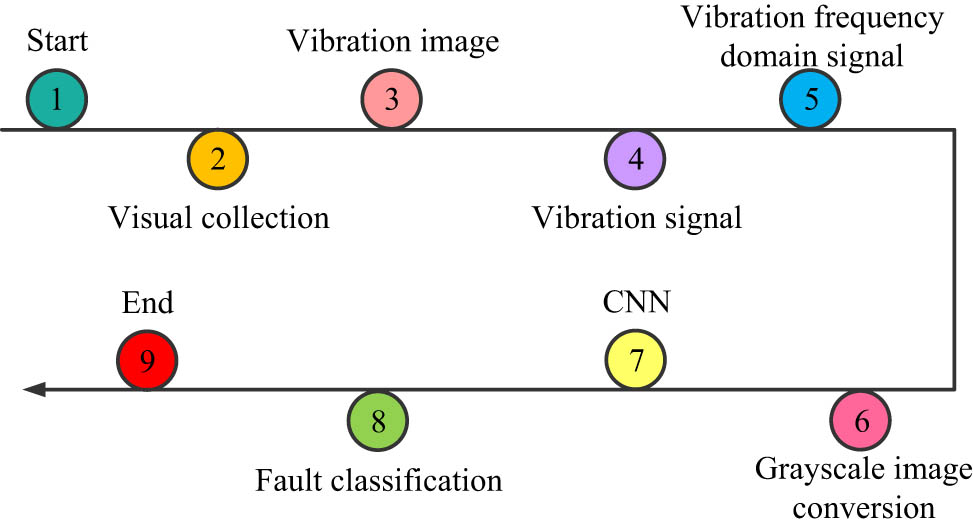
FD process of combined deep learning and MV.
In Figure 6, high-speed cameras are first used to obtain vibration images of different fault categories, and then the frequency-domain signals of vibration displacement are extracted using the video phase extraction method. Grayscale image transformation is performed on the original frequency-domain displacement signal obtained, and the grayscale image data are broken into training, validation, and test sets grounded on a certain proportion. The reliability of the network is trained and verified using the divided data training and validation sets, and data features are extracted using SAE, and then the test dataset is used to obtain FD results for sprinkler machinery.
4 Comparative analysis of SAE-CNN algorithm and empirical analysis of FD model
To analyze the effectiveness of the SAE-CNN algorithm and the practical application effect of the FD model combined with MV technology, in this part, the effectiveness of the SAE-CNN algorithm was examined through comparative experiments, and the diagnostic accuracy of the proposed sprinkler machinery FD model was verified.
4.1 Comparison and analysis of SAE-CNN algorithm performance
To evidence the superiority of the SAE-CNN algorithm proposed by the research institute in FD, this study conducted performance comparison experiments among the SAE-CNN and Support vector machine (SVM), CNN, and SAE algorithms. The experimental environment for the comparative test is shown in Table 1.
Experimental basic environmental parameters
| Parameter variables | Parameter selection |
|---|---|
| Overall implementation platform | Simulink |
| Operating system | Windows7 |
| Operating environment | Matlab2017 |
| PC side memory | 8G |
| CPU main frequency | 2.62 Hz |
| Global procurement unit | GTX-1070 |
| Central processing unit | i3-7100 |
| Data regression analysis system | SPSS26.0 |
In the test environment shown in Table 1, Iris dataset from the University of California (UCI) was also selected as the test set for this comparative test, and the accuracy, recall, precision, Receiver operating characteristic (ROC) and other indicators of the four algorithms were taken as the test indicators. The Iris dataset is a frequently utilized classification experiment dataset, called the Iris Flower Dataset. It contains 150 data samples, which are divided into 3 categories, with 50 data in each category and 4 attributes in each category. The accuracy and ROC results of the four algorithms are indicated in Figure 7.
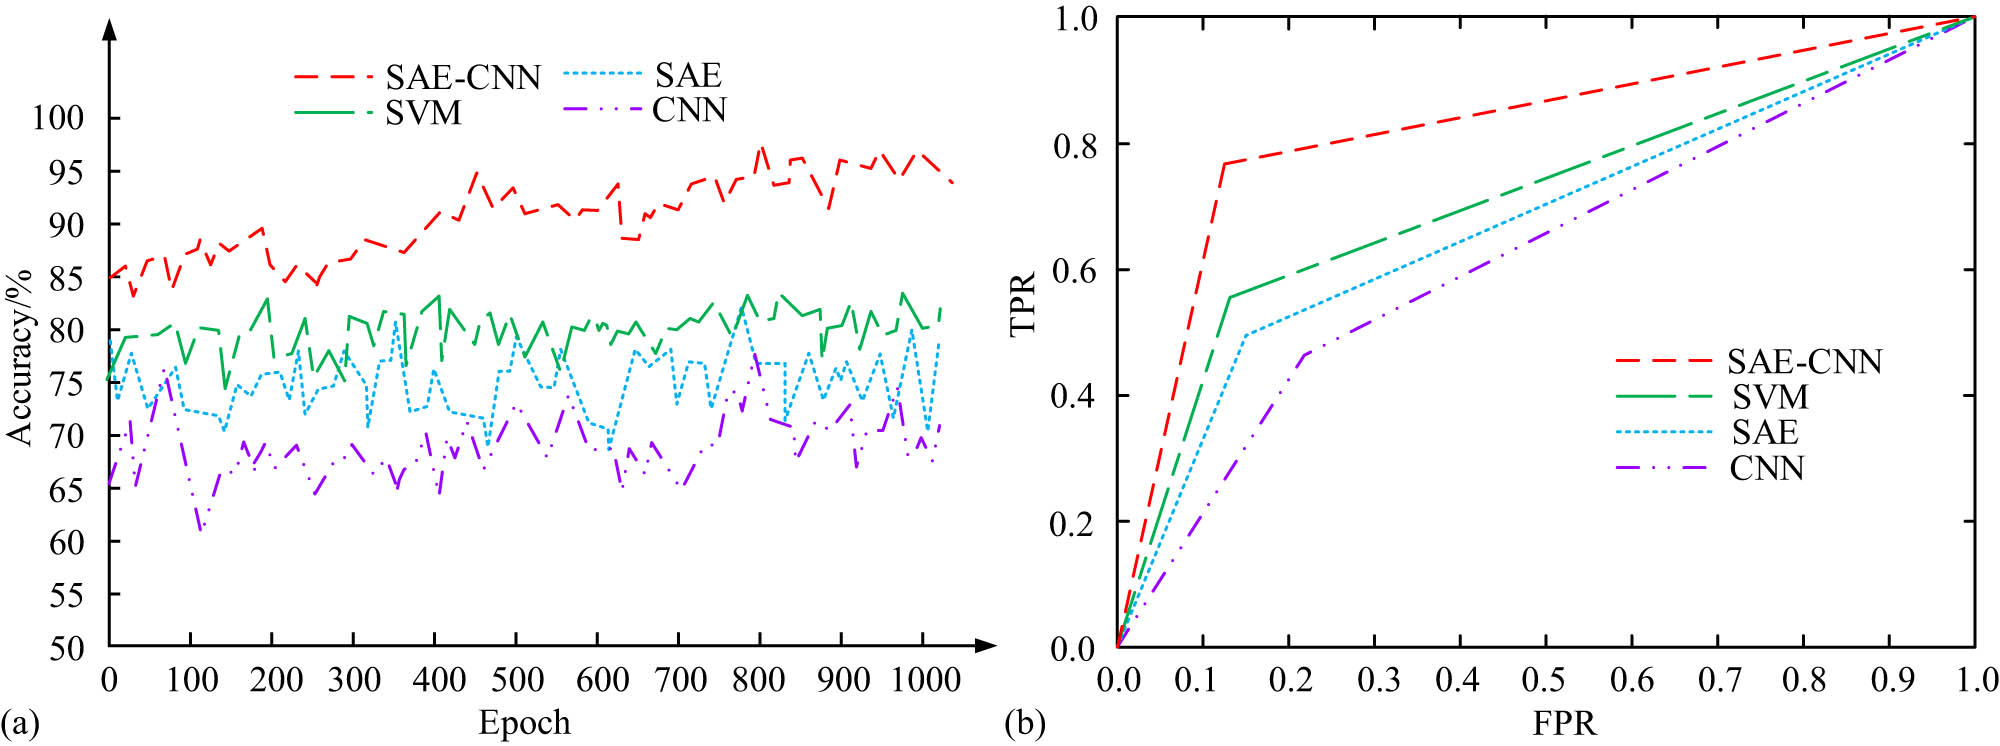
Accuracy of four algorithms and ROC results. (a) Accuracy. (b) ROC curve.
Figure 7(a) shows that the SAE-CNN algorithm’s accuracy after stable training was significantly higher than other algorithms, with the accuracy of 95.13, 81.23, 78.63, and 70.21% for SAE-CNN, SVM, SAE, and CNN algorithms, respectively. Figure 7(b) shows that the area under the ROC of SAE-CNN, SVM, SAE, and CNN algorithms was 0.82, 0.70, 0.68, and 0.64, respectively. The above outcomes denoted that the effectiveness of SAE-CNN algorithm was better than the comparison algorithm from the perspective of accuracy and ROC. This was because the proposed SAE-CNN algorithm introduced a loss function, namely, the mean square error function, which effectively reduced the loss value of the input data and the output data, and further improved the performance of the algorithm. The four algorithms’ training errors and accuracy results are indicated in Figure 8.
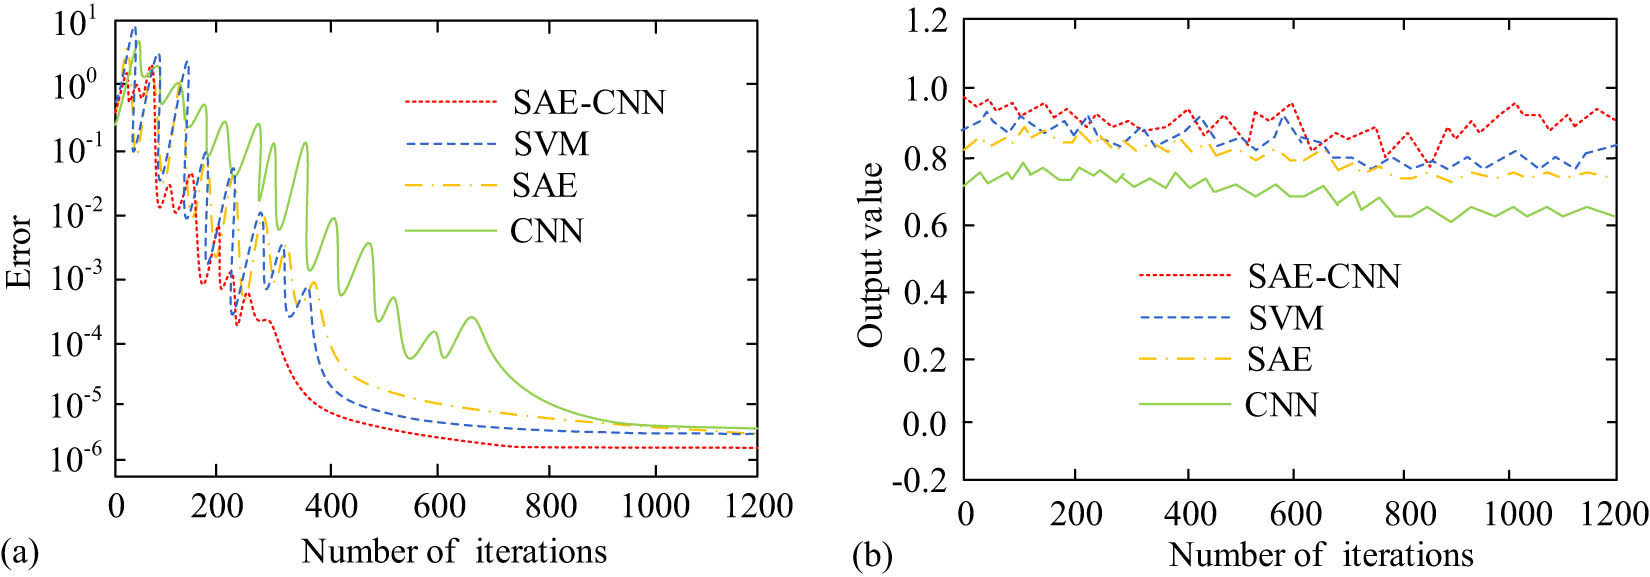
Training error and training accuracy results of four algorithms. (a) Training error. (b) Training accuracy.
Figure 8(a) shows that after stable training, the training error of the SAE-CNN algorithm was significantly lower than that of other algorithms. Among them, the training error of the SAE-CNN algorithm was 0.012%, which was lower than 0.058% of the SVM algorithm, 0.064% of the SAE algorithm, and 0.071% of the CNN algorithm. The analysis showed that the training error of the proposed SAE-CNN algorithm was extremely low, which may be because SAE algorithm further realizes data noise reduction and visual dimension reduction through feature learning, and better helps the feature learning process. At the same time, this was closely related to the training process being long enough to learn more details and noise on the training data. Figure 8(b) expresses that the training accuracy of SAE-CNN, SVM, SAE, and CNN algorithms was 0.95, 0.83, 0.81, and 0.62, respectively. The above outcomes indicated that from the dimensions of training error and training accuracy, the performance of SAE-CNN algorithm was also superior to the comparison algorithm. In addition, the recall and accuracy of the four algorithms were organized to obtain the recall and Precision–Recall (PR) curve results shown in Figure 9.
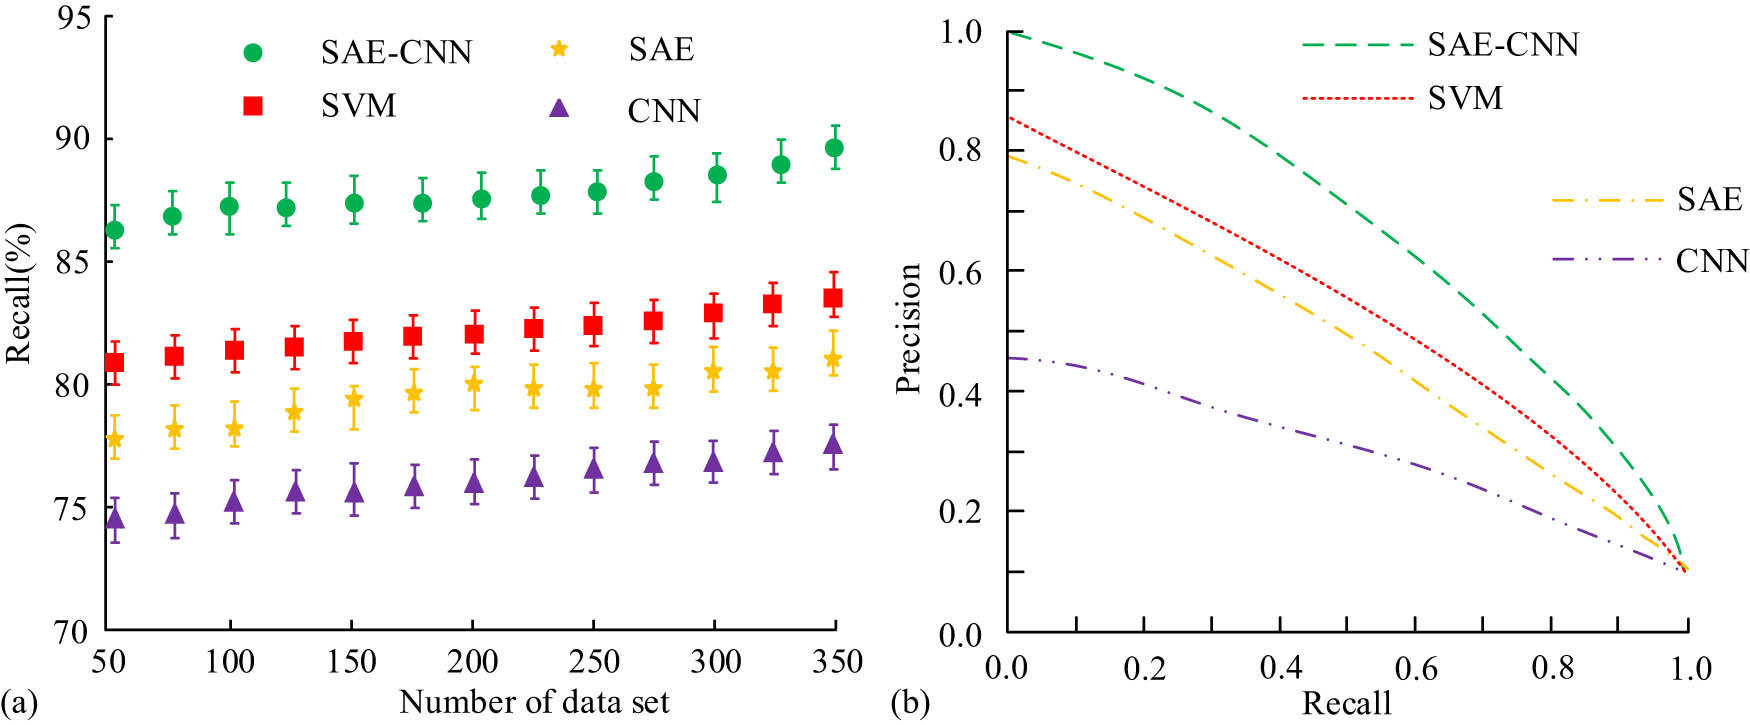
Comparison results of recall rates and PR curves of four algorithms. (a) Recall. (b) PR curve.
Figure 9(a) shows that the recall rate of SAE-CNN algorithm was significantly higher than other algorithms, with the recall rates of SAE-CNN, SVM, SAE, and CNN algorithms being 89.7, 81.3, 79.8, and 76.1%, respectively. Figure 9(b) shows that the areas under the PR curve of SAE-CNN, SVM, SAE, and CNN algorithms were 0.87, 0.82, 0.79, and 0.61, respectively. The above findings indicated that from the dimensions of recall rate and PR curve, the performance of SAE-CNN algorithm was also better than that of the comparison algorithm. The precision of four algorithms was tested in the end of the study, and the results are shown in Figure 10.
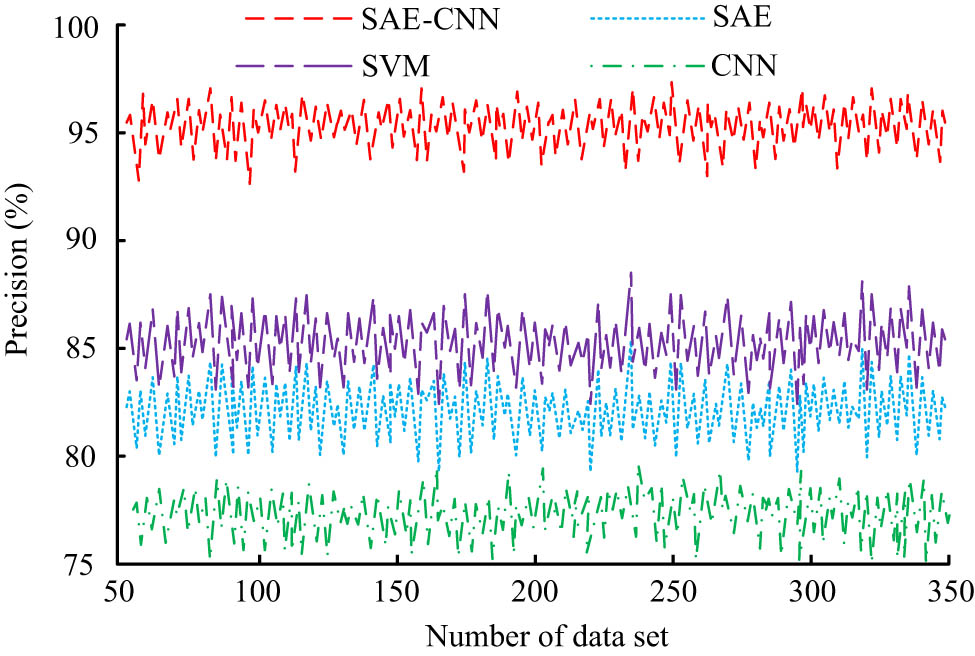
Precision values of four algorithms.
According to Figure 10, the precision of the SAE-CNN algorithm is as high as 95.16% on average, while the precision of SVM, SAE, and CNN algorithms are 86.15, 82.33, and 76.81%, respectively, all lower than the SAE-CNN algorithm. The performance of SAE-CNN algorithm is significantly better than other algorithms. Based on the comparative analysis of the above dimensions, the SAE-CNN algorithm proposed in the study had superior predictive performance. Therefore, this study will apply it to the FD of sprinkler machinery, hoping to promote the development of the field of sprinkler machinery FD.
4.2 Performance comparison and analysis of fault detection models based on SAE-CNN algorithm
To analyze the fault detection effect of the SAE-CNN fault detection model, this experiment selected the mechanical failure prevention technology (MFPT) dataset to test it and similar CNN and SVM fault detection models. The MFPT dataset is a publicly available dataset for mechanical FD and prediction. This dataset was explored by the National Institute of Standards and Technology in the United States to provide a standardized testing platform for evaluating and comparing the performance of different FD and prediction algorithms. The MFPT dataset contains various types of mechanical faults, such as bearing faults, gear faults, motor faults, etc. Each type of fault has multiple instances, covering faults of varying degrees and frequencies. To compare the FD performance of the three algorithms in MFPT dataset, the MFPT dataset was divided into a training set (70%) and a test set (30%). SVM was used for classification, while CNN constructed standard CNN for classification. Then, the training set was trained and the model parameters were optimized by cross-validation. Finally, the performance of each model was evaluated on the test set. The results obtained from the testing of three different algorithms are expressed in Table 2.
Test results of three different algorithms
| Number of tests | Classifier | Number of correct classifications | Accuracy (%) | Calculation time (s) |
|---|---|---|---|---|
| 30 | SAE-CNN | 90 | 90.12 | 9.892 |
| SVM | 72 | 72.35 | 11.055 | |
| CNN | 66 | 66.74 | 10.349 | |
| 60 | SAE-CNN | 94 | 94.56 | 8.926 |
| SVM | 75 | 75.18 | 10.371 | |
| CNN | 68 | 68.69 | 9.685 | |
| 90 | SAE-CNN | 98 | 98.45 | 6.863 |
| SVM | 78 | 78.29 | 9.014 | |
| CNN | 70 | 70.37 | 8.332 |
From Table 2, among the 100 randomly chosen test samples in the MFPT dataset, the SAE-CNN fault detection model achieved an accuracy of 90.12% in 30 tests, while the SVM and CNN fault detection models achieved 72.35 and 66.74%, respectively. In 60 tests and 90 tests, the SAE-CNN fault detection model’s accuracy was 94.56 and 98.45%, respectively, which were higher than those of the comparative fault detection model. In addition, the calculation time of the proposed model in 30, 60, and 90 tests was 9.892, 8.926, and 6.863 s, respectively, showing an obvious decreasing trend. Compared with the other two models, the calculation time of the proposed model was obviously less, and the efficiency was higher. From the above results, the fault detection model proposed in the study had better fault detection effectiveness than the comparative model. Besides, to further analyze the performance of the SAE-CNN fault detection model proposed in the study, the prediction error comparison results of three FD models in the MFPT dataset and the scoring results of relevant practitioners were collected and organized. The results are shown in Figure 11.
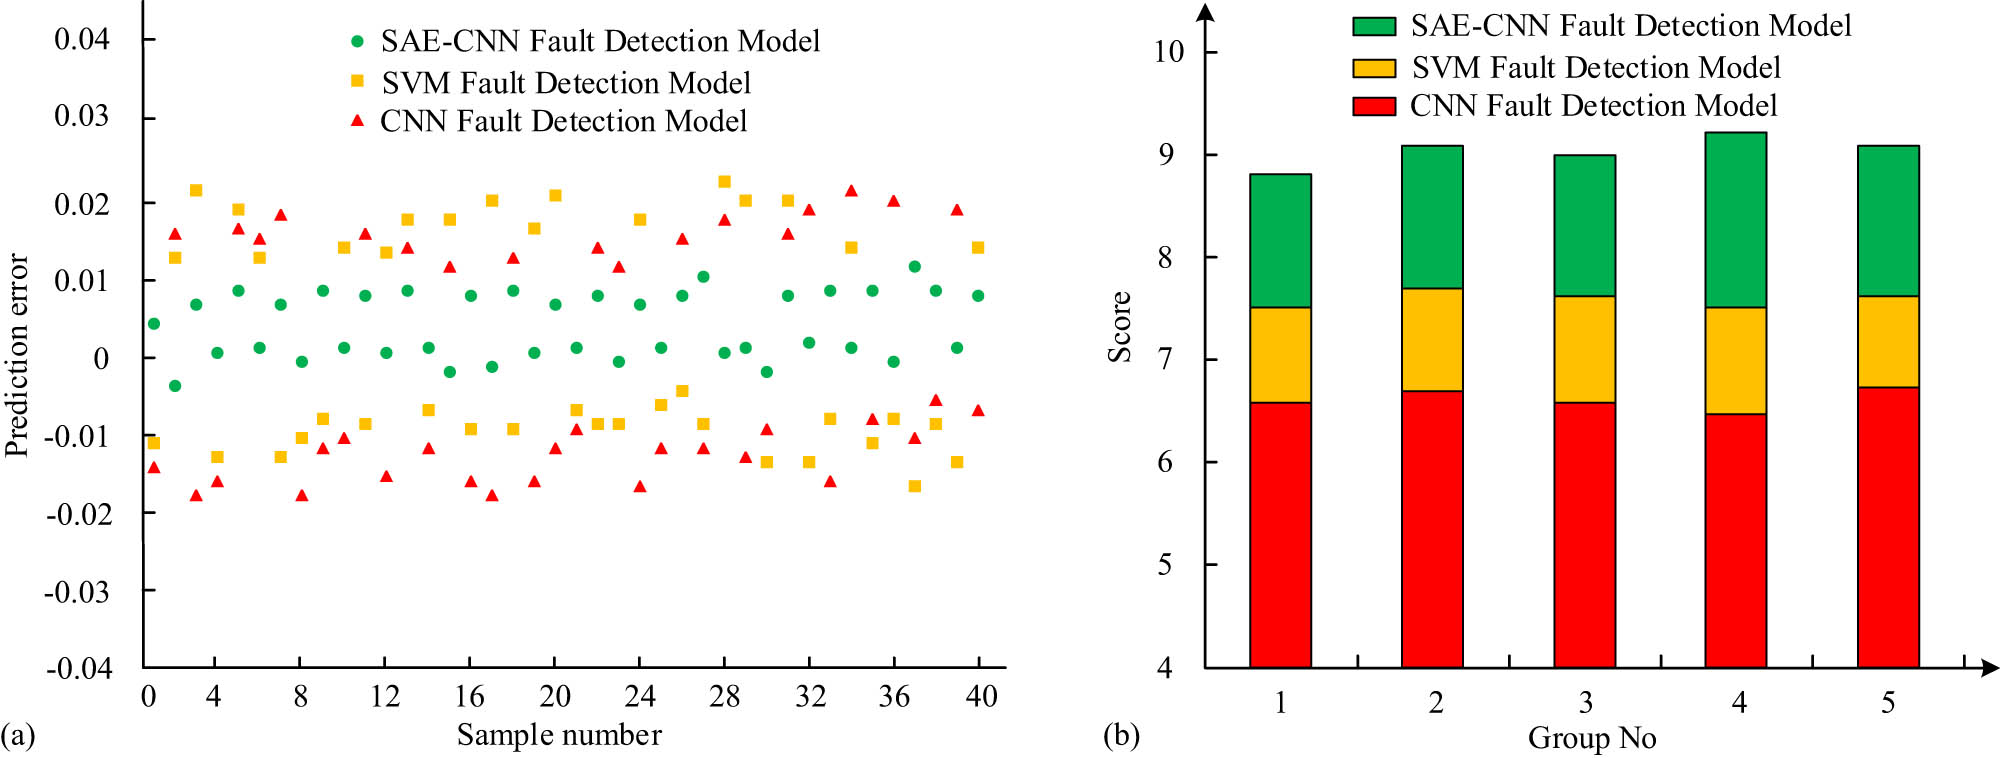
The prediction error of the SAE-CNN FD model. (a) Comparison of prediction errors of three algorithms. (b) Scoring results of three fault prediction models.
Figure 11(a) shows that the prediction error of the SAE-CNN FD model fluctuated around 0, and its maximum positive and negative errors in 40 samples were 0.012 and −0.003, respectively, which were superior to the SVM and CNN FD models. Figure 11(b) shows that five groups of relevant practitioners rated the SAE-CNN FD model higher than the other two FD models. The average score of the SAE-CNN FD model was 8.9 points, higher than the 7.5 and 6.7 points of the SVM and CNN FD models, respectively. The SAE-CNN FD model was analyzed and found to have high requirements on the amount of data, the coverage of fault samples, and the model’s environment, which may also be the reason for its FD score of 8.9. The reason is that by stacking multiple AE together to form a deeper neural network (SAE), this study can make up for the deficiencies of a single hidden layer in extracting data features, and further improve the accuracy of FD of sprinkler irrigation machinery and equipment. Therefore, in specific FD, the model needs to be provided with a complete set of data and mature environmental conditions. Although the FD score did not reach more than 9, the predictive performance of the SAE-CNN FD model proposed in the study was better compared with the existing FD models and has been recognized by practitioners. Therefore, its application to the FD of actual sprinkler irrigation machinery can effectively improve the accuracy of FD, thus promoting the development of the field of sprinkler irrigation machinery.
5 Conclusion
To deal with the problems of low accuracy and long-time of traditional agricultural sprinkler equipment FD model, SAE-CNN FD model of agricultural sprinkler equipment was constructed based on MV method in this study. Among them, SAE algorithm realized the scaling and feature extraction of raw data through sparse coding and AE. After this, the extracted features used the CNN to complete the FD. The results showed that on the MFPT dataset, the accuracy of SAE-CNN fault detection model was 90.12, 94.56, and 98.45% in 30, 60, and 90 tests, respectively. The prediction error of SAE-CNN FD model fluctuated around 0, and the maximum positive and negative errors of 40 samples were 0.012 and −0.003, respectively. At the same time, the average score of the FD model was 8.9, which was better than the comparison method. This proved that the FD model of ASIME proposed in this study could identify and classify different types of faults more accurately, and improve the accuracy and efficiency of FD. However, there are still shortcomings in the research. First, factors such as lighting conditions, weather conditions, and dust in agricultural environments can significantly affect the processing effectiveness of the proposed model. Second, ASIME may require real-time monitoring and diagnosis during operation, which will put higher demands on the computational power and algorithm efficiency of the proposed model. In the future, it is necessary to combine improved sensor technology and use image enhancement techniques to improve image quality. Meanwhile, simplifying algorithms or using approximate algorithms can reduce computational complexity and further improve processing speed.
-
Funding information: Authors state no funding involved.
-
Author contributions: Xinping Wu: study design, data collection, statistical analysis, visualization, writing, and revision of the original draft. Rongnian He: statistical analysis and revision of the manuscript. Mengyu Chen led and supervised this study. All authors have accepted responsibility for the entire content of this manuscript and approved its submission.
-
Conflict of interest: Authors state no conflict of interest.
-
Data availability statement: All data generated or analyzed during this study are included in this published article.
References
[1] Acácio G, Cordeiro E, Nicolai M, Saul J, Ovejero R, Brunharo C, et al. Population genomics of Digitaria insularis from soybean areas in Brazil. Pest Manag Sci. 2021;77(12):5375–81.10.1002/ps.6577Search in Google Scholar PubMed PubMed Central
[2] Singh G, Patel N, Ranjan M, Pal S, Ahirwal J, Dubey S. Hydrochemical characteristics and water quality indices‐based assessment of River Kali for agricultural irrigation in northern India. Irrig Drain. 2022;71(2):510–20.10.1002/ird.2654Search in Google Scholar
[3] Komissarov A, Komissarov M, Minniakhmetov I, Lykasiv O, Afanasyeva J. Effect of sprinkler irrigation on the properties of leached chernozem and the yield of Bromopsis inermis Leyss. in the Southern Cis-Ural. Plant Soil Environ. 2021;67(8):482–9.10.17221/614/2020-PSESearch in Google Scholar
[4] Link C. Telecentric blue light lenses: Promising advantages for machine vision. Inf Disp. 2021;37(1):23–8.10.1002/msid.1179Search in Google Scholar
[5] Manlin C, Zhijie Z, Guanyu H U, You C. A novel combination belief rule base model for mechanical equipment fault diagnosis. Chinese Journal of Aeronautics, 2022;35(5):158–78.10.1016/j.cja.2021.08.037Search in Google Scholar
[6] Akbari M, Gheysari M, Mostafazadeh-Fard B, hayannejad M. Surface irrigation simulation-optimization model based on meta-heuristic algorithms - ScienceDirect. Agric Water Manag. 2018;201(7):46–57.10.1016/j.agwat.2018.01.015Search in Google Scholar
[7] Chavez JC, Juan E, Meki MN, Jaehak J, Singh VP. Simulation of energy sorghum under limited irrigation levels using the EPIC model. Trans ASABE. 2018;61(1):121–31.10.13031/trans.12470Search in Google Scholar
[8] Felfelani F, Pokhrel Y, Guan K, Lawrence DM. Utilizing SMAP soil moisture data to constrain irrigation in the community land model. Geophys Res Lett. 2018;45(23):12892–902.10.1029/2018GL080870Search in Google Scholar
[9] Liu J, Gull U, Putnam DH. Variable-rate irrigation uniformity model for linear-move sprinkler systems. Trans ASABE. 2021;64(4):1295–302.10.13031/trans.14313Search in Google Scholar
[10] Zhang C, Engel BA, Guo P, Liu X, Wang Y. Double-sided stochastic chance-constrained linear fractional programming model for managing irrigation water under uncertainty. J Hydrol. 2018;564(8):457–75.10.1016/j.jhydrol.2018.07.024Search in Google Scholar
[11] Abhyankar VV, Gavade SA, Bhole KS. System development for simultaneous measurement and control of pH and moisture of soil. 2019 International Conference on Nascent Technologies in Engineering (ICNTE). IEEE; 2019. p. 1–5.10.1109/ICNTE44896.2019.8946049Search in Google Scholar
[12] Gavade S, Kulkarni S, Mohite S, Bhole K. Development of integrated versatile paper, plastic and aluminum waste sorting and disposal system. Advances in Manufacturing Systems: Select Proceedings of RAM 2020. Singapore: Springer; 2021. p. 63–74.10.1007/978-981-33-4466-2_7Search in Google Scholar
[13] Daoliang L, Qi W, Xin L, Meilin N, He W, Chunhong L. Recent advances of machine vision technology in fish classification. ICES J Mar Sci. 2022;79(2):263–84.10.1093/icesjms/fsab264Search in Google Scholar
[14] Zhang Z, Bai S, Xu GS, Liu X, Jia J, Feng Z. Knitting needle fault detection system for hosiery machine based on laser detection and machine vision. Text Res J. 2021;91(1–2):143–51.10.1177/0040517520935210Search in Google Scholar
[15] Liu TH, Wu ZD, Chen QL, Nie XN, Li GQ, Wang HJ. Intelligent bamboo part sorting system design via machine vision. For Prod J. 2021;71(1):27–38.10.13073/FPJ-D-20-00030Search in Google Scholar
[16] Hou J, Lu X, Zhong Y, Zhong Y, He W, Zhao D, et al. A comprehensive review of mechanical fault diagnosis methods based on convolutional neural network. J Vibroeng. 2024;26(1):44–65.10.21595/jve.2023.23391Search in Google Scholar
[17] Cai C, Jiang Z, Wu H, Wang J, Liu J, Song L. Research on knowledge graph-driven equipment fault diagnosis method for intelligent manufacturing. Int J Adv Manuf Technol. 2024;130(9):4649–62.10.1007/s00170-024-12998-xSearch in Google Scholar
[18] Maurya M, Panigrahi I, Dash D, Malla C. Intelligent fault diagnostic system for rotating machinery based on IoT with cloud computing and artificial intelligence techniques: A review. Soft Comput. 2024;28(1):477–94.10.1007/s00500-023-08255-0Search in Google Scholar
[19] Panda R, Rautaray S, Panigrahi P. Managing canal water through farm-pond fed pressurized irrigation system. Indian J Soil Conserv. 2020;48(1):80–5.Search in Google Scholar
[20] Tan H, Reed C, Jiao Y, Perez Z, Wilson E, Jung J, et al. Acquisition of 500 English words through a tactile phonemic sleeve (TAPS). IEEE Trans Haptics. 2020;13(4):745–60.10.1109/TOH.2020.2973135Search in Google Scholar PubMed
[21] Mazzi Y, Sassi H, Gaga A, Errahimi F. State of charge estimation of an electric vehicle’s battery using tiny neural network embedded on small microcontroller units. Int J Energy Res. 2022;46(6):8102–19.10.1002/er.7713Search in Google Scholar
[22] Chen Z. Research on internet security situation awareness prediction technology based on improved RBF neural network algorithm. J Comput Cognit Eng. 2022;1(3):103–8.10.47852/bonviewJCCE149145205514Search in Google Scholar
[23] Phadikar S, Sinha N, Ghosh R. Automatic eyeblink artefact identification and removal from EEG using independent component analysis in combination with support vector machines and denoising autoencoder. IET Signal Process, 2020;14(6):396–405.10.1049/iet-spr.2020.0025Search in Google Scholar
© 2025 the author(s), published by De Gruyter
This work is licensed under the Creative Commons Attribution 4.0 International License.
Articles in the same Issue
- Research Articles
- Generalized (ψ,φ)-contraction to investigate Volterra integral inclusions and fractal fractional PDEs in super-metric space with numerical experiments
- Solitons in ultrasound imaging: Exploring applications and enhancements via the Westervelt equation
- Stochastic improved Simpson for solving nonlinear fractional-order systems using product integration rules
- Exploring dynamical features like bifurcation assessment, sensitivity visualization, and solitary wave solutions of the integrable Akbota equation
- Research on surface defect detection method and optimization of paper-plastic composite bag based on improved combined segmentation algorithm
- Impact the sulphur content in Iraqi crude oil on the mechanical properties and corrosion behaviour of carbon steel in various types of API 5L pipelines and ASTM 106 grade B
- Unravelling quiescent optical solitons: An exploration of the complex Ginzburg–Landau equation with nonlinear chromatic dispersion and self-phase modulation
- Perturbation-iteration approach for fractional-order logistic differential equations
- Variational formulations for the Euler and Navier–Stokes systems in fluid mechanics and related models
- Rotor response to unbalanced load and system performance considering variable bearing profile
- DeepFowl: Disease prediction from chicken excreta images using deep learning
- Channel flow of Ellis fluid due to cilia motion
- A case study of fractional-order varicella virus model to nonlinear dynamics strategy for control and prevalence
- Multi-point estimation weldment recognition and estimation of pose with data-driven robotics design
- Analysis of Hall current and nonuniform heating effects on magneto-convection between vertically aligned plates under the influence of electric and magnetic fields
- A comparative study on residual power series method and differential transform method through the time-fractional telegraph equation
- Insights from the nonlinear Schrödinger–Hirota equation with chromatic dispersion: Dynamics in fiber–optic communication
- Mathematical analysis of Jeffrey ferrofluid on stretching surface with the Darcy–Forchheimer model
- Exploring the interaction between lump, stripe and double-stripe, and periodic wave solutions of the Konopelchenko–Dubrovsky–Kaup–Kupershmidt system
- Computational investigation of tuberculosis and HIV/AIDS co-infection in fuzzy environment
- Signature verification by geometry and image processing
- Theoretical and numerical approach for quantifying sensitivity to system parameters of nonlinear systems
- Chaotic behaviors, stability, and solitary wave propagations of M-fractional LWE equation in magneto-electro-elastic circular rod
- Dynamic analysis and optimization of syphilis spread: Simulations, integrating treatment and public health interventions
- Visco-thermoelastic rectangular plate under uniform loading: A study of deflection
- Threshold dynamics and optimal control of an epidemiological smoking model
- Numerical computational model for an unsteady hybrid nanofluid flow in a porous medium past an MHD rotating sheet
- Regression prediction model of fabric brightness based on light and shadow reconstruction of layered images
- Dynamics and prevention of gemini virus infection in red chili crops studied with generalized fractional operator: Analysis and modeling
- Qualitative analysis on existence and stability of nonlinear fractional dynamic equations on time scales
- Fractional-order super-twisting sliding mode active disturbance rejection control for electro-hydraulic position servo systems
- Analytical exploration and parametric insights into optical solitons in magneto-optic waveguides: Advances in nonlinear dynamics for applied sciences
- Bifurcation dynamics and optical soliton structures in the nonlinear Schrödinger–Bopp–Podolsky system
- User profiling in university libraries by combining multi-perspective clustering algorithm and reader behavior analysis
- Exploring bifurcation and chaos control in a discrete-time Lotka–Volterra model framework for COVID-19 modeling
- Review Article
- Haar wavelet collocation method for existence and numerical solutions of fourth-order integro-differential equations with bounded coefficients
- Special Issue: Nonlinear Analysis and Design of Communication Networks for IoT Applications - Part II
- Silicon-based all-optical wavelength converter for on-chip optical interconnection
- Research on a path-tracking control system of unmanned rollers based on an optimization algorithm and real-time feedback
- Analysis of the sports action recognition model based on the LSTM recurrent neural network
- Industrial robot trajectory error compensation based on enhanced transfer convolutional neural networks
- Research on IoT network performance prediction model of power grid warehouse based on nonlinear GA-BP neural network
- Interactive recommendation of social network communication between cities based on GNN and user preferences
- Application of improved P-BEM in time varying channel prediction in 5G high-speed mobile communication system
- Construction of a BIM smart building collaborative design model combining the Internet of Things
- Optimizing malicious website prediction: An advanced XGBoost-based machine learning model
- Economic operation analysis of the power grid combining communication network and distributed optimization algorithm
- Sports video temporal action detection technology based on an improved MSST algorithm
- Internet of things data security and privacy protection based on improved federated learning
- Enterprise power emission reduction technology based on the LSTM–SVM model
- Construction of multi-style face models based on artistic image generation algorithms
- Research and application of interactive digital twin monitoring system for photovoltaic power station based on global perception
- Special Issue: Decision and Control in Nonlinear Systems - Part II
- Animation video frame prediction based on ConvGRU fine-grained synthesis flow
- Application of GGNN inference propagation model for martial art intensity evaluation
- Benefit evaluation of building energy-saving renovation projects based on BWM weighting method
- Deep neural network application in real-time economic dispatch and frequency control of microgrids
- Real-time force/position control of soft growing robots: A data-driven model predictive approach
- Mechanical product design and manufacturing system based on CNN and server optimization algorithm
- Application of finite element analysis in the formal analysis of ancient architectural plaque section
- Research on territorial spatial planning based on data mining and geographic information visualization
- Fault diagnosis of agricultural sprinkler irrigation machinery equipment based on machine vision
- Closure technology of large span steel truss arch bridge with temporarily fixed edge supports
- Intelligent accounting question-answering robot based on a large language model and knowledge graph
- Analysis of manufacturing and retailer blockchain decision based on resource recyclability
- Flexible manufacturing workshop mechanical processing and product scheduling algorithm based on MES
- Exploration of indoor environment perception and design model based on virtual reality technology
- Tennis automatic ball-picking robot based on image object detection and positioning technology
- A new CNN deep learning model for computer-intelligent color matching
- Design of AR-based general computer technology experiment demonstration platform
- Indoor environment monitoring method based on the fusion of audio recognition and video patrol features
- Health condition prediction method of the computer numerical control machine tool parts by ensembling digital twins and improved LSTM networks
- Establishment of a green degree evaluation model for wall materials based on lifecycle
- Quantitative evaluation of college music teaching pronunciation based on nonlinear feature extraction
- Multi-index nonlinear robust virtual synchronous generator control method for microgrid inverters
- Manufacturing engineering production line scheduling management technology integrating availability constraints and heuristic rules
- Analysis of digital intelligent financial audit system based on improved BiLSTM neural network
- Attention community discovery model applied to complex network information analysis
- A neural collaborative filtering recommendation algorithm based on attention mechanism and contrastive learning
- Rehabilitation training method for motor dysfunction based on video stream matching
- Research on façade design for cold-region buildings based on artificial neural networks and parametric modeling techniques
- Intelligent implementation of muscle strain identification algorithm in Mi health exercise induced waist muscle strain
- Optimization design of urban rainwater and flood drainage system based on SWMM
- Improved GA for construction progress and cost management in construction projects
- Evaluation and prediction of SVM parameters in engineering cost based on random forest hybrid optimization
- Museum intelligent warning system based on wireless data module
- Optimization design and research of mechatronics based on torque motor control algorithm
- Special Issue: Nonlinear Engineering’s significance in Materials Science
- Experimental research on the degradation of chemical industrial wastewater by combined hydrodynamic cavitation based on nonlinear dynamic model
- Study on low-cycle fatigue life of nickel-based superalloy GH4586 at various temperatures
- Some results of solutions to neutral stochastic functional operator-differential equations
- Ultrasonic cavitation did not occur in high-pressure CO2 liquid
- Research on the performance of a novel type of cemented filler material for coal mine opening and filling
- Testing of recycled fine aggregate concrete’s mechanical properties using recycled fine aggregate concrete and research on technology for highway construction
- A modified fuzzy TOPSIS approach for the condition assessment of existing bridges
- Nonlinear structural and vibration analysis of straddle monorail pantograph under random excitations
- Achieving high efficiency and stability in blue OLEDs: Role of wide-gap hosts and emitter interactions
- Construction of teaching quality evaluation model of online dance teaching course based on improved PSO-BPNN
- Enhanced electrical conductivity and electromagnetic shielding properties of multi-component polymer/graphite nanocomposites prepared by solid-state shear milling
- Optimization of thermal characteristics of buried composite phase-change energy storage walls based on nonlinear engineering methods
- A higher-performance big data-based movie recommendation system
- Nonlinear impact of minimum wage on labor employment in China
- Nonlinear comprehensive evaluation method based on information entropy and discrimination optimization
- Application of numerical calculation methods in stability analysis of pile foundation under complex foundation conditions
- Research on the contribution of shale gas development and utilization in Sichuan Province to carbon peak based on the PSA process
- Characteristics of tight oil reservoirs and their impact on seepage flow from a nonlinear engineering perspective
- Nonlinear deformation decomposition and mode identification of plane structures via orthogonal theory
- Numerical simulation of damage mechanism in rock with cracks impacted by self-excited pulsed jet based on SPH-FEM coupling method: The perspective of nonlinear engineering and materials science
- Cross-scale modeling and collaborative optimization of ethanol-catalyzed coupling to produce C4 olefins: Nonlinear modeling and collaborative optimization strategies
- Unequal width T-node stress concentration factor analysis of stiffened rectangular steel pipe concrete
- Special Issue: Advances in Nonlinear Dynamics and Control
- Development of a cognitive blood glucose–insulin control strategy design for a nonlinear diabetic patient model
- Big data-based optimized model of building design in the context of rural revitalization
- Multi-UAV assisted air-to-ground data collection for ground sensors with unknown positions
- Design of urban and rural elderly care public areas integrating person-environment fit theory
- Application of lossless signal transmission technology in piano timbre recognition
- Application of improved GA in optimizing rural tourism routes
- Architectural animation generation system based on AL-GAN algorithm
- Advanced sentiment analysis in online shopping: Implementing LSTM models analyzing E-commerce user sentiments
- Intelligent recommendation algorithm for piano tracks based on the CNN model
- Visualization of large-scale user association feature data based on a nonlinear dimensionality reduction method
- Low-carbon economic optimization of microgrid clusters based on an energy interaction operation strategy
- Optimization effect of video data extraction and search based on Faster-RCNN hybrid model on intelligent information systems
- Construction of image segmentation system combining TC and swarm intelligence algorithm
- Particle swarm optimization and fuzzy C-means clustering algorithm for the adhesive layer defect detection
- Optimization of student learning status by instructional intervention decision-making techniques incorporating reinforcement learning
- Fuzzy model-based stabilization control and state estimation of nonlinear systems
- Optimization of distribution network scheduling based on BA and photovoltaic uncertainty
- Tai Chi movement segmentation and recognition on the grounds of multi-sensor data fusion and the DBSCAN algorithm
- Special Issue: Dynamic Engineering and Control Methods for the Nonlinear Systems - Part III
- Generalized numerical RKM method for solving sixth-order fractional partial differential equations