Cross-scale modeling and collaborative optimization of ethanol-catalyzed coupling to produce C4 olefins: Nonlinear modeling and collaborative optimization strategies
-
Jiayang Xiao
 ,
Kaijia Luo
,
Kaijia Luo

Abstract
This study uses nonlinear modeling methods to construct a complete modeling framework that integrates univariate quadratic regression, orthogonal experimental design, and multivariate polynomial regression based on 147 sets of multi-catalyst experimental data and dynamic time-series data. This study first revealed the nonlinear influence of temperature on the ethanol conversion rate and C4 olefin selectivity using a quadratic model. Then, the main effects of factors such as the Co loading, charge ratio, and ethanol concentration were quantified using an orthogonal experimental system. Finally, a standardized multivariate interaction model was constructed to deeply analyze the physical meaning of interaction terms such as temperature, Co loading, and charge ratio. The results show that the root mean square error of the model on the test set is less than 1.14%, and the coefficient of determination (R 2) is higher than 0.937, demonstrating good generalization ability and engineering applicability. This study presents a digital modeling paradigm with explanatory power, predictive power, and scalability based on nonlinear engineering for the mechanism elucidation and industrial processes of complex catalytic reaction systems.
1 Introduction
Driven by the dual carbon strategy, constructing a high-value olefin production pathway using bioethanol as a raw material has become an important development direction for the green chemical industry. As the basic raw material for synthesizing rubber and plastics, the selectivity and yield of olefins are complexly influenced by the microstructure of the catalyst (such as the Co active site density, carrier acidity, and alkalinity) and macroscopic reaction conditions (such as temperature and ethanol concentration). However, most existing studies have limitations, including a focus on the impact of a single reaction factor on the reaction performance, the absence of quantitative interaction models, the complexity of catalyst components, and a disconnect between data-driven and mechanistic approaches. Adamczyk et al. studied alcohol catalytic reductive coupling in green synthesis, investigating monometallic intermediate formation via vanadium aminopyridinate separation and kinetics, aiding reaction optimization and atomic economy [1]. Joshi and Bollini tested ethanol catalytic conversion in a Cu/SiO₂–ZrO₂ segregated bed, focusing on target product selectivity for multi-functional cascades to support efficient low-carbon processes [2]. Tian et al. fitted ethanol selectivity with the Flory–Huggins model (1.6% deviation) but lacked mechanistic explanations, hindering low-carbon catalytic system design and revealing a gap between theory and application [3].
The main contributions of this study include the following: (1) starting from single factor nonlinear modeling (temperature performance relationship), this study gradually expands to multifactor orthogonal experiments and multivariate interaction modeling, forming a cross-scale model system of “data mechanism fusion”; (2) using multiple polynomial regression, standardized regression coefficients, and interaction term analysis, quantitatively reveal the main effects and coupling effects of factors such as temperature, Co loading, and loading ratio; (3) based on the demand for green energy transformation, this study focuses on the nonlinear coupling problem in the ethanol coupling reaction and proposes a high-order modeling scheme that emphasizes both data-driven and mechanism interpretation.
The structure of this article is as follows: Section 1 introduces the background of the research on the ethanol catalytic coupling reaction, elaborates on its importance in the chemical industry, sorts out the research status in the reaction mechanism, catalyst research and development, points out the shortcomings of existing research, and then outlines the research contribution of this article. Section 2 is the methodology, which elaborates on the construction process of the kinetic model for the ethanol catalytic coupling reaction, explains the mechanism of genetic algorithm for parameter optimization, and explains the basis for selecting the neural network structure design and training methods. Section 3 is the experiment, which describes the sources and preprocessing process of 147 sets of multicatalyst experimental data and dynamic time-series data, constructs a univariate quadratic regression model and tests it, uses the controlled variable method to analyze the single-factor influence, an orthogonal experiment to analyze the multifactor coupling effect, and constructs a multivariate polynomial regression model. Section 4 is the results, summarizing the parameter values of the model under different conditions, analyzing the accuracy and reliability of the model, and demonstrating the degree of fitting under typical reaction conditions. Section 5 is the conclusion, summarizing the effectiveness of the constructed model in predicting the distribution of products and reaction rates in ethanol catalytic coupling reactions, and pointing out the limitations of the model. It proposes future research directions, including introducing multiphysics field coupling to extend the model.
2 Materials and methods
The ethanol catalytic coupling reaction is a complex system involving multistep elementary reactions, which include the key step of ethanol dehydrogenation to acetaldehyde under the action of the catalyst active sites. The rate constant
There is an exponential relationship between the reaction rate constant and temperature. The above equation not only reveals the quantitative effect of temperature on the reaction rate but also indicates that the reaction rate constant is closely related to the activation energy and pre-exponential factor, providing an important theoretical basis for a deeper understanding of the reaction kinetics of each step in ethanol-catalyzed coupling reactions [5]. At low temperatures where
Orthogonal tables
Here,
Due to significant differences C o in the load (wt%), temperature (°C), ethanol concentration (mL/min), and other parameters, standardization is necessary.
The standardized regression coefficient
2.1 Dataset source and preprocessing
The dataset in this article is taken from https://www.mcm.edu.cn. A total of 147 samples were collected, covering multiple catalyst combinations and temperatures, covering 21 catalyst combinations and 7 temperature levels (250–450°C). Each set of data contains multiple experimental factors (Co loading, loading ratio, mass, ethanol concentration, etc.) and output indicators (ethanol conversion rate,
The data on the time-resolved reaction performance of a specific catalyst combination (Co 1 wt%, and loading ratio 1:1) at 350°C includes seven time nodes, multiple product selectivity, and conversion rates, which are used to analyze the reaction kinetic characteristics and reactor equilibrium trends. The dataset covers multiple sets of catalysts and multidimensional variable combinations, with good representativeness and structures, providing a solid data foundation for model construction.
Based on the 3σ criterion, outliers were removed, and linear interpolation was implemented to effectively avoid the interference of extreme values on the stability of the model [7]. For the ethanol conversion rate sequence of each catalyst group
Continuous variables were standardized and unified (temperature, mass, ethanol concentration, etc.) in the dataset using the Z-score. One hot encoding was performed on binary variables (HAP usage, loading method) and then converted them into 0–1 dummy variables [8].
2.2 Construction and testing of a univariate quadratic regression model
There is a correlation between the ethanol conversion rate
Here,
Similarly, a univariate polynomial regression model can be obtained between the selectivity of
In summary, a univariate polynomial regression model between the ethanol conversion rate
In formula (6),
Next, model construction was carried out: a univariate quadratic model was established for each of the 21 catalysts to describe α 0(T) and α 1(T), and the models were ensured to have physical rationality and statistical stability through grouping, fitting, and parameter significance testing. For solving parameters, Matlab’s Curve Fitting toolbox was used for fitting and performing significance testing and the goodness of fit of the model was evaluated using p-test and R 2:
To perform significance test, the goodness of fit of the model was evaluated using an F-test and
2.3 Analytical method for reaction performance under multifactor coupling
The grouping design based on the control variable method in the above univariate regression model allows for a clear analysis of the independent effects of each catalyst factor.
The ethanol concentration, Co loading amount, Co/SiO2 and HAP loading ratio, the sum of the mass of Co/SiO2 and HAP, the use of quartz sand or HAP catalyst, and the loading method were controlled separately, and then the trends of
2.4 Construction of a multivariate polynomial regression model
Given the interaction between factors in the experimental data (such as the synergistic effect of the Co loading amount and loading ratio), a multivariate quadratic regression model is constructed, which includes seven factors, including the temperature (T), ethanol concentration
To eliminate dimensional differences, the data were standardized:
Here,
Gradually, the variables were filtered using Matlab functions, insignificant terms were eliminates, and then solved to obtain the optimal model.
3 Results and discussion
3.1 Controlled variable comparative analysis
Using the Curve Fitting toolbox in MATLAB, the univariate polynomial regression equation was solved to obtain the coefficients of the univariate polynomial regression model between the ethanol conversion rate and temperature for 21 catalyst combinations, as well as the coefficients of the univariate polynomial regression model between C4 olefin selectivity and temperature. Tables 1 and 2 show the regression coefficients for Group A and Group B, with six groups each.
Regression model coefficients of the ethanol conversion rate and temperature
| No. of catalyst groups | β 0 | β 1 | β 2 | R 2 |
|---|---|---|---|---|
| 1 | 145.3 | 0.0024 | −1.143 | 0.9832 |
| 2 | −226.6 | −0.0006 | 1.112 | 0.9941 |
| 3 | −133.8 | −0.0004 | 0.6453 | 0.9838 |
| 4 | −108.4 | 0.0004 | 0.3434 | 0.9969 |
| 5 | 233.2 | 0.0034 | −1.653 | 0.9944 |
| 6 | 54.26 | 0.0016 | −0.5812 | 0.9847 |
| 16 | 190.2 | 0.0027 | −1.312 | 0.9916 |
| 17 | 107.6 | 0.0015 | −0.774 | 0.9977 |
| 18 | 154.2 | 0.0017 | −1.122 | 0.9877 |
| 19 | 184.9 | 0.0022 | −1.373 | 0.9924 |
| 20 | 191.2 | 0.0026 | −1.443 | 0.9912 |
| 21 | 226.5 | 0.0032 | −1.712 | 0.9832 |
Regression model coefficients of C4 olefin selectivity and temperature
| No. of catalyst groups | γ 0 | γ 1 | γ 2 | R 2 |
|---|---|---|---|---|
| 1 | −192.83 | −0.0045 | 1.4126 | 0.9864 |
| 2 | 232.78 | 0.0033 | −1.6531 | 0.9851 |
| 3 | −172.43 | −0.0011 | 0.9621 | 0.9881 |
| 4 | 73.63 | 0.0014 | −0.5124 | 0.9837 |
| 5 | 55.21 | 0.0013 | −0.4953 | 0.9933 |
| 6 | 173.65 | 0.0021 | −1.4170 | 0.9874 |
| 16 | 42.53 | 0.0011 | −0.5180 | 0.9832 |
| 17 | 21.77 | 0.0007 | −0.1813 | 0.9865 |
| 18 | 81.34 | 0.0008 | −0.5162 | 0.9937 |
| 19 | 31.90 | 0.0007 | −0.3002 | 0.9936 |
| 20 | −12.21 | 0.0003 | −0.0217 | 0.9824 |
| 21 | −9.418 | 0.0005 | −0.0610 | 0.9982 |
From Tables 1 and 2, it can be seen that the goodness of fit R 2 is greater than 0.9824, indicating that regression can reduce the variation of the dependent variable by more than 98.24%. Therefore, from the coefficient of determination, it can be seen that the regression equation is highly significant and the regression effect is good. Four catalyst combinations, A1, A3, A8, and B2, are selected, and their regression function graphs are drawn, as shown in Figures 1 and 2.
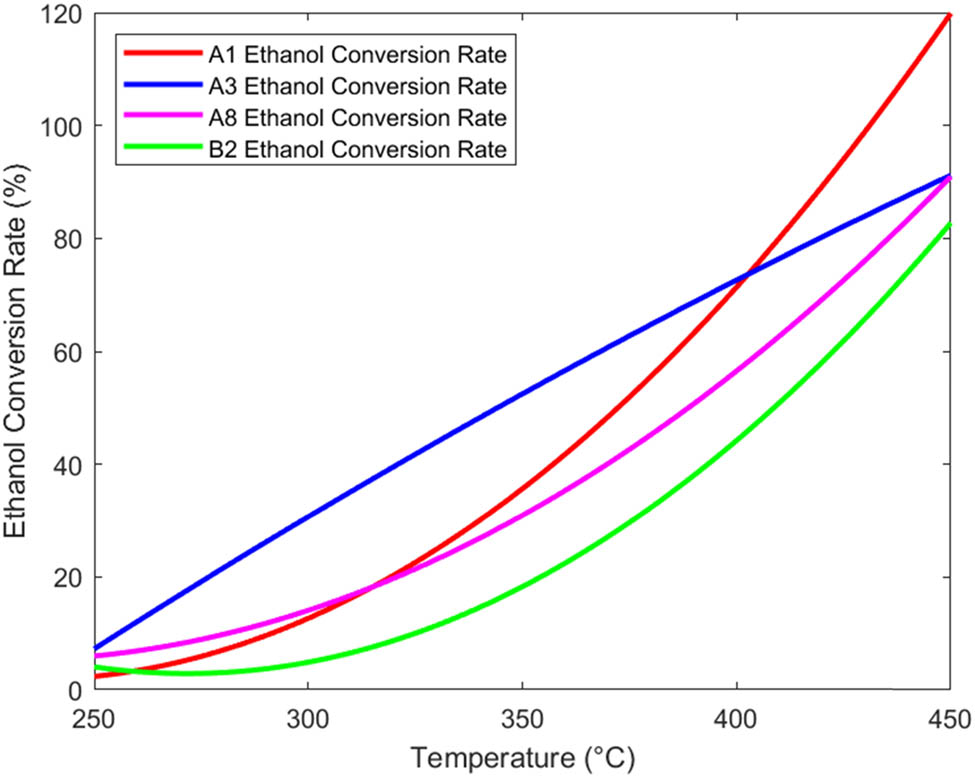
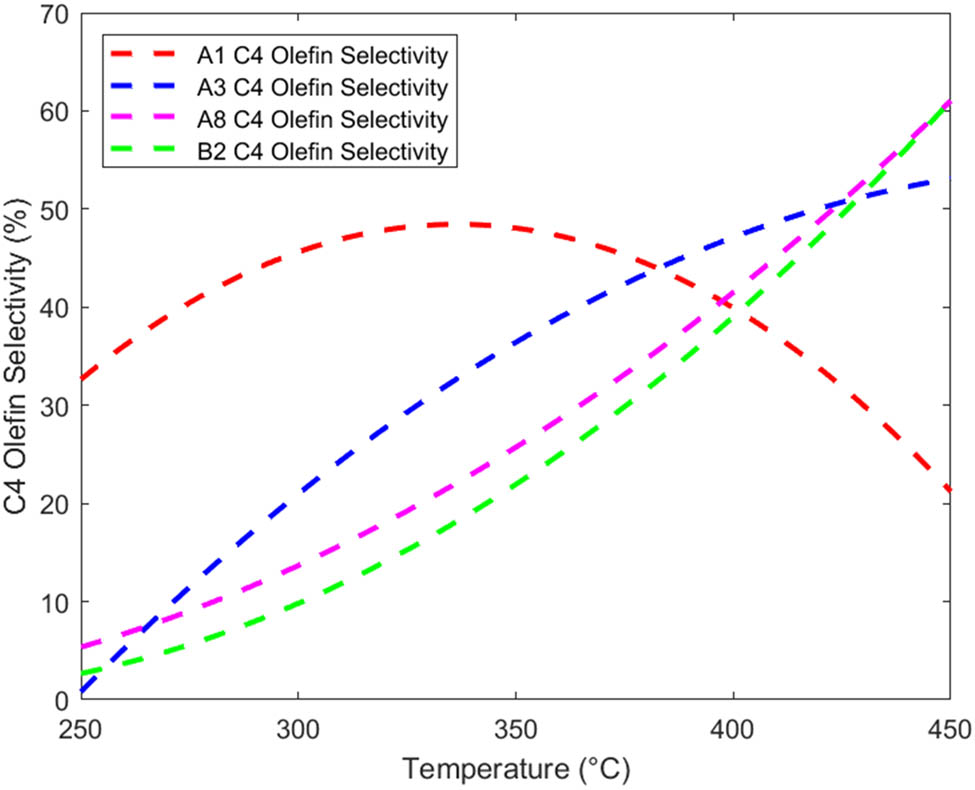
From Figures 1 and 2, within a certain range, the ethanol conversion rate and C4 olefin selectivity both increase with increasing temperature. However, for the A1 and A3 catalyst combinations, excessive temperature may lead to a decrease in C4 olefin selectivity [10].
Based on the actual chemical reactions and the data of the reaction, the performance changes with time at 350°C. The calculated C4 hydrocarbon yield is divided into five categories: C4 hydrocarbon selectivity, fatty alcohol selectivity (carbons 4–12), acetaldehyde selectivity, and ethanol conversion rate. The specific data of their changes with time are shown in Table 3. The yield of C4 hydrocarbons is the product of the ethanol conversion rate and C4 olefin selectivity.
Data on a certain catalyst combination at 350°C
| Time (min) | Ethanol conversion rate (%) | C4 olefin selectivity (%) | Selection of fatty alcohols with carbons 4–12 (%) | Ethanol selectivity (%) | C4 olefin yield (%) |
|---|---|---|---|---|---|
| 20 | 43.5 | 39.9 | 39.7 | 5.17 | 17.37540804 |
| 70 | 37.8 | 38.55 | 37.36 | 5.6 | 14.56733047 |
| 110 | 36.6 | 36.72 | 32.39 | 6.37 | 13.42349545 |
| 163 | 32.7 | 39.53 | 31.29 | 7.82 | 12.93495022 |
| 197 | 31.7 | 38.96 | 31.49 | 8.19 | 12.35425379 |
| 240 | 29.9 | 40.32 | 32.36 | 8.42 | 12.03722565 |
| 273 | 29.9 | 39.04 | 30.86 | 8.79 | 11.67530575 |
Five types of data shown in Table 3, including C4 olefin selectivity, fatty alcohol selectivity (carbons 4–12), ethanol conversion rate, acetaldehyde selectivity, and C4 olefin yield, are plotted onto the same graph, as shown in Figure 3.
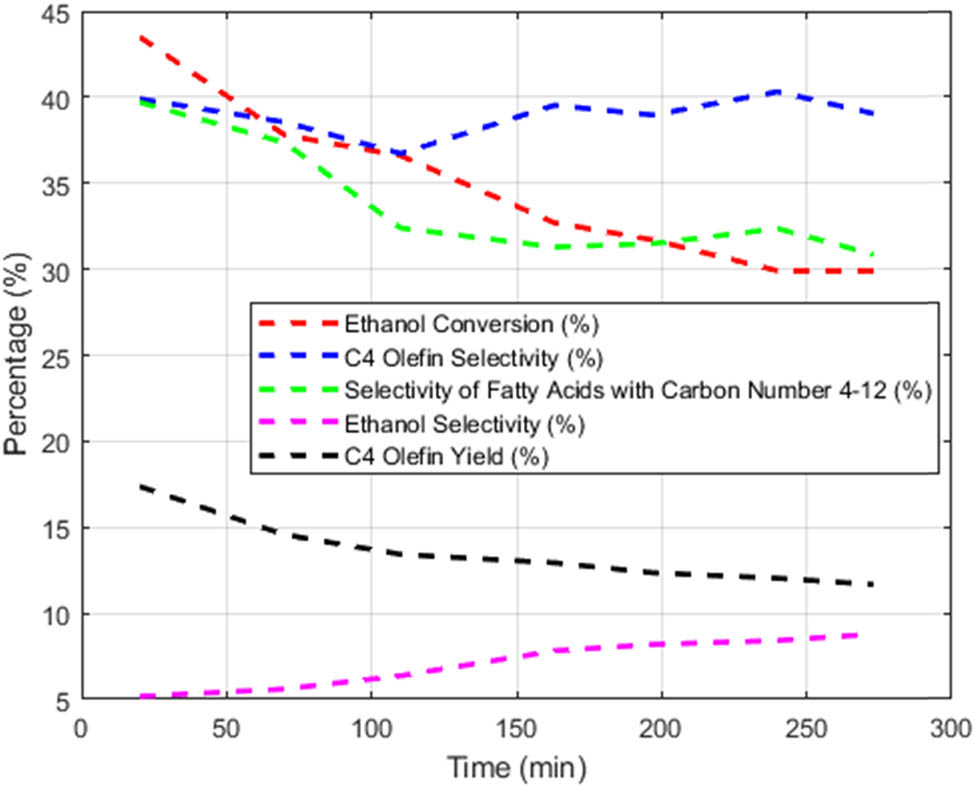
Time-dependent graph of five types of data.
As shown in Figure 3, it can be seen that as time increases, the selectivity of 4–12 fatty alcohols decreases while the selectivity of acetaldehyde increases, indicating that 4–12 fatty alcohols are involved in the generation of acetaldehyde. Ethanol conversion first increases and then gradually decreases. The trend of C4 olefin selectivity over time is relatively stable, and the value is around 39%. The yield of C4 olefins decreases continuously with the increase of time. In summary, as the reaction time increases, the selectivity of each product tends to stabilize; that is, the chemical reaction reaches an equilibrium state [11].
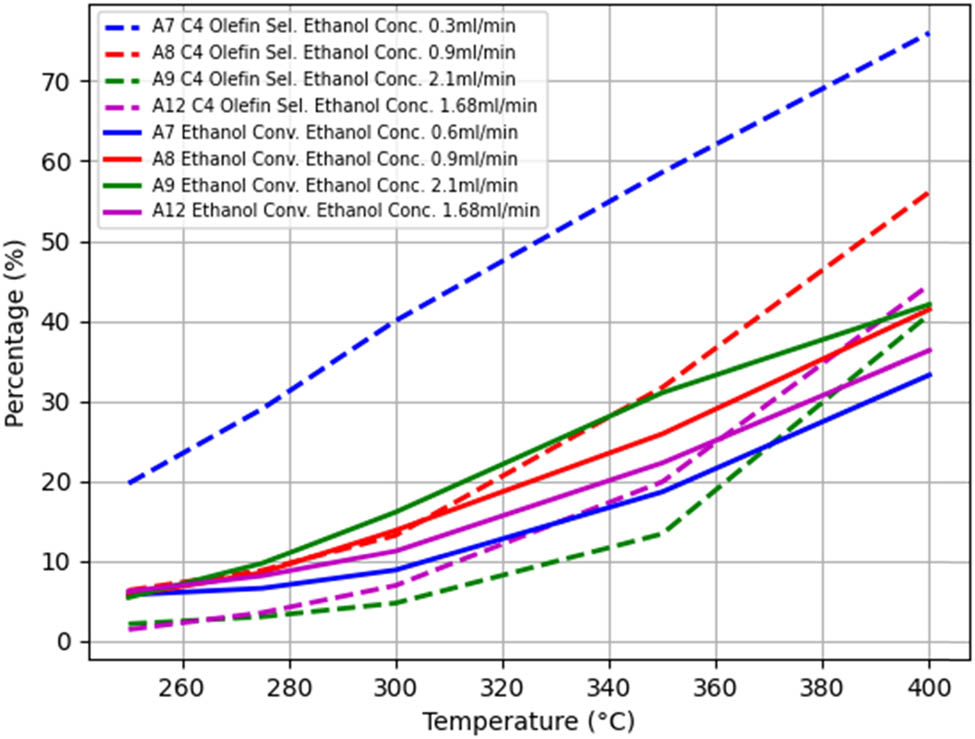
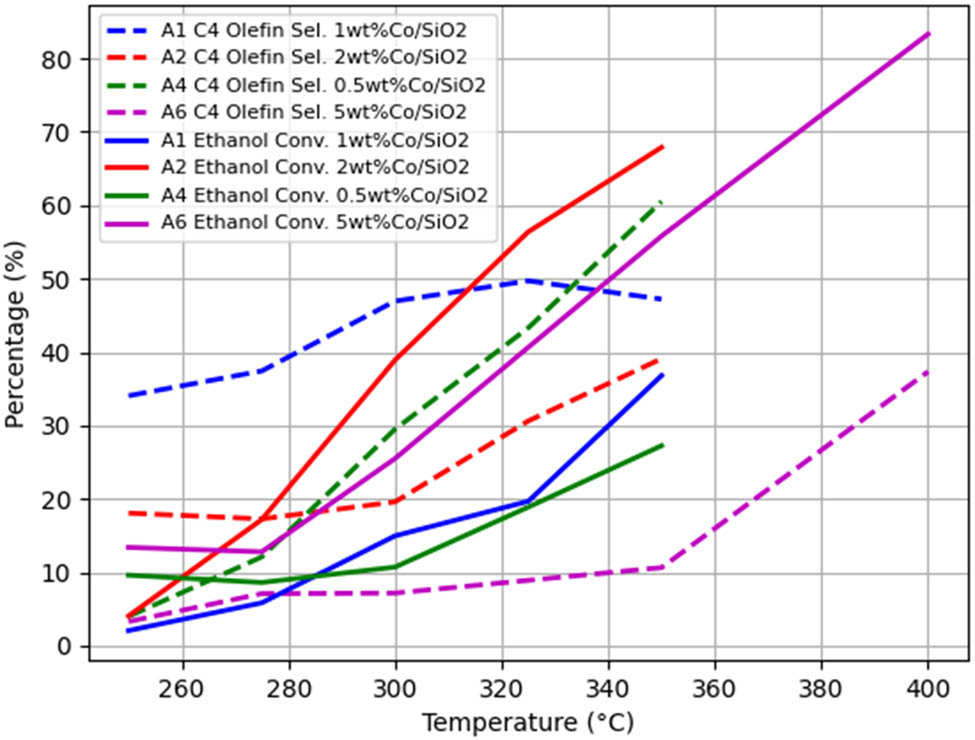
When other conditions remain unchanged and only the ethanol concentration is changed, the A1–A3, A2–A5, A7–A8–A9–A12, B1–B5, and B2–B7 groups were used as controls to obtain the temperature-dependent trends of the ethanol conversion rate and C4 olefin selectivity, as shown in Figures 4–8.
The trend of changes in
Trends of
Trends of
Trends of
Trends of
Figure 4 shows that in the A7–A8–A9–A12 group, the higher the ethanol concentration, the lower the ethanol conversion rate, and the ethanol conversion rate gradually increases with increasing temperature. At the same temperature, the selectivity of C4 olefins is highest at an ethanol concentration of 2.1 ml/min and lowest at 0.3 ml/min. As the temperature increases, the selectivity of C4 olefins gradually increases.
As can be seen from Figure 5, at the same temperature, the ethanol conversion rate is highest when Co loading is 2 wt%, and the ethanol conversion rate gradually increases with the increase of temperature. At the same temperature, the selectivity of C4 olefins is highest when Co loading is 1 wt%. The selectivity of C4 hydrocarbons gradually increases with increasing temperature when Co loading is 2, 0.5, and 5 wt%. When Co loading is 1 wt%, the selectivity of C4 olefins gradually increases at <325°C and shows a decreasing trend at >325°C [12].
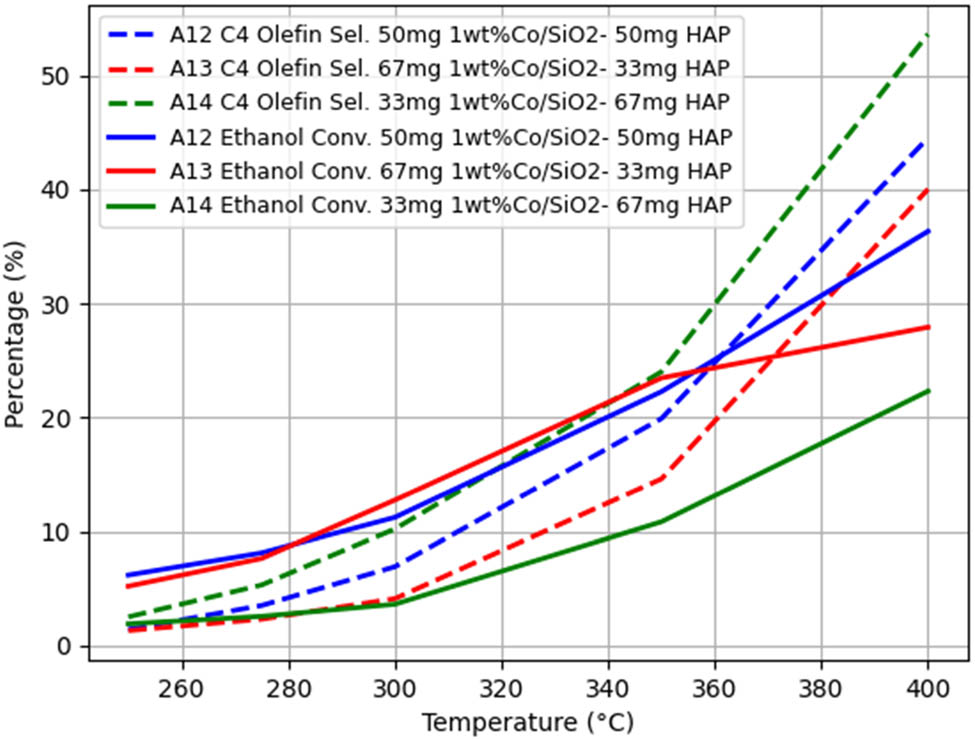
All other conditions being the same, when only changing the Co/SiO2 and HAP loading ratios, the A12–A13–A14 group experiments were used as controls to obtain the temperature-dependent trends of ethanol conversion rate and C4 hydrocarbon selectivity, as shown in Figure 6.
As illustrated by the curves in Figure 6, at the same temperature, the smaller the Co/SiO2 and HAP loading ratios, the higher the ethanol conversion rate, and the ethanol conversion rate gradually increases with the increase of temperature. At the same temperature, the difference in C4 olefin selectivity between loading ratios of 1 and 2 is not significant and is greater than the selectivity at a loading ratio of 0.5, and the C4 hydrocarbon selectivity gradually increases with increasing temperature [13].
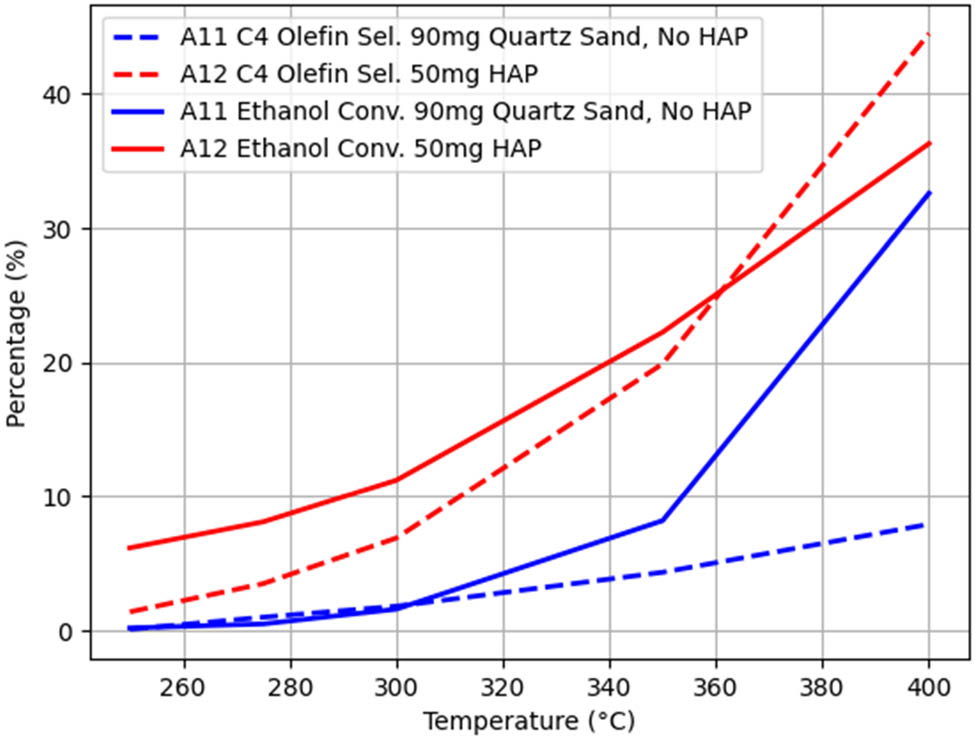
All other conditions being the same, only considering the use of quartz sand or HAP as the chemical agent, the A11–A12 group experiments were used as a control, and the temperature-dependent trends of the ethanol conversion rate and C4 olefin selectivity are shown in Figure 7.
As depicted in Figure 7, the ethanol conversion rate and C4 olefin selectivity with HAP are superior to those without HAP, which indicates that the use of HAP exerts a substantial influence on the catalytic performance [14].
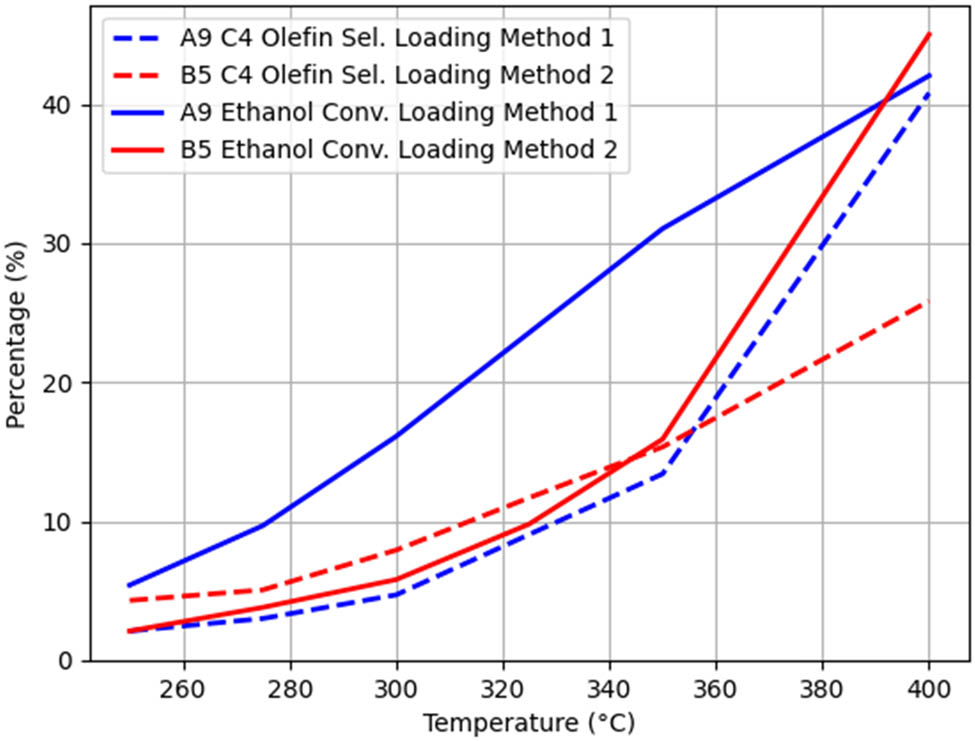
All other conditions being the same, when only the loading method was changed, the A9–B5 group experiment was used as a control, and the trends of ethanol conversion rate and C4 olefin selectivity with temperature are shown in Figure 8.
From Figure 8, it can be seen that the C4 hydrocarbon selectivity under loading method I is higher than that under loading method II.
3.2 Optimal multiple quadratic regression equation
Using the stepwise regression function in Matlab, the standard regression coefficient is solved, and the preliminary standard regression equation for the ethanol conversion rate is obtained as follows:
Due to the presence of multicollinearity among independent variables [15], the significance of the regression equation is low, and the regression effect is poor. Therefore, a stepwise regression was conducted to eliminate some unimportant explanatory variables, and the optimal standard regression equation for the ethanol conversion rate was obtained:
The regression goodness of fit diagnosis was performed on the obtained model (12), and the results of each indicator are shown in Table 4.
Diagnostic indicators for the optimal regression model of the ethanol conversion rate
| R | R 2 | RMSE | F | P |
|---|---|---|---|---|
| 0.97 | 0.944 | 0.0114 | 36.92 | 4.28 × 10⁻²⁷ |
From the relative effect of regression, the complex correlation coefficient R = 0.97 and the determination coefficient R 2 = 0.944 indicate that regression can reduce the variation of the dependent variable by 94.4%. Therefore, it can be seen from the determination coefficient that the regression equation is highly significant. From the absolute effect of regression, the root mean square error (RMSE) = 0.0114 is relatively small, indicating that the regression effect is very good. From the perspective of analysis of variance, F = 36.92 and P = 4.28 × 10⁻²⁷. This indicates that the regression equation is highly significant, and the regression coefficients have passed the significance test [16].
Therefore, the interaction among the five factors, the temperature, Co/SiO2 and HAP mass, ethanol concentration, Co loading, Co/SiO2 and HAP loading ratio, as well as the four factors other than temperature, has a significant impact on the overall ethanol conversion rate. By comparing the absolute values of the regression coefficients, it can be seen that the Co loading, Co/SiO2, and HAP loading ratios have the greatest impact on the ethanol conversion rate.
Similarly, the standard regression equation for the optimal selectivity of C4 olefins can be obtained as follows:
The regression goodness of fit diagnosis was performed on the obtained model (13), and the results of each indicator are shown in Table 5.
Diagnostic indicators for the optimal regression model of C4 olefin selectivity
| R | R 2 | RMSE | F | P |
|---|---|---|---|---|
| 0.96 | 0.937 | 0.0085 | 33.07 | 1.73 × 10⁻²⁴ |
From the relative effect of regression, the complex correlation coefficient R = 0.96 and the coefficient of determination R 2 = 0.937 indicate that regression can reduce 93.7% of the variation of the dependent variable. Therefore, it can be seen from the coefficient of determination that the regression equation is highly significant. From the absolute effect of regression, RMSE = 0.0085 is relatively small, indicating that the regression effect is very good. From the perspective of analysis of variance, F = 33.07 and P = 1.73 × 10⁻²⁴. This indicates that the regression equation is highly significant, and the regression coefficients have passed the significance test.
Therefore, the six factors, the temperature, Co/SiO2 and HAP mass, ethanol concentration, Co loading, Co/SiO2 and HAP loading ratio, and loading method, as well as the interaction between Co/SiO2 and the HAP mass with ethanol concentration, Co loading, Co/SiO2 and HAP loading ratio, ethanol concentration with temperature and Co loading, and Co loading with Co/SiO2 and the HAP loading ratio, have a significant impact on the selectivity of C4 olefins as a whole. By comparing the absolute values of the regression coefficients, it can be seen that temperature has the greatest impact on the selectivity of C4 olefins.
4 Conclusions
This study focuses on the cross-scale modeling and collaborative optimization of ethanol-catalyzed coupling to produce C4 olefins, and constructs a nonlinear modeling framework that integrates univariate quadratic regression, orthogonal experimental design, and multivariate polynomial regression. Using 147 sets of multicatalyst experimental data and dynamic time-series data, the nonlinear effect of temperature on the ethanol conversion rate and C4 olefin selectivity was revealed. The main effects of factors such as Co loading, feed ratio, and ethanol concentration were quantified, and the physical meaning of the interaction terms of temperature, Co loading, and feed ratio was analyzed in depth. The RMSE of the established model on the test set was less than 1.14%, and R 2 was higher than 0.944, demonstrating good generalization ability and engineering applicability. This study provides a nonlinear engineering digital modeling paradigm that combines explanatory power, predictive power, and scalability for the mechanism elucidation and industrial optimization of complex catalytic reaction systems. It provides design references for catalyst formulation optimization and reaction condition regulation in the green production of C4 olefins. In the future, the model can be expanded by introducing multiphysics field coupling, integrating the catalyst microstructure parameters, and other directions to further enhance its industrial application value.
-
Funding information: Authors state no funding is involved.
-
Author contributions: Jiayang Xiao: writing – original draft, writing – review and editing, conceptualization, data curation, formal analysis, and investigation. Kaijia Luo: methodology, resources, validation, and visualization. Junnan Zhong: validation, visualization, writing – review and editing, and supervision. All authors have accepted responsibility for the entire content of this manuscript and approved its submission.
-
Conflict of interest: Authors state no conflict of interest.
-
Data availability statement: All data generated or analyzed during this study are included in this published article.
References
[1] Adamczyk VO, Griffin ES, Fogh AA, Schafer LL. Electronically and sterically varied vanadium aminopyridinate complexes applied to the catalytic reductive coupling of alcohols. Inorg Chem. 2025;64(19):9500–8.10.1021/acs.inorgchem.5c00254Search in Google Scholar PubMed
[2] Joshi VV, Bollini P. Exploiting proximity effects to improve ethyl acetate selectivity in the dehydrogenative coupling of ethanol over supported Cu catalysts. Appl Catal A Gen. 2025;697:120228.10.1016/j.apcata.2025.120228Search in Google Scholar
[3] Tian X, Qiu M, An W, Ren YL. Photocatalytic Hydrogenation of Alkenes Using Water as Both the Reductant and the Proton Source. Adv Sci (Weinheim, Baden-Wurttemberg, Germany). 2024;11(44):e2406046.10.1002/advs.202406046Search in Google Scholar PubMed PubMed Central
[4] Zheng L, Wu H, Zhou Z, Fan X. Distillation-Pervaporation hybrid process for ethanol dehydration: process optimization and economic evaluation. Chem Ing Tech. 2025;97(4):311–23.10.1002/cite.202400126Search in Google Scholar
[5] Doosthosseini M, Talkhoncheh KM, Silberberg LJ, Ghods H. An Arrhenius-based simulation tool for predicting aging of lithium manganese dioxide primary batteries in implantable medical devices. Energies. 2024;17(21):5392.10.3390/en17215392Search in Google Scholar
[6] Li TY, Jin QS, Hu JX, Wang ZJ, Li ZY, Chen L, et al. Examining performance of microchannel cold plate heat sink from its three parts along coolant flow direction and new structure designs based on the new considerations. Appl Therm Eng. 2025;269:125963.10.1016/j.applthermaleng.2025.125963Search in Google Scholar
[7] Reddy SD, Reddy RV, Choi JC. Gaussian distribution on electrical properties of identically fabricated Au/n - GaN Schottky junctions with a Nd2O3 interfacial layer. Mater Sci Semicond Process. 2025;196:109650.10.1016/j.mssp.2025.109650Search in Google Scholar
[8] Gaudet E, Persson F, Saidel M. Z - score - based post - test risk as an alternative risk metric to positive predictive value following positive noninvasive prenatal screening. Am J Obstet Gynecol. 2024;232(4):367–72.10.1016/j.ajog.2024.12.017Search in Google Scholar PubMed
[9] Austin CP, Eekhout I, Buuren VS. Evaluating the median p-value method for assessing the statistical significance of tests when using multiple imputation. J Appl Stat. 2025;52(6):1161–76.10.1080/02664763.2024.2418473Search in Google Scholar PubMed PubMed Central
[10] Liu X, Zhao M, Liu D, Yang J, Han Y, Sultana R, et al. Boosting catalytic oxidation of H2S over activated carbon optimized by the synergistic effect of rich defects and nitrogen sites. Surf Interface. 2025;68:106672.10.1016/j.surfin.2025.106672Search in Google Scholar
[11] Zhao K, Jiao Y, Zhu Z, Varley RJ, Liu W, Niu B, et al. Dual functionalities of inexpensive Mn/TiO2 catalyst to produce oxychar for ammonia capture. J Environ Chem Eng. 2025;13(3):116318.10.1016/j.jece.2025.116318Search in Google Scholar
[12] Fan D, Wen J, Chen P, Tu X, Luo X, Deng Y, et al. Facile synthesis of a single-atom cobalt catalyst to enhance peroxymonosulfate oxidation to degrade emerging contaminants by visibl-light regulation: From radical pathway to synergistic pathway. J Colloid Interface Sci. 2025;693:137626.10.1016/j.jcis.2025.137626Search in Google Scholar PubMed
[13] Fang Y, Li M, Gao Y, Wen Y, Shan B. Static organic p - n junctions in photoelectrodes for solar ammonia production with 86% internal quantum efficiency. Angew Chem. 2024;137(3):e202415729.10.1002/ange.202415729Search in Google Scholar
[14] Li Z, Yang L, Ma W, Lei Y. Eutectic Si - Ti brazing alloy prepared from spent selective catalytic reduction catalyst and diamond - wire sawing silicon waste. Chem Eng J. 2024;496:154053.10.1016/j.cej.2024.154053Search in Google Scholar
[15] Bouka S, Bello PK, Nkiet MG. On estimation and prediction in a spatial semi-functional linear regression model with derivatives. Math Methods Stat. 2024;33(3):310–26.10.3103/S1066530724700169Search in Google Scholar
[16] Hodson TO. Root - mean - square error (RMSE) or mean absolute error (MAE): when to use them or not. Geosci Model Dev. 2022;15(14):5481–7.10.5194/gmd-15-5481-2022Search in Google Scholar
© 2025 the author(s), published by De Gruyter
This work is licensed under the Creative Commons Attribution 4.0 International License.
Articles in the same Issue
- Research Articles
- Generalized (ψ,φ)-contraction to investigate Volterra integral inclusions and fractal fractional PDEs in super-metric space with numerical experiments
- Solitons in ultrasound imaging: Exploring applications and enhancements via the Westervelt equation
- Stochastic improved Simpson for solving nonlinear fractional-order systems using product integration rules
- Exploring dynamical features like bifurcation assessment, sensitivity visualization, and solitary wave solutions of the integrable Akbota equation
- Research on surface defect detection method and optimization of paper-plastic composite bag based on improved combined segmentation algorithm
- Impact the sulphur content in Iraqi crude oil on the mechanical properties and corrosion behaviour of carbon steel in various types of API 5L pipelines and ASTM 106 grade B
- Unravelling quiescent optical solitons: An exploration of the complex Ginzburg–Landau equation with nonlinear chromatic dispersion and self-phase modulation
- Perturbation-iteration approach for fractional-order logistic differential equations
- Variational formulations for the Euler and Navier–Stokes systems in fluid mechanics and related models
- Rotor response to unbalanced load and system performance considering variable bearing profile
- DeepFowl: Disease prediction from chicken excreta images using deep learning
- Channel flow of Ellis fluid due to cilia motion
- A case study of fractional-order varicella virus model to nonlinear dynamics strategy for control and prevalence
- Multi-point estimation weldment recognition and estimation of pose with data-driven robotics design
- Analysis of Hall current and nonuniform heating effects on magneto-convection between vertically aligned plates under the influence of electric and magnetic fields
- A comparative study on residual power series method and differential transform method through the time-fractional telegraph equation
- Insights from the nonlinear Schrödinger–Hirota equation with chromatic dispersion: Dynamics in fiber–optic communication
- Mathematical analysis of Jeffrey ferrofluid on stretching surface with the Darcy–Forchheimer model
- Exploring the interaction between lump, stripe and double-stripe, and periodic wave solutions of the Konopelchenko–Dubrovsky–Kaup–Kupershmidt system
- Computational investigation of tuberculosis and HIV/AIDS co-infection in fuzzy environment
- Signature verification by geometry and image processing
- Theoretical and numerical approach for quantifying sensitivity to system parameters of nonlinear systems
- Chaotic behaviors, stability, and solitary wave propagations of M-fractional LWE equation in magneto-electro-elastic circular rod
- Dynamic analysis and optimization of syphilis spread: Simulations, integrating treatment and public health interventions
- Visco-thermoelastic rectangular plate under uniform loading: A study of deflection
- Threshold dynamics and optimal control of an epidemiological smoking model
- Numerical computational model for an unsteady hybrid nanofluid flow in a porous medium past an MHD rotating sheet
- Regression prediction model of fabric brightness based on light and shadow reconstruction of layered images
- Dynamics and prevention of gemini virus infection in red chili crops studied with generalized fractional operator: Analysis and modeling
- Qualitative analysis on existence and stability of nonlinear fractional dynamic equations on time scales
- Fractional-order super-twisting sliding mode active disturbance rejection control for electro-hydraulic position servo systems
- Analytical exploration and parametric insights into optical solitons in magneto-optic waveguides: Advances in nonlinear dynamics for applied sciences
- Bifurcation dynamics and optical soliton structures in the nonlinear Schrödinger–Bopp–Podolsky system
- User profiling in university libraries by combining multi-perspective clustering algorithm and reader behavior analysis
- Exploring bifurcation and chaos control in a discrete-time Lotka–Volterra model framework for COVID-19 modeling
- Review Article
- Haar wavelet collocation method for existence and numerical solutions of fourth-order integro-differential equations with bounded coefficients
- Special Issue: Nonlinear Analysis and Design of Communication Networks for IoT Applications - Part II
- Silicon-based all-optical wavelength converter for on-chip optical interconnection
- Research on a path-tracking control system of unmanned rollers based on an optimization algorithm and real-time feedback
- Analysis of the sports action recognition model based on the LSTM recurrent neural network
- Industrial robot trajectory error compensation based on enhanced transfer convolutional neural networks
- Research on IoT network performance prediction model of power grid warehouse based on nonlinear GA-BP neural network
- Interactive recommendation of social network communication between cities based on GNN and user preferences
- Application of improved P-BEM in time varying channel prediction in 5G high-speed mobile communication system
- Construction of a BIM smart building collaborative design model combining the Internet of Things
- Optimizing malicious website prediction: An advanced XGBoost-based machine learning model
- Economic operation analysis of the power grid combining communication network and distributed optimization algorithm
- Sports video temporal action detection technology based on an improved MSST algorithm
- Internet of things data security and privacy protection based on improved federated learning
- Enterprise power emission reduction technology based on the LSTM–SVM model
- Construction of multi-style face models based on artistic image generation algorithms
- Research and application of interactive digital twin monitoring system for photovoltaic power station based on global perception
- Special Issue: Decision and Control in Nonlinear Systems - Part II
- Animation video frame prediction based on ConvGRU fine-grained synthesis flow
- Application of GGNN inference propagation model for martial art intensity evaluation
- Benefit evaluation of building energy-saving renovation projects based on BWM weighting method
- Deep neural network application in real-time economic dispatch and frequency control of microgrids
- Real-time force/position control of soft growing robots: A data-driven model predictive approach
- Mechanical product design and manufacturing system based on CNN and server optimization algorithm
- Application of finite element analysis in the formal analysis of ancient architectural plaque section
- Research on territorial spatial planning based on data mining and geographic information visualization
- Fault diagnosis of agricultural sprinkler irrigation machinery equipment based on machine vision
- Closure technology of large span steel truss arch bridge with temporarily fixed edge supports
- Intelligent accounting question-answering robot based on a large language model and knowledge graph
- Analysis of manufacturing and retailer blockchain decision based on resource recyclability
- Flexible manufacturing workshop mechanical processing and product scheduling algorithm based on MES
- Exploration of indoor environment perception and design model based on virtual reality technology
- Tennis automatic ball-picking robot based on image object detection and positioning technology
- A new CNN deep learning model for computer-intelligent color matching
- Design of AR-based general computer technology experiment demonstration platform
- Indoor environment monitoring method based on the fusion of audio recognition and video patrol features
- Health condition prediction method of the computer numerical control machine tool parts by ensembling digital twins and improved LSTM networks
- Establishment of a green degree evaluation model for wall materials based on lifecycle
- Quantitative evaluation of college music teaching pronunciation based on nonlinear feature extraction
- Multi-index nonlinear robust virtual synchronous generator control method for microgrid inverters
- Manufacturing engineering production line scheduling management technology integrating availability constraints and heuristic rules
- Analysis of digital intelligent financial audit system based on improved BiLSTM neural network
- Attention community discovery model applied to complex network information analysis
- A neural collaborative filtering recommendation algorithm based on attention mechanism and contrastive learning
- Rehabilitation training method for motor dysfunction based on video stream matching
- Research on façade design for cold-region buildings based on artificial neural networks and parametric modeling techniques
- Intelligent implementation of muscle strain identification algorithm in Mi health exercise induced waist muscle strain
- Optimization design of urban rainwater and flood drainage system based on SWMM
- Improved GA for construction progress and cost management in construction projects
- Evaluation and prediction of SVM parameters in engineering cost based on random forest hybrid optimization
- Museum intelligent warning system based on wireless data module
- Optimization design and research of mechatronics based on torque motor control algorithm
- Special Issue: Nonlinear Engineering’s significance in Materials Science
- Experimental research on the degradation of chemical industrial wastewater by combined hydrodynamic cavitation based on nonlinear dynamic model
- Study on low-cycle fatigue life of nickel-based superalloy GH4586 at various temperatures
- Some results of solutions to neutral stochastic functional operator-differential equations
- Ultrasonic cavitation did not occur in high-pressure CO2 liquid
- Research on the performance of a novel type of cemented filler material for coal mine opening and filling
- Testing of recycled fine aggregate concrete’s mechanical properties using recycled fine aggregate concrete and research on technology for highway construction
- A modified fuzzy TOPSIS approach for the condition assessment of existing bridges
- Nonlinear structural and vibration analysis of straddle monorail pantograph under random excitations
- Achieving high efficiency and stability in blue OLEDs: Role of wide-gap hosts and emitter interactions
- Construction of teaching quality evaluation model of online dance teaching course based on improved PSO-BPNN
- Enhanced electrical conductivity and electromagnetic shielding properties of multi-component polymer/graphite nanocomposites prepared by solid-state shear milling
- Optimization of thermal characteristics of buried composite phase-change energy storage walls based on nonlinear engineering methods
- A higher-performance big data-based movie recommendation system
- Nonlinear impact of minimum wage on labor employment in China
- Nonlinear comprehensive evaluation method based on information entropy and discrimination optimization
- Application of numerical calculation methods in stability analysis of pile foundation under complex foundation conditions
- Research on the contribution of shale gas development and utilization in Sichuan Province to carbon peak based on the PSA process
- Characteristics of tight oil reservoirs and their impact on seepage flow from a nonlinear engineering perspective
- Nonlinear deformation decomposition and mode identification of plane structures via orthogonal theory
- Numerical simulation of damage mechanism in rock with cracks impacted by self-excited pulsed jet based on SPH-FEM coupling method: The perspective of nonlinear engineering and materials science
- Cross-scale modeling and collaborative optimization of ethanol-catalyzed coupling to produce C4 olefins: Nonlinear modeling and collaborative optimization strategies
- Unequal width T-node stress concentration factor analysis of stiffened rectangular steel pipe concrete
- Special Issue: Advances in Nonlinear Dynamics and Control
- Development of a cognitive blood glucose–insulin control strategy design for a nonlinear diabetic patient model
- Big data-based optimized model of building design in the context of rural revitalization
- Multi-UAV assisted air-to-ground data collection for ground sensors with unknown positions
- Design of urban and rural elderly care public areas integrating person-environment fit theory
- Application of lossless signal transmission technology in piano timbre recognition
- Application of improved GA in optimizing rural tourism routes
- Architectural animation generation system based on AL-GAN algorithm
- Advanced sentiment analysis in online shopping: Implementing LSTM models analyzing E-commerce user sentiments
- Intelligent recommendation algorithm for piano tracks based on the CNN model
- Visualization of large-scale user association feature data based on a nonlinear dimensionality reduction method
- Low-carbon economic optimization of microgrid clusters based on an energy interaction operation strategy
- Optimization effect of video data extraction and search based on Faster-RCNN hybrid model on intelligent information systems
- Construction of image segmentation system combining TC and swarm intelligence algorithm
- Particle swarm optimization and fuzzy C-means clustering algorithm for the adhesive layer defect detection
- Optimization of student learning status by instructional intervention decision-making techniques incorporating reinforcement learning
- Fuzzy model-based stabilization control and state estimation of nonlinear systems
- Optimization of distribution network scheduling based on BA and photovoltaic uncertainty
- Tai Chi movement segmentation and recognition on the grounds of multi-sensor data fusion and the DBSCAN algorithm
- Special Issue: Dynamic Engineering and Control Methods for the Nonlinear Systems - Part III
- Generalized numerical RKM method for solving sixth-order fractional partial differential equations