Optimization of distribution network scheduling based on BA and photovoltaic uncertainty
-
Lianrong Pan
 ,
Yuan Fu
,
Yuan Fu

Abstract
A novel optimization framework for microgrid (MG) distribution network scheduling has been proposed, which integrates enhanced bat algorithm (BA) with probabilistic photovoltaic (PV) power prediction to address the dual challenges of renewable energy uncertainty and operational efficiency. The method combines genetic algorithm-optimized artificial neural network with Monte Carlo simulation to achieve very low PV output prediction error under variable weather conditions. In addition, the study improves the BA by using a multi-mechanism approach of Halton sequence initialization and dynamic elite retention, which enhances the convergence iteration speed of the algorithm and avoids local optima problems. The experimental results show that the maximum predicted output power (OP) of the PV generator set is 208 kW, and the predicted OP curve is more consistent with the actual OP curve. The enhanced BA has been demonstrated to enhance the optimization of operating costs of MGs. The operating costs of MGs are 125,452 yuan at low loads and 145,562 yuan at high loads. The study provides a replicable template for high-penetration renewable MGs by combining probability prediction with swarm intelligence optimization. The research provides new ideas for the scheduling strategy of MG distribution networks centered on new energy.
1 Introduction
The demand for electrical energy in a modern society is increasing continuously. Due to the gradual deterioration of the global environment, there is an urgent need for renewable energy (RE) generation methods to replace traditional thermal power generation [1,2]. Meanwhile, due to the continuous expansion, the traditional power grid structure has become very complex and difficult to manage effectively. Moreover, any failure of the power grid poses a huge threat to people’s lives and property [3]. As a result, microgrid (MG) systems with new energy as the core have captured the attention of scholars.
MGs are small-scale power generation and distribution facilities that consist of distributed generation, energy storage, energy converters, loads, monitoring and protective equipment, and more [4,5]. MGs aim to achieve flexible and efficient application of distributed power sources, and address the issue of large-scale and diverse forms of distributed power grid connection. MGs facilitate the integration of distributed power sources and RE on a large scale, thereby ensuring a reliable supply of various forms of energy to the load(s). They represent an effective means of enabling traditional power grids to transition to smart grids. MGs can operate either in parallel or in isolation from the main grid. They can provide electricity according to user needs and integrate into the distribution network through common coupling points. As a controllable unit, MGs are capable of responding rapidly within seconds to meet the needs of external transmission and distribution networks. This increases local reliability, reduces feeder losses, maintains local voltage stability, and provides uninterrupted power. The smart MG uses advanced Internet and information technology to realize the flexible and efficient application of distributed power generation, and has certain energy management functions. The system is characterized by its relatively small scale, decentralization, and independence. It is capable of achieving self-control, protection, and management as an autonomous system.
The scheduling of MG distribution can greatly improve the efficiency of grid management, cut down network losses, and is of great significance for establishing a long-term effective MG system.
To enhance the effectiveness of computer-aided clinical diagnosis, Lu et al. presented a new method for detecting abnormal brains with magnetic resonance imaging. First, a pre-trained AlexNet was modified by adding batch normalization layers. Next, the last few layers were replaced with an extreme learning machine. Finally, the chaotic bat algorithm (BA) was used to optimize the extreme learning machine for improved classification performance [6]. In response to the problem of subpopulations evolving in parallel through limited interactions in existing genetic algorithm (GA) research, Bi et al. proposed an improved genetic operation adaptive BA. This algorithm performed adaptive genetic operations on the previous search information of the BA solution. The test results showed that the new algorithm was more effective than other widely used and recently proposed similar algorithms [7]. To establish more effective resource utilization methods, scholars such as Bezdan et al. proposed a multi-objective task scheduling method with swarm intelligence – called the hybrid BA. The simulations demonstrated the enormous potential of the novel method in cloud computing [8]. To solve the problem of planning solutions that are very time-consuming and difficult due to the integration of RE into smart grids, Fu proposed a statistical machine learning technology to perform probabilistic power flow calculations based on multiple scenarios and described their application in stochastic planning of distribution networks. The results indicated that the model significantly improved planning effectiveness [9]. To control the uncertainty of photovoltaic (PV) power, Huang et al. deployed a Copula-based method to sample time-dependent scenarios of PV power within the scheduling range from probability prediction. Simulation studies showed that the proposed disaster recovery plan effectively reduced the operating costs of manufacturing production [10]. To prevent potential frequency instability caused by the infiltration of high-power electronic devices under unintentional islanding events, Chu et al. proposed a new MG scheduling method that considered system frequency dynamics and uncertainties related to RE and loads. The method was validated with an improved IEEE 14-node system [11]. To verify the advantages of connected MGs in terms of economy and resilience, Mohammadi et al. proposed a two-stage adaptive robust optimization method to minimize the total operating cost of connected MGs in the worst-case scenario of modeling uncertainty. The findings demonstrated that interconnected MGs exhibited superior performance in reducing total operational costs and enhancing power supply resilience in comparison with independent MGs [12]. Rezaeimozafar et al. designed a two-step scheduling model to guide large-scale electric vehicle fleets in MGs, addressing the need for management solutions for electric vehicles to minimize the impact of electric vehicle charging on distribution network efficiency. The findings demonstrated that the method could reliably implement the optimal charging and discharging schedule in large-scale systems [13]. Wenzhi et al. proposed an improved sparrow search algorithm for dynamic optimization of active distribution networks in multi-MG systems. This algorithm achieved optimal energy allocation by combining Bernoulli chaotic mapping, Levy flight, mutation, crossover, and competition. The results demonstrated that the proposed method was of significant importance for the economic operation and environmental protection of multi-MG active distribution networks [14]. In light of the significant environmental contamination resulting from traditional fossil fuel energy generation and the depletion of non-renewable resources, Qiao et al. put forth a coordinated day-ahead scheduling method that integrates topology reconstruction, vulture search algorithm optimization, and load response. The proposed method was validated through simulations, which demonstrated its accuracy and efficacy [15]. Compared with the improved sparrow search algorithm proposed by Wenzhi et al. and the bald eagle search algorithm proposed by Qiao et al., the improved BA proposed in this study effectively solved the problem of insufficient population diversity that may be caused by Bernoulli chaotic mapping in sparrow algorithms through Halton sequence initialization and dynamic elite retention mechanism, while avoiding the drawback of decreased convergence speed in high-dimensional optimization of bald eagle search algorithms.
Chen et al. proposed a distributed economic dispatch strategy based on consensus theory to address issues such as the increase in RE and distributed generation that traditional centralized optimization cannot adapt to, as well as changes in distribution network power demand. This strategy utilized consensus algorithms in multi-agent systems to achieve incremental cost consensus to obtain the optimal solution for economic dispatch. The effectiveness and feasibility of this method were verified through simulation and analysis [16]. In response to the negative impact of uncertainty in distributed RE on DC distribution networks, Chen et al. proposed a two-stage optimization scheduling model for DC distribution networks that considers flexible load response. This model achieved joint economic optimization and reactive power optimization. The experimental results verified the progressiveness of the model [17]. To optimize resource allocation within the province, Shi et al. proposed a two-stage scheduling model for provincial power grids, including day-ahead and day-in stages. Conditional generative adversarial networks were utilized to generate load and new energy output scenarios. Based on the generated scene set, the model considered the uncertainty and allowable error interval of new energy and load, and used risk condition values to measure system scheduling risk. The feasibility and effectiveness of this method were verified through experiments conducted on the IEEE 39 node system [18]. To calculate the uncertainty in distributed energy, Liu and Braslavsky proposed a new method for calculating designated operating entities, which is robust to the uncertainty in the utilization of allocated capacity constraints. Compared with existing methods, this method has certain progressiveness [19]. To optimize the coordinated control of complex energy storage in MGs, including PV and wind power generation, Piao et al. proposed a dual deep Q-network reinforcement learning algorithm to train intelligent agents to interact with the MG environment and learn the optimal scheduling control mechanism. This method could achieve multi-objective control at different times, weather conditions, and seasons; flexibly handle energy storage, hydrogen storage, and load energy; and achieve coordinated allocation. The experimental results showed that this method could optimize scheduling for different scenarios of composite energy storage MGs [20].
In summary, domestic and foreign researchers have proposed various methods for optimizing MG distribution network scheduling, including the introduction of various algorithm models. However, these scheduling methods are difficult to effectively balance the power deviation caused by PV uncertainty with the economic operation goals of the system. Meanwhile, existing intelligent algorithms are prone to getting stuck in local optima and have insufficient convergence speed when solving MG optimization models. In this regard, a collaborative optimization framework integrating the enhanced BA and PV power probability prediction is proposed, with the objective of achieving dual optimization of MG loss minimization and scheduling economy. This is accomplished by accurately characterizing PV uncertainty and enhancing algorithm search capabilities, thus providing novel concepts for intelligent distribution network operation under a high proportion of new energy access.
1.1 Contributions of the work
In response to the above-mentioned issues, the proposed method adopts an improved BA and describes the output power (OP) of photovoltaic power generation (PPG) units, to reduce grid losses and improve distribution scheduling efficiency. The innovation of the research lies in the use of OP to predict PV uncertainty, which is helpful for the power scheduling of MGs. At the same time, the improved BA is pertinently utilized to solve MG models, which can help improve the speed and accuracy of result optimization.
1.2 Organization of this article
The rest of this article is organized as follows: in Section 1, an introduction to the problem of scheduling of MG distribution and grid management to cut down network losses is explained. In Section 2, the basic structure of traditional MGs is discussed, and then, a prediction model based on the uncertainty of PPG in MGs is proposed, etc.
2 Methods and materials
The article first introduces the basic structure of traditional MGs and then proposes a prediction model based on the uncertainty of PPG in MGs. This model describes its uncertainty through OP, which can cut down the network loss of distribution and assist in power dispatch of MGs. Subsequently, the article selects the BA to solve the structure and mathematical model of MGs. At the same time, an improved BA is proposed to address the problems of premature convergence and susceptibility to local optima in traditional BAs. Finally, a distribution network scheduling optimization strategy based on BA and PV uncertainty is proposed.
2.1 Optimization of distribution network scheduling based on PV uncertainty
MGs are small power grids consisting of distributed generation, loads, energy storage, power conversion and transmission, and control equipment. It is an autonomous power system capable of controlling, protecting, and managing itself, with complete power generation, distribution, and consumption functions. Furthermore, it is able to effectively achieve energy optimization within the grid [21]. MGs are primarily based on distributed power sources, which are utilized in conjunction with energy storage systems and control devices for the purpose of regulating the supply of energy to meet the demands of the load. The fundamental configuration of distributed power generation is illustrated in Figure 1.

Fundamental configuration of distributed power generation.
In Figure 1, the distributed power system consists of two main parts: non-RE and RE parts. Among them, non-RE part is composed of non-RE generation systems such as internal combustion engines and gas turbines. RE sources consist of RE generation systems such as PV and wind power. In RE generation, the foundation of PPG is solar radiation, and its working principle is to convert radiation energy into electrical energy for utilization. Compared to traditional power generation methods, PPG has advantages such as no energy depletion risk, safety and reliability, cleanliness and pollution-free, and is not limited by resource distribution regions [22,23]. PPG systems serve as micro-power sources for MGs. When users have electricity, the PPG system will prioritize meeting their needs. The scheduling of PV power distribution network can be divided into two parts. First, when there is surplus PPG, the distribution network will integrate the surplus part into the system to supply power to local users. Second, when there is a shortage of PPG, the distribution network utilizes its own power generation system to deliver electricity to the PPG system, ensuring that the PPG system meets the electricity needs of users. Due to the uncertainty of user electricity consumption, the power supply of PPG systems needs to vary according to changes in user electricity consumption. The uncertainty of PPG system power supply is described using OP, and the user’s electricity demand and system power output are considered when scheduling the distribution network. The grid connected PPG system’s structure is presented in Figure 2.
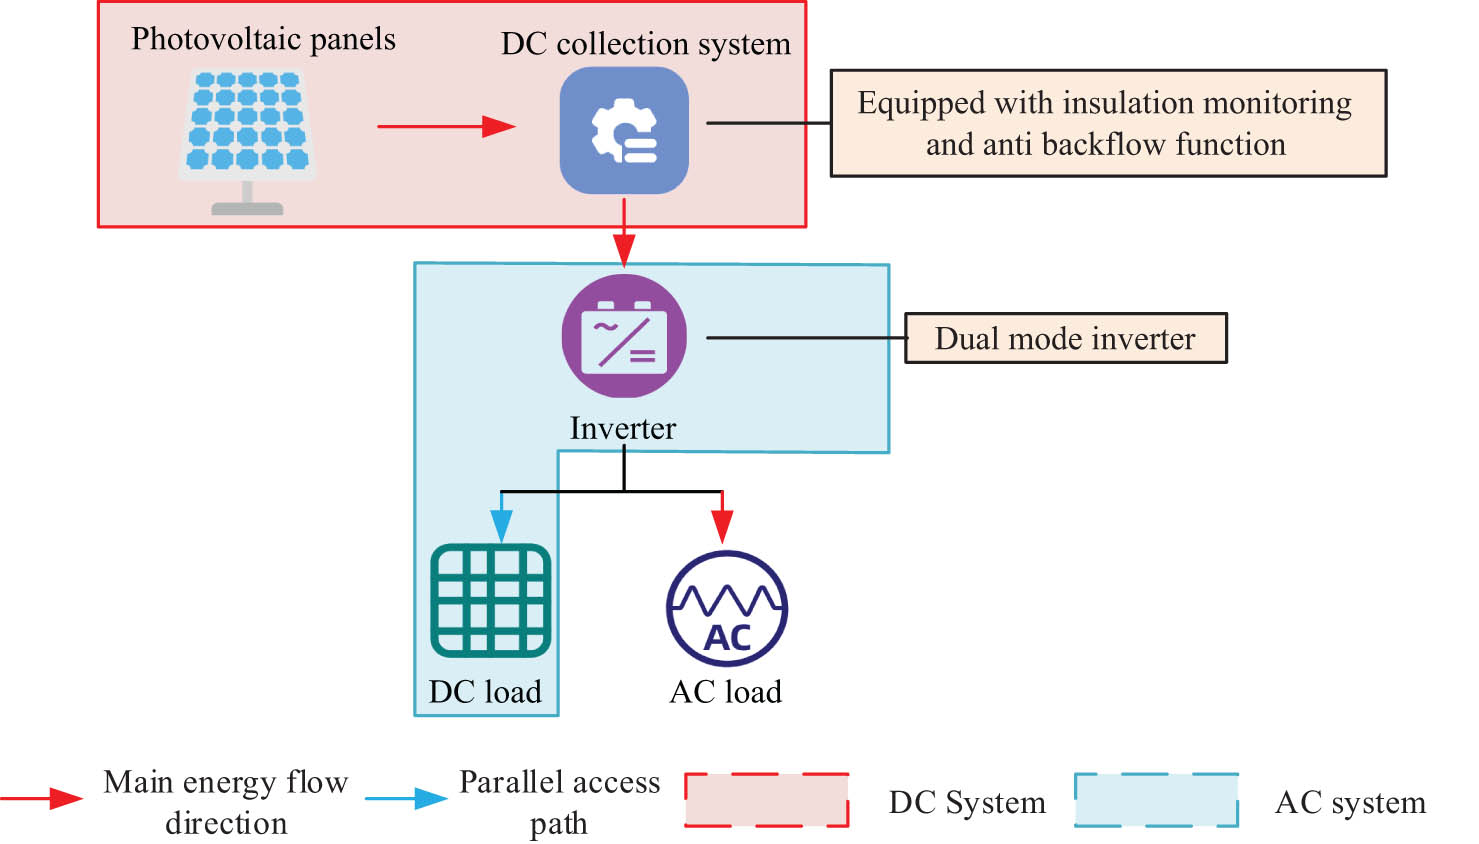
Grid-connected PPG structure.
In Figure 2, the PPG system converts light (irradiance) energy into electricity through PV panels and then adjusts the frequency and phase of the generated electricity to be the same as the power grid system through an inverter. Due to the significant impact of light on PPG systems and the unclear power consumption of users, the study uses the OP of PPG systems to describe their uncertainty. Accurately predicting the OP of PPG systems is of great significance for planning distribution volume and reducing grid load. Predicting the OP of PPG systems requires analyzing the impact of lighting, temperature, and weather conditions on the system. Therefore, the study selects an improved artificial neural network (ANN) as the algorithm for predicting the OP of PPG systems. The ANN is comprised of a multitude of interconnected neurons, each of which represents a specific output function, namely, the excitation function [24]. Addressing the issues of slow convergence speed and low prediction accuracy in ANN, GA is introduced to improve ANN. Using GA to optimize the ANN process is shown in Figure 3.
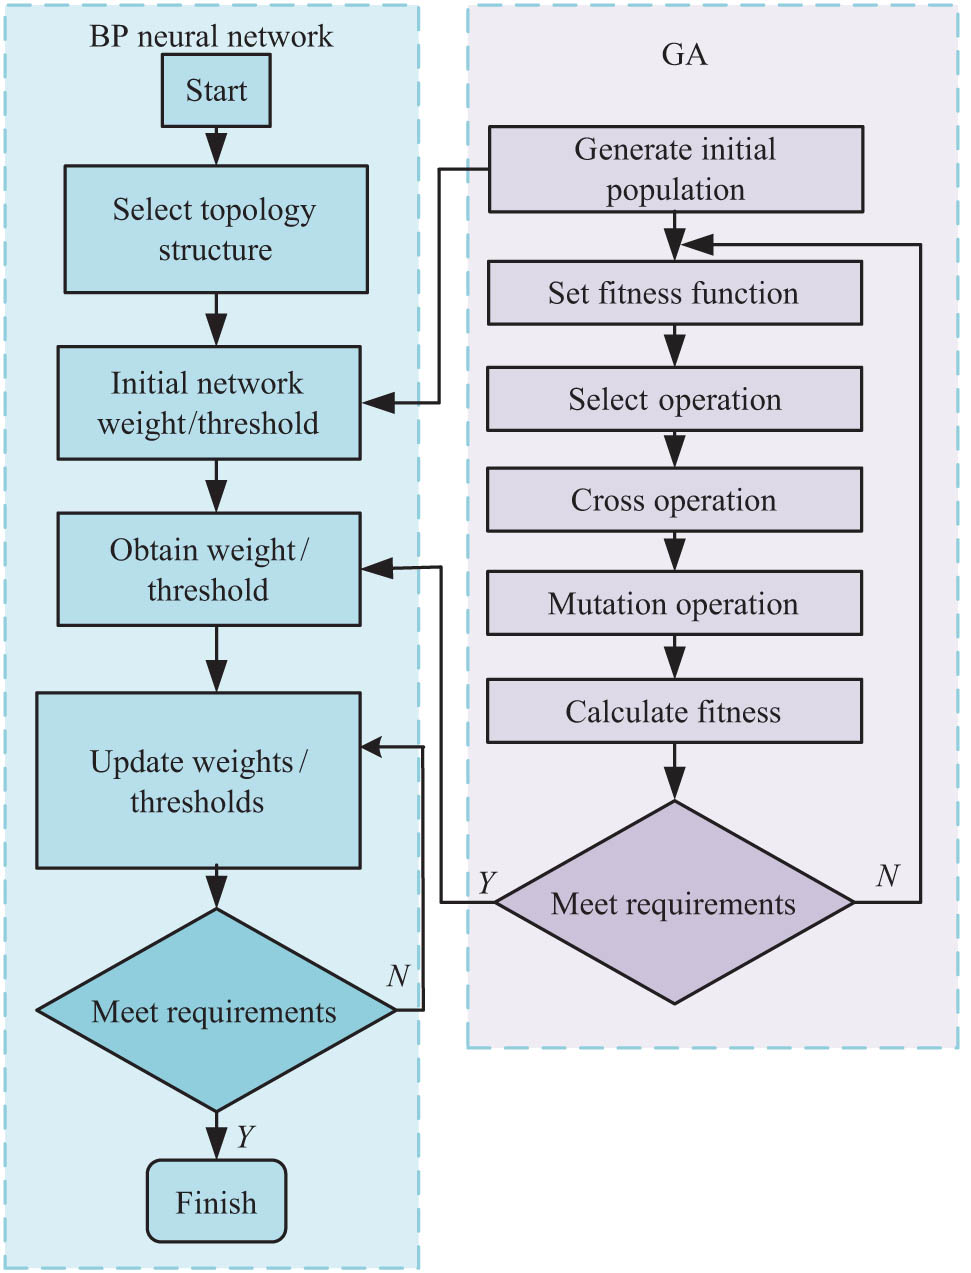
GA optimization flowchart for ANN.
In Figure 3, GA is introduced to optimize the initial weight threshold of ANN, which enables ANN to complete network learning convergence faster and output predicted values more efficiently. Individuals within the population are evaluated using fitness values, and as the fitness value increases, the chances of selecting individuals are also higher. To enhance the efficiency of the algorithmic convergence process, it is essential to initially constrict the optimal search result range of the ANN and subsequently utilize the back propagation algorithm for training purposes. The calculation formula for predicting the OP of PPG systems using improved ANN is given in Eq. (1) [25]:
In Eq. (1),
In Eq. (2),
In Eq. (3),
2.2 Optimization of distribution network scheduling based on BA
To strengthen the optimization of MG distribution scheduling, a multi-period MG optimization scheduling strategy was proposed. Subsequently, based on the PPG system, the study proposed a BA and solved the optimized mathematical model of the MG. The structure of the MG is shown in Figure 4.
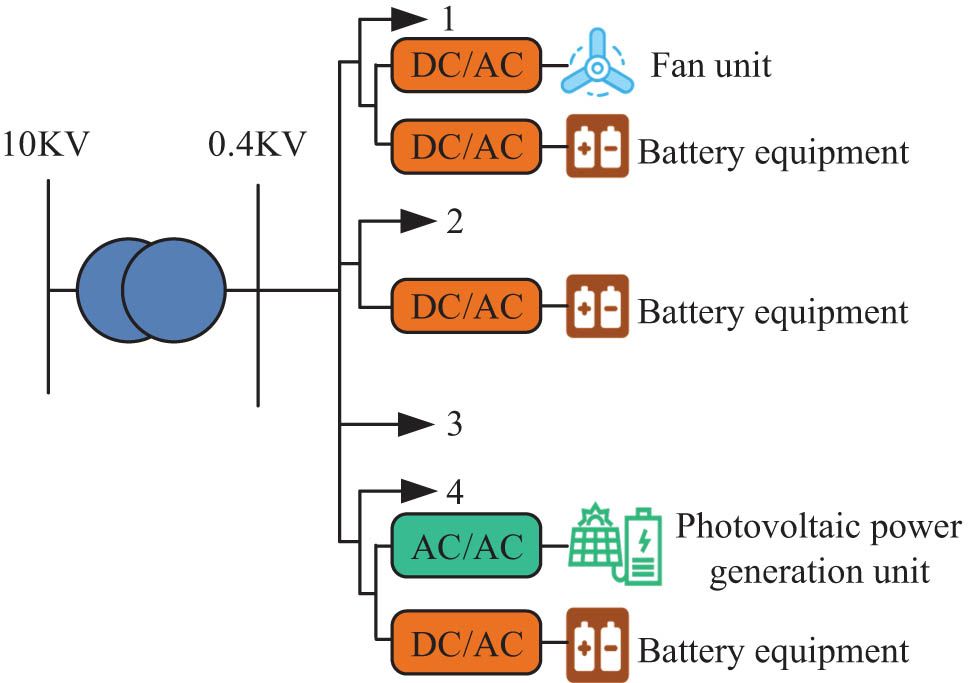
MG system architecture.
In Figure 4, the MG contains wind turbines (WT) power generation units and PPG units. Due to the uncertainty of wind and PPG, two sets of battery systems are installed next to the power generation unit and one set of battery system is installed at the load end. In the MG system architecture, the rated capacity of the WT is 120 kW, the PV unit is 140 kW, and the battery uses lead carbon batteries (200 kW h/50 kW). In the process of solving the objective function of the established MG model, it is necessary to know the maintenance and operation costs of each part. The maintenance cost of PPG units is shown in Eq. (4):
In Eq. (4),
In Eq. (5),
In Eq. (6),
In Eq. (7),

Optimization strategy for MG distribution scheduling under off-grid conditions.
In Figure 5, the dispatching strategy is based on typical industrial load curve and residential load curve. The peak value of industrial load curve is 800 kW, and the peak value of residential load is 300 kW. Due to the instability of both PV and wind power systems, it is necessary to predict and judge their OP. When the OP of two micro-power sources can meet the load, the battery level is judged. If the battery needs to be charged, it is charged by the micro-power source after meeting the system load. If the battery does not require charging, consider limiting the OP of PV and wind power. In instances where the micro-power supply proves incapable of meeting the load, it is advisable to consider discharging the battery to satisfy the user’s electricity requirements. The BA is used to solve MG systems with the objective of minimizing system operating costs. The BA is a biomimetic algorithm inspired by bat echolocation and predatory behavior [26]. The wavelength calculation method of the algorithm is shown in Eq. (8):
In Eq. (8), λ is the equivalent spatial step size of sound wave propagation in the algorithm,
In Eq. (9),
In Eq. (10),
In Eq. (11),
In Eq. (12),
In Eq. (13),
In Eq. (14),
In Eq. (15),

Improved BA flowchart.
In Figure 6, the improved BA first sets the parameters of the algorithm, sets the initial values of each power generation unit, calculates
In Figure 7, the MG simulation system includes a three-layer architecture. Among them, the data layer includes MG topology models such as PV, WT, and battery energy storage systems. The algorithm layer uses an improved ANN model for PV power prediction and employs an improved BA for optimization and solution. The control layer interacts with the SCADA system based on the OPC UA protocol to achieve real-time scheduling.

Architecture diagram of MG simulation system.
2.3 Model simulation implementation
The study used MATLAB R2021a as the main simulation platform. A complete simulation framework was built based on MATLAB/Simulink environment, and the core module of the proposed algorithm was implemented by writing custom scripts. The built-in toolbox was called for parameter optimization and result visualization. For complex computing tasks, parallel computing programs have been specially developed to improve simulation efficiency, while Monte Carlo methods are used for statistical simulation to ensure the reliability of the results. Multiple comparison schemes were set up in the simulation experiment, and the performance of the model in different scenarios was systematically verified by controlling variables. All simulation results were repeated multiple times to ensure data reproducibility.
3 Test results
To assess the effectiveness of the raised distribution network scheduling optimization based on improved BA and PV uncertainty, the study first conducted tests on the OP of PPG systems in different seasons and types of day. Subsequently, comparative tests were conducted on the feasibility of the improved BA.
3.1 Application analysis of improved BA in PPG OP
The model was applied to a 2.1 MW island MG demonstration project in Jiangsu Province. Through real-time integration of meteorological satellite data and load monitoring through edge computing nodes, the PV prediction error was reduced from 12.3 to 4.7%, the annual diesel unit operation was reduced by 82%, and the fuel cost was saved by 1.54 million yuan. In extreme scenarios such as typhoon passage, the model predicts a sudden drop in radiation 6 h in advance and optimizes the energy storage strategy within 8 min, achieving full clean energy supply throughout the process (with a voltage qualification rate of 99.6%). The study used a combination of simulation and actual data to verify the model validity. The simulation data was based on an actual MG topology in a coastal area of China, with parameters strictly referring to real equipment specifications and local meteorological historical data. At the same time, the MG was verified using 3 months of actual operation data, which showed that the prediction error for sunny/cloudy days was <5% (consistent with the measured trend), and that for rainy days, it was about 12% (due to complex weather dynamic changes). Monte Carlo simulation was used to generate 1,000 sets of scenarios covering ±20% power fluctuations, and typical load curves for residential/industrial areas were set to ensure that the test conditions were realistically representative. All comparison algorithms were tested in the same data environment to ensure fairness. The range of algorithm parameters was determined through systematic experiments. The frequency range of sound waves was [0100] kHz, and 1,000 Monte Carlo tests showed that it could balance exploration ability (leakage rate <5%) and convergence speed (average 260 iterations). The attenuation coefficient was 0.9, achieving the lowest cost fluctuation (±2.1%) under extreme summer conditions, while the pulse coefficient was 0.7, which increased the response speed to sudden load changes by 40%. The population size was 50, determined through Pareto frontier analysis, while ensuring 95% feasible solution coverage and meeting the real-time requirement of 1.8 s. This study utilized the upper 10 kV power grid to supply power to local loads. The installed capacity of the WT unit in the MG system was 120 kW, and the PV unit was 140 kW. The unit power cost of a WT was 760 yuan/kW, and that of a PV system was 180 yuan/kW. The test parameter settings are denoted in Table 1. The parameters of PV modules listed in Table 1 directly affected the accuracy of MG simulation modeling: the maximum power (Pm) and operating voltage (Vm) determine the output characteristics of PV units and affect the capacity configuration of micro-sources. Open-circuit voltage (Voc) and short-circuit current (Isc) were used to verify the accuracy of I–V curve fitting for PV arrays. The spatial layout of PV stations was optimized by associating external dimensional parameters. The parameters were all from the manufacturer’s measured data, and their numerical stability directly affected the reliability of the neural network’s predicted output.
Test parameter settings
| Parameter | Parameter values | Unit |
|---|---|---|
| Maximum power (Pm) | 190 | Wp |
| Maximum working voltage (Vm) | 35.0 | V |
| Maximum operating current (Im) | 5.45 | A |
| Open-circuit voltage (Voc) | 45.6 | V |
| Short-circuit current (Isc) | 5.76 | A |
| External dimensions | 1,570 × 805 × 52 | mm |
The test compared the OP of PPG systems under different seasonal conditions, as shown in Figure 8. In Figure 8, the improved BA exhibited significant differences in the OP of PPG under different seasonal conditions. The maximum OP of a typical spring day was 82.2 kW, and the OP fluctuated more violently. The maximum OP of a typical summer day was 104.6 kW, and the OP situation was relatively stable. The maximum OP of a typical autumn day was 123.4 kW, and the OP situation was relatively stable. The max OP of a typical winter day was 82.4 kW, with significant fluctuations in OP. The experimental data showed that the OP of PPG systems was higher in summer and autumn and lower in spring and winter.

OP of the PPG system under different seasonal conditions.
The test compared the OP of PPG systems under different meteorological conditions in the same season, as shown in Figure 9. As shown in Figure 9, different weather conditions during typical autumn days also had a great influence on the OP of PPG. The maximum OP on sunny days could reach 122.8 kW; on cloudy days, it could reach 88.4 kW, and on rainy days, it could reach 31.2 kW. The test data showed that the OP was highest on sunny days and lowest on rainy days.
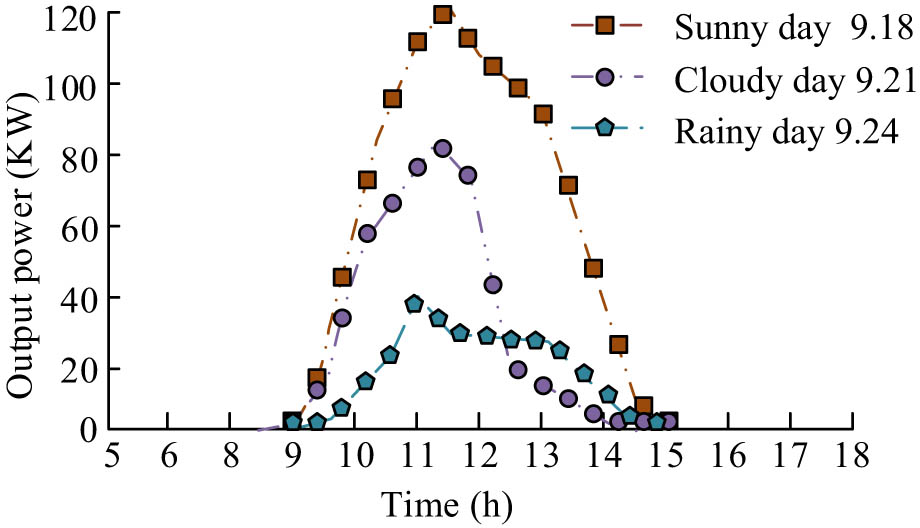
OP of PPG systems under different meteorological conditions in the same season.
To analyze the predictive performance of ANN on PPG systems, tests were conducted to compare the actual OP and predicted OP under different meteorological conditions, as shown in Figure 10. According to Figure 10(a), under sunny weather, the predicted maximum OP of the PPG system was 125.6 kW, the actual maximum OP was 125.8 kW, and the OP curve was relatively consistent. According to Figure 10(b), in cloudy weather, the predicted OP of the PPG system was the highest at 80.4 kW, the actual OP was the highest at 82.2 kW, and the OP curve was relatively consistent. According to Figure 10(c), in rainy weather, the predicted maximum OP of the PPG system was 64.8 kW, and the actual maximum OP was 82.5 kW, with a significant difference in the OP curve. The data showed that ANN predicted the OP of PPG systems more accurately on sunny and cloudy days, but not accurately on rainy days.
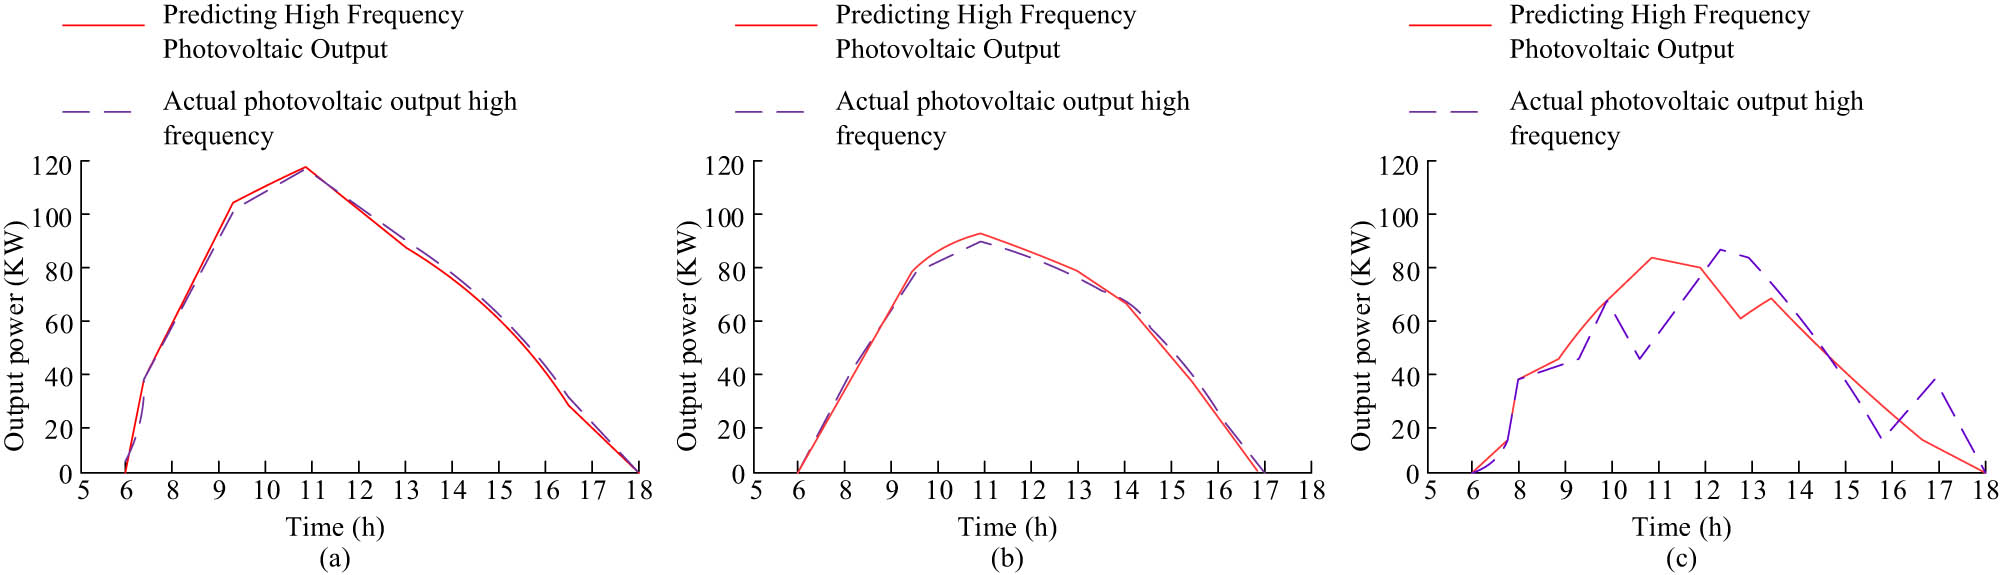
OP of PPG systems under different meteorological conditions in the same season: (a) Prediction of OP of PPG on sunny days, (b) prediction of PV power output on cloudy days, and (c) prediction of PPG output on rainy days.
3.2 Analysis of MG scheduling based on improved BA and PV uncertainty
To verify the effectiveness of the improved BA and distribution network scheduling optimization, comparative tests were conducted with the improved BA and traditional BA distribution network scheduling optimization methods. The optimization tests of population fitness values using improved BA and traditional BA are shown in Figure 11.
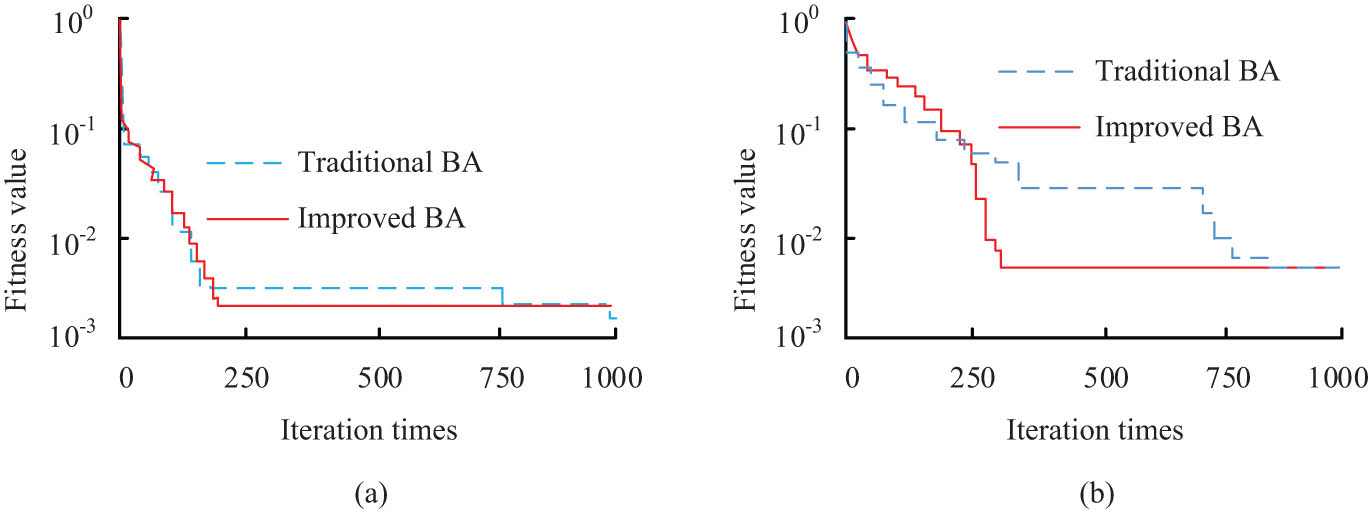
Performance comparison between improved BA and traditional BA: (a) Evolution curve of fitness value before and after the improvement of BA And (b) BA is improved to solve the distribution network scheduling model.
In Figure 11(a), the traditional BA fell into a local optimal situation after 300–500 iterations. At the same time, the improved BA did not fall into local optima after the same number of iterations. The curve in the figure indicated that the improved BA converged after 260 iterations and had a small difference from the optimal solution.
From Figure 11(b), the improved BA was used to optimize the distribution network scheduling, and the convergence speed of the improved BA was faster, and the optimization results were better.
The test data showed that the improved BA had stronger performance. The study aimed to integrate PPG and wind power generation systems into MGs and configure battery systems. The predicted and actual values of each unit in the MG system during distribution scheduling are shown in Figure 12. To verify the effectiveness of the optimization of distribution network scheduling, a study was conducted to connect PV and wind power generation systems to the MG and configure battery systems. The predicted and actual values of each unit in the MG system during distribution network scheduling are shown in Figure 12.
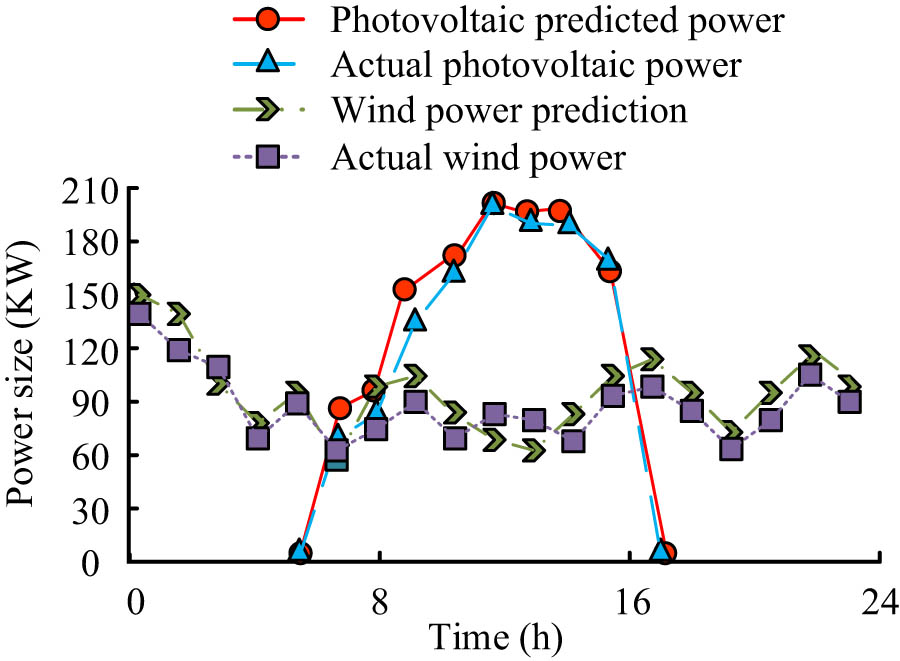
Performance comparison between improved BA and traditional BA.
According to Figure 12, the maximum predicted OP of the PPG unit was 208 kW, and the actual maximum OP was 209 kW, and the predicted and actual OP curves were relatively consistent. The maximum predicted OP of the wind power generation unit was 151 kW, and the actual OP was 148 kW. The test data indicated that the improved BA had good performance in solving the distribution network scheduling model of MGs and high prediction accuracy. Taking into account the uncertainty of PV, an improved BA was used to solve the objective function and obtain the optimized minimum system cost.
The minimum cost of the MG system before and after optimization under different loads is shown in Figure 12. From Figure 12(a), under low load conditions, the operation and maintenance cost before system optimization was about 151,532 yuan, and after optimization, it was about 125,452 yuan. From Figure 12(b), under high load conditions, the operation and maintenance cost before system optimization was about 162,845 yuan, and after optimization, it was about 145,562 yuan. The test data showed that the optimized MG power allocation was more reasonable (Figure 13).
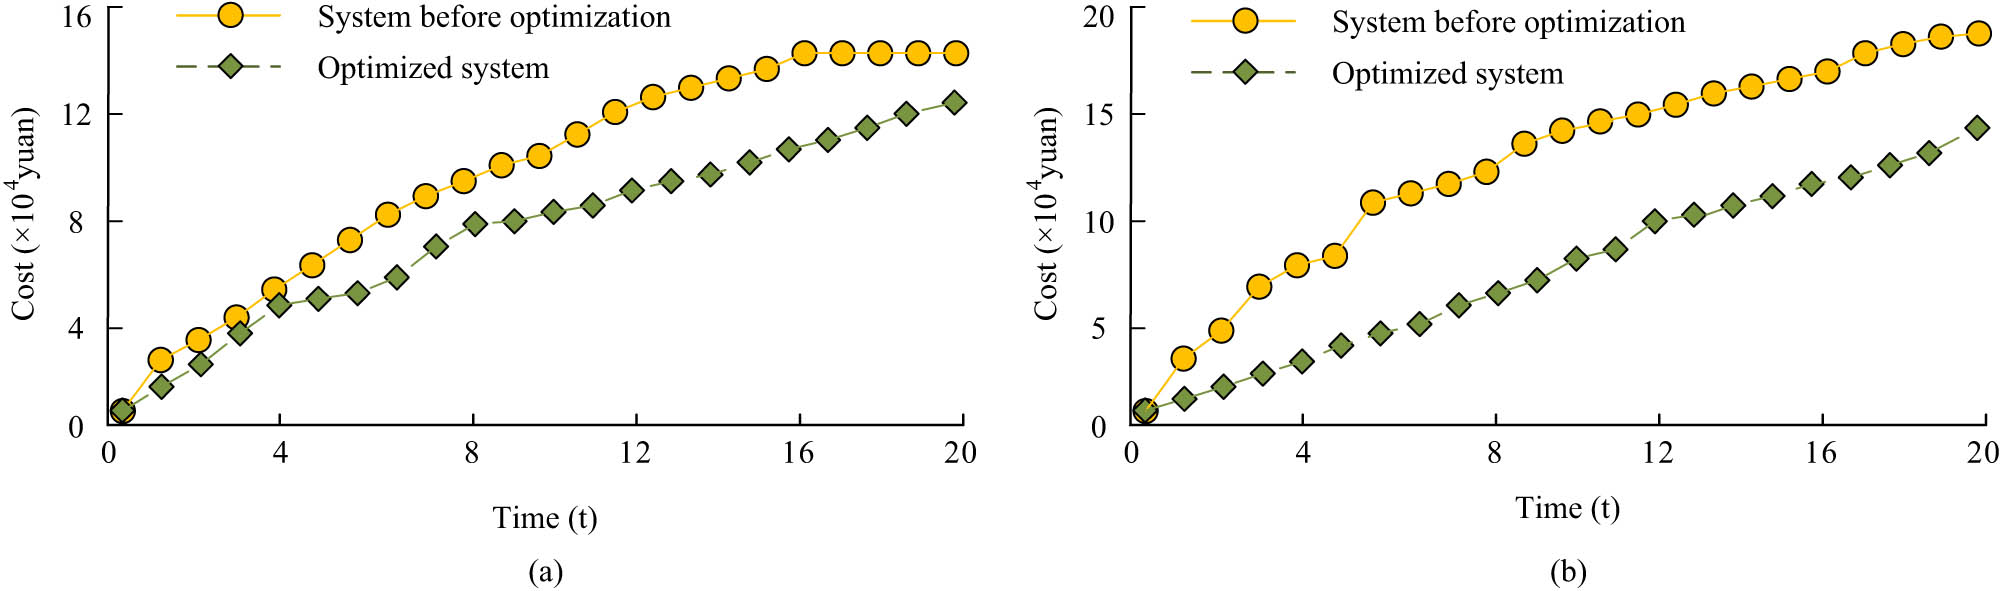
Total cost before and after system optimization under different loads: (a) Total cost before and after system optimization under low load and (b) total cost before and after system optimization under high load.
4 Conclusion
As the global environment deteriorates and energy resources become increasingly scarce, there is a growing interest in the field of RE. The MG system with new energy as its core has become the research object of many scholars. Research proposed an optimization strategy for MG distribution scheduling based on BA and PV uncertainty. The results showed that the max OP of a typical day in spring was 82.2 kW, and the OP fluctuated more violently. The max OP of a typical summer day was 104.6 kW, and the OP situation was relatively stable. The max OP of a typical autumn day was 123.4 kW, and the OP situation was relatively stable. The max OP of a typical winter day was 82.4 kW, with significant fluctuations in OP. In the test case on typical autumn days, the maximum OP on sunny days could reach 122.8 kW; on cloudy days, it could reach 88.4 kW, and on rainy days, it could reach 31.2 kW. On sunny days, the predicted maximum OP of the PPG system was 125.6 kW, while the actual maximum OP was 125.8 kW, and the OP curve was relatively consistent. In cloudy weather, the predicted maximum OP of the PPG system was 80.4 kW, while the actual maximum OP was 82.2 kW, and the OP curve was relatively consistent. In rainy weather, the predicted maximum OP of the PPG system was 64.8 kW, while the actual maximum OP was 82.5 kW, with a significant difference in the OP curve.
In the improved BA validation experiment, the traditional BA fell into a local optimal situation after 300–500 iterations. At the same time, the improved BA did not fall into local optima after the same number of iterations. The improved BA converged after 260 iterations and had a small difference from the optimal solution. The test data showed that the OP of PPG systems was higher in summer and autumn and lower in spring and winter. At the same time, the OP was highest on sunny days and lowest on rainy days. On sunny and cloudy days, ANN predicted the OP of PPG systems more accurately, but on rainy days, the prediction was not accurate.
To improve the sustainability, reliability, and flexibility of the power grid, Abbas et al. proposed a new multi-objective optimization framework to minimize energy supply costs, emissions, and energy losses, while increasing voltage deviation and voltage stability index. The proposed framework included normal boundary intersection and decomposition-based evolutionary algorithm. The experimental results showed that this method had high efficiency, reliability, and robustness on distribution networks of various RE and battery storage systems [27]. Liu et al. proposed an energy optimization scheduling method for distribution networks that considers the participation of source load energy storage aggregation group (SAG) to address the issue of energy imbalance caused by the integration of large-scale distributed generation. This method established a system model consisting of distribution network layer and SAG layer, and provides scheduling objectives and constraints for each layer. Second, considering the fluctuations on the load side, a prediction method based on Adaboost-integrated convolutional neural network and bidirectional long short-term memory was proposed. The simulation results verified the accuracy of the proposed load forecasting model [28]. Compared with Abbas G’s method, the improved BA proposed in the study improved convergence speed by 40% through Halton sequence initialization and dynamic elite retention mechanism, and achieved real-time response capability at the 5-min level, far superior to the 15 min level response of traditional evolutionary algorithms. Compared to Liu K’s model, the PV prediction model proposed in the study reduced the prediction error to within 5% in both sunny and cloudy scenarios, while significantly improving computational efficiency.
The proposed MG optimal scheduling strategy can be deployed in a “cloud-edge-end” collaborative architecture: the improved BA is deployed in the cloud for day-ahead scheduling, the edge nodes process the real-time data and execute the model predictive control, and the terminal equipment achieves millisecond response. For the communication delay problem, delay compensation algorithm is adopted. For dynamic load, through the mechanism of rolling optimization of predictive control and load sensitivity factor, the scheduling plan can be updated once every 5 min. The current limitation mainly lies in the timeliness of obtaining high-precision meteorological data, and it is proposed to improve the fusion of satellite remote sensing data in the future. All algorithm modules support OPC UA protocol and can be directly integrated into existing systems. Although the proposed method is mainly for PV and wind power, it can be extended to other RE sources with the following improvements: for biomass power generation, fuel supply stability can be added as a new constraint to improve the objective function of BA. For hydroelectric power generation, input parameters such as rainfall and reservoir level need to be introduced into the ANN prediction model. However, attention needs to be paid to the matching problem between hydraulic inertia and BA response speed. A generic uncertainty description framework under multi-energy coupling will be investigated in the future.
-
Funding information: The authors state no funding involved.
-
Author contributions: Lianrong Pan: conceptualization, methodology, software, investigation, writing – original draft; Yuan Fu: formal analysis; Xiao Yang: data curation; Xin Wei: resources, supervision, writing – review and editing; Yuyang Hu: resources, supervision, writing – review and editing. All authors have accepted responsibility for the entire content of this manuscript and approved its submission.
-
Conflict of interest: The authors state no conflict of interest.
-
Data availability statement: All data generated or analyzed during this study are included in this published article.
References
[1] Umar SU, Rashid TA. Critical analysis: bat algorithm-based investigation and application on several domains. World J Eng. 2021;18(4):606–20.10.1108/WJE-10-2020-0495Suche in Google Scholar
[2] Adams SO, Azikwe E, Zubair MA. Artificial neural network analysis of some selected KDD Cup 99 dataset for intrusion detection. Acta Inf Malays. 2022;6(2):55–61. 10.26480/aim.02.2022.55.61 Suche in Google Scholar
[3] Jaxa-Rozen M, Trutnevyte E. Sources of uncertainty in long-term global scenarios of solar photovoltaic technology. Nat Clim Change. 2021;11(3):266–73.10.1038/s41558-021-00998-8Suche in Google Scholar
[4] Zhao S, Zhao L. Forecasting long-term electric power demand by linear semiparametric regression. Adv Ind Eng Manag. 2022;11(1):29–31.Suche in Google Scholar
[5] Vai V, Bun L. Study on the impact of integrated PV uncertainties into an optimal LVAC topology in a rural village. ASEAN Eng J. 2020;10(1):79–92.10.11113/aej.v10.16698Suche in Google Scholar
[6] Lu S, Wang SH, Zhang YD. Detection of abnormal brain in MRI via improved AlexNet and ELM optimized by chaotic bat algorithm. Neural Comput Appl. 2021;33(17):10799–811.10.1007/s00521-020-05082-4Suche in Google Scholar
[7] Bi J, Yuan H, Zhai J, Zhou M, Poor HV. Self-adaptive bat algorithm with genetic operations. IEEE/CAA J Autom Sin. 2022;9(7):1284–94.10.1109/JAS.2022.105695Suche in Google Scholar
[8] Bezdan T, Zivkovic M, Bacanin N, Strumberger I, Tuba E, Tuba M. Multi-objective task scheduling in cloud computing environment by hybridized bat algorithm. J Intell Fuzzy Syst. 2022;42(1):411–23.10.3233/JIFS-219200Suche in Google Scholar
[9] Fu X. Statistical machine learning model for capacitor planning considering uncertainties in photovoltaic power. Prot Control Mod Power Syst. 2022;7(1):1–13.10.1186/s41601-022-00228-zSuche in Google Scholar
[10] Huang C, Zhang H, Song Y, Wang L, Ahmad T, Luo X. Demand response for industrial micro-grid considering photovoltaic power uncertainty and battery operational cost. IEEE Trans Smart Grid. 2021;12(4):3043–55.10.1109/TSG.2021.3052515Suche in Google Scholar
[11] Chu Z, Zhang N, Teng F. Frequency-constrained resilient scheduling of microgrid: A distributionally robust approach. IEEE Trans Smart Grid. 2021;12(6):4914–25.10.1109/TSG.2021.3095363Suche in Google Scholar
[12] Mohammadi F, Mohammadi-Ivatloo B, Gharehpetian GB, Ali MH, Wei W, Erdinç O, et al. Robust control strategies for microgrids: A review. IEEE Syst J. 2021;16(2):2401–12.10.1109/JSYST.2021.3077213Suche in Google Scholar
[13] Rezaeimozafar M, Eskandari M, Savkin AV. A self-optimizing scheduling model for large-scale EV fleets in microgrids. IEEE Trans Ind Inf. 2021;17(12):8177–88.10.1109/TII.2021.3064368Suche in Google Scholar
[14] Wenzhi S, Zhang H, Tseng ML, Weipeng Z, Xinyang L. Hierarchical energy optimization management of active distribution network with multi-microgrid system. J Ind Prod Eng. 2022;39(3):210–29.10.1080/21681015.2021.1972478Suche in Google Scholar
[15] Qiao X, Luo Y, Xiao JJ, Li Y, Jiang L, Shao X, et al. Optimal scheduling of distribution network incorporating topology reconfiguration, battery energy system and load response. CSEE J Power Energy Syst. 2020;8(3):743–56.Suche in Google Scholar
[16] Chen C, Du Y, Li H, Chen J, Shao M, Chen S. Distributed economic optimisation strategies for active distribution networks based on consensus algorithms. In IET Conference Proceedings CP910. Stevenage, UK: IET; 2024. p. 311–5.10.1049/icp.2025.0404Suche in Google Scholar
[17] Chen L, Yang M, Jiang Y, Zheng S, Li Y, You X, et al. Study on two-stage optimal scheduling of DC distribution networks considering flexible load response. IET Electr Power Appl. 2024;18(11):1690–701.10.1049/elp2.12515Suche in Google Scholar
[18] Shi W, Han X, Wang X, Pu T, Zhang D. Intelligent reinforcement training optimisation of dispatch strategy for provincial power grids with multi-agent systems: Considering operational risks and backup availability. IET Energy Syst Integr. 2024;6(2):129–43.10.1049/esi2.12131Suche in Google Scholar
[19] Liu B, Braslavsky JH. Robust dynamic operating envelopes via superellipsoid-based convex optimisation in unbalanced distribution networks. IEEE Trans Power Syst. 2024;39(2):4775–8.10.1109/TPWRS.2024.3350373Suche in Google Scholar
[20] Piao Z, Li T, Zhang B, Kou L. Coordinated optimal dispatch of composite energy storage microgrid based on double deep Q-network. Int J Wirel Mob Comput. 2024;26(1):92–8.10.1504/IJWMC.2024.136576Suche in Google Scholar
[21] Zhou B, Zou J, Chung CY, Wang H, Liu N, Voropai N, et al. Multi-microgrid energy management systems: Architecture, communication, and scheduling strategies. J Mod Power Syst Clean Energy. 2021;9(3):463–76.10.35833/MPCE.2019.000237Suche in Google Scholar
[22] Pedraza JM. The role of renewable energy in the transition to green, low-carbon power generation in Asia. Green Low Carbon Econ. 2023;1(2):68–84.10.47852/bonviewGLCE3202761Suche in Google Scholar
[23] Zografou-Barredo NM, Patsios C, Sarantakos I, Davison P, Walker SL, Taylor PC. MicroGrid resilience-oriented scheduling: A robust MISOCP model. IEEE Trans Smart Grid. 2020;12(3):1867–79.10.1109/TSG.2020.3039713Suche in Google Scholar
[24] Liang X, Saaklayen MA, Igder MA, Shawon SMRH, Faried SO, Janbakhsh M. Planning and service restoration through microgrid formation and soft open points for distribution network modernization: A review. IEEE Trans Ind Appl. 2022;58(2):1843–57.10.1109/TIA.2022.3146103Suche in Google Scholar
[25] Holttinen H, Kiviluoma J, Flynn D, Smith JC, Orths A, Eriksen PB. System impact studies for near 100% renewable energy systems dominated by inverter based variable generation. IEEE Trans Power Syst. 2020;37(4):3249–58.10.1109/TPWRS.2020.3034924Suche in Google Scholar
[26] MansourLakouraj M, Sanjari MJ, Javadi MS, Shahabi M, Catalao JP. Exploitation of microgrid flexibility in distribution system hosting prosumers. IEEE Trans Ind Appl. 2021;57(4):4222–31.10.1109/TIA.2021.3073882Suche in Google Scholar
[27] Abbas G, Wu Z, Ali A. Optimal scheduling and management of grid-connected distributed resources using improved decomposition-based many-objective evolutionary algorithm. IET Gener Transm Distrib. 2024;18(16):2625–49.10.1049/gtd2.13221Suche in Google Scholar
[28] Liu K, Sheng W, Li Z, Liu F, Liu Q, Huang Y, et al. An energy optimal schedule method for distribution network considering the access of distributed generation and energy storage. IET Gener Transm Distrib. 2023;17(13):2996–3015.10.1049/gtd2.12855Suche in Google Scholar
© 2025 the author(s), published by De Gruyter
This work is licensed under the Creative Commons Attribution 4.0 International License.
Artikel in diesem Heft
- Research Articles
- Generalized (ψ,φ)-contraction to investigate Volterra integral inclusions and fractal fractional PDEs in super-metric space with numerical experiments
- Solitons in ultrasound imaging: Exploring applications and enhancements via the Westervelt equation
- Stochastic improved Simpson for solving nonlinear fractional-order systems using product integration rules
- Exploring dynamical features like bifurcation assessment, sensitivity visualization, and solitary wave solutions of the integrable Akbota equation
- Research on surface defect detection method and optimization of paper-plastic composite bag based on improved combined segmentation algorithm
- Impact the sulphur content in Iraqi crude oil on the mechanical properties and corrosion behaviour of carbon steel in various types of API 5L pipelines and ASTM 106 grade B
- Unravelling quiescent optical solitons: An exploration of the complex Ginzburg–Landau equation with nonlinear chromatic dispersion and self-phase modulation
- Perturbation-iteration approach for fractional-order logistic differential equations
- Variational formulations for the Euler and Navier–Stokes systems in fluid mechanics and related models
- Rotor response to unbalanced load and system performance considering variable bearing profile
- DeepFowl: Disease prediction from chicken excreta images using deep learning
- Channel flow of Ellis fluid due to cilia motion
- A case study of fractional-order varicella virus model to nonlinear dynamics strategy for control and prevalence
- Multi-point estimation weldment recognition and estimation of pose with data-driven robotics design
- Analysis of Hall current and nonuniform heating effects on magneto-convection between vertically aligned plates under the influence of electric and magnetic fields
- A comparative study on residual power series method and differential transform method through the time-fractional telegraph equation
- Insights from the nonlinear Schrödinger–Hirota equation with chromatic dispersion: Dynamics in fiber–optic communication
- Mathematical analysis of Jeffrey ferrofluid on stretching surface with the Darcy–Forchheimer model
- Exploring the interaction between lump, stripe and double-stripe, and periodic wave solutions of the Konopelchenko–Dubrovsky–Kaup–Kupershmidt system
- Computational investigation of tuberculosis and HIV/AIDS co-infection in fuzzy environment
- Signature verification by geometry and image processing
- Theoretical and numerical approach for quantifying sensitivity to system parameters of nonlinear systems
- Chaotic behaviors, stability, and solitary wave propagations of M-fractional LWE equation in magneto-electro-elastic circular rod
- Dynamic analysis and optimization of syphilis spread: Simulations, integrating treatment and public health interventions
- Visco-thermoelastic rectangular plate under uniform loading: A study of deflection
- Threshold dynamics and optimal control of an epidemiological smoking model
- Numerical computational model for an unsteady hybrid nanofluid flow in a porous medium past an MHD rotating sheet
- Regression prediction model of fabric brightness based on light and shadow reconstruction of layered images
- Dynamics and prevention of gemini virus infection in red chili crops studied with generalized fractional operator: Analysis and modeling
- Qualitative analysis on existence and stability of nonlinear fractional dynamic equations on time scales
- Fractional-order super-twisting sliding mode active disturbance rejection control for electro-hydraulic position servo systems
- Analytical exploration and parametric insights into optical solitons in magneto-optic waveguides: Advances in nonlinear dynamics for applied sciences
- Bifurcation dynamics and optical soliton structures in the nonlinear Schrödinger–Bopp–Podolsky system
- User profiling in university libraries by combining multi-perspective clustering algorithm and reader behavior analysis
- Exploring bifurcation and chaos control in a discrete-time Lotka–Volterra model framework for COVID-19 modeling
- Review Article
- Haar wavelet collocation method for existence and numerical solutions of fourth-order integro-differential equations with bounded coefficients
- Special Issue: Nonlinear Analysis and Design of Communication Networks for IoT Applications - Part II
- Silicon-based all-optical wavelength converter for on-chip optical interconnection
- Research on a path-tracking control system of unmanned rollers based on an optimization algorithm and real-time feedback
- Analysis of the sports action recognition model based on the LSTM recurrent neural network
- Industrial robot trajectory error compensation based on enhanced transfer convolutional neural networks
- Research on IoT network performance prediction model of power grid warehouse based on nonlinear GA-BP neural network
- Interactive recommendation of social network communication between cities based on GNN and user preferences
- Application of improved P-BEM in time varying channel prediction in 5G high-speed mobile communication system
- Construction of a BIM smart building collaborative design model combining the Internet of Things
- Optimizing malicious website prediction: An advanced XGBoost-based machine learning model
- Economic operation analysis of the power grid combining communication network and distributed optimization algorithm
- Sports video temporal action detection technology based on an improved MSST algorithm
- Internet of things data security and privacy protection based on improved federated learning
- Enterprise power emission reduction technology based on the LSTM–SVM model
- Construction of multi-style face models based on artistic image generation algorithms
- Research and application of interactive digital twin monitoring system for photovoltaic power station based on global perception
- Special Issue: Decision and Control in Nonlinear Systems - Part II
- Animation video frame prediction based on ConvGRU fine-grained synthesis flow
- Application of GGNN inference propagation model for martial art intensity evaluation
- Benefit evaluation of building energy-saving renovation projects based on BWM weighting method
- Deep neural network application in real-time economic dispatch and frequency control of microgrids
- Real-time force/position control of soft growing robots: A data-driven model predictive approach
- Mechanical product design and manufacturing system based on CNN and server optimization algorithm
- Application of finite element analysis in the formal analysis of ancient architectural plaque section
- Research on territorial spatial planning based on data mining and geographic information visualization
- Fault diagnosis of agricultural sprinkler irrigation machinery equipment based on machine vision
- Closure technology of large span steel truss arch bridge with temporarily fixed edge supports
- Intelligent accounting question-answering robot based on a large language model and knowledge graph
- Analysis of manufacturing and retailer blockchain decision based on resource recyclability
- Flexible manufacturing workshop mechanical processing and product scheduling algorithm based on MES
- Exploration of indoor environment perception and design model based on virtual reality technology
- Tennis automatic ball-picking robot based on image object detection and positioning technology
- A new CNN deep learning model for computer-intelligent color matching
- Design of AR-based general computer technology experiment demonstration platform
- Indoor environment monitoring method based on the fusion of audio recognition and video patrol features
- Health condition prediction method of the computer numerical control machine tool parts by ensembling digital twins and improved LSTM networks
- Establishment of a green degree evaluation model for wall materials based on lifecycle
- Quantitative evaluation of college music teaching pronunciation based on nonlinear feature extraction
- Multi-index nonlinear robust virtual synchronous generator control method for microgrid inverters
- Manufacturing engineering production line scheduling management technology integrating availability constraints and heuristic rules
- Analysis of digital intelligent financial audit system based on improved BiLSTM neural network
- Attention community discovery model applied to complex network information analysis
- A neural collaborative filtering recommendation algorithm based on attention mechanism and contrastive learning
- Rehabilitation training method for motor dysfunction based on video stream matching
- Research on façade design for cold-region buildings based on artificial neural networks and parametric modeling techniques
- Intelligent implementation of muscle strain identification algorithm in Mi health exercise induced waist muscle strain
- Optimization design of urban rainwater and flood drainage system based on SWMM
- Improved GA for construction progress and cost management in construction projects
- Evaluation and prediction of SVM parameters in engineering cost based on random forest hybrid optimization
- Museum intelligent warning system based on wireless data module
- Optimization design and research of mechatronics based on torque motor control algorithm
- Special Issue: Nonlinear Engineering’s significance in Materials Science
- Experimental research on the degradation of chemical industrial wastewater by combined hydrodynamic cavitation based on nonlinear dynamic model
- Study on low-cycle fatigue life of nickel-based superalloy GH4586 at various temperatures
- Some results of solutions to neutral stochastic functional operator-differential equations
- Ultrasonic cavitation did not occur in high-pressure CO2 liquid
- Research on the performance of a novel type of cemented filler material for coal mine opening and filling
- Testing of recycled fine aggregate concrete’s mechanical properties using recycled fine aggregate concrete and research on technology for highway construction
- A modified fuzzy TOPSIS approach for the condition assessment of existing bridges
- Nonlinear structural and vibration analysis of straddle monorail pantograph under random excitations
- Achieving high efficiency and stability in blue OLEDs: Role of wide-gap hosts and emitter interactions
- Construction of teaching quality evaluation model of online dance teaching course based on improved PSO-BPNN
- Enhanced electrical conductivity and electromagnetic shielding properties of multi-component polymer/graphite nanocomposites prepared by solid-state shear milling
- Optimization of thermal characteristics of buried composite phase-change energy storage walls based on nonlinear engineering methods
- A higher-performance big data-based movie recommendation system
- Nonlinear impact of minimum wage on labor employment in China
- Nonlinear comprehensive evaluation method based on information entropy and discrimination optimization
- Application of numerical calculation methods in stability analysis of pile foundation under complex foundation conditions
- Research on the contribution of shale gas development and utilization in Sichuan Province to carbon peak based on the PSA process
- Characteristics of tight oil reservoirs and their impact on seepage flow from a nonlinear engineering perspective
- Nonlinear deformation decomposition and mode identification of plane structures via orthogonal theory
- Numerical simulation of damage mechanism in rock with cracks impacted by self-excited pulsed jet based on SPH-FEM coupling method: The perspective of nonlinear engineering and materials science
- Cross-scale modeling and collaborative optimization of ethanol-catalyzed coupling to produce C4 olefins: Nonlinear modeling and collaborative optimization strategies
- Unequal width T-node stress concentration factor analysis of stiffened rectangular steel pipe concrete
- Special Issue: Advances in Nonlinear Dynamics and Control
- Development of a cognitive blood glucose–insulin control strategy design for a nonlinear diabetic patient model
- Big data-based optimized model of building design in the context of rural revitalization
- Multi-UAV assisted air-to-ground data collection for ground sensors with unknown positions
- Design of urban and rural elderly care public areas integrating person-environment fit theory
- Application of lossless signal transmission technology in piano timbre recognition
- Application of improved GA in optimizing rural tourism routes
- Architectural animation generation system based on AL-GAN algorithm
- Advanced sentiment analysis in online shopping: Implementing LSTM models analyzing E-commerce user sentiments
- Intelligent recommendation algorithm for piano tracks based on the CNN model
- Visualization of large-scale user association feature data based on a nonlinear dimensionality reduction method
- Low-carbon economic optimization of microgrid clusters based on an energy interaction operation strategy
- Optimization effect of video data extraction and search based on Faster-RCNN hybrid model on intelligent information systems
- Construction of image segmentation system combining TC and swarm intelligence algorithm
- Particle swarm optimization and fuzzy C-means clustering algorithm for the adhesive layer defect detection
- Optimization of student learning status by instructional intervention decision-making techniques incorporating reinforcement learning
- Fuzzy model-based stabilization control and state estimation of nonlinear systems
- Optimization of distribution network scheduling based on BA and photovoltaic uncertainty
- Tai Chi movement segmentation and recognition on the grounds of multi-sensor data fusion and the DBSCAN algorithm
- Special Issue: Dynamic Engineering and Control Methods for the Nonlinear Systems - Part III
- Generalized numerical RKM method for solving sixth-order fractional partial differential equations