Construction of teaching quality evaluation model of online dance teaching course based on improved PSO-BPNN
-
Ben Jin


Abstract
With the combination of Internet technology and teaching methods, the online dance teaching mode is becoming more popular. However, traditional teaching quality evaluation methods such as neural network models have low efficiency, insufficient accuracy, and are prone to ignoring individual differences, making it difficult to better adapt to the online dance teaching mode. Accordingly, this study constructs a quality evaluation index system for online dance teaching by consulting relevant online course teaching experts, considering individual student differences, and existing research, including preparation, classroom teaching implementation, classroom teaching effectiveness, and reflection on after-school teaching. On this basis, the network dance teaching quality evaluation model based on back-propagation neural network is constructed. For these shortcomings, it is optimized by the improved particle swarm. This study uses inertia weight and crossover operator strategy to optimize particle swarm optimization algorithm, achieving the collaborative work of back-propagation neural network and particle swarm optimization. This study uses statistical data from online dance teaching courses in universities for experimental analysis. According to the findings, the accuracy of the designed model reached 97.25%, which significantly exceeded other commonly used methods. Based on this evaluation model, both teachers and students can receive feedback on teaching and learning processes, thereby improving teaching methods, meeting personalized needs of students, and enhancing learning outcomes. This study combines PSO and BPNN to provide a new method for evaluating the quality of online dance teaching, providing new reference ideas for improving the quality of online education in the information society.
1 Introduction
The education in traditional dance classrooms is mainly aimed at specialized talents who aspire to engage in the dance industry in the future. According to the training objectives and talent settings, it can be further divided into professional directions such as performance, education, and choreography [1]. In recent years, with the development of information technology, dance teaching needs to gradually meet different practical needs, such as different levels of development and interests. Therefore, the online dance teaching method has emerged. Supported by Internet technology, dance teaching is limited to offline classroom teaching, which breaks through the limitations of time and place. It can meet more extensive and diversified learning needs [2,3]. The construction of the dance course teaching quality (TQ) evaluation system is to adapt to the dance education quality evaluation for all students, aiming to promote the comprehensive development of students through dance activities, rather than only cultivating a few dance elites. However, traditional TQ evaluation methods such as support vector machines, random forests, and neural network models have low efficiency, insufficient accuracy, diverse evaluation criteria, and are prone to ignoring individual differences among students, making it difficult to better adapt to the online dance teaching mode. How to better evaluate its TQ has become a current research hotspot [4,5]. Therefore, based on the characteristics of online dance teaching courses, the study constructs a TQ evaluation index system applicable to this teaching mode. Based on the index system, the TQ model based on back-propagation neural network (BPNN) is constructed. Addressing the drawbacks of BPNN, this study improves the inertia weight through a nonlinear decreasing weight change method based on the standard particle swarm optimization (PSO) algorithm. Meanwhile, cross operators are introduced for optimization. Thus, an improved PSO (IPSO) algorithm is constructed. Therefore, the BPNN based on the IPSO (IPSO-BPNN) is constructed. This study adopts an IPSO algorithm to improve the weights and thresholds of BPNN, which can effectively solve the slow convergence and easy falling into local optima of BPNN, and achieve the collaborative work of BPNN and IPSO. It is expected that the evaluation model can better evaluate the TQ of online dance teaching courses, give students a clearer perception of their dance learning performance, improve teaching strategies, and optimize the online dance TQ.
The contributions of this study are as follows. First of all, this research combines BPNN and IPSO to build a quality evaluation model, which provides a new research method for online education quality evaluation in the internet era. Second, this evaluation method has achieved significant performance advantages in the quality evaluation of online dance teaching, providing effective support for the development and reform of dance teaching.
The study is structured into four sections. The first section discusses the current research status of dance teaching and IPSO algorithm. The second section constructs a TQ evaluation model for online dance teaching courses. The third section evaluates its performance. The fourth section summarizes the entire study.
2 Related work
Dance teaching has a long history of development. However, as an emerging dance teaching method, online dance teaching is gradually gaining popularity. Many scholars have conducted in-depth research on dance teaching. For example, in response to specific guidance on dance teaching movements, Yasui investigated the coordination between speech and body in the teaching environment based on multi-modal analysis of interaction. According to the findings, in dance teaching, the instructor coordinated body movements with onomatopoeic words through voice stretching, pitch and volume changes, and sound quality to highlight the body movements in dance. In addition, extending and repeating onomatopoeic words served as resources for synchronized movement among participants in physical activities [6]. Regarding the impact of external environment on dance teaching, Risner et al. utilized the collective knowledge and experience of six experts to provide important insights and key issues regarding the status and marginalization of dance teaching artists. The results indicated that a skilled teaching artist adapted to the constantly changing environmental conditions and its management department. Relevant curriculum plans, goals, and objectives could be developed for each specific student group to meet the needs, but the specific degree of environmental impact was not analyzed [7]. Saumaa discussed the benefits of virtual body dance classes based on the teaching experience of online dance classes during the COVID-19. It effectively translated several key principles of body movement into an online environment, providing support for the sustainable development of online dance courses. However, the study did not specify a specific implementation path [8]. In addition, the potential connections between dance teaching and other socio-economic aspects have also been deeply discussed. Specifically, to unpack the underlying power structures in teaching dance production, Foster combined dance teaching with economic theory. The process of students participating in choreography was restructured into a consumer oriented and service-oriented environment. A dancer-centered approach was examined to suggest where choreography students’ agency, and “best experiences” might occur [9]. Goletti et al. conducted interviews with various dance teachers from different regions, disciplines, institutions, issues, and concepts. During the transition to virtual dance teaching, health, safety, and student diversity issues in online dance education were reflected. In addition, this study broadened the thinking of dance education after the COVID-19 epidemic by exploring the role of technology in dance education. However, the research did not provide a specific path [10].
In addition to dance teaching, intelligent optimization algorithms represented by PSO have been widely applied and optimized in fields such as industrial production, intelligent evaluation, and mechanical manufacturing by continuously updating individual and group extremes to obtain optimal solutions. For example, Juan et al. designed a college English classroom training framework with artificial intelligence based on PSO algorithm. A personalized learning path based on an improved binary PSO algorithm was proposed. It explored unknown spaces through nonlinear addition based on inertial weights. This recommendation method improved the convergence speed and accuracy of the algorithm. However, its widespread applicability has not been effectively verified [11]. Ma et al. designed an effective evaluation method for ideological and political education based on 5G technology. PSO algorithm was used to solve minimization problems. This scheme had good performance in terms of energy consumption and achieved a high-quality experience [12]. Xia et al. combined PSO with Genetic algorithm (GA) to optimize the shifting quality of power shift transmissions, solving the basic PSO algorithms often converging to local optimal solutions. The proposed control strategy ensured that the speed of the active plate was always higher than that of the driven plate in the slipping and wear states of the clutch. Therefore, this control strategy effectively avoided power cycles during gear shifting and improved gear shifting quality, but this method faced relatively complex computational requirements [13]. In the PSO algorithm, Ahmed et al. proposed a new hybrid strategy based on PSO and Bat algorithm (BA) to optimize the performance of image feature extraction. The hybrid PSO-BA, as a pre-enhancement step, selected clearer detail structures in multiple iterations, which was more suitable for the matching stage. Compared with commonly used methods, the accuracy was smaller than other methods [14]. Ma et al. constructed a hybrid PSO algorithm that incorporated GA crossover and mutation operators to optimize a robust scheduling model for hazardous goods vehicles in multiple distribution centers with risk balance. The results indicated that the obtained hazardous material vehicle scheduling scheme minimized the risk value, which had higher stability [15].
Artificial intelligence, represented by neural networks, has been widely applied in the evaluation of TQ. For example, Ou et al. proposed an online education video participation evaluation model based on dynamic graph neural network (DGNN). The model included a spatiotemporal feature extraction layer composed of DGNN, which could effectively extract temporal and spatial features contained in video dynamic graphics data. This model effectively achieved dynamic monitoring of the quality of online educational videos. However, due to memory limitations, not all video data in the dataset were used to construct dynamic images [16]. Yang constructed a university English teaching effectiveness evaluation model based on BPNN and analytic hierarchy process. First, based on analytic hierarchy process and entropy methods, the learning effect is evaluated from both subjective and objective perspectives. Then, a BPNN was used to train the input data until the error value was minimized to the expected result. The evaluation model could be objectively, accurately, and efficiently used to assess the learning effectiveness of blended learning in college English. However, this method has not been applied and analyzed in other teaching subjects [17]. Mo proposed a BPNN model based on an improved whale optimization algorithm to evaluate the quality of higher education management. The experimental results showed that the performance of this method was superior to the most advanced intelligent evaluation methods for educational management performance. It could accurately and effectively evaluate educational management performance [18].
In summary, dance teaching and emerging online dance teaching have both received relatively in-depth research. However, there is no relatively reasonable research on the dance teaching effectiveness evaluation. The existing evaluation methods also lack a unified and standardized set of TQ evaluation standards, focusing on the impact of personalized teaching on student learning outcomes. Therefore, combining the unique advantages of PSO algorithm in data optimization, it is innovatively used to design the dance TQ evaluation method. A quality evaluation model relying on improved particle swarm algorithm on the basis of BPNN evaluation model is constructed. It is expected to conduct an in-depth analysis on the teaching effect of the emerging online dance teaching model to enhance the dance TQ.
3 Construction of an online dance TQ evaluation model based on IPSO-BPNN
With the progress of technology, online dance teaching has become an emerging way. For the TQ that can be achieved by online dance teaching courses, the study constructs a corresponding index evaluation system. Then, a TQ evaluation model for online dance teaching courses based on IPSO-BPNN is constructed.
3.1 Construction of online dance TQ evaluation index
With the continuous popularization of network information technology, dance teaching is no longer limited to traditional classroom teaching. Combining online education and building an interactive dance teaching model between online and offline education has become a new development demand. The online dance teaching course has changed the traditional dance learning mode. Students have more opportunities to have access to higher quality dance teaching as they break the time and geographical restrictions in dance learning [19]. The quality evaluation system of online dance teaching course is to better adapt to the reform and progress of teaching mode in the information age. However, the teaching effect evaluation of this learning mode is not perfect. There are many components of formative and summative evaluation, which can affect the teaching effect [20]. Therefore, the construction of this evaluation quality index needs to follow the principles of orientation, dynamics, and validity to ensure the rationality and objectivity. The study constructs the evaluation index of online dance TQ relying on consulting opinions of relevant online course experts and considering the individual differences and needs of students. The specific index system composition is illustrated in Table 1.
Index system for the quality of online dance teaching
| Primary indicators | Secondary indicators | Order number |
|---|---|---|
| Preparation | Instructional design | 1 |
| Lesson plan | 2 | |
| Classroom teaching implementation | Organizational management | 3 |
| Scenario creation | 4 | |
| Teaching guidance | 5 | |
| Teacher-student interaction | 6 | |
| Evaluation feedback | 7 | |
| Classroom teaching effectiveness | Knowledge mastery | 8 |
| Skill mastery rate | 9 | |
| Theoretical application | 10 | |
| Skill mastery | 11 | |
| Professionalism | 12 | |
| Action and music | 13 | |
| Dance presentation | 14 | |
| Reflection on after-school teaching | Summary after class | 15 |
| Problem reflection | 16 |
The index system consists of 4 primary indicators and 16 secondary indicators together. For the above index system, a questionnaire is developed to score the evaluation indicators. The reliability of the scoring results is analyzed through the Kendall’s harmony coefficient (Kendall W). It is applied to evaluate the correlation degree of multi-level variable indicators, which can be used to test whether expert opinions are consistent. The coefficient is generally between 0 and 1. A higher value indicates a higher consensus of opinions, as shown in Eq. (1).
where
where
3.2 Construction of a quality evaluation model for online dance teaching based on IPSO-BPNN
Based on the above constructed network dance TQ evaluation index system, this study uses BPNN to establish an intelligent evaluation model for online dance TQ. BPNN belongs to multi-layer feed-forward neural network, whose forward propagation signal is sequentially transmitted to the input layer, hidden layer, and output layer. If the output does not match the expected value, the back-propagation is continued [21]. The back-propagation is to pass the error signal obtained in the forward propagation process to the hidden layer in the reverse form. The error criterion function for a single sample
where
Figure 1 illustrates the implementation process based on the BPNN.

Process of BPNN.
However, the dance TQ evaluation model based on BPNN has a major drawback. Its performance heavily depends on the selection of initial parameters. To address this problem, the PSO is applied to optimize BPNN and obtain the best initial parameters to improve the availability and evaluation accuracy of the dance teaching evaluation model [22]. Particle swarm algorithm finds the optimal solution by simulating birds foraging. As a simple and effective population optimization algorithm, it can better optimize various models. Compared with GA and ant colony optimization, the core idea of PSO is more intuitive, and the algorithm steps are relatively simple. Specifically, PSO can maintain a certain degree of diversity during the search process, is less likely to fall into local optima, and has stronger global search capabilities. Therefore, taking PSO as an optimization algorithm can better achieve performance optimization. In the PSO, each individual is a particle, and its initial position and flight direction are in a random state. Figure 2 illustrates the search protocol of the PSO in two-dimensional space.

Schematic diagram of two-dimensional space particle search.
In a
The
The best point of the individual is
where
Based on the above calculation results, the fitness function values of particles are recalculated. The individual extremes and population extremes of particles are updated. If the desired error has been reached or the iteration has reached, the iteration is ended. Otherwise, the new fitness value continues to be calculated. Therefore, the implementation flow of the PSO is illustrated in Figure 3.

PSO algorithm process.
The obtained optimal values are the initial weights and thresholds (WAT) of the BPNN. PSO has a simple structure, which is easy to implement. However, it is difficult to achieve a balanced state between global optimization and local optimization. In addition, it is prone to premature aging. Therefore, the study introduces an improved method to optimize it. On the basis of the standard PSO, the inertia weight of the PSO is improved, and the crossover operator is introduced [23]. In the standard PSO described above, the initial inertia weight is a fixed-value constant, which affects the search range and convergence of the algorithm to some extent. Therefore, a nonlinear decreasing weight change is selected instead of the initial fixed-value, as shown in Eq. (9).
where
where
where
where
where

IPSO-BPNN algorithm process.
4 Performance analysis of online dance teaching quality evaluation model based on IPSO-BPNN
For the TQ of online dance teaching courses, a corresponding TQ evaluation model is constructed. In this section, the performance of this TQ evaluation model is analyzed experimentally. Several other commonly used TQ evaluation models are also compared to verify the effectiveness of IPSO-BPNN model.
4.1 Analysis of online dance TQ evaluation index
The study pre-processes the collected sample data by first handling missing values, deleting missing sample data, and removing abnormal data. For missing data, if the missing data are small, it will be deleted directly. On the contrary, based on the characteristics and sources of the collected data, relevant data should be collected again to fill in the gaps. For abnormal data, the reasons for the occurrence of outliers are analyzed. If the outliers are generated by random factors and have little impact on the analysis, they will be directly deleted. If the abnormal data are generated by other mechanisms and has a direct impact on subsequent analysis, the average value is used to replace the abnormal data. Next data are standardized to eliminate the impact of variable dimensions. Then, methods such as scatter plots are used to analyze the distribution characteristics of the data. Finally, according to the experimental needs, Relevant feature datasets are selected to validate the performance of the model. Students' personal information data are relatively private. Therefore, this study strictly adheres to data protection principles, clearly informs users of the purpose of collecting and using data, and obtains the consent of the research subjects. The research constructs the online dance TQ evaluation index system for analysis, with 4 primary indicators, and 16 secondary indicators to develop the corresponding questionnaire. Relevant students are invited to rate. The processed data are input according to the experimental steps. The weights of the quality evaluation indexes of the online dance teaching course are obtained, as shown in Table 2. The weight value of this online dance TQ evaluation index reflects the importance degree of this index in the whole evaluation system. The highest weight of 0.1 was given to the dance presentation, which showed that the presentation was the key to the overall TQ. In addition, the weight of skill mastery was 0.09. Therefore, to improve the online dance TQ, it is necessary to continuously improve dance learning skills, gain experience in teaching, adopt appropriate teaching methods, improve teaching level, and comprehensively enhance the TQ.
Calculation results of weights for each indicator
| Primary indicators | Secondary indicators | Order number | Weight |
|---|---|---|---|
| Preparation | Instructional design | 1 | 0.05 |
| Lesson plan | 2 | 0.07 | |
| Classroom teaching implementation | Organizational management | 3 | 0.06 |
| Scenario creation | 4 | 0.08 | |
| Teaching guidance | 5 | 0.06 | |
| Teacher–student interaction | 6 | 0.08 | |
| Evaluation feedback | 7 | 0.07 | |
| Classroom teaching effectiveness | Knowledge mastery | 8 | 0.04 |
| Skill mastery rate | 9 | 0.09 | |
| Theoretical application | 10 | 0.05 | |
| Skill mastery | 11 | 0.04 | |
| Professionalism | 12 | 0.06 | |
| Action and music | 13 | 0.05 | |
| Dance presentation | 14 | 0.10 | |
| Reflection on after-school teaching | Summary after class | 15 | 0.05 |
| Problem reflection | 16 | 0.05 |
4.2 Analysis of online dance teaching quality evaluation model based on IPSO-BPNN
To investigate the TQ of online dance teaching courses, the study intends to evaluate the teaching effectiveness of this teaching model. An evaluation model based on IPSO-BPNN is constructed. The evaluation indicators include Error, F1 value, accuracy, and root mean square error (RMSE). Error represents the average square difference between the predicted and actual values. The smaller the indicator, the better the predictive performance of the model. The F1 value, RMSE, and recall of the BPNN are used to comprehensively evaluate the performance of the model. F1 considers both precision and recall, providing a balanced evaluation for these two indicators. When F1 is high, it indicates that the model has achieved a good balance between precision and recall, and the model performance is better. The accuracy of the model represents the proportion of correctly predicted samples to the total number of samples, indicating the model's predictive ability for positive samples. RMSE is the square root of mean square error. The smaller the metric, the better the predictive performance of the model. The experimental data used in the study come from the relevant course statistics of an online dance teaching course in a university. After pre-processing the data, 3,000 data are used for training. The remaining 1,000 data are used for testing the samples. To better validate the performance of the IPSO-BPNN TQ evaluation model, Table 3 illustrates the experimental parameters of the BPNN and PSO models.
Network parameter settings
| Algorithm | BPNN | PSO | |||||||
|---|---|---|---|---|---|---|---|---|---|
| Parameter | Learning rate | Training frequency | Training targets | Weight | Threshold | Activation function | Dimension | Iterations | Inertia weight |
| BPNN | 0.1 | 1,000 | 10−5 | 286 | 19 | Sigmoid function | — | — | — |
| IPSO-BPNN | 0.1 | 1,000 | 10−5 | 286 | 19 | Sigmoid function | 305 | 200 | 0.5 |
To ensure the superiority of BPNN in the TQ evaluation, the study compares the TQ obtained from IPSO-BPNN model and BPNN trained with the actual results. The outcomes are indicated in Figure 5. In Figure 5(a), the linear trend of the training results and the real values were basically the same. There was a high degree of overlap between the training results and the real values. In Figure 5(b), there was a significant error in the training results and the actual results. The overlap of the linear trend was significantly below the BPNN. The same indicators were used to check and evaluate the performance of the model. The maximum positive and negative error of the BPNN were 24.68 and −15.41. The positive and negative cumulative error were 7.16 and −3.78. The maximum positive and negative error of the IPSO-BPNN model were 12.15 and −15.33. The positive and negative cumulative error were 3.14 and −1.62. This indicates that the improved online dance TQ evaluation model has higher accuracy.
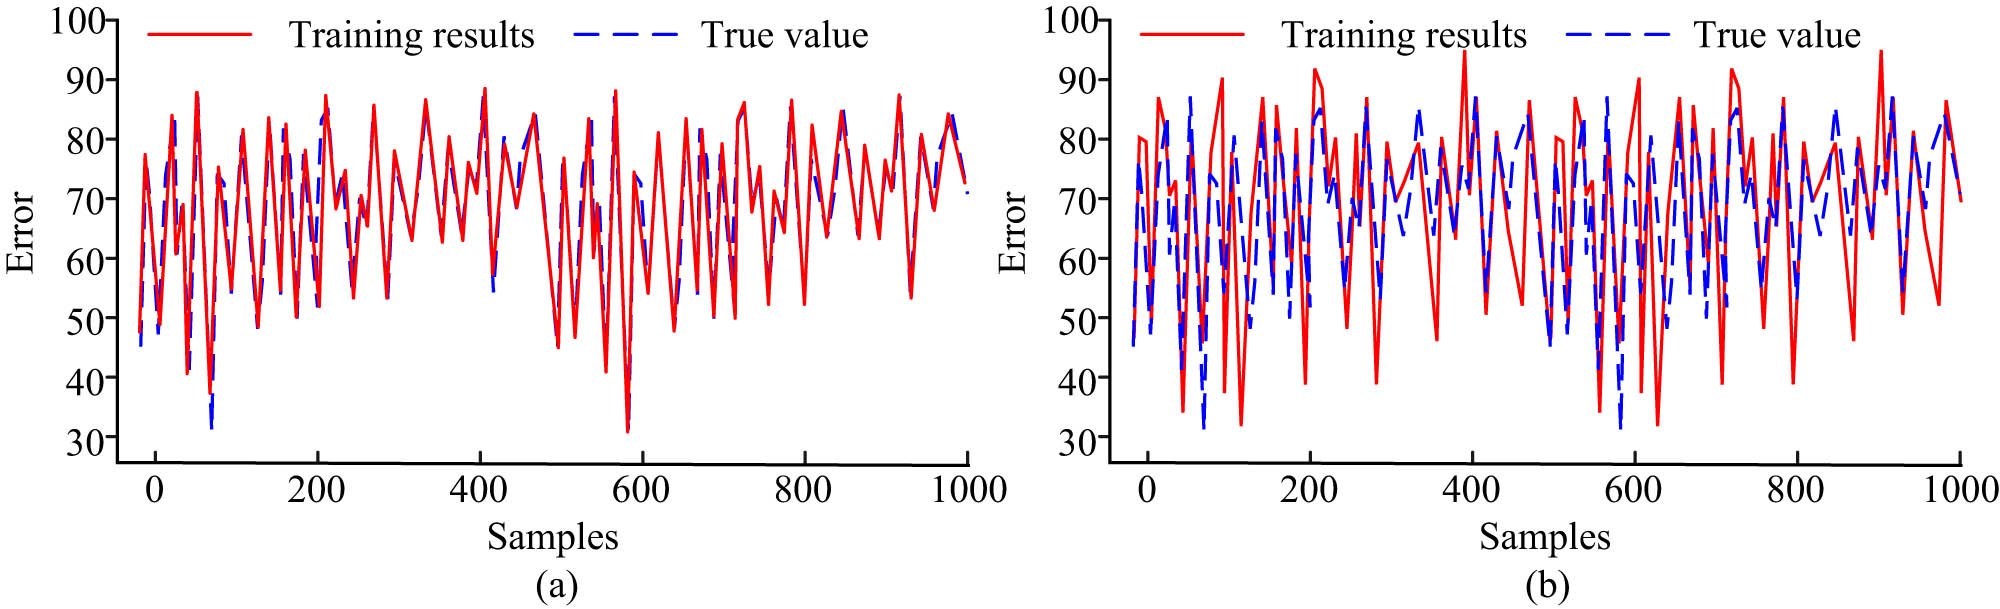
Comparison of training results and actual results between IPSO-BPNN and BPNN. (a) Teaching quality evaluation results based on IPSO-BPNN. (b) Teaching quality evaluation results based on BPNN.
To verify the IPSO-BPNN, the evaluation errors of the method are compared. Figure 6 illustrates the results. A negative error displays that the evaluation results are lower than normal. A positive error value indicates that the evaluation error exceeds normal. From Figure 6, the error of the BPNN online dance TQ evaluation model before improvement was significantly higher than that of the IPSO-BPNN model. In the whole dataset, multiple maximum and minimum values appeared. The error fluctuated greatly, and the maximum error was −0.028. The error of the IPSO-BPNN basically remained at 0.005. There is no significant increase or decrease in the error value, and the overall was relatively stable.

Comparison of evaluation errors between IPSO-BPNN and BPNN.
To further scientifically validate the performance of IPSO-BPNN dance TQ rating model, the study compares the BPNN model before improvement and obtains the precision and F1 training results of different models, as illustrated in Figure 7. From Figure 7, the precision and F1 were the highest, reaching 97.62 and 95.41%, respectively, and the curve fluctuation was small. The precision and F1 of the BPNN model were lower, at 92.06 and 90.53%, respectively, and the curve fluctuation was large. It demonstrates that the performance of the BPNN is unstable. The IPSO-BPNN has higher precision and model performance.

Precision and F1 value results of (a) IPSO-BPNN and (b) BPNN.
For the intelligent evaluation of the data, the commonly used K-means-based optimized Radial basis function (K-RBF)neural network, support vector machine (SVM) model, and GA-based optimized BPNN (GA-BPNN) are compared with IPSO-BPNN model. Figure 8 displays the accuracy on the training and testing sets. In Figure 8(a), on the training set, the accuracy of IPSO-BPNN model was 94.86%. The accuracy of GA-BPNN, K-RBF, and SVM models were 93.67, 93.04, and 92.78%, which were 1.09, 1.82, and 2.08% higher than that of GA-BPNN model and SVM, respectively. In Figure 8(b), on the testing set, the IPSO-BPNN achieved an accuracy of 97.25%, which was 1.56, 1.94, and 2.85% higher than that of the GA-BPNN model and SVM, respectively.

Accuracy comparison of commonly used evaluation models. (a) Training set. (b) Testing set.
To further evaluate the positioning performance of the four methods, the study analyzes the actual application effects based on the TQ evaluation results of dance teaching and training institutions in two different places. This study uses average running time, precision, recall, and F1 score as reference indicators. The results are shown in Table 4. In location A, the average running time, precision, recall, and F1 values of IPSO-BPNN were 2.43s, 92.54, 94.62, and 91.86, respectively. A P-value less than 0.05 indicated that the differences between the models were statistically significant, with a confidence range of 1.98–2.14. In location B, the average running time, precision, recall, and F1 values of IPSO-BPNN were 4.02s, 86.37, 88.35, and 89.64, respectively. The results from this location also showed a P-value less than 0.05, indicating that the differences between the models were statistically significant, with a confidence range of 2.91–3.46. The performance differences between different methods were significant. The proposed method demonstrates better performance optimization.
Indicator test results for four algorithms
| Scenes | Model | Average running time/s | Precision | Recall | F1 | P | Confidence interval (95%) |
|---|---|---|---|---|---|---|---|
| A | K-RBF | 5.26 | 76.99 | 80.82 | 77.86 | 0.001 | 7.35–8.23 |
| SVM | 3.01 | 82.81 | 84.71 | 83.58 | 0.001 | 6.34–7.29 | |
| GA-BPNN | 3.58 | 87.35 | 90.02 | 84.21 | 0.003 | 4.05–4.58 | |
| IPSO-BPNN | 2.43 | 92.54 | 94.62 | 91.86 | 0.002 | 1.98–2.14 | |
| B | K-RBF | 6.07 | 80.21 | 82.74 | 84.89 | 0.001 | 8.25–8.89 |
| SVM | 6.15 | 79.56 | 80.91 | 85.03 | 0.002 | 7.22–7.56 | |
| GA-BPNN | 5.29 | 77.85 | 84.66 | 86.79 | 0.001 | 5.41–6.23 | |
| IPSO-BPNN | 4.02 | 86.37 | 88.35 | 89.64 | 0.001 | 2.91–3.46 |
To further analyze the performance of the proposed method, different datasets are used for analysis. The dataset includes a student practice dataset from a certain training institution, which includes exercise videos and action data in dance courses. It is usually used to evaluate their learning progress and provide teaching suggestions. Dance teaching dataset is a teaching dataset that includes basic skills for Chinese dance from level 1 to level 10, detailing the movements and skills that should be learned at each level. The accuracy of the research method obtained from different datasets is shown in Table 5. According to Table 5, the accuracy of the proposed method in the three datasets was 94.76, 95.21, and 94.38%, respectively. Because there are certain differences in data characteristics among different datasets, there are differences in accuracy between different datasets. However, within the same dataset, the performance of the research method is relatively better.
Comparison of accuracy of the research method in different datasets
| Methods | Online dance teaching courses in a certain university (%) | Student practice dataset from a certain training institution (%) | Dance teaching dataset (%) |
|---|---|---|---|
| K-RBF | 83.65 | 82.17 | 80.74 |
| SVM | 84.02 | 83.77 | 85.62 |
| GA-BPNN | 86.54 | 91.23 | 85.87 |
| IPSO-BONN | 94.76 | 95.21 | 94.38 |
The study uses RMSE and Root Mean Square Logarithmic Error (RMSLE) to measure the online dance TQ evaluation model. A functional evaluation questionnaire is also constructed to investigate the satisfaction of students using the evaluation model. 600 students are randomly invited to rate the model. The comparative analysis and the satisfaction results are illustrated in Figure 9. From Figure 9, in the RMSE comparison, the RMSE value of SVM, GA-BPNN, K-RBF, and IPSO-BPNN was 24.591, 23.106, 22.212, and 20.793. The designed IPSO-BPNN had the lowest RMSE value. In the comparison of RMLSE metrics, the RMSE of SVM, GA-BPNN, K-RBF, and IPSO-BPNN was 0.153, 0.145, 0.142, and 0.122. The designed method had the lowest RMSE value. This shows that the fusion model has higher performance. In terms of satisfaction scores, satisfaction score 1 was 0, satisfaction score 2 was 40, satisfaction score 3 was 100, satisfaction score 4 was 240, and satisfaction score 5 was 220. 76.7% of the students were satisfied with the evaluation model, which showed that most of the students were satisfied with the effectiveness of the model.

Comparative analysis results and satisfaction results. (a) RMSE. (b) RMLSE. (c) Evaluation score.
To further evaluate the real-time performance of the research method, the real-time data processing capabilities of different methods are compared. The results are shown in Figure 10. As shown in the Figure 10, K-RBF, SVM, and GA-BPNN all had high data packet loss rates. The research method showed slight packet loss before 25 frames/s. However, it quickly recovered and stabilized, with a final packet loss rate of 2.3%, significantly better than the compared methods. The research method has stronger real-time data processing performance, which can provide real-time feedback and adjustments during the teaching process.

Real time data processing performance of different methods.
To further verify the long-term impact of this method on academic performance, the comprehensive academic performance of 5 students from a certain university during their freshman to senior years is randomly selected for analysis. 1–8 represent 8 different semesters in 4 years. The vertical axis represents the changes in dance basic abilities of the students in the student ranking (where 1, 2, and 3 were not evaluated using this method, and 4 and 5 were based on the research method), as shown in Figure 11. As shown in Figure 11, the closer the curve is to the bottom, the higher the ranking of students. The rankings of students 4 and 5 have significantly improved over the past 4 years. Students 1, 2, and 3 have fluctuated significantly, and the overall ranking has declined. By analyzing the comprehensive abilities of students, it is possible to clearly and intuitively analyze the changes in their abilities during the long-term learning process, which verifies the long-term effectiveness of the model.

Changes in long-term academic performance of students.
To analyze the performance advantages of the research method more clearly, the performance indicators of this method are summarized, as shown in Table 6. According to Table 6, the performance of the research method was analyzed from multiple indicators and different testing scenarios. The results all showed that the various indicators of the research method exhibited good performance advantages in different scenarios.
Summary of performance indicators of the research method
| Performance metrics | IPSO-BPNN | ||
|---|---|---|---|
| Error | 0.005 | ||
| Precision | Training set | 97.62% | |
| Scene A | 92.54% | ||
| Scene B | 86.37% | ||
| F1 | Training set | 95.41% | |
| Scene A | 91.86% | ||
| Scene B | 89.64% | ||
| Recall | Scene A | 94.62% | |
| Scene B | 88.35% | ||
| Running time | Scene A | 2.43s | |
| Scene B | 4.02s | ||
| Accuracy | Training set | 94.86% | |
| Testing set | 97.25% | ||
| Online dance teaching courses in a certain university | 94.76% | ||
| Student practice dataset from a certain training institution | 95.21% | ||
| Dance teaching dataset | 94.38% | ||
5 Conclusion
The online dance teaching course is a new dance teaching method in recent years, so that dance teaching is no longer limited to a specific time and place. To evaluate the teaching effect of this dance teaching mode, a TQ evaluation index system applicable to online dance teaching was constructed. Based on this index system, an evaluation model for online dance TQ based on the IPSO-BPNN was built. From the findings, the evaluation indexes constructed by the study relatively objectively reflected the influencing factors of online dance TQ. The maximum positive and negative errors of IPSO-BPNN were 12.15 and −15.33, and its positive and negative cumulative errors were 3.14 and −1.62, respectively. The error rate of IPSO-BPNN model remained at 0.005, and the error was relatively stable. On the testing set, the accuracy of IPSO-BPNN reached 97.25%, which was 1.56, 1.94, and 2.85% higher than GA-BPNN model and SVM, respectively. In addition, 76.7% of the students were satisfied with the evaluation model in the satisfaction survey. This indicates that the IPSO-BPNN-based online dance TQ evaluation model can better evaluate the TQ of online dance, meet the actual needs, and has high practical application performance. However, in model training, a small sample size may affect model performance, leading to issues such as overfitting, large bias, and poor generalization ability. Therefore, in future research, to further expand the application performance of the model, the sample data will be further enriched to help the model learn more data features, improve its generalization ability, reduce the overfitting and bias caused by insufficient sample size. Given the effectiveness of this model in dance teaching, future research will further apply it to the quality evaluation of other online teaching, including English oral education, college student career planning education, and other fields.
-
Funding information: Authors state no funding involved.
-
Author contributions: Ben Jin wrote the original draft, participated in literature search and analyses, evaluations, and manuscript preparation, as well as wrote the article, Hanwen Li conceived and designed the manuscript. All authors have accepted responsibility for the entire content of this manuscript and approved its submission.
-
Conflict of interest: Authors state no conflict of interest.
-
Data availability statement: All data generated or analyzed during this study are included in this published article.
References
[1] You YH. Online technologies in dance education (China and worldwide experience). Res Dance Educ. 2022;23(4):396–412.10.1080/14647893.2020.1832979Search in Google Scholar
[2] Moore CC. Dance teaching methods and curriculum design: Comprehensive K-12 dance education (2nd edn). J Dance Educ. 2022;22(4):276–7.10.1080/15290824.2021.1897906Search in Google Scholar
[3] McGreevy NS, Dooling CS. NDEO works: Advancing dance education through the national honor society for dance arts. Dance Educ Pract. 2022;8(3):4–6.10.1080/23734833.2022.2099681Search in Google Scholar
[4] Lawal AI, Kwon S, Kim M, Aladejare AE, Onifade Mo. Prediction of thermal conductivity of granitic rock: an application of arithmetic and salp swarm. Earth Sci Inform. 2022;15(4):2303–17.10.1007/s12145-022-00880-xSearch in Google Scholar
[5] Sellami L, Alaya B. UPSO-FSVRNET: Fuzzy identification approach in a VANET environment based on fuzzy support vector regression and unified. Int J Fuzzy Syst. 2022;25(2):743–62.10.1007/s40815-022-01408-7Search in Google Scholar
[6] Yasui E. Japanese onomatopoeia in bodily demonstrations in a traditional dance instruction: a resource for synchronizing body movements. J Pragmat. 2023;207(2023):45–61.10.1016/j.pragma.2023.02.002Search in Google Scholar
[7] Risner D, Horning S, Henderson SB. Preparation, policy, and workplace challenges of dance teaching artists in P-12 schools: perspectives from the field. Arts Educ Policy Rev. 2023;124(2):113–26.10.1080/10632913.2021.2004959Search in Google Scholar
[8] Saumaa H. The continued value of teaching and practicing somatic dance online. Dance Educ Pract. 2023;9(1):9–15.10.1080/23734833.2022.2123176Search in Google Scholar
[9] Foster SS. A choreographic PACT: Proposing the notion of a “prosumer-dancer” within dance education. J Dance Educ. 2023;23(1):5–17.10.1080/15290824.2020.1851375Search in Google Scholar
[10] Goletti C, Milovanovic D. COVID-19 pandemic and online dance education: Issues, opportunities, and new pedagogies. Dance Educ Pract. 2022;8(4):20–8.10.1080/23734833.2022.2114250Search in Google Scholar
[11] Juan D, Wei YH. Particle swarm optimization neural network for research on artificial intelligence college English classroom teaching framework. J Intell Fuzzy Syst: Appl Eng Technol. 2021;40(2):3655–67.10.3233/JIFS-189400Search in Google Scholar
[12] Ma R, Chen X. Intelligent education evaluation mechanism on ideology and politics with 5G: PSO-driven edge computing approach. Wirel Netw. 2022;29(2):685–96.10.1007/s11276-022-03155-xSearch in Google Scholar
[13] Xia G, Chen J, Tang X, Zhao L, Sun B. Shift quality optimization control of power shift transmission based on particle swarm optimization–genetic algorithm. Proc Inst Mech Eng Part D: J Automob Eng. 2022;236(5):872–92.10.1177/09544070211031132Search in Google Scholar
[14] Ahmed LA, Noor Hasan H, Layla A, Mahdi E, Hazim NA, Sura KA. Features extraction of fingerprints based on hybrid particle swarm optimization and bat algorithms. Eastern-Eur J Enterp Technol. 2022;5(2):55–61.10.15587/1729-4061.2022.266259Search in Google Scholar
[15] Ma CX, Liu PF, Xu XC. Vehicles robust scheduling of hazardous materials based on hybrid particle swarm optimisation and genetic algorithm. IET Intell Transp Syst. 2020;14(14):1955–66.10.1049/iet-its.2020.0289Search in Google Scholar
[16] Ou X, Chen Y, Shi ZJ. Online educational video engagement prediction based on dynamic graph neural networks. Int J Web Inf Syst. 2023;19(5/6):190–207.10.1108/IJWIS-05-2023-0083Search in Google Scholar
[17] Yang Y. Research on blended teaching evaluation model of college English based on entropy method and BP neural network. Open Access Library J. 2024;11(6):1–9.10.4236/oalib.1111670Search in Google Scholar
[18] Mo X. Performance evaluation of higher education management under the background of knowledge management. Int J Web Eng Technol. 2024;19(1):88–105.10.1504/IJWET.2024.138120Search in Google Scholar
[19] Kouhalvandi L, Matekovits L. Combinational of surrogate modeling and particle swarm optimization for improving the electromagnetic. Signal Image Video Process. 2022;17(4):1615–20.10.1007/s11760-022-02371-4Search in Google Scholar
[20] Wan Y, Wu J, Chu R, Miao ZY, Fan L, Bai L, et al. Prediction of BP neural network and preliminary application for suppression of low temperature oxidation of coal stockpiles by pulverized coal covering. Can J Chem Eng. 2020;98(12):2587–98.10.1002/cjce.23860Search in Google Scholar
[21] Song S, Xiong X, Wu X, Xue Z. Modeling the SOFC by BP neural network algorithm. Int J Hydrog Energy. 2021;46(38):20065–77.10.1016/j.ijhydene.2021.03.132Search in Google Scholar
[22] Wang JB, Zeng LL, Yang K. Multi-objective optimization of printed circuit heat exchanger with airfoil fins based on the improved PSO-BP neural network and the NSGA-II algorithm. Nucl Eng Technol. 2023;55(6):2125–38.10.1016/j.net.2023.02.029Search in Google Scholar
[23] Zan J. Research on robot path perception and optimization technology based on whale optimization algorithm. J Comput Cognit Eng. 2022;1(4):201–8.10.47852/bonviewJCCE597820205514Search in Google Scholar
© 2025 the author(s), published by De Gruyter
This work is licensed under the Creative Commons Attribution 4.0 International License.
Articles in the same Issue
- Research Articles
- Generalized (ψ,φ)-contraction to investigate Volterra integral inclusions and fractal fractional PDEs in super-metric space with numerical experiments
- Solitons in ultrasound imaging: Exploring applications and enhancements via the Westervelt equation
- Stochastic improved Simpson for solving nonlinear fractional-order systems using product integration rules
- Exploring dynamical features like bifurcation assessment, sensitivity visualization, and solitary wave solutions of the integrable Akbota equation
- Research on surface defect detection method and optimization of paper-plastic composite bag based on improved combined segmentation algorithm
- Impact the sulphur content in Iraqi crude oil on the mechanical properties and corrosion behaviour of carbon steel in various types of API 5L pipelines and ASTM 106 grade B
- Unravelling quiescent optical solitons: An exploration of the complex Ginzburg–Landau equation with nonlinear chromatic dispersion and self-phase modulation
- Perturbation-iteration approach for fractional-order logistic differential equations
- Variational formulations for the Euler and Navier–Stokes systems in fluid mechanics and related models
- Rotor response to unbalanced load and system performance considering variable bearing profile
- DeepFowl: Disease prediction from chicken excreta images using deep learning
- Channel flow of Ellis fluid due to cilia motion
- A case study of fractional-order varicella virus model to nonlinear dynamics strategy for control and prevalence
- Multi-point estimation weldment recognition and estimation of pose with data-driven robotics design
- Analysis of Hall current and nonuniform heating effects on magneto-convection between vertically aligned plates under the influence of electric and magnetic fields
- A comparative study on residual power series method and differential transform method through the time-fractional telegraph equation
- Insights from the nonlinear Schrödinger–Hirota equation with chromatic dispersion: Dynamics in fiber–optic communication
- Mathematical analysis of Jeffrey ferrofluid on stretching surface with the Darcy–Forchheimer model
- Exploring the interaction between lump, stripe and double-stripe, and periodic wave solutions of the Konopelchenko–Dubrovsky–Kaup–Kupershmidt system
- Computational investigation of tuberculosis and HIV/AIDS co-infection in fuzzy environment
- Signature verification by geometry and image processing
- Theoretical and numerical approach for quantifying sensitivity to system parameters of nonlinear systems
- Chaotic behaviors, stability, and solitary wave propagations of M-fractional LWE equation in magneto-electro-elastic circular rod
- Dynamic analysis and optimization of syphilis spread: Simulations, integrating treatment and public health interventions
- Visco-thermoelastic rectangular plate under uniform loading: A study of deflection
- Threshold dynamics and optimal control of an epidemiological smoking model
- Numerical computational model for an unsteady hybrid nanofluid flow in a porous medium past an MHD rotating sheet
- Regression prediction model of fabric brightness based on light and shadow reconstruction of layered images
- Dynamics and prevention of gemini virus infection in red chili crops studied with generalized fractional operator: Analysis and modeling
- Qualitative analysis on existence and stability of nonlinear fractional dynamic equations on time scales
- Fractional-order super-twisting sliding mode active disturbance rejection control for electro-hydraulic position servo systems
- Analytical exploration and parametric insights into optical solitons in magneto-optic waveguides: Advances in nonlinear dynamics for applied sciences
- Bifurcation dynamics and optical soliton structures in the nonlinear Schrödinger–Bopp–Podolsky system
- User profiling in university libraries by combining multi-perspective clustering algorithm and reader behavior analysis
- Exploring bifurcation and chaos control in a discrete-time Lotka–Volterra model framework for COVID-19 modeling
- Review Article
- Haar wavelet collocation method for existence and numerical solutions of fourth-order integro-differential equations with bounded coefficients
- Special Issue: Nonlinear Analysis and Design of Communication Networks for IoT Applications - Part II
- Silicon-based all-optical wavelength converter for on-chip optical interconnection
- Research on a path-tracking control system of unmanned rollers based on an optimization algorithm and real-time feedback
- Analysis of the sports action recognition model based on the LSTM recurrent neural network
- Industrial robot trajectory error compensation based on enhanced transfer convolutional neural networks
- Research on IoT network performance prediction model of power grid warehouse based on nonlinear GA-BP neural network
- Interactive recommendation of social network communication between cities based on GNN and user preferences
- Application of improved P-BEM in time varying channel prediction in 5G high-speed mobile communication system
- Construction of a BIM smart building collaborative design model combining the Internet of Things
- Optimizing malicious website prediction: An advanced XGBoost-based machine learning model
- Economic operation analysis of the power grid combining communication network and distributed optimization algorithm
- Sports video temporal action detection technology based on an improved MSST algorithm
- Internet of things data security and privacy protection based on improved federated learning
- Enterprise power emission reduction technology based on the LSTM–SVM model
- Construction of multi-style face models based on artistic image generation algorithms
- Research and application of interactive digital twin monitoring system for photovoltaic power station based on global perception
- Special Issue: Decision and Control in Nonlinear Systems - Part II
- Animation video frame prediction based on ConvGRU fine-grained synthesis flow
- Application of GGNN inference propagation model for martial art intensity evaluation
- Benefit evaluation of building energy-saving renovation projects based on BWM weighting method
- Deep neural network application in real-time economic dispatch and frequency control of microgrids
- Real-time force/position control of soft growing robots: A data-driven model predictive approach
- Mechanical product design and manufacturing system based on CNN and server optimization algorithm
- Application of finite element analysis in the formal analysis of ancient architectural plaque section
- Research on territorial spatial planning based on data mining and geographic information visualization
- Fault diagnosis of agricultural sprinkler irrigation machinery equipment based on machine vision
- Closure technology of large span steel truss arch bridge with temporarily fixed edge supports
- Intelligent accounting question-answering robot based on a large language model and knowledge graph
- Analysis of manufacturing and retailer blockchain decision based on resource recyclability
- Flexible manufacturing workshop mechanical processing and product scheduling algorithm based on MES
- Exploration of indoor environment perception and design model based on virtual reality technology
- Tennis automatic ball-picking robot based on image object detection and positioning technology
- A new CNN deep learning model for computer-intelligent color matching
- Design of AR-based general computer technology experiment demonstration platform
- Indoor environment monitoring method based on the fusion of audio recognition and video patrol features
- Health condition prediction method of the computer numerical control machine tool parts by ensembling digital twins and improved LSTM networks
- Establishment of a green degree evaluation model for wall materials based on lifecycle
- Quantitative evaluation of college music teaching pronunciation based on nonlinear feature extraction
- Multi-index nonlinear robust virtual synchronous generator control method for microgrid inverters
- Manufacturing engineering production line scheduling management technology integrating availability constraints and heuristic rules
- Analysis of digital intelligent financial audit system based on improved BiLSTM neural network
- Attention community discovery model applied to complex network information analysis
- A neural collaborative filtering recommendation algorithm based on attention mechanism and contrastive learning
- Rehabilitation training method for motor dysfunction based on video stream matching
- Research on façade design for cold-region buildings based on artificial neural networks and parametric modeling techniques
- Intelligent implementation of muscle strain identification algorithm in Mi health exercise induced waist muscle strain
- Optimization design of urban rainwater and flood drainage system based on SWMM
- Improved GA for construction progress and cost management in construction projects
- Evaluation and prediction of SVM parameters in engineering cost based on random forest hybrid optimization
- Museum intelligent warning system based on wireless data module
- Optimization design and research of mechatronics based on torque motor control algorithm
- Special Issue: Nonlinear Engineering’s significance in Materials Science
- Experimental research on the degradation of chemical industrial wastewater by combined hydrodynamic cavitation based on nonlinear dynamic model
- Study on low-cycle fatigue life of nickel-based superalloy GH4586 at various temperatures
- Some results of solutions to neutral stochastic functional operator-differential equations
- Ultrasonic cavitation did not occur in high-pressure CO2 liquid
- Research on the performance of a novel type of cemented filler material for coal mine opening and filling
- Testing of recycled fine aggregate concrete’s mechanical properties using recycled fine aggregate concrete and research on technology for highway construction
- A modified fuzzy TOPSIS approach for the condition assessment of existing bridges
- Nonlinear structural and vibration analysis of straddle monorail pantograph under random excitations
- Achieving high efficiency and stability in blue OLEDs: Role of wide-gap hosts and emitter interactions
- Construction of teaching quality evaluation model of online dance teaching course based on improved PSO-BPNN
- Enhanced electrical conductivity and electromagnetic shielding properties of multi-component polymer/graphite nanocomposites prepared by solid-state shear milling
- Optimization of thermal characteristics of buried composite phase-change energy storage walls based on nonlinear engineering methods
- A higher-performance big data-based movie recommendation system
- Nonlinear impact of minimum wage on labor employment in China
- Nonlinear comprehensive evaluation method based on information entropy and discrimination optimization
- Application of numerical calculation methods in stability analysis of pile foundation under complex foundation conditions
- Research on the contribution of shale gas development and utilization in Sichuan Province to carbon peak based on the PSA process
- Characteristics of tight oil reservoirs and their impact on seepage flow from a nonlinear engineering perspective
- Nonlinear deformation decomposition and mode identification of plane structures via orthogonal theory
- Numerical simulation of damage mechanism in rock with cracks impacted by self-excited pulsed jet based on SPH-FEM coupling method: The perspective of nonlinear engineering and materials science
- Cross-scale modeling and collaborative optimization of ethanol-catalyzed coupling to produce C4 olefins: Nonlinear modeling and collaborative optimization strategies
- Unequal width T-node stress concentration factor analysis of stiffened rectangular steel pipe concrete
- Special Issue: Advances in Nonlinear Dynamics and Control
- Development of a cognitive blood glucose–insulin control strategy design for a nonlinear diabetic patient model
- Big data-based optimized model of building design in the context of rural revitalization
- Multi-UAV assisted air-to-ground data collection for ground sensors with unknown positions
- Design of urban and rural elderly care public areas integrating person-environment fit theory
- Application of lossless signal transmission technology in piano timbre recognition
- Application of improved GA in optimizing rural tourism routes
- Architectural animation generation system based on AL-GAN algorithm
- Advanced sentiment analysis in online shopping: Implementing LSTM models analyzing E-commerce user sentiments
- Intelligent recommendation algorithm for piano tracks based on the CNN model
- Visualization of large-scale user association feature data based on a nonlinear dimensionality reduction method
- Low-carbon economic optimization of microgrid clusters based on an energy interaction operation strategy
- Optimization effect of video data extraction and search based on Faster-RCNN hybrid model on intelligent information systems
- Construction of image segmentation system combining TC and swarm intelligence algorithm
- Particle swarm optimization and fuzzy C-means clustering algorithm for the adhesive layer defect detection
- Optimization of student learning status by instructional intervention decision-making techniques incorporating reinforcement learning
- Fuzzy model-based stabilization control and state estimation of nonlinear systems
- Optimization of distribution network scheduling based on BA and photovoltaic uncertainty
- Tai Chi movement segmentation and recognition on the grounds of multi-sensor data fusion and the DBSCAN algorithm
- Special Issue: Dynamic Engineering and Control Methods for the Nonlinear Systems - Part III
- Generalized numerical RKM method for solving sixth-order fractional partial differential equations