Interactive recommendation of social network communication between cities based on GNN and user preferences
-
Yanbo Gao
 und
Lin Zhang
und
Lin Zhang

Abstract
To further enhance the effectiveness of interactive recommendation for intercity social network communication, the study proposes a novel interactive recommendation model for intercity social network communication. This model focuses on point-of-interest preference migration and recommendation modeling by integrating the self-attention mechanism, cross-attention mechanism, and graph neural network. The method effectively solves the problem of cross-city users’ interest point preference change and constructs a recommendation framework based on interest point heat. The experimental results showed that the recommendation accuracy of the new model was up to 93.52%. Compared with the existing more advanced recommendation methods, the recommendation coverage of Chengdu–Chongqing dining and food points of interest could be up to 96.72%. The recommendation coverage of Shanghai–Beijing business and residential and science, education, and culture points of interest could be up to 95.17%, and the maximum time reduction was 2.07 s. The contribution of this study is the introduction of a novel graph attention mechanism, which improves the accuracy and stability of recommendations. This provides an effective technical solution for intercity social network communication recommendations.
1 Introduction
Users from different cities share information and exchange opinions through social networking platforms. This cross-regional interaction not only affects individuals’ lifestyles but also has a profound impact on the economic and cultural development of cities [1]. However, due to the diversity of user needs and the complexity of social relationships, how to effectively promote interactive recommendations through social networks between cities has become a hot research topic. Point of interest (POI) recommendation, as an important means to enhance user experience and social interaction, has gradually attracted the attention of researchers [2]. Jin et al. proposed a learning framework based on context-aware region similarity to measure POI similarity between regions in different spatial and application contexts. This framework could significantly enhance the popularity of social communication between cities [3]. Liu et al. proposed a cross-city disease-dependent POI recommendation model to enhance the effectiveness of residents’ health POI communication. The recommendation accuracy of this model could reach up to 92.73%, and it was very popular [4]. Liu et al. found that it is difficult for people to effectively find the best route from one place to another through public transportation systems. To this end, the team proposed a traffic POI recommendation model that balances time and distance costs. The recommendation recall rate of this model could reach 91.23%, which far exceeded the performance of traditional models [5]. Dai et al. proposed a scientific social POI recommendation system to promote the development of intercity scientific, social networks by combining data from intercity knowledge network platforms and deep learning algorithms. The average accuracy of the system in POI recommendation tests for knowledge networks between eight cities, including Chengdu and Chongqing, Guiyang, and Hunan, was close to 92.38%, and the data stability was strong [6]. Heydariyan et al. proposed a hybrid optimization method combining the Sticky Mushroom Algorithm and the sine cosine algorithm (SCA) for the problem of overlapping community detection in social networks. The algorithm significantly improved the accuracy and convergence speed of community detection by combining the advantages of both methods and especially showed high effectiveness when dealing with complex social network structures [7]. Sheykhzadeh et al. proposed a node-ranking-based local community detection method, which achieves community detection without global network information by ranking nodes in terms of their local importance. The method demonstrated high efficiency and scalability when dealing with large-scale social networks and was suitable for scenarios that require fast community localization [8]. Aghdam et al. proposed a new opinion leader selection method by combining the African vulture optimization algorithm with the Hunger Games search algorithm. This hybrid algorithm showed higher accuracy and computational efficiency in the task of influencer identification in social networks and was suitable for areas such as marketing and information dissemination [9].
Graph neural network (GNN), an advanced algorithm capable of processing unstructured data, especially social network graph structures, has gradually become a research focus [10]. Liu et al. proposed an interactive tourism POI recommendation model in combination with GNN to improve the accuracy of cross-city tourism user preference recommendations. Compared to traditional models, this model could output more effective recommendation results [11]. Wang et al. believed that most existing models only focused on exploring local spatiotemporal relationships between POIs based on the current user’s trajectory sequence. Therefore, after combining the GNN algorithm, a user-intelligent POI recommendation model with global perspective capture was proposed. The POI recommendation task completion rate of this model on real datasets could approach 95% [12]. Liu et al. believed that existing research has overlooked the high-order collaborative effects between users and POIs, resulting in unsatisfactory recommendation results. To this end, they integrated GNN into POI recommendation and ultimately proposed a personalized POI recommendation model. The recommendation accuracy, recall rate, and normalized cumulative gain of this model were superior to existing models [13]. Qin et al. believed that there was still a problem of incomplete geographic information in POI recommendations in the existing social network interaction recommendations between cities. To this end, a novel recommendation model was proposed by integrating GNN and geographically constrained sampling strategies. The recall rate of this model has increased by 3.92%, and the hit rate has increased by 2.53% compared to advanced models [14]. A comparison of these various literature methods is shown in Table 1.
Results of the comparison of methods across the literature
| Literature | Method | Advantages | Disadvantages |
|---|---|---|---|
| Jin et al. [3] | Context-aware region similarity learning framework | Improved intercity social propagation and POI similarity | Lacks optimization for cross-city user interest migration |
| Liu et al. [4] | Cross-city disease-dependent POI recommendation model | Enhanced recommendation accuracy and effectiveness in health POI communication | Limited to a specific domain (health), lacks broad applicability |
| Liu et al. [5] | POI recommendation model based on time and distance costs | Significantly optimized route recommendations in public transport | Does not account for personalized user needs, lacks dynamic recommendations |
| Dai et al. [6] | Deep learning-based scientific, social POI recommendation system | Improved accuracy in knowledge network social POI recommendations | Primarily focused on academic domains, limited applicability to other areas |
| Heydariyan et al. [7] | Hybrid slime mold algorithm and SCA for community detection | Enhanced precision and convergence speed in social network community detection | Efficiency may drop in large-scale, complex networks |
| Sheykhzadeh et al. [8] | Local community detection based on node ranking | Does not require global network information, suitable for large-scale networks | Limited detection capability in complex network structures |
| Aghdam et al. [9] | African Vultures Optimization and Hunger Games Search algorithm hybrid for opinion leader selection | Improved accuracy and computational efficiency in identifying opinion leaders | Mainly used for opinion leader selection, limited application scenarios |
| Liu et al. [11] | GNN-based interactive POI recommendation model for tourism | More accurate recommendations suited for cross-city tourism users | Lacks consideration of dynamic changes in user interests |
| Wang et al. [12] | Global perspective user POI recommendation model | Captured global spatiotemporal relationships, improved recommendation accuracy | High model complexity requires significant computational resources |
| Liu et al. [13] | GNN-integrated personalized POI recommendation model | Enhanced high-level user-POI collaboration effects, improved personalized recommendation accuracy | Lacks handling of cross-city user interest migration |
| Qin et al. [14] | GNN with the geographic constraint sampling strategy | Improved geographic information completeness in POI recommendation | Needs further optimization for adaptability in highly dynamic environments |
In summary, although existing research has made some progress, such as improving user experience and social interaction effects through POI recommendation technology, these studies still face issues such as low recommendation accuracy and significant environmental interference when dealing with user POI preference migration and social relationships between different cities. To this end, this study innovatively integrates the self-attention (SA) mechanism, cross-attention (CA) mechanism, and a special graph attention network (GAT) from GNN, proposing a novel recommendation model. The contribution of the research lies in the introduction of SA and CA mechanisms to solve the problem of cross-city user preference migration for POI. Then, a GAT-based POI heat modeling method is proposed to improve the accuracy and stability of the recommendation. This modeling provides a new technical idea for intercity social network dissemination recommendations. It aims to effectively improve the technical level of existing POI recommendations and provide a new approach for future social network dissemination and interactive recommendations.
2 Materials and methods
To improve the efficiency of social network communication and interactive recommendations between cities, this study focuses on user POI as the main direction. First, by introducing CA and SA mechanisms separately to characterize the POI feature vectors of users in the source city and target city, a POI migration method is proposed through fusion, concatenation, and dimensionality reduction. Then, based on this migration method, this study considers the issue of the popularity of the target POI and combines the feature aggregation method of GAT in GNN to screen out the recommendation results with the highest popularity and influence and high similarity to the interests of the source city. Finally, a new type of interactive POI recommendation model for intercity user social network dissemination is proposed.
2.1 Cross-city POI migration modeling considering user preferences
POI refers to places or locations that users may be interested in within a specific geographic location, such as restaurants, attractions, and shopping centers. In practical urban applications, users usually have stable POI preferences, but when they move between different cities, these POIs may undergo significant changes, known as the POI migration phenomenon. This dynamic change makes it difficult for traditional recommendation models to maintain the accuracy and relevance of recommendations [15,16]. To obtain the importance of each POI, the SA mechanism is introduced for weight allocation. Compared to other methods, the SA mechanism can reduce reliance on external information, thereby enhancing the capture of internal correlations in data [17]. The SA mechanism calculation of POIs within the user’s city is shown in Figure 1.

SA mechanism calculation for POI within a user’s city.
In Figure 1, first, the user’s historical behavior and geographic location data are input into the input layer. Second, in the SA mechanism layer, the model processes the input data through the SA mechanism, identifies users’ potential preferences for different POIs, and calculates relevant weights. Then, this information is transformed into feature vectors in the feature vector representation layer, representing the user’s level of interest in different POIs within the current city and, finally, the output. The feature vector representation of the new POI, the weight coefficients of the SA mechanism, and the fused feature representation of multiple POIs are shown in the following equation:
where
where
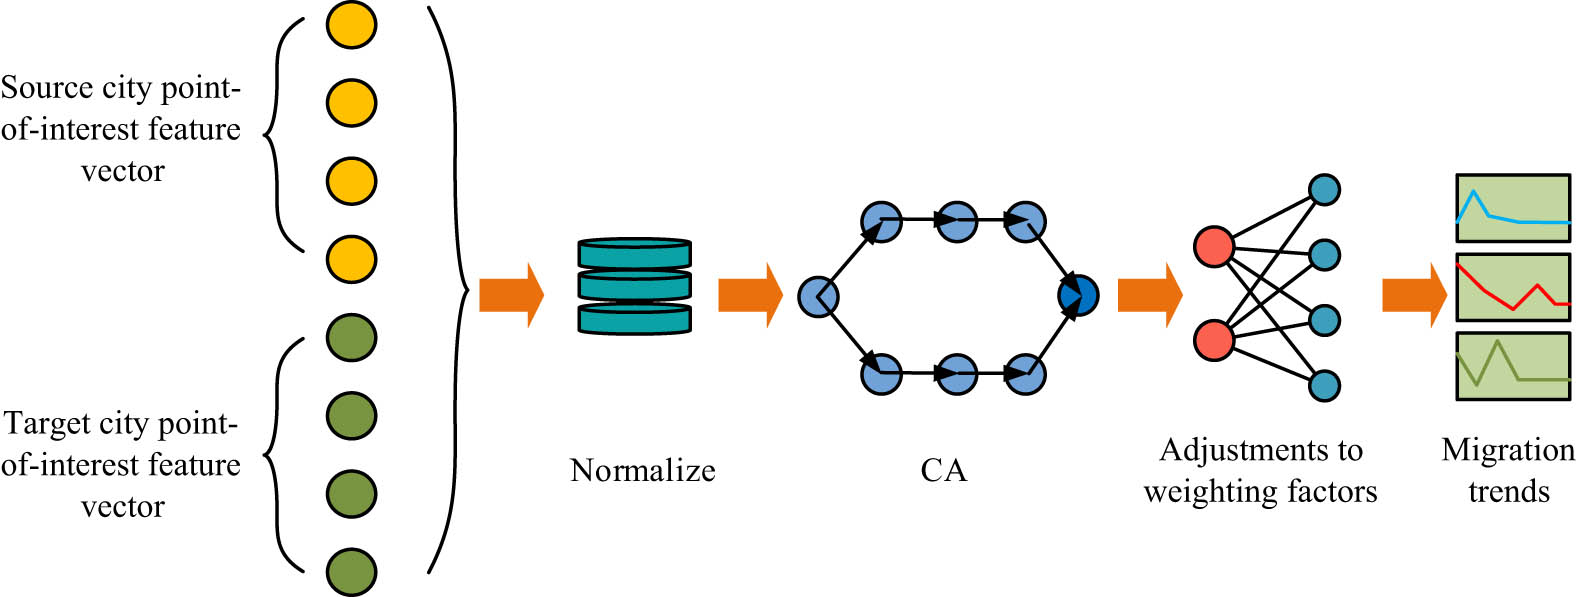
Calculation of the CA mechanism for the user’s intercity POI.
In Figure 2, first, the POI data feature vector of the user in the source city is normalized together with the similar POI data feature vector of the user in the target city as input. The interest preference matching degree is generated by calculating the CA mechanism, and the POI migration trend of users in the target city is captured by adjusting the weighting coefficients. Finally, by summing and pooling multiple POI information, a more comprehensive recommendation feature vector is generated. The POI similarity normalization between the source city and the target city for users is shown in the following equation:
where
where

The migration process of user preference POI.
In Figure 3, the entire migration fusion process is divided into two channels. First, users input POI information data in both the source and target cities. Second, the SA mechanism is used to perform dimensionality reduction and embedding representation on the POI data of users in the source and target cities, and the feature vectors of POIs are obtained separately. Afterward, the CA mechanism fuses the two types of feature vectors to obtain the final cross-city POI vector, as shown in the following equation:
where
where
2.2 Construction of an interactive POI recommendation model between cities based on GNN
After constructing the inter-city user POI preference migration model, it was found that if POI, such as tourism, medical treatment, employment, and education, are used as the main targets, these users often tend to prefer locations with higher popularity [20]. Traditional methods rely solely on the strength of the POI correlation between two locations for recommendation, which cannot meet user needs with high standards. Therefore, this study uses popularity as a POI selection label and introduces GNN to model the network topology of POI popularity features and geographic locations in the target city. GAT, as a specific model in GNN, introduces an attention mechanism to optimize spatially based GNN [21,22]. GAT overcomes some limitations of traditional GNN, enabling the model to better understand and process node relationships in graph data. The GAT structure diagram is shown in Figure 4 [23].
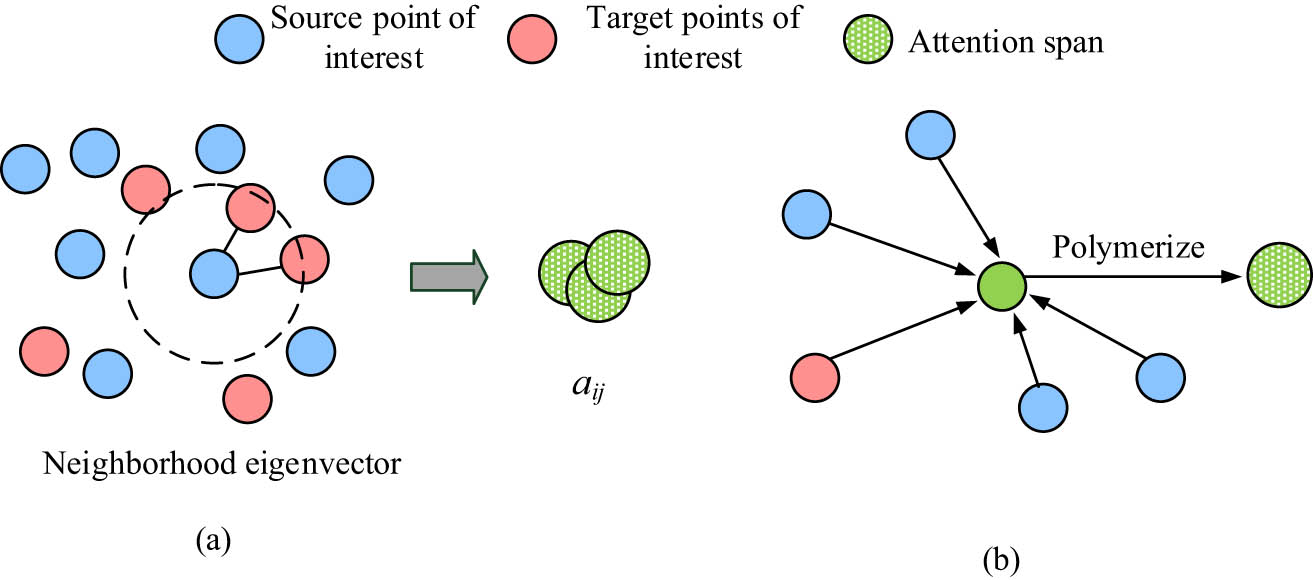
Schematic diagram of the GAT structure.
Figure 4(a) shows the calculation process of the attention coefficient, and Figure 4(b) shows the node state update process. By weighting the feature vector
where
where
where

The topological framework of the heat level of the POI in the target city.
In Figure 5, first, in the embedding layer, the attribute data of POI are embedded as feature vectors. Next, these feature vectors represent the relationship structure between POIs by constructing a POI map. The graph attention layer uses GAT to process nodes in the POI graph and obtain aggregated information about neighboring nodes. Finally, in the POI graph aggregation layer, the processed POI graph is aggregated to form the final POI heat topology structure. The heat aggregation feature representation of POI by GAT is shown in the following equation:
where
where
where
where
where
In summary, this study proposes a novel intercity social network communication interactive POI recommendation model by combining user preference POI migration and user target city POI popularity aggregation. The structure of the model is shown in Figure 6.

Novel intercity social network communication interaction POI recommendation model structure.
In Figure 6, the model can be divided into three main modules: user preference transfer module, recommendation prediction module, and data filtering module. First, user characteristics are input and processed by the SA mechanism to generate a spatiotemporal feature representation of the user in the source city. Then, the CA mechanism is used to capture the cross-city migration of user characteristics by combining their activity data in different cities. Second, these data are fused and concatenated, and the dimensionality is reduced to construct a POI matrix for the user’s target city. Then, the target POI matrix with the greatest influence is selected through the calculation of POI popularity and feature aggregation in the target city. Finally, the best POI recommendation is obtained by matching based on the similarity of POIs with the source city.
3 Results
This study established a suitable experimental environment, set experimental parameters and datasets, tested the optimal values of the loss function and attention weight coefficients of the new model, and compared the preference transfer and recommendation accuracy of similar models. In addition, the comparison of recommendation coverage, recommendation classification, and recommendation time was conducted using seven POIs from two real cities to verify the true effectiveness of the research model.
3.1 Performance testing of urban POI interactive recommendation model
The experimental setup has an Intel Core 2.5 Hz dual-core CPU and 16 GB of memory. The GPU is NVIDIA GeForce RTX 1660, the programming language is Python 3.7.15, and the deep learning framework is Python 1.3.2. The size of the model embedding layer is 128. The optimizer uses the classic Adam algorithm with a learning rate set to 0.001. The Yelp dataset contains information on user reviews and ratings of local merchants (e.g., restaurants and stores). This dataset is suitable for testing POI recommender systems based on user feedback. The dataset covers a wide range of types of merchants and their user ratings. The Brightkite dataset is user check-in data from the Brightkite social network. It records the time, geographic coordinates, and location names of users checking in at different geographical locations. This dataset is mainly used for evaluating cross-city POI recommendations and is particularly suitable for analyzing users’ behavioral patterns across different cities. This study first attempts to determine the transfer loss function in POI preference transfer and the values of attention weight coefficients in the recommendation model to maintain the efficient state of the subsequent model for testing. The result is shown in Figure 7.
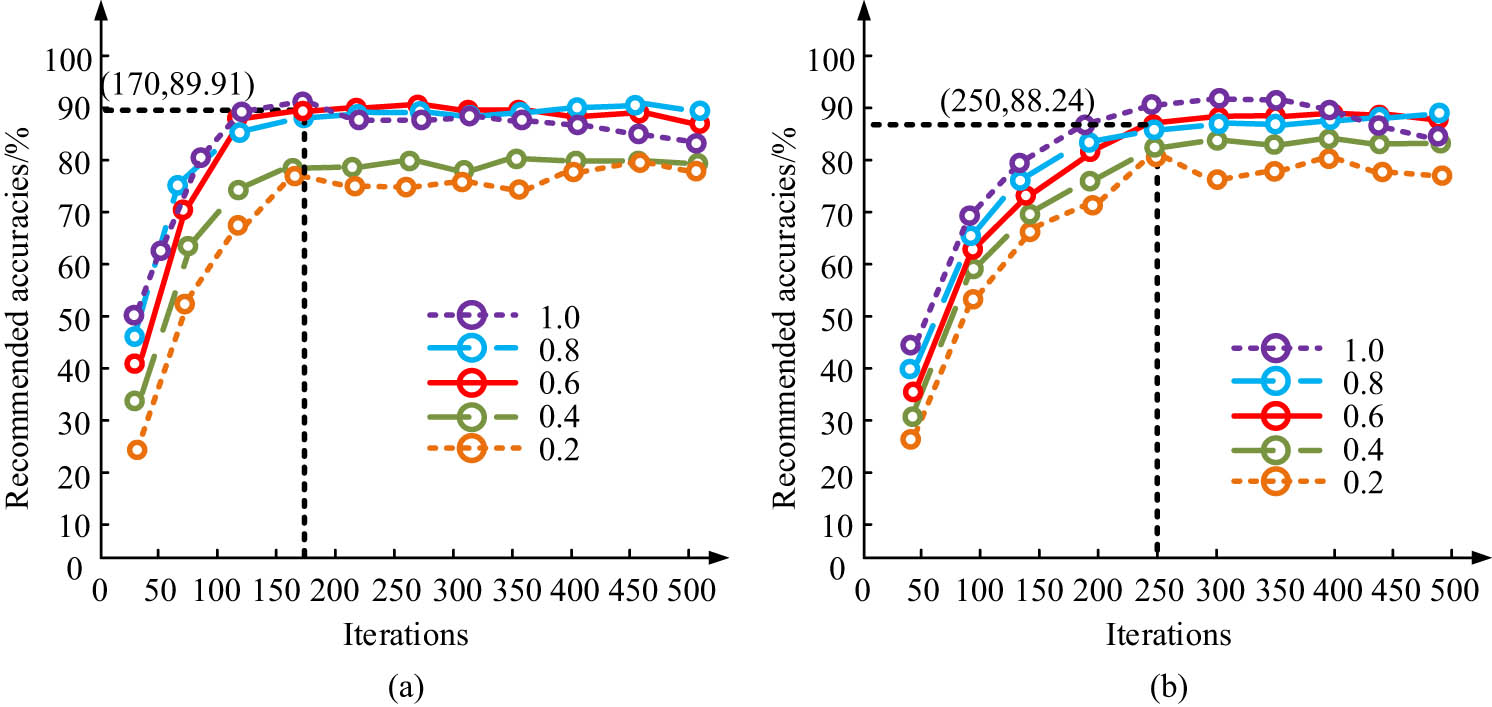
Transfer Loss function and attention weighting coefficient test results. (a) Transfer loss function and (b) attention weighting coefficient.
Figure 7(a) and (b) shows the test results of the transfer loss function values and attention weight coefficients. In Figure 7(a), although the recommendation accuracy is the highest when transfer loss is 1.0, there is a slight decrease in model performance in the later stage. When the transfer loss value is 0.6, the model’s recommendation accuracy data are more stable, with a maximum recommendation accuracy of 89.91% and 170 iterations. In Figure 7(b), when the attention weight coefficient is set to 1.0, the highest recommendation accuracy of the model is 88.24% after 250 iterations. Therefore, the transfer loss parameter is found to take the value of 0.6 after many experiments to achieve the best balance between recommendation accuracy and stability. This value can achieve a better balance between keeping the model’s high accuracy and stability. Meanwhile, the attention weight coefficient is set to 1.0 to ensure the optimal performance of the model in capturing user interest points and feature fusion. These parameters are chosen not only to improve the recommendation accuracy of the model but also to ensure the model’s adaptability in different datasets and environments. Deviation from these optimal values can lead to a significant decrease in recommendation accuracy, especially in terms of recommendation coverage and convergence speed. Therefore, the impact of these parameters on the algorithm performance has important sensitivities, and reasonable parameter settings are the key to improving model performance. This study compares advanced recommendation models of the same type as GNN, such as heterogeneous GNN (HetGNN), relational graph convolutional network (RGCN), and attention-based GNN (AGNN) that integrate attention mechanisms. The test results are shown in Figure 8.

Preference migration rate test results for different models. (a) Yelp and (b) Birghtkite.
Figure 8(a) and (b) shows preference transfer test data for four models on the Yelp and Brightkite datasets. In the Yelp dataset of Figure 8(a), the preference migration rate of the proposed model shows the highest stability and accuracy in both datasets. In the Brightkite dataset, the preference migration rate reaches 93.7% with an error of only 2.1%. This indicates that the proposed model is able to effectively capture users’ POI preference migration across cities, especially in the recommendation task with different geographic locations. Compared to the other models, the HetGNN and RGCN models have lower preference migration rates because they do not possess sufficiently strong cross-city preference learning capabilities. AGNN, despite being able to capture a certain amount of user preferences, has a high model complexity and is prone to unstable convergence. These results show that the proposed model has a significant advantage in intercity interest point migration, especially in coping with diverse user needs with high adaptability. Tests are conducted using precision, recall, F1 value, and average recommendation time as indicators, as shown in Table 2.
Metrics test results for the recommended model
| Data set | Model | P (%) | R (%) | F1 (%) | Average recommendation time (%) |
|---|---|---|---|---|---|
| Yelp | HetGNN | 88.24 | 89.64 | 88.94 | 6.41 |
| RGCN | 85.13 | 87.66 | 86.39 | 6.33 | |
| AGNN | 90.76 | 90.58 | 90.67 | 4.27 | |
| Research model | 93.52 | 91.24 | 92.38 | 2.19 | |
| Brightkite | HetGNN | 89.69 | 84.19 | 86.94 | 5.18 |
| RGCN | 88.54 | 86.59 | 87.57 | 4.18 | |
| AGNN | 91.27 | 89.44 | 90.36 | 4.02 | |
| Research model | 93.36 | 91.89 | 92.63 | 2.23 |
In Table 2, in Yelp, the highest P, R, and F1 values for the research model are 93.52, 91.24, and 92.38%, respectively, with an average recommendation time of 2.19 s. Compared to HetGNN, RGCN, and AGCN, the research model has significant advantages in recommendation accuracy, stability, and recommendation rate. This reflects the high accuracy and consistency of the proposed model in capturing user POI preferences and generating recommendation results. In Brightkite, the performance of each indicator of the research model is the best, with the highest P, R, and F1 values of 93.36, 91.89, and 92.63%, respectively, and an average recommendation time of 2.23 s. This result further shows that the proposed model not only has advantages in recommendation accuracy but also can effectively improve recommendation efficiency, which is suitable for large-scale real-time application scenarios.
3.2 Simulation testing of the POI interactive recommendation model between cities
This study randomly selects two groups of cities with the top four user POI click-through rates in Baidu’s public database and Gaode’s public database from 2012 to 2022 for visual comparison, namely Chengdu and Chongqing, and Shanghai and Beijing. The first step of the simulation process is to preprocess the two datasets to extract the user’s POI features and generate feature vectors. Next, a model based on the PyTorch framework is trained with the parameters set to an embedding layer size of 128, a learning rate of 0.001, and an optimizer of Adam. The transfer loss and attention weight coefficients are adjusted through multiple iterations during model training to ensure the accuracy and convergence of the recommendation system. After completing the training, the model predicts the input user data, recommends the corresponding POI, and evaluates the performance of the recommendation results. Advanced recommendation models have been introduced, such as the deep multi-view sequential model (DeepMove), spatial-temporal attention network (STAN), and geographic information embedding (GeoIE). Seven types of POIs with high user click-through rates are selected for testing, namely leisure and entertainment, transportation facilities, food and beverage, healthcare, business residences, tourist attractions, and science, education, and culture. The test results are shown in Figure 9.
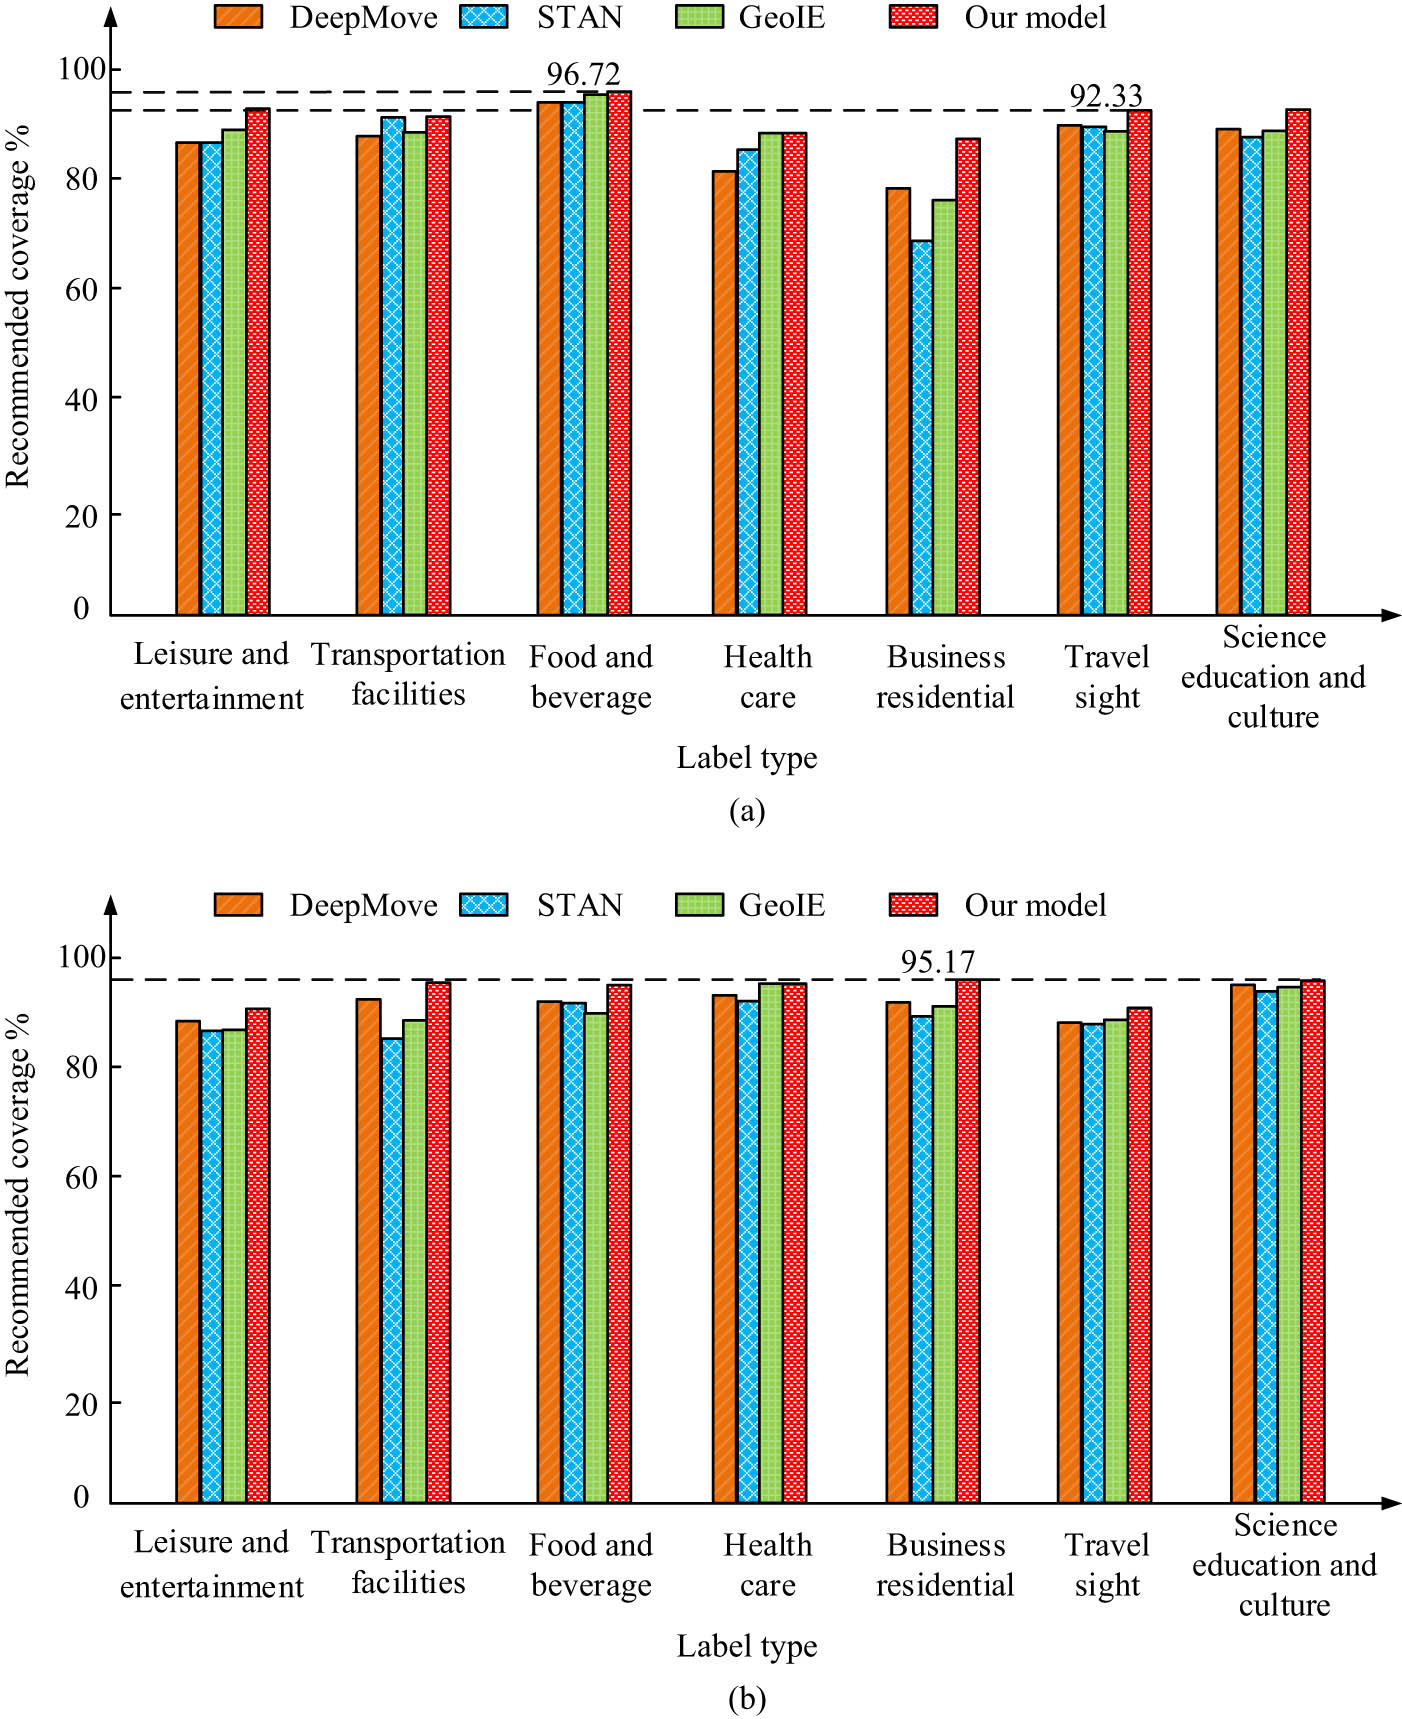
Recommendation coverage test results for different models. (a) Chengdu–Chongqing and (b) Shanghai–Beijing.
Figure 9(a) and (b) shows the recommended coverage of seven types of POI labels for four models between cities in Chengdu and Chongqing and Shanghai and Beijing. In Figure 9(a), the recommendation coverage rate of the research model in the POI of food and beverage is the highest at 96.72%, which is much higher than other models. Chongqing’s hotpot and Chengdu’s snack culture are typical representatives of this type of POI, indicating that the research model has advantages in capturing and recommending local cuisine and dining venues and can maintain high coverage of local specialty foods. In Figure 9(b), the recommended coverage rates for all seven types of POIs are relatively high, especially for commercial residential and educational cultural areas. The reason behind this is that Shanghai is the economic center of the country, and Beijing is the political center of the country. Therefore, the click-through rates for business residential and science, education, and culture in social network POI recommendations in both places are generally high. The research model can achieve a recommendation coverage rate of 95.17%. GeoIE and research models with better performance are selected for visual comparison using a confusion matrix, as shown in Figure 10.
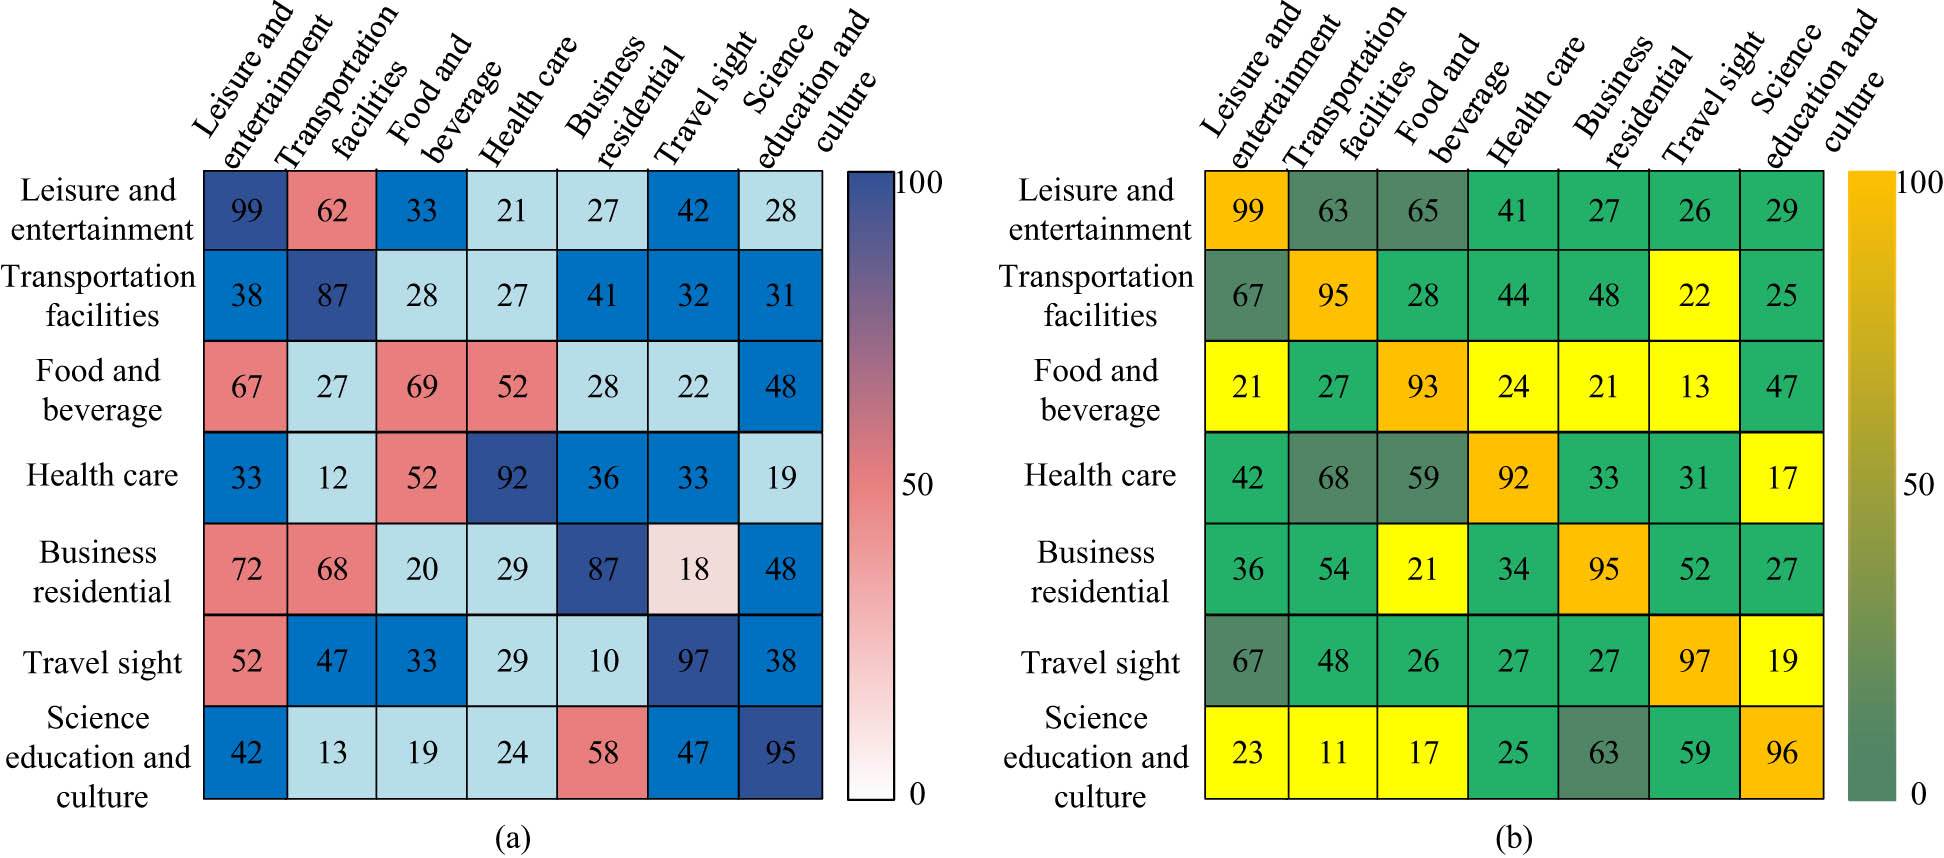
POI recommendation obfuscation results for the two classes of models. (a) GeoIE and (b) our model.
Figure 10(a) and (b) shows the POI recommendation classification results of GeoIE and the research model. In Figure 10(a), among the 7 types of POI recommendations, only 4 types of POI classification recommendations score above 90 points, and 2 types of POIs score above 80 points. Among them, GeoIE has a high similarity in recommending food and transportation facilities, which can lead to recommendation bias. The average recommendation classification of the research model for 7 types of POIs is 95%, and the classification of each type of POI is very accurate, maintaining above 90 points. This shows that the proposed model performs more consistently in the multi-interest point recommendation task, especially in the cross-city recommendation, and is able to match user interest points more accurately. The results demonstrate the efficacy of GNN combined with the attention mechanism for the task of user interest point categorization, thereby substantiating the robust adaptability of the proposed model in complex social network structures. This study compares four models for recommending seven types of POIs based on recommendation time, as listed in Table 3.
Comparison results of recommendation times of four models for seven categories of POIs
| POI | DeepMove | STAN | GeoIE | Research model |
|---|---|---|---|---|
| Leisure and entertainment | 6.17 | 6.12 | 5.11 | 4.17 |
| Transportation facilities | 6.32 | 5.45 | 5.03 | 3.57 |
| Food and beverage | 5.18 | 3.29 | 3.28 | 2.14 |
| Health care | 3.29 | 3.51 | 2.59 | 2.09 |
| Business residential | 4.24 | 4.36 | 2.44 | 2.13 |
| Travel sight | 3.15 | 3.57 | 2.46 | 2.01 |
| Science education and culture | 4.44 | 4.59 | 3.54 | 2.18 |
| Average value | 4.68 | 4.41 | 3.49 | 2.61 |
In Table 3, in the recommendation test for seven types of POIs, the longest recommendation time for DeepMove is 6.32 s in transportation facilities, the shortest time is 3.15 s in tourist attractions, and the average running time is 4.68 s. GeoIE combines geographic location information to significantly improve recommendation efficiency, with an average recommendation time of 3.49 s for seven types of POIs. Relatively speaking, the average recommendation time for the research model is the shortest at 2.61 s. This value is reduced by 2.07, 1.8, and 0.88 s compared to DeepMove, STAN, and GeoIE, respectively. The proposed model greatly improves computational efficiency while ensuring the recommendation accuracy. Particularly in the recommendation of key POIs such as transportation facilities, food, and beverages, the proposed model can respond to the user’s needs quickly, and the recommendation efficiency is far better than other models.
4 Conclusion and future work
In response to the challenges posed by the diversity of user demands and the complexity of social relationships between cities, this study introduced SA and CA mechanisms to capture the POI preference migration of users between source and target cities. Subsequently, a user POI popularity topology framework was constructed using the attention-derived model GAT in GNN, and a novel recommendation model was proposed. In the experiment, when the transfer loss function was 0.6, and the attention weight coefficient was 1.0, the highest recommendation accuracy of the model was 90%. Compared to HetGN, RGCN, and AGNN, the research model had a preference transfer rate of up to 93%, with a minimum error of 2%. The key results showed that the proposed model achieved 93.52 and 93.36% recommendation accuracy in the Yelp and Brightkite datasets, respectively, while the F1 value reached 92.63%, which was much higher than the other comparison models. Especially in the tests of Chengdu–Chongqing, and Shanghai–Beijing, the model achieved 96.72 and 95.17% recommendation coverage for dining and food, business residential and science, and education and culture, respectively. In addition, the recommendation speed was significantly improved, and the average recommendation time was reduced to 2.61 s, with a maximum reduction of 2.07 s compared to other models. In summary, the contribution of the study is that a model combining the SA and CA mechanisms is proposed to successfully solve the cross-city user POI preference migration problem. Meanwhile, the GAT-based POI heat modeling method significantly improves the accuracy and stability of the recommender system. However, the proposed method still has limitations in geographic information processing when dealing with recommendations in complex geographic environments, especially in scenarios with complex spatial structures. Second, the model lacks the ability to respond dynamically to rapid changes in user preferences and performs poorly in recommendations across time dimensions. Subsequent work will focus on optimizing the application of the model in complex geographic environments to further improve the responsiveness to rapid changes in user preferences. In addition, future research will incorporate more external data sources, such as social network relationships and time factors, to improve the accuracy and diversity of recommendations.
-
Funding information: The research is supported by the second batch of open research projects for the 2022 academic research platform of Suzhou University: Research on Digital Construction of Suzhou Characteristic Culture in the context of “Internet plus” (Project No. 2022ykf34); Project of Humanities and Social Sciences of Anhui Provincial Department of Education in 2022: Research on the Construction of Tourism Brand System for the Anhui Section of the Grand Canal Culture Based on Regional Synergy Theory (Project No. 2022AH051354); and Suzhou University 2024 School level Teaching Research Project: Research on the Logical Starting Point and Measures Path of Ideological and Political Education in Journalism and Communication Education Courses for Applied Undergraduate Universities (Project No.szxy2024ksjy01).
-
Author contributions: Yanbo Gao: data curation, funding acquisition, investigation, methodology, project administration, resources, software, visualization, and writing – original draft. Lin Zhang: conceptualization, formal analysis, supervision, validation, and writing – review and editing. All authors have accepted responsibility for the entire content of this manuscript and approved its submission.
-
Conflict of interest: Authors state no conflict of interest.
-
Data availability statement: All data generated or analyzed during this study are included in this published article.
References
[1] Luo J, Wang Y, Li G. The innovation effect of administrative hierarchy on intercity connection: The machine learning of twin cities. J Innov Knowl. 2023;8(1):100293–6.10.1016/j.jik.2022.100293Suche in Google Scholar
[2] Wang J, Luo G, Huang Y, Liu M, Wei Y. Spatial characteristics and influencing factors of commuting in central urban areas using mobile phone data: A case study of Nanning. Sustainability. 2023;15(12):9648–9.10.3390/su15129648Suche in Google Scholar
[3] Jin J, Song Y, Kan D, Zhang B, Lyu Y, Zhang J, et al. Learning context-aware region similarity with effective spatial normalization over point-of-interest data. Inf Process Manag. 2024;61(3):103673.10.1016/j.ipm.2024.103673Suche in Google Scholar
[4] Liu C, Fan C, Mostafavi A. Graph attention networks unveil determinants of intra-and inter-city health disparity. Urban Inform. 2024;3(1):1–14.10.1007/s44212-024-00049-5Suche in Google Scholar
[5] Liu H, Li Y, Fu Y, Mei H, Xiong H. Polestar++: An intelligent routing engine for national-wide public transportation. IEEE Trans Knowl Data Eng. 2022;35(6):6194–208.10.1109/TKDE.2022.3153711Suche in Google Scholar
[6] Dai L, Derudder B, Cao Z, Ji Y. Examining the evolving structures of intercity knowledge networks: the case of scientific collaboration in China. Int J Urban Sci. 2023;27(3):371–89.10.1080/12265934.2022.2042365Suche in Google Scholar
[7] Heydariyan A, Gharehchopogh FS, Dishabi MRE. A hybrid multi-objective algorithm based on slime mould algorithm and sine cosine algorithm for overlapping community detection in social networks. Clust Comput. 2024;27:1–21.10.1007/s10586-024-04632-ySuche in Google Scholar
[8] Sheykhzadeh J, Zarei B, Gharehchopogh FS. Community detection in social networks using a local approach based on node ranking. IEEE Access. 2024;12:92892–905.10.1109/ACCESS.2024.3420109Suche in Google Scholar
[9] Aghdam SM, Gharehchopogh FS, Masdari M. A hybrid approach in opinion leaders selection using African vultures optimization and hunger games search algorithms. Soc Netw Anal Min. 2024;14(1):60–3.10.1007/s13278-024-01228-7Suche in Google Scholar
[10] Wang D, Chen C, Di C, Shu M. Exploring behavior patterns for next-poi recommendation via graph self-supervised learning. Electronics. 2023;12(8):1939–41.10.3390/electronics12081939Suche in Google Scholar
[11] Liu Y, Wu H, Rezaee K. Interaction-enhanced and time-aware graph convolutional network for successive point-of-interest recommendation in traveling enterprises. IEEE Trans Ind Informat. 2022;19(1):635–43.10.1109/TII.2022.3200067Suche in Google Scholar
[12] Wang J, Yang B, Liu H, Li D. Global spatio-temporal aware graph neural network for next point-of-interest recommendation. Appl Intell. 2023;53(13):16762–75.10.1007/s10489-022-04377-4Suche in Google Scholar
[13] Liu J, Yi H, Gao Y, Jing R. Personalized point-of-interest recommendation using improved graph convolutional network in location-based social network. Electronics. 2023;12(16):3495–6.10.3390/electronics12163495Suche in Google Scholar
[14] Qin Y, Gao C, Wang Y. Disentangling geographical effect for point-of-interest recommendation. IEEE Trans Knowl Data Eng. 2022;35(8):7883–97.10.1109/TKDE.2022.3221873Suche in Google Scholar
[15] Chen Y. Theoretical mechanisms and suggestions for fostering the economic resilience of chinese cities from the perspective of urban social networks. China Financ Econ Rev. 2024;13(2):112–29.Suche in Google Scholar
[16] Xu Y, Santi P, Ratti C. Beyond distance decay: Discover homophily in spatially embedded social networks. Ann Am Assoc Geogr. 2022;112(2):505–21.10.1080/24694452.2021.1935208Suche in Google Scholar
[17] Xiang B, Chen R, Xu G. Uncovering network heterogeneity of China’s three major urban agglomerations from hybrid space perspective-based on TikTok check-in records. Land. 2022;12(1):134–5.10.3390/land12010134Suche in Google Scholar
[18] Yang Z, Hua Y, Cao Y, Zhao X, Chen M. Network patterns of Zhongyuan urban agglomeration in China based on Baidu migration data. ISPRS Int J Geo-Inf. 2022;11(1):62–4.10.3390/ijgi11010062Suche in Google Scholar
[19] Jiang H, Luo S, Qin J, Liu R, Yi D, Liu Y, et al. Exploring the inter-monthly dynamic patterns of Chinese Urban spatial interaction networks based on Baidu Migration Data. ISPRS Int J Geo-Inf. 2022;11(9):486–9.10.3390/ijgi11090486Suche in Google Scholar
[20] You Y, Wang Z. Preference-aware Bayesian Personalized Ranking for Point-of-interest recommendation. J Intell Fuzzy Syst. 2023;44(5):7113–9.10.3233/JIFS-222705Suche in Google Scholar
[21] Wu S, Sun F, Zhang W, Xie X, Cui B. Graph neural networks in recommender systems: a survey. ACM Comput Surv. 2022;55(5):1–37.10.1145/3535101Suche in Google Scholar
[22] Fan X, Hua Y, Cao Y, Zhao X. Capturing dynamic interests of similar users for POI recommendation using self-attention mechanism. Sustainability. 2023;15(6):5034–5.10.3390/su15065034Suche in Google Scholar
[23] Gheisari M, Hamidpour H, Liu Y, Saedi P, Raza A, Jalili A, et al. Data mining techniques for web mining: A survey. Artif Intell Appl. 2023;1(1):3–10.10.47852/bonviewAIA2202290Suche in Google Scholar
© 2025 the author(s), published by De Gruyter
This work is licensed under the Creative Commons Attribution 4.0 International License.
Artikel in diesem Heft
- Research Articles
- Generalized (ψ,φ)-contraction to investigate Volterra integral inclusions and fractal fractional PDEs in super-metric space with numerical experiments
- Solitons in ultrasound imaging: Exploring applications and enhancements via the Westervelt equation
- Stochastic improved Simpson for solving nonlinear fractional-order systems using product integration rules
- Exploring dynamical features like bifurcation assessment, sensitivity visualization, and solitary wave solutions of the integrable Akbota equation
- Research on surface defect detection method and optimization of paper-plastic composite bag based on improved combined segmentation algorithm
- Impact the sulphur content in Iraqi crude oil on the mechanical properties and corrosion behaviour of carbon steel in various types of API 5L pipelines and ASTM 106 grade B
- Unravelling quiescent optical solitons: An exploration of the complex Ginzburg–Landau equation with nonlinear chromatic dispersion and self-phase modulation
- Perturbation-iteration approach for fractional-order logistic differential equations
- Variational formulations for the Euler and Navier–Stokes systems in fluid mechanics and related models
- Rotor response to unbalanced load and system performance considering variable bearing profile
- DeepFowl: Disease prediction from chicken excreta images using deep learning
- Channel flow of Ellis fluid due to cilia motion
- A case study of fractional-order varicella virus model to nonlinear dynamics strategy for control and prevalence
- Multi-point estimation weldment recognition and estimation of pose with data-driven robotics design
- Analysis of Hall current and nonuniform heating effects on magneto-convection between vertically aligned plates under the influence of electric and magnetic fields
- A comparative study on residual power series method and differential transform method through the time-fractional telegraph equation
- Insights from the nonlinear Schrödinger–Hirota equation with chromatic dispersion: Dynamics in fiber–optic communication
- Mathematical analysis of Jeffrey ferrofluid on stretching surface with the Darcy–Forchheimer model
- Exploring the interaction between lump, stripe and double-stripe, and periodic wave solutions of the Konopelchenko–Dubrovsky–Kaup–Kupershmidt system
- Computational investigation of tuberculosis and HIV/AIDS co-infection in fuzzy environment
- Signature verification by geometry and image processing
- Theoretical and numerical approach for quantifying sensitivity to system parameters of nonlinear systems
- Chaotic behaviors, stability, and solitary wave propagations of M-fractional LWE equation in magneto-electro-elastic circular rod
- Dynamic analysis and optimization of syphilis spread: Simulations, integrating treatment and public health interventions
- Visco-thermoelastic rectangular plate under uniform loading: A study of deflection
- Threshold dynamics and optimal control of an epidemiological smoking model
- Numerical computational model for an unsteady hybrid nanofluid flow in a porous medium past an MHD rotating sheet
- Regression prediction model of fabric brightness based on light and shadow reconstruction of layered images
- Dynamics and prevention of gemini virus infection in red chili crops studied with generalized fractional operator: Analysis and modeling
- Qualitative analysis on existence and stability of nonlinear fractional dynamic equations on time scales
- Fractional-order super-twisting sliding mode active disturbance rejection control for electro-hydraulic position servo systems
- Analytical exploration and parametric insights into optical solitons in magneto-optic waveguides: Advances in nonlinear dynamics for applied sciences
- Bifurcation dynamics and optical soliton structures in the nonlinear Schrödinger–Bopp–Podolsky system
- User profiling in university libraries by combining multi-perspective clustering algorithm and reader behavior analysis
- Review Article
- Haar wavelet collocation method for existence and numerical solutions of fourth-order integro-differential equations with bounded coefficients
- Special Issue: Nonlinear Analysis and Design of Communication Networks for IoT Applications - Part II
- Silicon-based all-optical wavelength converter for on-chip optical interconnection
- Research on a path-tracking control system of unmanned rollers based on an optimization algorithm and real-time feedback
- Analysis of the sports action recognition model based on the LSTM recurrent neural network
- Industrial robot trajectory error compensation based on enhanced transfer convolutional neural networks
- Research on IoT network performance prediction model of power grid warehouse based on nonlinear GA-BP neural network
- Interactive recommendation of social network communication between cities based on GNN and user preferences
- Application of improved P-BEM in time varying channel prediction in 5G high-speed mobile communication system
- Construction of a BIM smart building collaborative design model combining the Internet of Things
- Optimizing malicious website prediction: An advanced XGBoost-based machine learning model
- Economic operation analysis of the power grid combining communication network and distributed optimization algorithm
- Sports video temporal action detection technology based on an improved MSST algorithm
- Internet of things data security and privacy protection based on improved federated learning
- Enterprise power emission reduction technology based on the LSTM–SVM model
- Construction of multi-style face models based on artistic image generation algorithms
- Research and application of interactive digital twin monitoring system for photovoltaic power station based on global perception
- Special Issue: Decision and Control in Nonlinear Systems - Part II
- Animation video frame prediction based on ConvGRU fine-grained synthesis flow
- Application of GGNN inference propagation model for martial art intensity evaluation
- Benefit evaluation of building energy-saving renovation projects based on BWM weighting method
- Deep neural network application in real-time economic dispatch and frequency control of microgrids
- Real-time force/position control of soft growing robots: A data-driven model predictive approach
- Mechanical product design and manufacturing system based on CNN and server optimization algorithm
- Application of finite element analysis in the formal analysis of ancient architectural plaque section
- Research on territorial spatial planning based on data mining and geographic information visualization
- Fault diagnosis of agricultural sprinkler irrigation machinery equipment based on machine vision
- Closure technology of large span steel truss arch bridge with temporarily fixed edge supports
- Intelligent accounting question-answering robot based on a large language model and knowledge graph
- Analysis of manufacturing and retailer blockchain decision based on resource recyclability
- Flexible manufacturing workshop mechanical processing and product scheduling algorithm based on MES
- Exploration of indoor environment perception and design model based on virtual reality technology
- Tennis automatic ball-picking robot based on image object detection and positioning technology
- A new CNN deep learning model for computer-intelligent color matching
- Design of AR-based general computer technology experiment demonstration platform
- Indoor environment monitoring method based on the fusion of audio recognition and video patrol features
- Health condition prediction method of the computer numerical control machine tool parts by ensembling digital twins and improved LSTM networks
- Establishment of a green degree evaluation model for wall materials based on lifecycle
- Quantitative evaluation of college music teaching pronunciation based on nonlinear feature extraction
- Multi-index nonlinear robust virtual synchronous generator control method for microgrid inverters
- Manufacturing engineering production line scheduling management technology integrating availability constraints and heuristic rules
- Analysis of digital intelligent financial audit system based on improved BiLSTM neural network
- Attention community discovery model applied to complex network information analysis
- A neural collaborative filtering recommendation algorithm based on attention mechanism and contrastive learning
- Rehabilitation training method for motor dysfunction based on video stream matching
- Research on façade design for cold-region buildings based on artificial neural networks and parametric modeling techniques
- Intelligent implementation of muscle strain identification algorithm in Mi health exercise induced waist muscle strain
- Optimization design of urban rainwater and flood drainage system based on SWMM
- Improved GA for construction progress and cost management in construction projects
- Evaluation and prediction of SVM parameters in engineering cost based on random forest hybrid optimization
- Museum intelligent warning system based on wireless data module
- Optimization design and research of mechatronics based on torque motor control algorithm
- Special Issue: Nonlinear Engineering’s significance in Materials Science
- Experimental research on the degradation of chemical industrial wastewater by combined hydrodynamic cavitation based on nonlinear dynamic model
- Study on low-cycle fatigue life of nickel-based superalloy GH4586 at various temperatures
- Some results of solutions to neutral stochastic functional operator-differential equations
- Ultrasonic cavitation did not occur in high-pressure CO2 liquid
- Research on the performance of a novel type of cemented filler material for coal mine opening and filling
- Testing of recycled fine aggregate concrete’s mechanical properties using recycled fine aggregate concrete and research on technology for highway construction
- A modified fuzzy TOPSIS approach for the condition assessment of existing bridges
- Nonlinear structural and vibration analysis of straddle monorail pantograph under random excitations
- Achieving high efficiency and stability in blue OLEDs: Role of wide-gap hosts and emitter interactions
- Construction of teaching quality evaluation model of online dance teaching course based on improved PSO-BPNN
- Enhanced electrical conductivity and electromagnetic shielding properties of multi-component polymer/graphite nanocomposites prepared by solid-state shear milling
- Optimization of thermal characteristics of buried composite phase-change energy storage walls based on nonlinear engineering methods
- A higher-performance big data-based movie recommendation system
- Nonlinear impact of minimum wage on labor employment in China
- Nonlinear comprehensive evaluation method based on information entropy and discrimination optimization
- Application of numerical calculation methods in stability analysis of pile foundation under complex foundation conditions
- Research on the contribution of shale gas development and utilization in Sichuan Province to carbon peak based on the PSA process
- Characteristics of tight oil reservoirs and their impact on seepage flow from a nonlinear engineering perspective
- Nonlinear deformation decomposition and mode identification of plane structures via orthogonal theory
- Numerical simulation of damage mechanism in rock with cracks impacted by self-excited pulsed jet based on SPH-FEM coupling method: The perspective of nonlinear engineering and materials science
- Cross-scale modeling and collaborative optimization of ethanol-catalyzed coupling to produce C4 olefins: Nonlinear modeling and collaborative optimization strategies
- Unequal width T-node stress concentration factor analysis of stiffened rectangular steel pipe concrete
- Special Issue: Advances in Nonlinear Dynamics and Control
- Development of a cognitive blood glucose–insulin control strategy design for a nonlinear diabetic patient model
- Big data-based optimized model of building design in the context of rural revitalization
- Multi-UAV assisted air-to-ground data collection for ground sensors with unknown positions
- Design of urban and rural elderly care public areas integrating person-environment fit theory
- Application of lossless signal transmission technology in piano timbre recognition
- Application of improved GA in optimizing rural tourism routes
- Architectural animation generation system based on AL-GAN algorithm
- Advanced sentiment analysis in online shopping: Implementing LSTM models analyzing E-commerce user sentiments
- Intelligent recommendation algorithm for piano tracks based on the CNN model
- Visualization of large-scale user association feature data based on a nonlinear dimensionality reduction method
- Low-carbon economic optimization of microgrid clusters based on an energy interaction operation strategy
- Optimization effect of video data extraction and search based on Faster-RCNN hybrid model on intelligent information systems
- Construction of image segmentation system combining TC and swarm intelligence algorithm
- Particle swarm optimization and fuzzy C-means clustering algorithm for the adhesive layer defect detection
- Optimization of student learning status by instructional intervention decision-making techniques incorporating reinforcement learning
- Fuzzy model-based stabilization control and state estimation of nonlinear systems
- Optimization of distribution network scheduling based on BA and photovoltaic uncertainty
- Tai Chi movement segmentation and recognition on the grounds of multi-sensor data fusion and the DBSCAN algorithm
- Special Issue: Dynamic Engineering and Control Methods for the Nonlinear Systems - Part III
- Generalized numerical RKM method for solving sixth-order fractional partial differential equations