Mechanical product design and manufacturing system based on CNN and server optimization algorithm
-
Lei Tian


Abstract
Mechanical optimization refers to the use of advanced mechanical equipment and physical processes to optimize raw materials, products, etc., in production, reduce energy consumption, and improve production efficiency and product quality. In the cloud manufacturing mode of manufacturing enterprises, the design of mechanical products requires server optimization based on the demand side. The existing server optimization algorithms are not intelligent enough for server discovery and optimization in this mode. A mechanical product design service and manufacturing method based on convolutional neural network and server discovery and optimization architecture is proposed, which combines deep learning and optimal path algorithm to select better mechanical product services. Research outcomes showed that the training accuracy and testing accuracy of the research network were 98.89 and 96.88%, respectively, with training loss and testing loss of 0.04619 and 0.08921, respectively. In contrast, the training accuracy and testing accuracy of the comparative network were 93.95 and 85.31%, respectively, with training loss and testing loss of 0.3556 and 0.4872. The running time of the two neural networks is 105 and 73 min, respectively. Overall, the accuracy of the research network is high, and the loss is small. The training accuracy and loss of the new activation function proposed in the study have always been superior to other functions. The path and running time of the server optimization path algorithm have better performance. It can be seen that the research proposed methods have good performance and advantages in mechanical product design services and optimization, which can provide technical references and directions for the development of manufacturing service-oriented enterprises in cloud manufacturing mode.
1 Introduction
With the rapid growth of information technology and the deepening of globalization, the manufacturing industry is facing unprecedented challenges and opportunities. The traditional manufacturing model is no longer capable of adapting to the rapid changes in market demands and the increasingly complex product production processes that are characteristic of the contemporary era. In contrast, the adoption of novel information technologies, including cloud computing, big data, and the Internet of Things (IoT), offers a promising avenue for the advancement of manufacturing industry innovation [1,2]. In this context, cloud manufacturing, as an innovative service-oriented networked manufacturing model, is gradually emerging and becoming a significant driver of transformation and upgrading in the manufacturing industry. Cloud manufacturing represents a convergence of advanced information technology, manufacturing technology, and emerging IoT technologies, exemplifying the concept of manufacturing as a service [3]. It employs state-of-the-art information technology concepts, including cloud computing, to facilitate the provision of high-value, cost-effective, and globally distributed manufacturing services for a diverse range of products in various network resource environments. Many researchers have put forward their insights on product manufacturing and design. IoT devices cannot address the issues of high-dimensional machine detection and data imbalance. Murugiah et al. proposed a new Industry 4.0 predictive manufacturing system for inspecting machineries. In the initial phase of the study, data were collected from sensors utilized in the IoT industry. Following the extensive cleaning of the data set, deep features were extracted using the multi-scale dilation attention convolutional neural network. A hybrid algorithm, namely probabilistic beetle swarm-butterfly optimization, was employed to extract deep weighted features and optimize the weights. Subsequently, the weighted features were allocated to the optimized hybrid fault detection conducted by the deep neural network and deep belief network [4]. The efficacy of the proposed model was evaluated based on a set of actual measurement values in the context of Industry 4.0. In response to the growing demand from consumers for products that are environmentally responsible, there has been a notable increase in the focus on sustainable product design in recent years. However, because of the lack and ambiguity of knowledge among clients and experts, including uncertainty in understanding, the design is not feasible. To address this gap, Zhou proposed a novel multi-objective optimization (MOO) ranking technique that integrates the technique for order preference by similarity to ideal solution (TOPSIS) method. Additionally, Zhou designed a fuzzy Markov Taguchi system method to mitigate cognitive uncertainty associated with customer preferences regarding optimization objectives. The implementation of the novel TOPSIS method yielded the optimal design solution, as evidenced by experimental results. This method provided an exemplar of sustainable substrate design and enabled sensitivity analysis scenarios and comparative studies to be conducted, thereby demonstrating the efficacy of the proposed method [5]. In the context of the contemporary industrial revolution, additive manufacturing represents a promising technological advancement with the potential to enhance the efficacy, flexibility, and competitiveness of the supply chain. Brito et al. proposed a new design method for additive manufacturing–supply chains using optimization techniques. The research results indicated that this method was evaluated in real use cases of elevator maintenance service providers, and the proposed design method had good capabilities in addressing the challenges brought by the widespread use of 3D printers in SC manufacturing [6]. High-resolution laser additive manufacturing markedly expands design autonomy, propels the evolution of topology optimization (TO), and propounds advanced structural design methodologies. To fully capitalize on the benefits of voxel-based forming techniques, Li et al. proposed a novel artificial intelligence-assisted TO approach for laser-based parallel optimization design, which aims to encompass the relationship between process performance and design variables. The method employed heuristic and gradient-based algorithms to concurrently design the micro-material properties and macro-structural topology of 3D components. In comparison to classical optimization techniques, numerical simulations demonstrated that this approach could markedly enhance the macroscopic structural mechanical performance. This collaborative design methodology could be extensively utilized in the design and optimization of intricate functional components, as well as case studies of artificial intelligence-assisted product evaluation [7].
The product service systems (PSSs) have precipitated a rapid evolution in the manner by which value is created within the manufacturing industry. The existing PSS configuration solutions afford customers the opportunity to select preferred product and service modules, characterized by a high degree of granularity. Zhang et al. addressed the product-oriented PSS configuration optimization problem from a fine-grained perspective. A multi-layer network comprising the product layer, service layer, and resource layer was constructed to represent the elements and relationships inherent to the PSS. It should jointly consider service activity selection and resource allocation, construct a mathematical model for optimizing PSS configuration, and make the calculation of optimization objectives under constraint conditions closer to the actual execution situation. The findings of the research indicated that the significance of service activities was perceived to enhance the performance of service activities with greater importance. The corresponding algorithm was enhanced and implemented to determine the optimal solution, and case studies in the automotive industry demonstrated the diverse advantages of the proposed method [8]. In the context of the Internet and big data, a novel production and operational organizational model for the intelligent automobile industry will facilitate its transformation in several key areas, including product planning, design, production, marketing, operation, and maintenance. Moreover, this model has the potential to facilitate service innovation oriented to the full life cycle of products. Yang et al. employed multi-attribute decision-making in the context of automotive manufacturing and service industries, utilizing a total of 20 attributes, comprising 14 attributes from the manufacturing industry and 6 attributes from the automotive service industry, as inputs. A BP neural network was subsequently trained. Finally, the effectiveness of the proposed methodology was validated through a set of numerical examples, demonstrating an average accuracy of 93.19% [9]. The design, machining, and assembly processes employed in mold fabrication are inherently knowledge-intensive, costly, and time-consuming operations that demand a significant investment of human resources. Lee and Ryu employed a methodology whereby product features were extracted from product images, and the degree of similarity between the features of new products and those of products previously manufactured was evaluated. The design features were extracted from the design data, and a similarity retrieval model framework was put forward based on the outcomes of both product and design feature extraction. A model was developed that encompassed collaborative processes, products, processes, and resources. The results demonstrated that this process of collaborative modeling facilitated the visualization and analysis of complex processes intrinsic to the creation of innovative products [10]. The current circular economy (CE) design framework and evaluation have failed to address two key areas where computational optimization can add value: determining the best-performing solution among many options and managing multiple potential conflicting or redundant CE goals. Ortner et al. proposed and tested a computational MOO method for CE product design, which improved the results of manual design processes and reduced waste and environmental impact throughout the product lifecycle. The results indicated that MOO could bring improvements to CE product design and provide a basis for future work discussions [11].
Ma et al. proposed four new optimization methods for multi-layer perceptron neural networks to predict this key parameter. The dataset used consists of 103 rows of information, with 7 influential parameters. In this work, the optimal fitting complexity for each set is determined through population-based sensitivity analysis. The grasshopper optimization algorithm stands out as the second most efficient optimizer with minimal complexity (overall size = 50) [12]. Gao et al. proposed a new method for evaluating the bond strength of fiber-reinforced polymers using an artificial intelligence-based model. The comparison of results shows that the new model can provide better performance. In conclusion, the proposed hybrid model can serve as a suitable alternative to empirical models in this research field [13]. Many advanced machine learning and deep learning techniques developed for big data have inadvertently provided solutions to small data problems. Dou et al. summarized and analyzed several emerging potential solutions for small data challenges in molecular science (including chemistry and biology), reviewed basic machine learning algorithms, as well as more advanced technologies, and discussed promising trends for small data challenges in molecular science [14]. Tajziehchi et al. studied the use of genetic algorithms for earthquake control and optimization and proposed a new method that uses binary genetic algorithms and natural numbers to select the optimal acceleration map and scale it for dynamic time history analysis, thereby obtaining an average response spectrum that matches the target spectrum appropriately and has a short distance, and indicating the expected earthquake of the site. The results show that this research can provide users with a series of optimal coefficients, crossover values, and mutations for each chromosome [15].
In summary, researchers have been involved and studied in data recognition, service cycle analysis, product design feature extraction, and algorithm classification for the optimization algorithms of mechanical products and servers. However, the application of service selection and design optimization for mechanical products is still insufficient, and there is no better segmentation and detailed analysis of product services to comprehensively analyze the service process. Therefore, this research proposes an intelligent service discovery algorithm and optimization architecture method for mechanical products based on convolutional neural networks (CNNs). Taking the optimization server as an example, this article innovatively studies the optimal service selection algorithm in cloud manufacturing mode based on directed graph and Dijkstra’s algorithm, matches and optimizes the mechanical product features and demand side requirements, and provides a technical basis for enterprise mechanical product design and optimization.
2 Methods and materials
To implement the intelligent service discovery model in the intelligent service discovery scheme, research was conducted on the intelligent service discovery algorithm based on CNN. In recent years, CNNs have achieved remarkable results in image intelligence recognition in many industries (such as facial recognition, unmanned driving environment perception, etc.), but there is currently no research on their application in the field of mechanical products. To improve the accuracy of product image recognition, the advantages and disadvantages of existing neural network architectures and activation functions are studied, and a neural network architecture and activation function for mechanical product data are proposed. First, the intelligent service and optimization of mechanical products were studied and analyzed. Then, product service decomposition was carried out, and a CNN-based intelligent service discovery algorithm for mechanical products was proposed. Second, research was conducted on the optimal service selection algorithm in cloud manufacturing mode based on directed graphs and Dijkstra’s algorithm.
2.1 Intelligent service discovery algorithm and optimal architecture for mechanical products based on CNN
In recent years, a new mechanical product service model has utilized cloud computing and artificial intelligence [16]. It achieves intelligent matching, recommendation, and optimization of mechanical product-related services through intelligent algorithms and data analysis to meet the diverse and personalized needs of users. Research is conducted on intelligent service discovery algorithms and optimization architectures, combining various services, as shown in Figure 1.

Intelligent service discovery solution.
For the study of server optimization indicators, manufacturing capability and overall capability are selected. The former is for service quality evaluation, while the latter is for the overall evaluation of service time, cost, service praise, service needs, and other aspects. The evaluation indicators for overall capability are shown in the following equation:
In Eq. (1),
In Eq. (2),
The performance of a neural network is determined by its architecture and activation function [19]. Therefore, a new type of attention network, the novel CNN architecture, is proposed to improve the accuracy of attention networks [20]. There are limitations in the recognition accuracy of existing neural network architectures and the generated attention networks.
The attention map is a method used to represent the different weights assigned by deep learning models to information at different positions or time steps when processing input information [21]. First, the generation principle of attention networks is studied. Some attention networks use the key points of recognized objects as the centers of behavioral units to generate corresponding attention maps, with the center having the highest weight. The generated expression is shown in the following equation:
In Eq. (3),

Steps for generating image attention maps.
In Figure 2, the original image is first input, then it is represented in grayscale, resized, and an attention map is generated by improving the local binary patterns (LBP) weight generation method. Finally, it is fused into a neural network to generate an enhancement layer. The study designs a neural network architecture based on the results obtained from the above steps, defining the output and number of convolutional layers, pooling layer output, and fully connected layer output. The proposed neural network input representation is shown in the following equation:
In Eq. (4),
This function has two parts, namely the negative half-axis of the tanh function and the positive half-axis of the ReLU function. Based on the above, a CNN architecture for mechanical product images is designed.
Mechanical product datasets and intelligent service discovery models were collected and trained, with acquisition strategies mainly including image occlusion, mechanical product images from different angles, and images with different light intensities [22,23]. Prior to this, the design process of mechanical products has been decomposed, as shown in Figure 3.

Decomposition of the mechanical product design process.
Then, data preprocessing is carried out to improve the generalization ability of the neural network and reduce overfitting. Research is conducted on data augmentation of the dataset, including red green blue (RBG) enhancement, noise processing, random pruning, rotation, etc. After preprocessing, the quality of the dataset for mechanical products is evaluated, mainly through experimental training and research on the constructed dataset. By comparing the test results, the quality evaluation situation is obtained. Finally, the high-precision dataset is applied to the intelligent service discovery model and neural network model. The intelligent service discovery and optimization framework constructed by the research is shown in Figure 4.
A smart system for finding and improving services.
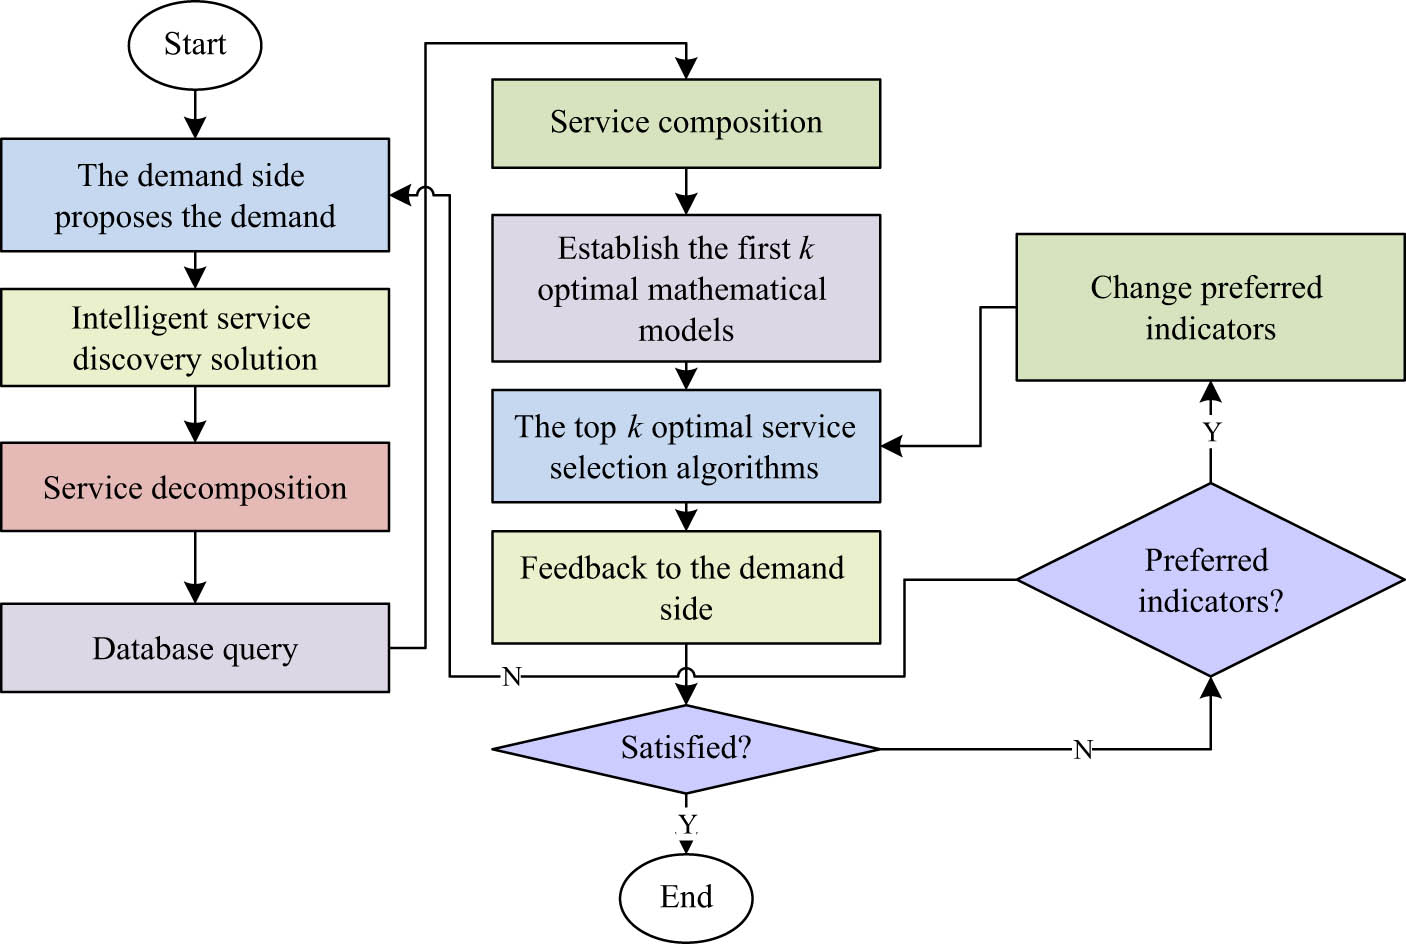
In Figure 4, first, the customer requests mechanical products and services. Then, an intelligent service discovery model is used to search and query databases, followed by service composition. In the server optimization module, a mathematical model is constructed, and a server optimization algorithm is introduced. Finally, feedback is given to the demand side to determine whether they are satisfied. If satisfied, the process ends. If not, the optimization indicators are changed again, and the server optimization algorithm is used for selection. The feedback is then given to the demand side until they are satisfied.
Compared with other methods, CNN typically requires input data to have a fixed size and resolution. In practical applications, the size and resolution of mechanical product images may vary, requiring pre-processing of the input data. Model training may require a large amount of data and high-performance computers. However, CNN has strong learning and generalization abilities in research methods and can extract fine features such as edges, textures, shapes, etc., thereby improving recognition accuracy. Combined with optimal service selection algorithms based on directed graphs and Dijkstra’s algorithm, it forms a more complete intelligent service discovery solution, providing users with higher quality and more efficient intelligent services.
2.2 Optimal server optimization algorithm in cloud manufacturing mode
In the cloud intelligent service discovery and optimization architecture, mathematical models and server optimization algorithms are applied. This study introduces and designs the model and algorithm. First, mathematical modeling is conducted on k optimal service combination schemes, and optimization indicators are set. The optimal schemes select production services, design services, and product services, and an objective function is constructed [24]. The overall capability of the preferred solution is represented by
In Eq. (6),
The corresponding manufacturing and overall capabilities of the service providers selected for the manufacturing capability and comprehensive capability in the objective function of the product portfolio scheme are shown in the following equation:
In Eq. (7),
In Eq. (8),

Directed graph for optimal selection of service combination schemes with maximum or minimum indicators.
In Figure 5,
In Eq. (9),
In Eq. (10),
The n-th subtask is shown in the following equation:
Through the operations of Eqs. (11) and (12), all node resource costs are reset to zero, and all paths have resource costs, as shown in Eq. (13).
In order to obtain the shortest path, an improved algorithm for the first k shortest paths is proposed, which is based on Dijkstra’s algorithm and includes sub-shortest paths and path extensions. The resource cost of the second shortest path is greater than that of the shortest path, so when the path cost is 0 in other stages, as shown in the following equation:
The cost of secondary short-path resources is shown in the following equation:
In Eqs. (14) and (15),

The shortest or longest path algorithm process.
In Figure 6, all represents the sum of path resource costs.
3 Results
To verify the proposed mechanical product design method based on CNN and server optimization algorithm, an experiment was conducted to validate it, analyze the corresponding design parameters and experimental data results, verify the advantages and feasibility of the method, and provide reference for product demanders to optimize products.
3.1 Intelligent service discovery and optimization system verification settings
The experiment focused on the mechanical product services of a certain enterprise under cloud manufacturing mode. Table 1 shows the parameter settings of the neural network architecture before and after adopting LBP improvement. The experimental platform had 8 GB of memory, the system was OSXE | Capitan system, and the experimental software was Python 2.7, with a 2.9 GHz Intel i5 processor. In order to verify the performance of the neural network architecture, experiments were conducted on the improved and unmodified networks based on the MNIST dataset. The MNIST dataset is a fundamental dataset for deep learning, sourced from the National Institute of Standards and Technology in the United States. MNIST has a total of 60,000 training sample sets and 10,000 validation sample sets, and its images are handwritten digits with 28 × 28 pixels stored in byte form. Before conducting the experiment, it is necessary to first set the parameters of the neural network. To verify the performance of the research network in extracting image features, design parameters for the neural network. Choose ReLU as the activation function, stochastic gradient descent as the optimization algorithm, and set the maximum training steps for the neural network framework to 2,000.
Parameter settings for neural network architecture
| Input | Number of parameters | Feature map size | Convolutional kernel | Step |
|---|---|---|---|---|
| Image | 30,726 | 28 × 28 | — | — |
| Convolutional layer 1 | 65,548 | 28 × 28 | [2 × 2, 96], 2 | 1 |
| Pooling layer 1 | 16,374 | 14 × 14 | [2 × 2], 1 | 2 |
| Convolutional layer 2 | 32,756 | 14 × 14 | [2 × 2, 128], 2 | 1 |
| Pooling layer 2 | 8,188 | 7 × 7 | [2 × 2], 1 | 2 |
| Convolutional layer 3 | 16,376 | 7 × 7 | [2 × 2, 256], 3 | 1 |
| Pooling layer 3 | 4,084 | 4 × 4 | [2 × 2], 1 | 2 |
| Convolutional layer 4 | 8,166 | 4 × 4 | [2 × 2, 384], 3 | 1 |
| Pooling layer 4 | 2,048 | 2 × 2 | [2 × 2], 1 | 2 |
| Convolutional layer 5 | 2,048 | 2 × 2 | [2 × 2, 512], 3 | 1 |
| Pooling layer 5 | 512 | 1 × 1 | [2 × 2], 1 | 2 |
| Fc 1 | 4,096 | 1 × 1 | Average pool | — |
| Fc 2 | 4,096 | 11 | Average pool | — |
| Fc 3 | 10 | — | — | — |
3.2 Analysis of intelligent service discovery and optimization algorithm results
Figure 7 shows the training accuracy and loss curves of models trained on different networks, compared to traditional CNNs. In Figure 7(a), the correct rate of model training for the research network performs well. The correct rate increases rapidly in the early stage of training and stabilizes at around 0.9 at step sizes greater than 200. This indicates that the research network is able to learn the features of the data more effectively during the training process, thus achieving accurate classification or prediction of the input data. In contrast, the model training correctness of traditional CNNs improves slowly and fluctuates greatly during the training process. It is only when the step size reaches about 800 that the correct rate stabilizes at about 0.83, which is lower than the correct rate of the research network. This is due to the limitations of the traditional CNN in feature extraction or model structure, resulting in its poor performance in handling complex data. In Figure 7(b), the model training loss of the research network decreases rapidly at the beginning of training and approaches 0 at a step size of around 20. This indicates that the research network is able to converge to the optimal solution quickly during training, thus achieving accurate fitting to the input data. The model training loss of the traditional CNN decreases slowly and fluctuates greatly during training. The loss approaches 0 only after the step size reaches 800, but is always greater than the model training loss of the study network. This further confirms that traditional CNNs are deficient in training efficiency and model fitting ability. It can be seen that models studying network training have more advantages in accuracy and loss.
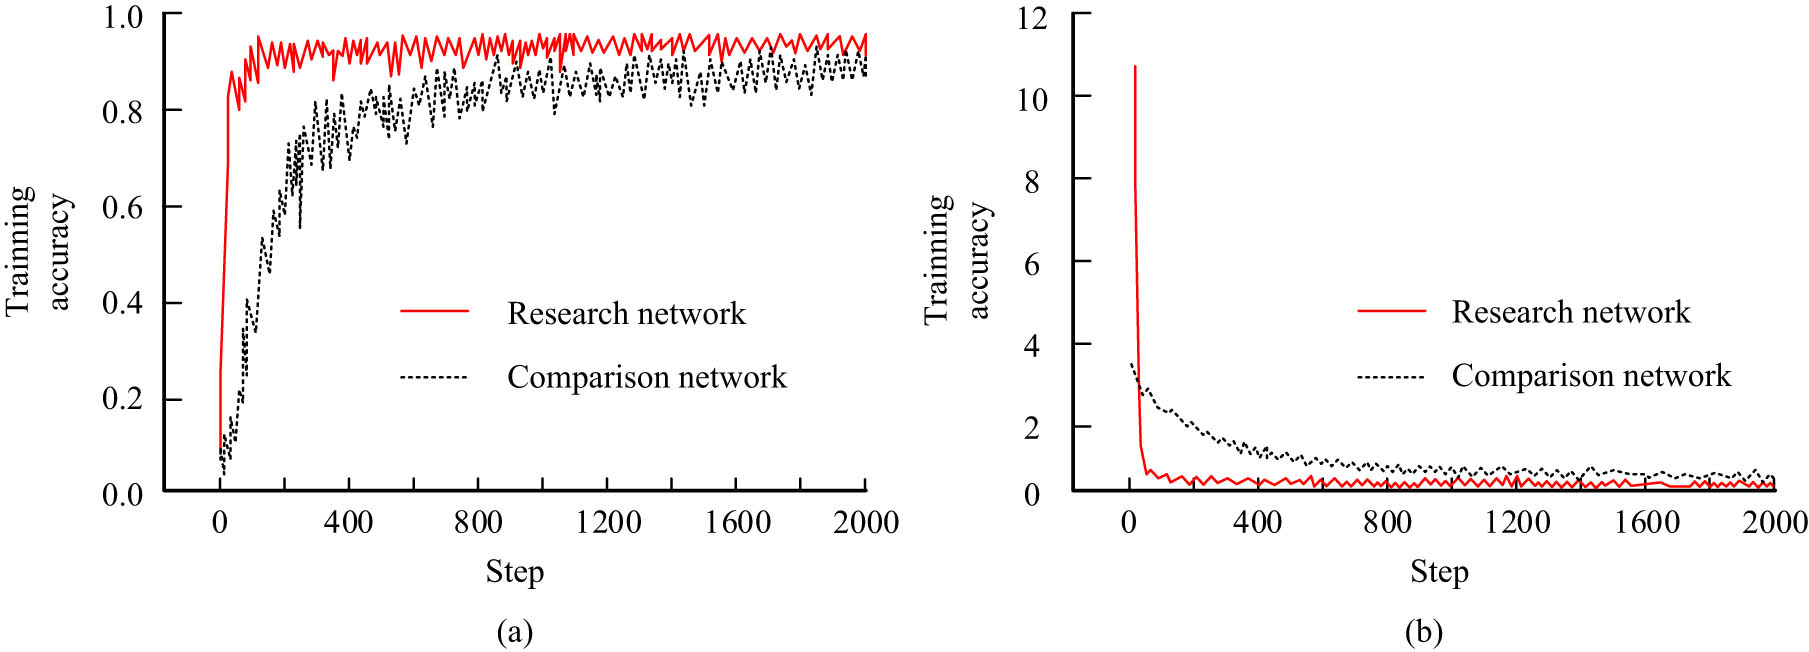
The accuracy and loss curve of model training based on different networks. (a) Accuracy curves of model training based on different networks. (b) Training loss curves of models trained on different networks.
Figure 8 showcases the comparison of different activation function curves, as well as the training accuracy and loss of different networks. The “ThLU” function, which combines tanh function and ReLU function, was studied as the activation function. Other compared activation functions include commonly used ReLU function, Leaky rectified linear unit (LReLU), and exponential linear unit (ELU). Figure 8(a) shows the variation curves of each activation function, which showed significant changes at the node with input 0. ThLU and ELU had similar changes, but ThLU had a smaller output, and when the input was greater than 0, the output was close to other functions. The changes in ReLU and LReLU were similar, ranging from −0.2 to −0.1 when the input was less than 0. When the input was greater than 0, the output changed proportionally. In Figure 8(b), the training accuracy and loss of the neural network showed that the training accuracy and testing accuracy of the studied network were 98.89 and 96.88%, respectively, with training loss and testing loss of 0.04619 and 0.08921, respectively. In contrast, the training accuracy and testing accuracy of the compared network were 93.95 and 85.31%, respectively, with training loss and testing loss of 0.3556 and 0.4872. The running time of the two neural networks was 105 and 73 min, respectively. Overall, the accuracy of the studied network was high, with relatively small losses.

Comparison of different activation function curves and training accuracy and loss of different networks. (a) Different activation function curves. (b) Comparison of training accuracy and loss for different networks.
Figure 9 shows the training accuracy and loss curves of each activation function on the dataset. In Figure 9(a), the training accuracy of the proposed ThLU function was consistently higher than that of other functions. This was mainly reflected in the rapid improvement of the training accuracy of the ThLU function, which was within the range of 80–100%, while other functions had a slower upward trend, slowly increasing within the range of 40–100%. In Figure 9(b), the training loss of the proposed ThLU function was always smaller than other functions, rapidly decreasing in the range of 0–1.2 and around 0.1, while the training loss of other functions decreased more slowly in the range of 0–1.8. The training loss of other activation functions decreases slowly in the range of 0–1.8 and fluctuates greatly during the training process. The loss values of these functions are significantly higher than those of the ThLU function, indicating their shortcomings in model optimization and feature extraction.
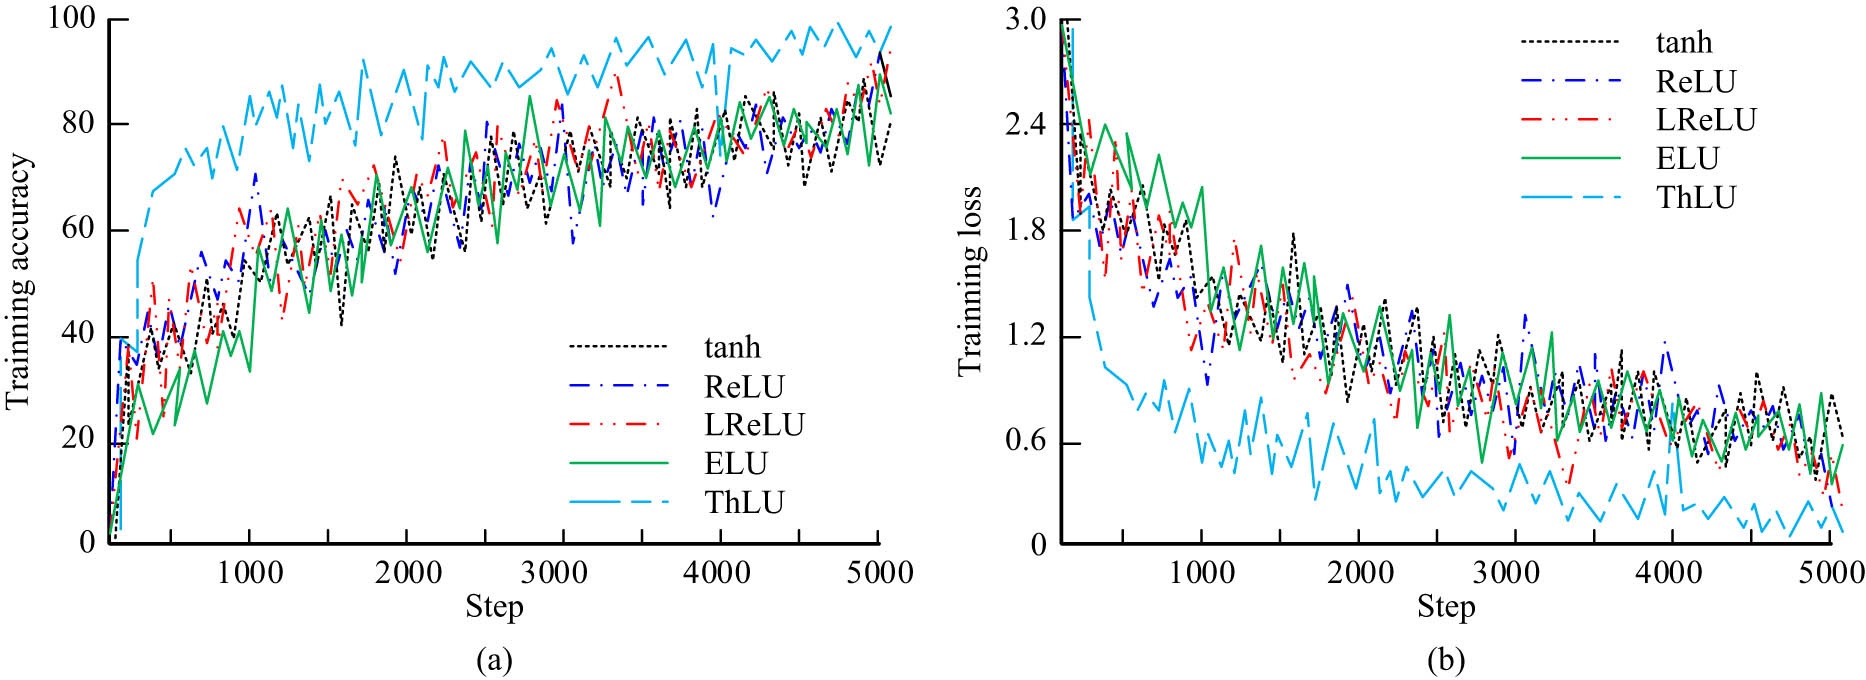
The training accuracy and loss rate curves of each activation function on the dataset. (a) Training accuracy curves of each activation function on the dataset. (b) Training loss curves for each activation function on the dataset.
Figure 10 shows the training accuracy, training loss, validation accuracy, and validation loss curves of a mechanical product dataset using a neural network model. The training accuracy and loss fluctuated around 0.97 and 0.068, respectively. The training accuracy, loss curve, validation accuracy, and loss curve all tended to stabilize at a step size of around 50, while the testing accuracy and loss were around 0.99 and 0.1, respectively. The overall accuracy was close to 1, and the loss was close to 0. It can be seen that the research model effectively handled data training and testing.

Training and validation curves for neural network models for mechanical product datasets. (a) Training accuracy curve. (b) Training loss curve. (c) Verification accuracy curve. (d) Verification loss curve.
To verify the accuracy and efficiency of the shortest path for mechanical product services under cloud manufacturing mode, Figure 11 shows the length and running time of the top 10 paths for different algorithms. The comparative algorithms used in this experiment were deletion algorithm (DA), traditional Dijkstra algorithm, and Yang M algorithm based on multi-attribute decision-making and BP neural network for server optimization in existing research. In Figure 11(a), the path length increased with the increase of the path, from 312 on the first shortest path to 340 on the tenth path, where the path length of the research algorithm was similar to most paths. In Figure 11(b), the running time of the research algorithm was the smallest, at 0.016 s, while the running time of DA was the longest, at 1.23 s. Overall, the research proposed that the algorithm had better performance.
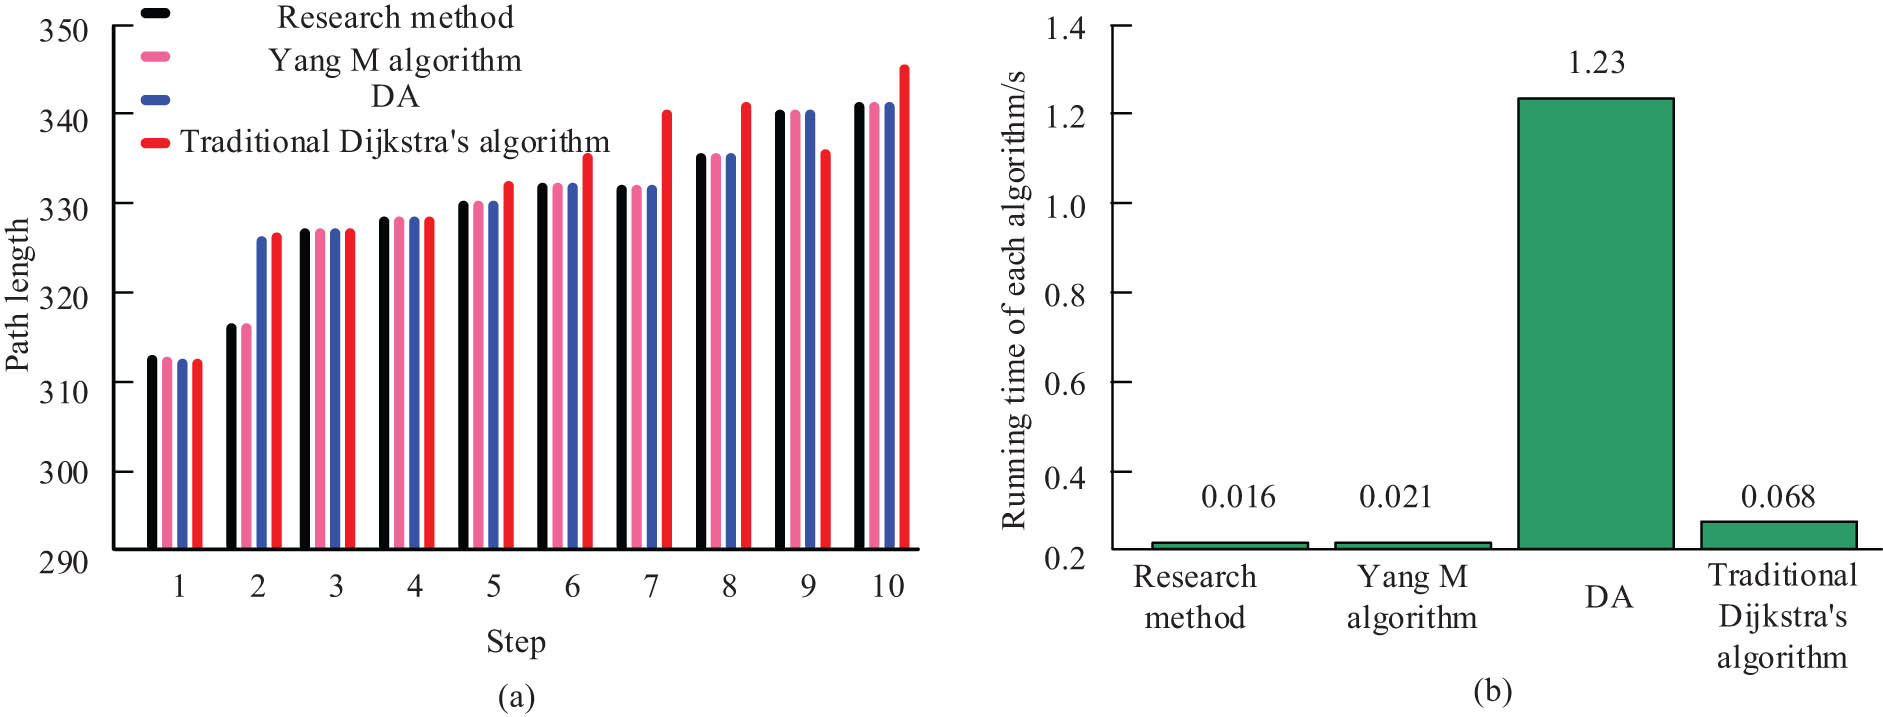
The top 10 path lengths and runtime for different algorithms. (a) The top 10 path lengths for different algorithms. (b) The top 10 shortest path running times for each algorithm.
4 Discussion and conclusion
In the cloud manufacturing mode, cloud computing, through its efficient processing capabilities, can process a large amount of data generated during the production and design process of mechanical products in real time, extract valuable information, and provide support for production and design decisions. To effectively feedback the mechanical product requirements of the demand side, a mechanical product design and manufacturing system based on CNN and server optimization was proposed. It combined the service discovery algorithm and optimization architecture, and adopted directed graph and Dijkstra algorithm for optimal path selection in cloud manufacturing. The research results indicated that the research network had a higher model training accuracy, maintaining around 0.9 when the step size was greater than 200, compared to the network model training accuracy, which remained around 0.83 when the step size was greater than 800. The model training loss of the research network approached 0 at a step size of around 20, while the model training loss of the comparative network approached 0 after a step size of 800, and the loss was always greater than the model training loss of the research network. It can be seen that models studying network training had more advantages in accuracy and loss. The path length of the research algorithm was similar to most paths, but the running time was the smallest, at 0.016 s, while DA had the longest running time, at 1.23 s. Overall, the research proposes that the algorithm has better performance, providing a reference for the optimization and manufacturing of mechanical product design services. However, further research is needed in the selection of optimal indicators and training of datasets, so further exploration of indicators and model training for mechanical products is needed in the future.
-
Funding information: This research received no specific grant from any funding agency in the public, commercial, or not-for-profit sectors.
-
Author contributions: Lei Tian: study design, data collection, statistical analysis, visualization, writing, and revision of the original draft. Ance Zhao: statistical analysis, revised the manuscript, led and supervised this study. All authors have accepted responsibility for the entire content of this manuscript and approved its submission.
-
Conflict of interest: Authors state no conflict of interest.
-
Data availability statement: All data generated or analyzed during this study are included in this published article.
References
[1] Qi C, Yan L, Yang S, Yuan S. An optimization procedure for concave preform design in rectangular tube hydroforming. Int J Adv Manuf Technol. 2022;120(7–8):5511–24.10.1007/s00170-022-09080-9Suche in Google Scholar
[2] Giarmas E, Tzetzis D. Optimization of die design for extrusion of 6xxx series aluminum alloys through finite element analysis: a critical review. Int J Adv Manuf Technol. 2022;119(9–10):5529–51.10.1007/s00170-022-08694-3Suche in Google Scholar
[3] Hossain MS, Chakrabortty RK, Sawah SE, Ryan MJ. A multi-objective bi-level leader-follower joint optimization for concurrent design of product family and assembly system. Comput Ind Eng. 2023;177(4):1–18.10.1016/j.cie.2023.109035Suche in Google Scholar
[4] Murugiah P, Muthuramalingam A, Anandamurugan S. A design of predictive manufacturing system in IoT-assisted Industry 4.0 using heuristic-derived deep learning. Int J Commun Syst. 2023;36(3):e5432.1–24.10.1002/dac.5432Suche in Google Scholar
[5] Zhou TL. Multi-objective optimization-based TOPSIS method for sustainable product design under epistemic uncertainty. Appl Soft Comput. 2021;98(1):1–12.10.1016/j.asoc.2020.106850Suche in Google Scholar
[6] Brito FMD, Junior GDC, Frazzon EM, Basto JPTV, Alcala SGS. Design approach for additive manufacturing in spare part supply chains. IEEE Trans Ind Inf. 2021;17(2):757–65.10.1109/TII.2020.3029541Suche in Google Scholar
[7] Li SY, Wei H, Yuan S, Zhu J, Zhang W. Collaborative optimization design of process parameter and structural topology for laser additive manufacturing. Chin J Aeronaut. 2023;36(1):456–67.10.1016/j.cja.2021.12.010Suche in Google Scholar
[8] Zhang Z, Xu D, Ostrosi E, Chen H. Optimization of the product-service system configuration based on a multilayer network. Sustainability. 2020;12(2):746–7.10.3390/su12020746Suche in Google Scholar
[9] Yang M, Zhu H, Guo K. Research on manufacturing service combination optimization based on neural network and multi-attribute decision making. Neural Comput Appl. 2020;32(3):1691–700.10.1007/s00521-019-04241-6Suche in Google Scholar
[10] Lee H, Ryu K. Product and design feature-based similar process retrieval and modeling for mold manufacturing. Int J Adv Manuf Technol. 2021;115(1):1–12.10.1007/s00170-020-06161-5Suche in Google Scholar
[11] Ortner P, Tay JZ, Wortmann T. Computational optimization for circular economy product design. J Clean Prod. 2022;362(15):1–12.10.1016/j.jclepro.2022.132340Suche in Google Scholar
[12] Ma X, Foong LK, Morasaei A, Ghabussi A, Lyu Z. Swarm-based hybridizations of neural network for predicting the concrete strength. Smart Struct Syst. 2020;26(2):241–51.Suche in Google Scholar
[13] Gao J, Koopialipoor M, Armaghani DJ, Ghabussi A, Baharom S, Morasaei A, et al. Evaluating the bond strength of FRP in concrete samples using machine learning methods. Smart Struct Syst. 2020;26(4):403–18.Suche in Google Scholar
[14] Dou B, Zhu Z, Merkurjev E, Ke L, Chen L, Jiang J, et al. Machine learning methods for small data challenges in molecular science. Chem Rev. 2023;123(13):8736–80.10.1021/acs.chemrev.3c00189Suche in Google Scholar PubMed PubMed Central
[15] Tajziehchi K, Ghabussi A, Alizadeh H. Control and optimization against earthquake by using genetic algorithm. J Appl Eng Sci. 2018;8(21):73–8.10.2478/jaes-2018-0010Suche in Google Scholar
[16] Zhang X, Ming X, Bao Y, Liao Y, Miao R. Networking-enabled product service system (N-PSS) in collaborative manufacturing platform for mass personalization model. Comput Ind Eng. 2022;163(2):1–16.10.1016/j.cie.2021.107805Suche in Google Scholar
[17] Marei M, Zaatari SE, Li W. Transfer learning enabled convolutional neural networks for estimating health state of cutting tools. Robot Comput Integr Manuf. 2021;71(4):1–11.10.1016/j.rcim.2021.102145Suche in Google Scholar
[18] Sheeba A, Rajalakshmi R, Maheswari BU, Ebenezer AS. Secure smart city application using webservice model and mayfly optimization-based lightweight CNN. Trans Emerg Telecommun Technol. 2024;35(1):e4896.1–22.10.1002/ett.4869Suche in Google Scholar
[19] Bose A, Garg R. Optimized CNN using manta-ray foraging optimization for brain tumour detection. Procedia Comput Sci. 2024;235(45):2187–95.10.1016/j.procs.2024.04.207Suche in Google Scholar
[20] Hong Z, Feng Y, Li Z, Hu B, Zhang Z, Tan J. Performance balance oriented product structure optimization involving heterogeneous uncertainties in intelligent manufacturing with an industrial network. Inf Sci. 2022;598(18):126.10.1016/j.ins.2022.03.063Suche in Google Scholar
[21] Bhosle K, Musande V. Evaluation of deep learning CNN model for recognition of Devanagari digit. Artif Intell Appl. 2023;1(2):114–18.10.47852/bonviewAIA3202441Suche in Google Scholar
[22] Ghaderi A, Hassani H, Khodaygan S. A Bayesian-reliability based multi-objective optimization for tolerance design of mechanical assemblies. Reliab Eng Syst Saf. 2021;213(9):1–12.10.1016/j.ress.2021.107748Suche in Google Scholar
[23] Mohammed KK, Hassanien AE, Afify HM. Classification of ear imagery database using Bayesian optimization based on CNN-LSTM architecture. J Digit Imaging. 2022;35(4):947–61.10.1007/s10278-022-00617-8Suche in Google Scholar PubMed PubMed Central
[24] Jamshed A, Mallick B, Bharti RK. Grey wolf optimization (GWO) with the convolutional neural network (CNN)-based pattern recognition system. Imaging Sci J. 2022;70(4):238–52.10.1080/13682199.2023.2166193Suche in Google Scholar
[25] Xu J, Song Z, Chen X, Yang Q. Design and optimization of high-density cryogenic supercritical hydrogen storage systems integrating with dual mixed refrigerant cycles. Energy. 2024;290(1):1–20.10.1016/j.energy.2023.130124Suche in Google Scholar
© 2025 the author(s), published by De Gruyter
This work is licensed under the Creative Commons Attribution 4.0 International License.
Artikel in diesem Heft
- Research Articles
- Generalized (ψ,φ)-contraction to investigate Volterra integral inclusions and fractal fractional PDEs in super-metric space with numerical experiments
- Solitons in ultrasound imaging: Exploring applications and enhancements via the Westervelt equation
- Stochastic improved Simpson for solving nonlinear fractional-order systems using product integration rules
- Exploring dynamical features like bifurcation assessment, sensitivity visualization, and solitary wave solutions of the integrable Akbota equation
- Research on surface defect detection method and optimization of paper-plastic composite bag based on improved combined segmentation algorithm
- Impact the sulphur content in Iraqi crude oil on the mechanical properties and corrosion behaviour of carbon steel in various types of API 5L pipelines and ASTM 106 grade B
- Unravelling quiescent optical solitons: An exploration of the complex Ginzburg–Landau equation with nonlinear chromatic dispersion and self-phase modulation
- Perturbation-iteration approach for fractional-order logistic differential equations
- Variational formulations for the Euler and Navier–Stokes systems in fluid mechanics and related models
- Rotor response to unbalanced load and system performance considering variable bearing profile
- DeepFowl: Disease prediction from chicken excreta images using deep learning
- Channel flow of Ellis fluid due to cilia motion
- A case study of fractional-order varicella virus model to nonlinear dynamics strategy for control and prevalence
- Multi-point estimation weldment recognition and estimation of pose with data-driven robotics design
- Analysis of Hall current and nonuniform heating effects on magneto-convection between vertically aligned plates under the influence of electric and magnetic fields
- A comparative study on residual power series method and differential transform method through the time-fractional telegraph equation
- Insights from the nonlinear Schrödinger–Hirota equation with chromatic dispersion: Dynamics in fiber–optic communication
- Mathematical analysis of Jeffrey ferrofluid on stretching surface with the Darcy–Forchheimer model
- Exploring the interaction between lump, stripe and double-stripe, and periodic wave solutions of the Konopelchenko–Dubrovsky–Kaup–Kupershmidt system
- Computational investigation of tuberculosis and HIV/AIDS co-infection in fuzzy environment
- Signature verification by geometry and image processing
- Theoretical and numerical approach for quantifying sensitivity to system parameters of nonlinear systems
- Chaotic behaviors, stability, and solitary wave propagations of M-fractional LWE equation in magneto-electro-elastic circular rod
- Dynamic analysis and optimization of syphilis spread: Simulations, integrating treatment and public health interventions
- Visco-thermoelastic rectangular plate under uniform loading: A study of deflection
- Threshold dynamics and optimal control of an epidemiological smoking model
- Numerical computational model for an unsteady hybrid nanofluid flow in a porous medium past an MHD rotating sheet
- Regression prediction model of fabric brightness based on light and shadow reconstruction of layered images
- Dynamics and prevention of gemini virus infection in red chili crops studied with generalized fractional operator: Analysis and modeling
- Qualitative analysis on existence and stability of nonlinear fractional dynamic equations on time scales
- Fractional-order super-twisting sliding mode active disturbance rejection control for electro-hydraulic position servo systems
- Analytical exploration and parametric insights into optical solitons in magneto-optic waveguides: Advances in nonlinear dynamics for applied sciences
- Bifurcation dynamics and optical soliton structures in the nonlinear Schrödinger–Bopp–Podolsky system
- User profiling in university libraries by combining multi-perspective clustering algorithm and reader behavior analysis
- Review Article
- Haar wavelet collocation method for existence and numerical solutions of fourth-order integro-differential equations with bounded coefficients
- Special Issue: Nonlinear Analysis and Design of Communication Networks for IoT Applications - Part II
- Silicon-based all-optical wavelength converter for on-chip optical interconnection
- Research on a path-tracking control system of unmanned rollers based on an optimization algorithm and real-time feedback
- Analysis of the sports action recognition model based on the LSTM recurrent neural network
- Industrial robot trajectory error compensation based on enhanced transfer convolutional neural networks
- Research on IoT network performance prediction model of power grid warehouse based on nonlinear GA-BP neural network
- Interactive recommendation of social network communication between cities based on GNN and user preferences
- Application of improved P-BEM in time varying channel prediction in 5G high-speed mobile communication system
- Construction of a BIM smart building collaborative design model combining the Internet of Things
- Optimizing malicious website prediction: An advanced XGBoost-based machine learning model
- Economic operation analysis of the power grid combining communication network and distributed optimization algorithm
- Sports video temporal action detection technology based on an improved MSST algorithm
- Internet of things data security and privacy protection based on improved federated learning
- Enterprise power emission reduction technology based on the LSTM–SVM model
- Construction of multi-style face models based on artistic image generation algorithms
- Research and application of interactive digital twin monitoring system for photovoltaic power station based on global perception
- Special Issue: Decision and Control in Nonlinear Systems - Part II
- Animation video frame prediction based on ConvGRU fine-grained synthesis flow
- Application of GGNN inference propagation model for martial art intensity evaluation
- Benefit evaluation of building energy-saving renovation projects based on BWM weighting method
- Deep neural network application in real-time economic dispatch and frequency control of microgrids
- Real-time force/position control of soft growing robots: A data-driven model predictive approach
- Mechanical product design and manufacturing system based on CNN and server optimization algorithm
- Application of finite element analysis in the formal analysis of ancient architectural plaque section
- Research on territorial spatial planning based on data mining and geographic information visualization
- Fault diagnosis of agricultural sprinkler irrigation machinery equipment based on machine vision
- Closure technology of large span steel truss arch bridge with temporarily fixed edge supports
- Intelligent accounting question-answering robot based on a large language model and knowledge graph
- Analysis of manufacturing and retailer blockchain decision based on resource recyclability
- Flexible manufacturing workshop mechanical processing and product scheduling algorithm based on MES
- Exploration of indoor environment perception and design model based on virtual reality technology
- Tennis automatic ball-picking robot based on image object detection and positioning technology
- A new CNN deep learning model for computer-intelligent color matching
- Design of AR-based general computer technology experiment demonstration platform
- Indoor environment monitoring method based on the fusion of audio recognition and video patrol features
- Health condition prediction method of the computer numerical control machine tool parts by ensembling digital twins and improved LSTM networks
- Establishment of a green degree evaluation model for wall materials based on lifecycle
- Quantitative evaluation of college music teaching pronunciation based on nonlinear feature extraction
- Multi-index nonlinear robust virtual synchronous generator control method for microgrid inverters
- Manufacturing engineering production line scheduling management technology integrating availability constraints and heuristic rules
- Analysis of digital intelligent financial audit system based on improved BiLSTM neural network
- Attention community discovery model applied to complex network information analysis
- A neural collaborative filtering recommendation algorithm based on attention mechanism and contrastive learning
- Rehabilitation training method for motor dysfunction based on video stream matching
- Research on façade design for cold-region buildings based on artificial neural networks and parametric modeling techniques
- Intelligent implementation of muscle strain identification algorithm in Mi health exercise induced waist muscle strain
- Optimization design of urban rainwater and flood drainage system based on SWMM
- Improved GA for construction progress and cost management in construction projects
- Evaluation and prediction of SVM parameters in engineering cost based on random forest hybrid optimization
- Museum intelligent warning system based on wireless data module
- Optimization design and research of mechatronics based on torque motor control algorithm
- Special Issue: Nonlinear Engineering’s significance in Materials Science
- Experimental research on the degradation of chemical industrial wastewater by combined hydrodynamic cavitation based on nonlinear dynamic model
- Study on low-cycle fatigue life of nickel-based superalloy GH4586 at various temperatures
- Some results of solutions to neutral stochastic functional operator-differential equations
- Ultrasonic cavitation did not occur in high-pressure CO2 liquid
- Research on the performance of a novel type of cemented filler material for coal mine opening and filling
- Testing of recycled fine aggregate concrete’s mechanical properties using recycled fine aggregate concrete and research on technology for highway construction
- A modified fuzzy TOPSIS approach for the condition assessment of existing bridges
- Nonlinear structural and vibration analysis of straddle monorail pantograph under random excitations
- Achieving high efficiency and stability in blue OLEDs: Role of wide-gap hosts and emitter interactions
- Construction of teaching quality evaluation model of online dance teaching course based on improved PSO-BPNN
- Enhanced electrical conductivity and electromagnetic shielding properties of multi-component polymer/graphite nanocomposites prepared by solid-state shear milling
- Optimization of thermal characteristics of buried composite phase-change energy storage walls based on nonlinear engineering methods
- A higher-performance big data-based movie recommendation system
- Nonlinear impact of minimum wage on labor employment in China
- Nonlinear comprehensive evaluation method based on information entropy and discrimination optimization
- Application of numerical calculation methods in stability analysis of pile foundation under complex foundation conditions
- Research on the contribution of shale gas development and utilization in Sichuan Province to carbon peak based on the PSA process
- Characteristics of tight oil reservoirs and their impact on seepage flow from a nonlinear engineering perspective
- Nonlinear deformation decomposition and mode identification of plane structures via orthogonal theory
- Numerical simulation of damage mechanism in rock with cracks impacted by self-excited pulsed jet based on SPH-FEM coupling method: The perspective of nonlinear engineering and materials science
- Cross-scale modeling and collaborative optimization of ethanol-catalyzed coupling to produce C4 olefins: Nonlinear modeling and collaborative optimization strategies
- Unequal width T-node stress concentration factor analysis of stiffened rectangular steel pipe concrete
- Special Issue: Advances in Nonlinear Dynamics and Control
- Development of a cognitive blood glucose–insulin control strategy design for a nonlinear diabetic patient model
- Big data-based optimized model of building design in the context of rural revitalization
- Multi-UAV assisted air-to-ground data collection for ground sensors with unknown positions
- Design of urban and rural elderly care public areas integrating person-environment fit theory
- Application of lossless signal transmission technology in piano timbre recognition
- Application of improved GA in optimizing rural tourism routes
- Architectural animation generation system based on AL-GAN algorithm
- Advanced sentiment analysis in online shopping: Implementing LSTM models analyzing E-commerce user sentiments
- Intelligent recommendation algorithm for piano tracks based on the CNN model
- Visualization of large-scale user association feature data based on a nonlinear dimensionality reduction method
- Low-carbon economic optimization of microgrid clusters based on an energy interaction operation strategy
- Optimization effect of video data extraction and search based on Faster-RCNN hybrid model on intelligent information systems
- Construction of image segmentation system combining TC and swarm intelligence algorithm
- Particle swarm optimization and fuzzy C-means clustering algorithm for the adhesive layer defect detection
- Optimization of student learning status by instructional intervention decision-making techniques incorporating reinforcement learning
- Fuzzy model-based stabilization control and state estimation of nonlinear systems
- Optimization of distribution network scheduling based on BA and photovoltaic uncertainty
- Tai Chi movement segmentation and recognition on the grounds of multi-sensor data fusion and the DBSCAN algorithm
- Special Issue: Dynamic Engineering and Control Methods for the Nonlinear Systems - Part III
- Generalized numerical RKM method for solving sixth-order fractional partial differential equations