
Enterprise power emission reduction technology based on the LSTM–SVM model
-
Kun Li
 ,
Meng Su
,
Meng Su

Abstract
With the increasing emphasis on environmental protection in various regions, reducing electricity emissions for enterprises has become a popular development trend. The research aims to design a machine learning-based power data warning method to assist enterprises in reducing emissions and controlling costs. In terms of research methods, load type analysis is first conducted for industrial enterprises, followed by the introduction of long short-term memory (LSTM) networks to build a basic model for power data prediction. Support vector machines are used to optimize the model’s large sample requirements, and the two models are integrated to improve accuracy. Key research has found that the proposed model performed excellently. The minimum relative prediction error was 0.20%, the maximum error fluctuation was 0.78%, the accuracy was 12.85% higher than the LSTM model, and the recall was 11.60% higher. On 220 kV, the testing time was 17.5% faster than the data prediction model and 36.0% faster than the multi-task learning model, and the accuracy was always the best. Simulation experiments showed that after data warning, carbon emissions could be reduced by up to 48.26%, and electricity costs could be reduced by up to 60.48%. The machine learning-based power data warning method proposed in this study has important practical application value and can effectively help enterprises achieve emission reduction and cost control goals.
1 Introduction
In light of the mounting urgency of environmental degradation, the reduction of emissions by enterprises has emerged as a pivotal concern in the global response to climate change and the pursuit of sustainable development. The increasing awareness of environmental protection and strict regulation of carbon emissions by governments worldwide have put increasing pressure on enterprises to take effective measures to reduce greenhouse gas emissions, especially carbon dioxide (CO2). Among the numerous fields of emission reduction, the role of electricity as an energy source for a variety of enterprises is of particular significance. This is because electricity production and consumption represent a significant source of global CO2 emissions [1,2]. Therefore, the optimization and efficient management of electricity consumption by enterprises are directly related to the size of their overall carbon footprint. In light of this challenge, research on power data prediction (PDP) has emerged as a prominent area of investigation. An accurate PDP can assist enterprises in the efficient arrangement of electricity usage, the reduction of unnecessary energy waste, and the considerable reduction of carbon emissions and electricity costs. However, predicting electricity data is a complex task, involving numerous uncertainties and variables. Traditional methods, such as time series analysis and regression models, have limitations when dealing with complex and nonlinear electricity data. Time series analysis is often based on the assumption of linear relationships in historical data, making it difficult to capture the intricate time-dependent relationships and nonlinear characteristics of electricity data. Regression models can be affected by data noise and outliers, leading to inaccurate predictions.
In recent years, with the rapid development of artificial intelligence technology, machine learning-based PDP methods have gradually become a research hotspot. Support vector machine (SVM) is widely used for predicting power data due to its advantages in handling small samples, nonlinear, and high-dimensional datasets [3,4]. SVM divides data into different categories by finding the optimal hyperplane, which can effectively handle nonlinear problems and maintain good performance even in high-dimensional data. However, SVM also faces challenges in accuracy and efficiency when processing extremely complex power system data. Power system data are highly dynamic and complex, and SVM may not be able to fully capture long-term dependencies and complex temporal patterns in the data. Long short-term memory (LSTM), as a special type of recurrent neural network (RNN), has a strong modeling ability for data with time series characteristics and can capture long-term dependencies in power data. LSTM can better handle long-term dependencies in time series data by introducing gating mechanisms to remember information from a longer period in the past and updating the memory based on current input and past states. The fusion of LSTM and SVM can combine the advantages of SVM in small sample processing with the advantages of LSTM in time series modeling, making up for the shortcomings of all parties and dealing with extremely complex power system data, thereby more accurately predicting power data and helping enterprises reduce emissions. The research content consists of four sections. Section 1 introduces the emission reduction and research background of enterprises. Section 2 designs the research methods based on machine learning. Section 3 verifies the effectiveness of the model through experiments. Section 4 summarizes the experimental results.
2 Related works
The key to reducing electricity emissions for enterprises lies in the prediction and analysis of electricity data. Guo et al. proposed a novel aggregated supply curve (ASC) prediction model based on LSTM for high-dimensional unstructured electricity market data that is difficult to process using traditional methods. By using exemplary data integration methods and feature extraction techniques, the complexity of ASC was simplified, and the prediction accuracy was improved through training and testing using market data from an independent system operator [5]. Liu et al. proposed a mobility optimization load forecasting method based on multi-task learning (MTL) and LSTM, aiming to alleviate the instability of short-term load forecasting caused by the epidemic. By employing horizontal and vertical data validation in conjunction with Shapley additive interpretation techniques, the authors have demonstrated that their methods yield notable enhancements in accuracy and robustness [6]. Li et al. proposed a new long-term electricity load forecasting model that considers the complex interaction between carbon neutrality goals and system variables. The SD model optimized through a new system and information feedback mechanism could more comprehensively and accurately capture the dynamics of electricity consumption, guiding power system planning in the context of carbon neutrality [7]. Liu et al. proposed a household electricity demand prediction model that combines time and behavioral characteristics to improve the accuracy of household electricity demand prediction. This model combined convolutional neural networks and LSTM to effectively manage data input information from different dimensions. The prediction accuracy and universality of the proposed method have been improved by 20.69 and 25.28%, respectively [8].
Hadjout et al. developed a new method based on ensemble learning for predicting monthly electricity consumption in economic sectors. It combined LSTM, RNN, and time convolutional network and demonstrated superior performance over traditional models in 2,000 customers and 14-year data testing in Bejaya, Algeria [9]. Obst et al. introduced two methods to adapt to generalized additive models in response to changes in electricity consumption patterns during the COVID-19 pandemic. It quickly adapted to new power consumption patterns by using Kalman filters and fine-tuning, significantly reducing errors in predictions during the French lockdown period [10]. Banik et al. proposed a PDP method based on ensemble machine learning, which constructs integrated systems through a single random forest and XGBoost. The prediction time for the design method could reach 1 month. Their integrated model improved the prediction accuracy by 15–29% [11]. Wei et al. believed that short-term electricity load forecasting was helpful for grid operation and therefore designed a short-term electricity consumption forecasting method based on feature processing and mixed modeling. Using maximum information coefficient and variational mode decomposition to analyze the feature correlation of power data, the prediction accuracy showed a positive correlation with step size [12]. To assess the landslide susceptibility in the Simla district of Northwest India, Sharma et al. integrated three machine learning models: random forest, multi-layer perceptron, and sequential minimum optimization regression. It was found that all indexes of the hybrid machine learning model were better than the single classifier in terms of landslide susceptibility [13]. To solve the problems in human interaction recognition, Vesal et al. used hybrid deep learning and machine learning models to improve classification accuracy and generalization ability. The results showed that the research method had up to 95.45% accuracy in classifying human interactions. Mixed methods enabled effective learning, thus enabling highly accurate performance across different interaction types [14]. To promote spatial heterogeneity, Amadou et al. proposed a hybrid machine learning model with a competitive algorithm based on a random forest regressor and a convolutional neural network. The results showed that the mixed model produced lower error with a deviation of 53.65% compared with the random forest model and 63.24% from the convolutional neural network model [15].
In summary, numerous studies tend to choose LSTM models for PDP due to their superior temporal characteristics and better control over data patterns. However, the LSTM algorithm also has limitations on sample requirements. Therefore, this study proposes to use SVM models for fusion to improve the prediction accuracy of the model.
3 Design of an enterprise power emission reduction system based on a machine learning optimization algorithm
In response to the demand for electricity emission reduction in enterprises, this study designs an electricity data early warning (EDEW) system using machine learning algorithms. First, a load-type analysis is conducted for industrial enterprises that are difficult to predict. Then, deep learning is introduced to build the basic PDP model. The introduction of SVM has enabled the optimization of the model’s requirements for a large sample size, and the integration of two models has resulted in an improvement in the model’s accuracy.
3.1 The law and classification of electricity load in enterprises
The concept of energy conservation and emission reduction is becoming increasingly sophisticated in major enterprises. Electricity is an indispensable component of many industries and has become an important goal for enterprises to reduce emissions. The objective of analyzing electricity data for emission reduction is to achieve three key outcomes: the timely prediction of electricity consumption data, the provision of early warning for peak electricity, and the establishment of a reference significance for subsequent electricity consumption plans of enterprises in the form of data. These results collectively contribute to the control of electricity consumption. The electricity consumption patterns and loads vary among different enterprises, such as large industrial enterprises, which usually require their machines to operate with electricity for a long time. This also leads to poor regularity and planning of electricity consumption in industrial enterprises, making it more difficult for enterprises to provide electricity warnings. Therefore, this study takes a certain steel enterprise as an example to analyze the composition and patterns of its electricity consumption load and divides it into two categories: shock load and stable load. After predicting them separately, they are fused to achieve data warning. The visualization curves of different loads are shown in Figure 1.
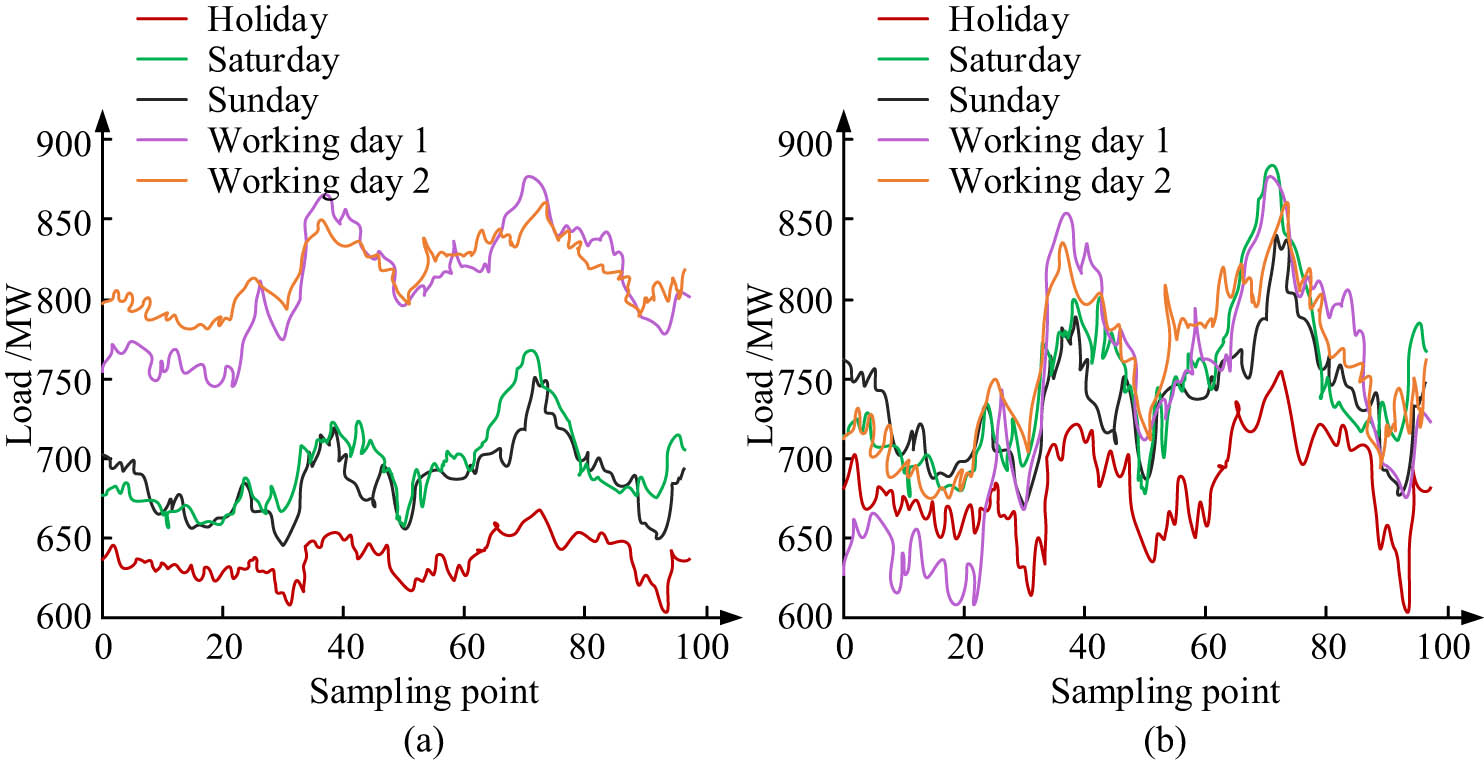
Comparison of shock load and stable load curves: (a) impact load and (b) steady load.
The data in Figure 1 are from the monitoring and statistics of power load in a certain area. Electricity needs to be continuously supplied in steel enterprises, which requires that electricity can be predicted in the short term. Short-term predictions are easily influenced by multiple factors, leading to sudden declines or increases. Consequently, when formulating projections regarding future data, it is imperative to consider not only the prospective trajectory but also to integrate historical data and assess the influence of production under disparate seasonal, climatic, and other conditions. This study first analyzes the shock load, but due to its randomness and time-varying nature, it cannot be directly described through mathematical models. Therefore, this study chooses the covariance correlation coefficient method for calculation and further analyzes the factors related to electricity consumption characteristics, as shown in the following equation [16,17]:
In Eq. (1),
In Eq. (2),
Excluding the steel price factor, electricity prices, climate, and other factors can all have an impact on the electricity load, and the same method should be used for calculation. To ensure the accuracy of the calculation results, this study introduces the Pearson algorithm and conducts correlation analysis to ensure calculation accuracy. Abundant data indicate that the impact of electricity load on enterprises is more closely related to steel prices, temperature, humidity, and day types. The prediction difficulty of stable load is relatively low compared to shock load. The results of this study using the same method for operational analysis indicate that the correlation between stable electricity load and steel price, daily type, electricity price, and temperature is higher. Based on the above analysis, the shock load input and stable load input of the model can be obtained, as shown in Figure 2.
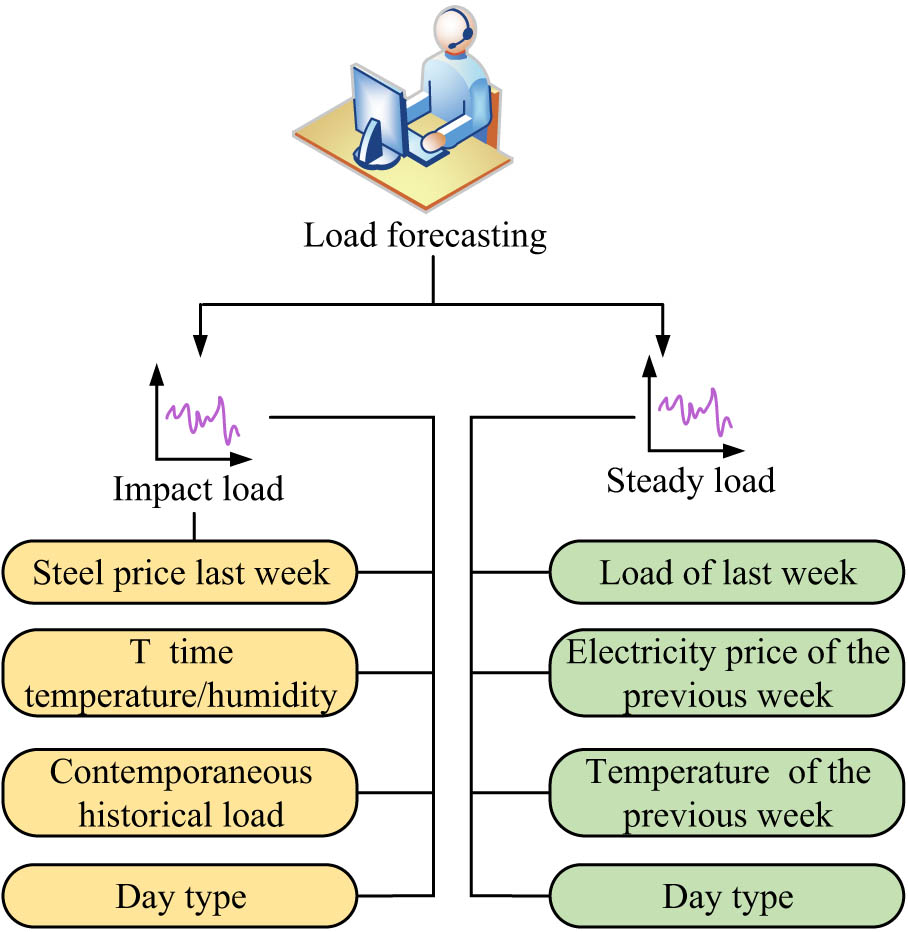
Shock load input and stable load input of the model.
In Figure 2, the historical data in the shock load include the simultaneous load for the first 30 days of the prediction and the load at each time point for the first 24 h of the prediction. The day types of shock load are classified according to working days and holidays, represented by 1 and 0, respectively. The historical load data of stable load refer to the data from the week before the forecast. The day type also represents the data from the week before the forecast, with the same symbol as the shock load (Table 1).
Input factors for impact load and stable load
| Load type | Input factors | Data sources | Frequency of sampling |
|---|---|---|---|
| Impact load | Steel prices last week | Authoritative steel market data platform (such as my steel network, etc.) | Updated daily |
| Predict the load at the same time in the first 30 days | Power system load monitoring database | Updated daily | |
| Predict the load at each moment in the first 24 h | Power system load monitoring database | Data is collected per minute (aggregated to hourly data as required) | |
| Time (temperature/humidity) | Meteorological monitoring station or meteorological data service platform | Updated hourly | |
| Historical load over the same period | Historical load data of the power system is archived | Organize by year, day type, and time point | |
| Day type | Calendar information | ||
| Steady load | Last week’s load | Power system load monitoring database | Collected hourly (aggregated to the average value of the corresponding time period per day) |
| Last week’s electricity prices | Electricity market trading data platform | Collected hourly (aggregated to the average value of the corresponding time period per day) | |
| Last week’s temperature | Meteorological monitoring station or meteorological data service platform | Collected hourly (aggregated to the average value of the corresponding time period per day) | |
| Day type | Calendar information and related data agreements | — |
3.2 Construction of a basic PDP system based on deep learning
This study chooses LSTM for model construction. An LSTM network represents a variant of an RNN. It combines the memory storage function of traditional RNN models with a new long-term and short-term memory function. The LSTM model optimizes the long-term dependency phenomenon of the RNN model through input gates, forget gates, etc. The “gate” aims to control the state of memory, storage time, and distance data, and its overall structure is shown in Figure 3.
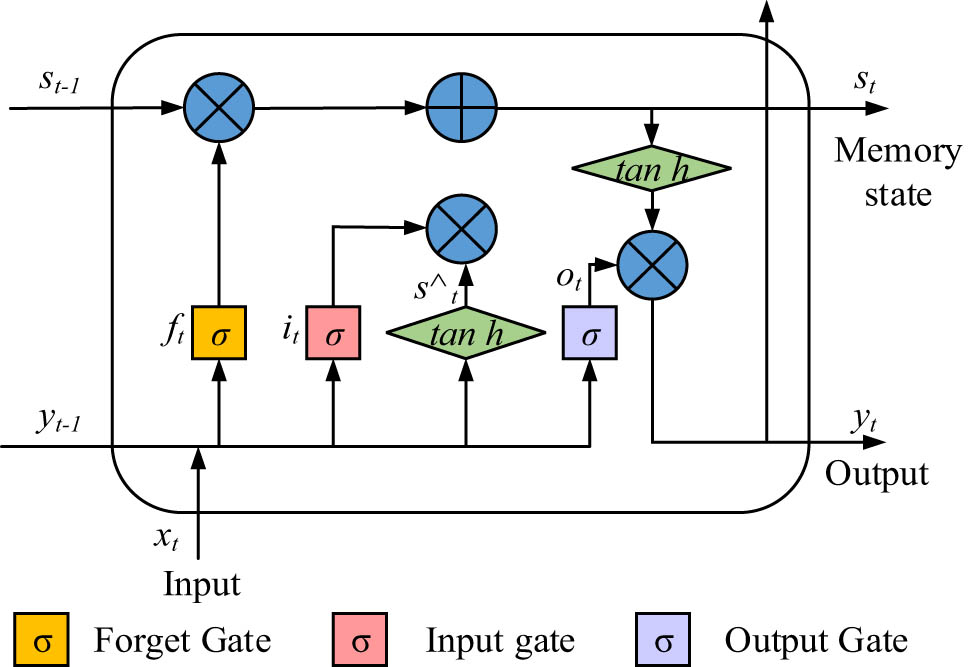
LSTM structure.
In Figure 3, the input gate
In Eq. (4),
In Eq. (5),
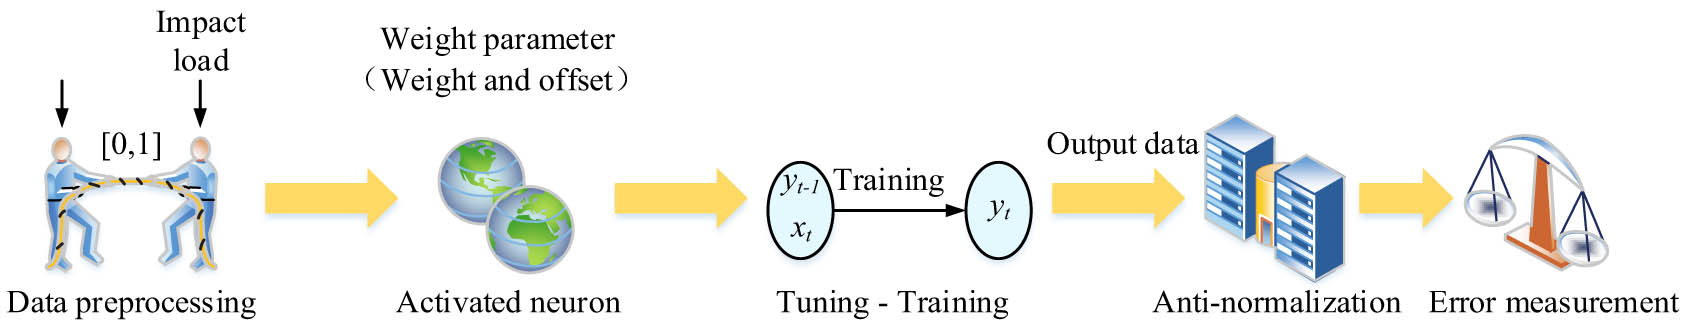
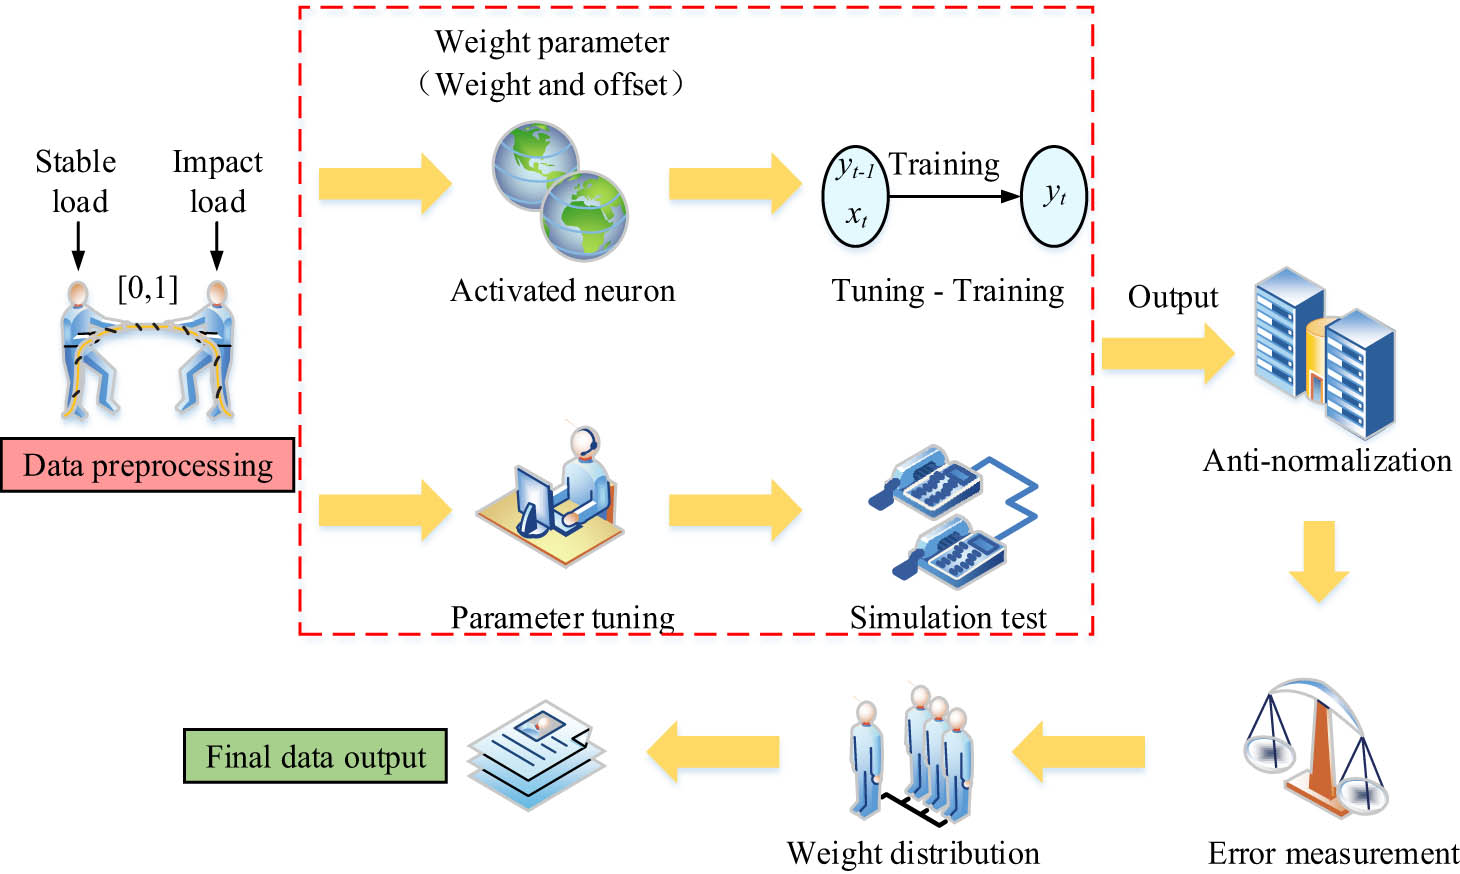
LSTM operation process analysis.
Figure 4 illustrates the preprocessing stage, which aims to attribute impact and stabilize the load data from 0 to 1. Subsequently, the neurons are activated, a process associated with the weight parameter, specifically weight
In Eq. (6),
3.3 Design of a combined EDEW system based on SVM optimization
SVM is a generalized linear classifier that performs binary classification on data through supervised learning. It conducts machine learning by minimizing structural risk, and the learning strategy is to maximize the interval. The SVM model meets the requirements of small sample learning and has high robustness, which compensates for the large sample demand of LSTM systems. Combined with structural risk minimization and fitting error, the objective function
In Eq. (7),
In Eq. (8),
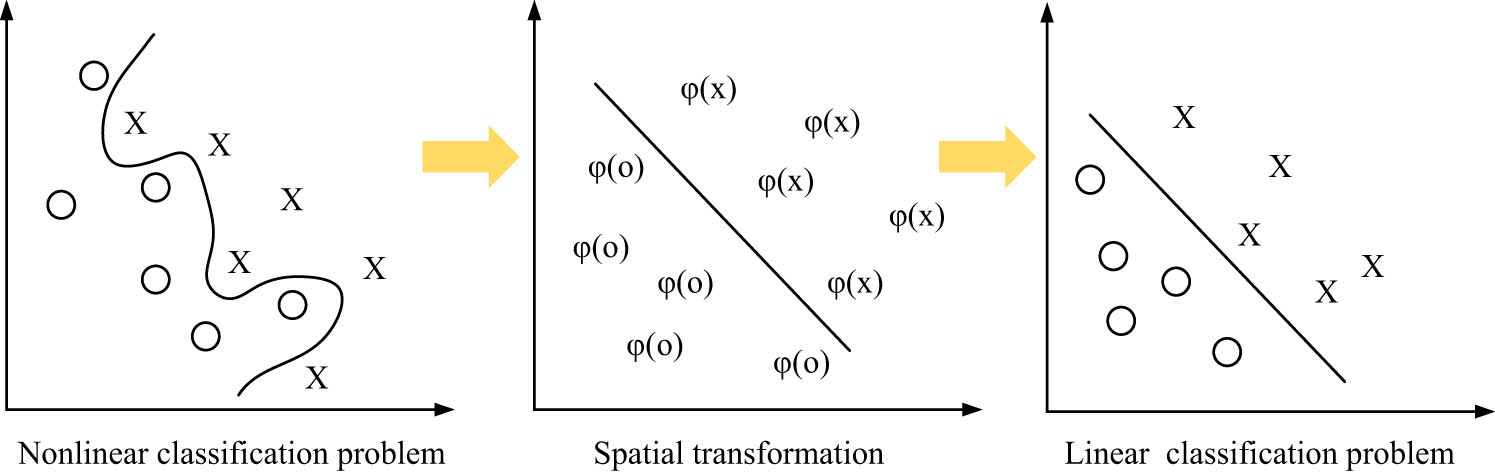
Transformation of nonlinear problems in the SVM model.
Integrating the LSTM model and the SVM model can achieve complementary independent models. For example, the LSTM model compensates for the temporal defects of the SVM model, while the SVM model compensates for the shortcomings of the LSTM model in sample requirements. This study introduces a fuzzy logic algorithm for the weight allocation of each model. The principle is to calculate the difference between the predicted value of the model and the estimated value from the previous moment and select the allocation situation with the lowest estimation deviation. The predicted value of the shock load is shown in the following equation [20,21,22,23]:
In Eq. (9),
In Eq. (10),
In Eq. (11),
LSTM–SVM combined EDEW system.
First, the data need to be preprocessed separately in the LSTM model and SVM model, that is normalization. The number of hidden layers and neurons in LSTM directly affects the training speed and final accuracy. An increase in the number of hidden layers and neurons results in greater complexity of the model, which may not necessarily lead to enhanced accuracy of the network. It is found that the prediction accuracy improves significantly with the increase of layers, but it is also prone to overfitting when the number of layers is too high. The SVM model is adjusted by the test method. The parameters include the penalized parameter best value, the kernel function, and the insensitive loss function. To avoid overfitting and underfitting the model, the study uses the K-CV method to train the sample data. The trial method is employed to enable the parameters and penalty factors to ascertain the optimal range, after which a small-range test is conducted. After multiple trials, the value is determined [2,3,4]. Finally, the prediction results of the two models are calculated through the weight allocation, and the final predicted value is output. The weight allocation in the LSTM–SVM integrated model is based on the ratio of the difference between the LSTM and SVM algorithms and the predicted value of the previous moment. This weight can be used to identify the inflection point of the present moment and the previous moment. The study obtains the load prediction results of the combined algorithm by calculating the weights of all samples at the prediction time. When the inflection point is large, the trusted SVM algorithm predicts the results, while the LSTM algorithm is the main one.
In the data preprocessing module of the system, the input is raw impact load and stable load data, which are normalized and output into a unified format of data. The input of the parameter tuning module is preprocessed data, and the parameters of the LSTM and SVM models are determined through experimental methods to output the optimal parameter combination. The training module uses optimized parameters and data to train LSTM and SVM models, respectively, and outputs the trained models. The simulation testing module takes the trained model and test data as inputs and outputs the prediction results of the two models. Finally, the prediction results are calculated through weight allocation, and the final prediction value of the combined model is output. The weights are obtained based on the weights of all samples within the prediction time.
4 Performance and practical application analysis of LSTM–SVM combined with EDEW system
To verify the reliability of the LSTM–SVM model in terms of PDP and enterprise emission reduction performance, this section is divided into two parts to conduct experiments on the model. First, an experimental analysis of the performance of the model itself is conducted, and the superiority of the designed model is analyzed by comparing it with the error values and accuracy of the pre-optimized model. Subsequently, the model is compared with other data prediction models to verify its emission reduction benefits in practical application simulations.
4.1 Performance optimization effect based on the LSTM–SVM model
To verify the effectiveness of the research algorithm, experimental analysis is first conducted on the performance of the model itself. Table 2 shows the specific experimental environment parameters.
Experimental environment settings
| Name | Settings |
|---|---|
| Operating system | ThinkPad E440 Ubuntu 16.04 |
| Graphics card | GeForce GTX TITAN Xp |
| CPU | InterR CoreTM i7-5930K CPU |
| GPU | GTX 2070 Super |
| Deep learning framework | PyTorch |
| Data sampling preprocessing | TSN open source |
| Learning rate | 0.05 |
| Penalty parameter
|
0.71 |
| Gamma parameter | 0.35 |
| Epochs | 5,000 |
This study first takes the electricity data of a steel manufacturing plant for the past week as an example to analyze the model load prediction error. The performance comparison of the model before and after combination is shown in Figure 7.
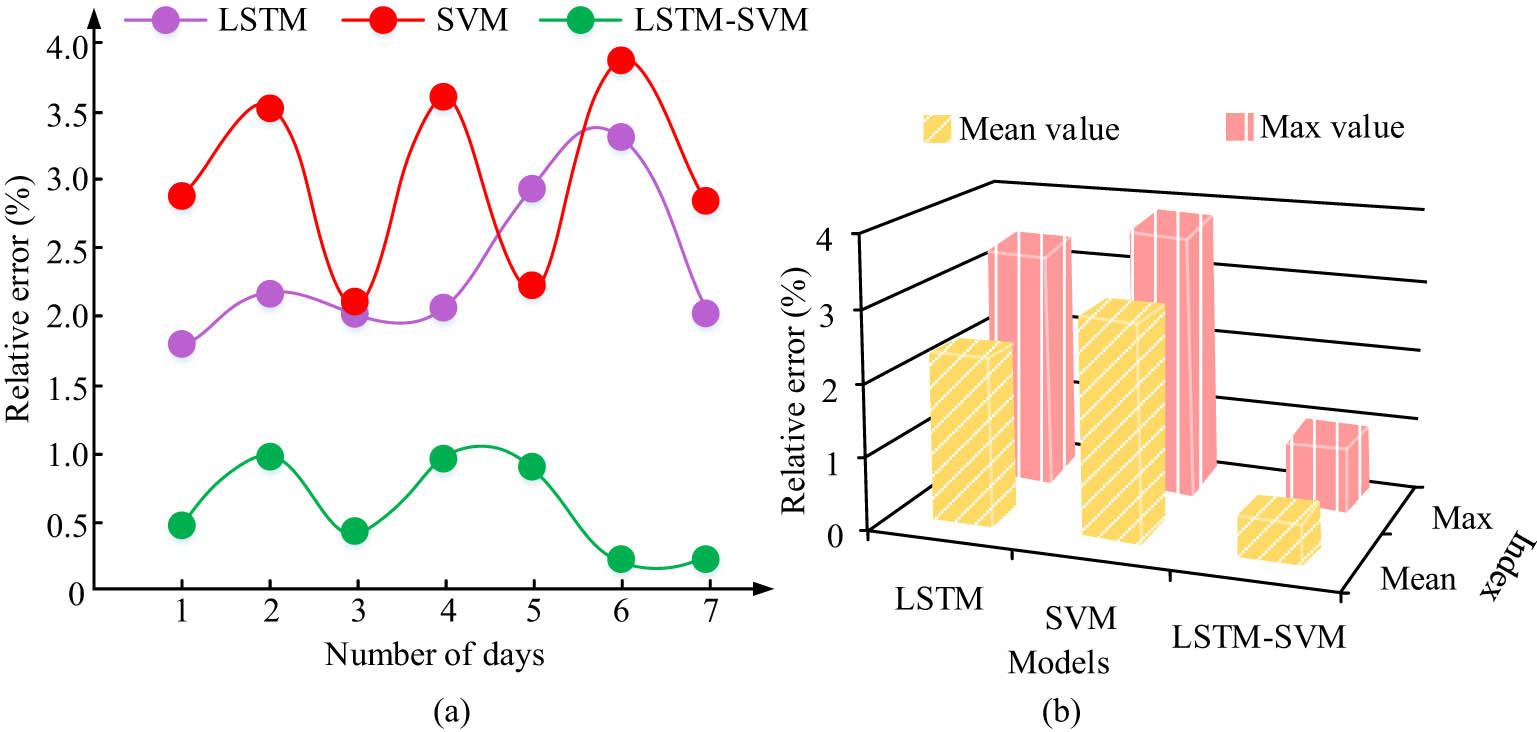
Comparison of model prediction errors before and after optimization: (a) relative error variation line and (b) relative error of each model.
Figure 7(a) shows the variation curve of the relative prediction error (RPE) of the model before and after optimization. The RPE of both LSTM and SVM models before the combination is greater than 1%. Among them, the independent SVM model has the worst prediction performance, with its lowest RPE reaching 2.06%. Compared to the LSTM–SVM model, the minimum RPE is 0.20%, which is 1.86% higher. The RPE fluctuation of LSTM–SVM is also the smallest, with a maximum fluctuation of 0.78%. Compared to LSTM and SVM, the maximum RPE fluctuations are reduced by 1.55 and 1.04%, respectively. In Figure 7(b), this study specifically compares the maximum RPE and average RPE of each model. LSTM–SVM has significant differences compared to other models in both indicators. The maximum RPE of the research model is also less than 1%, a decrease of 2.64% compared to the other two models. The average RPE of the research model is 0.61%, a decrease of 2.11% compared to the other two models. In summary, the LSTM–SVM model that has been optimized through combination has significantly improved prediction performance compared to before optimization.
The study then selects the bidirectional LSTM network (BiLSTM), gated recurrent unit (GRU), bidirectional GRU (BiGRU), and DeepAR probabilistic forecasting algorithm (DeepAR) as alternative algorithms to the LSTM–SVM model. These algorithms are trained and tested on the same historical power dataset, which includes information such as power load during different production periods and under various equipment operating conditions. This is done to evaluate the performance of the LSTM–SVM model, with the results presented in Table 3.
Comparison of the performance of different models
| Algorithm | MSE | MAE | R 2 |
|---|---|---|---|
| LSTM–SVM | 0.12 | 0.25 | 0.92 |
| BiLSTM | 0.18 | 0.32 | 0.85 |
| GRU | 0.16 | 0.30 | 0.88 |
| BiGRU | 0.15 | 0.28 | 0.90 |
| DeepAR | 0.14 | 0.27 | 0.91 |
As shown in Table 3, the LSTM–SVM model demonstrates significant advantages across all evaluation metrics. It has the lowest mean square error (MSE) and mean absolute error (MAE), indicating that the prediction values are closer to the actual values, thereby offering higher accuracy. The coefficient of determination (R 2) is closest to 1, suggesting that the model fits the data well and effectively explains the patterns in power data. In comparison, while BiLSTM, GRU, BiGRU, and DeepAR also perform well, they fall slightly short in terms of precision and fit. This indicates that the LSTM–SVM model combines the advantages of LSTM in processing sequence data with the classification and regression capabilities of SVM and can more effectively capture complex features and patterns in power data. Consequently, it offers better performance and applicability in power data early warning for corporate emission reduction.
This study further compares the precision–recall (PR) and ROC curves of the LSTM model and the combination model, and the results are shown in Figure 8.
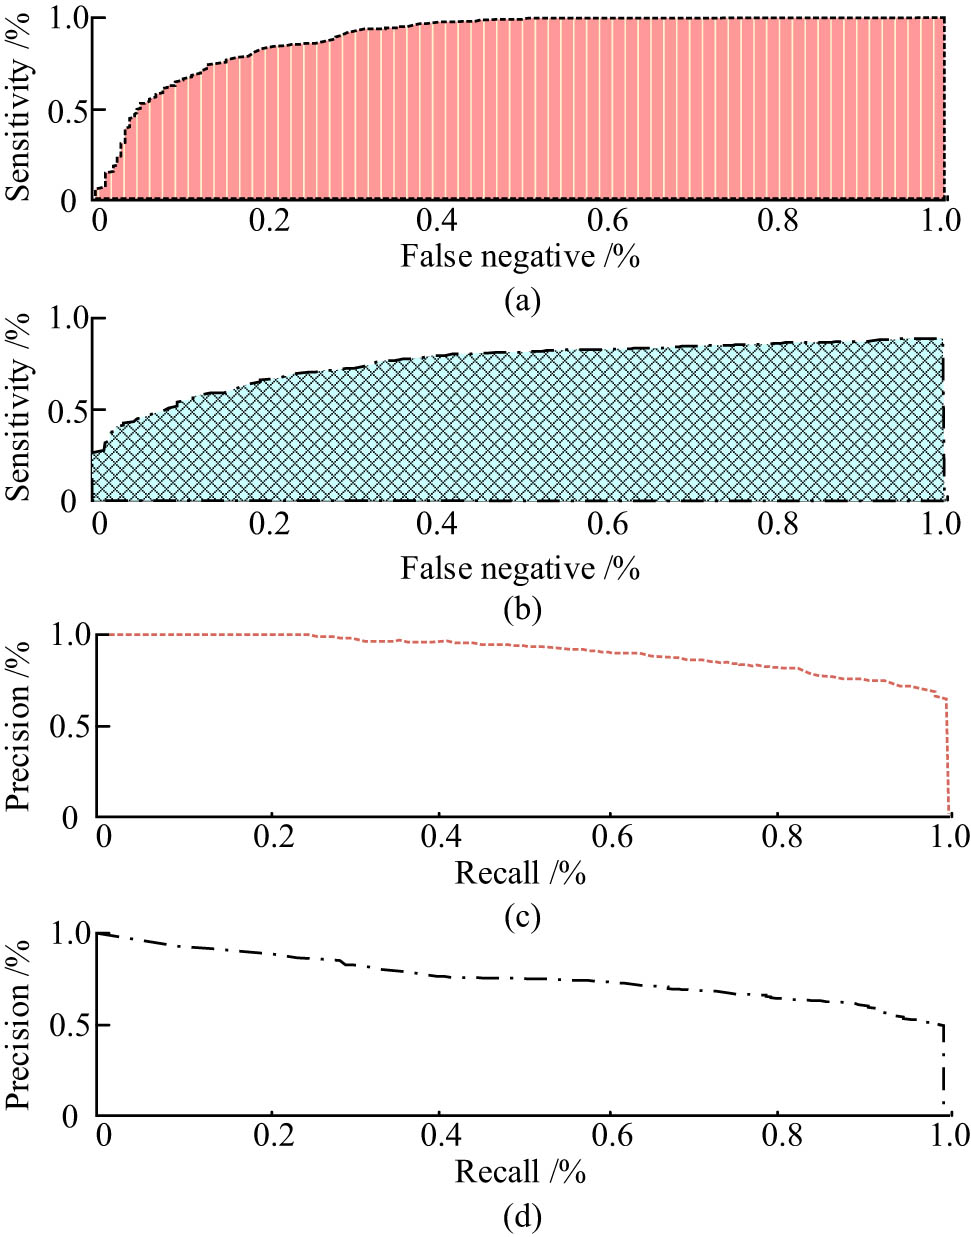
Performance comparison between the LSTM model and the combined model: (a) ours ROC curve, (b) LSTM model ROC curve, (c) ours PR curve, and (d) LSTM model PR curve.
Figure 8(a) and (b) show the ROC curves of the study model and LSTM, respectively, showing the balance between sensitivity and false negative probability for each model. Therefore, the area under the curve (AUC) composed of the curve and the horizontal axis can evaluate the authenticity of the model. The AUC of the research model reaches 0.94, which is 12.77% higher than the LSTM model’s 0.82. At the equilibrium point, the sensitivity and false negative classes of the research model are 96.98 and 21.42%, respectively, with a relative increase of 11.49% in sensitivity and a relative decrease of 9.87% in false negative. Figure 8(c) and (d) show the comparison of PR curves between the study model and the LSTM model. At the equilibrium point, the accuracy of the research model reaches 95.73%. Compared to the LSTM model, it has improved by 12.85%. The recall rate of the research model reaches 97.96%, which is 11.60% higher than LSTM. Therefore, the research model has shown significant improvements in accuracy, recall, and sensitivity.
4.2 Performance comparison and practical application analysis of the LSTM–SVM model
To further validate the performance of the model in the overall study, this study compares the data prediction model based on ASC and LSTM networks (ASC-LSTM) proposed by Guo et al. with the MTL optimization model proposed by Liu et al. Table 4 shows the results of multiple tests conducted at different voltage levels.
Performance comparison of different models under different voltage levels
| Voltage level (kV) | Index | Models | ||
|---|---|---|---|---|
| ASC-LSTM | MTL | Ours | ||
| 35 | Training time (ms) | 27.5 | 27.8 | 27.0 |
| Test time (ms) | 8.2 | 7.9 | 7.1 | |
| Accuracy (%) | 91.8 | 93.0 | 93.2 | |
| 110 | Training time (ms) | 40.8 | 37.5 | 36.4 |
| Test time (ms) | 18.9 | 20.7 | 17.3 | |
| Accuracy (%) | 93.5 | 92.4 | 95.6 | |
| 220 | Training time (ms) | 43.6 | 44.3 | 42.5 |
| Test time (ms) | 25.1 | 32.4 | 20.7 | |
| Accuracy (%) | 92.9 | 94.3 | 98.9 | |
In Table 4, when the voltage level is 35 kV, the differences in indicators among the models are relatively small. However, as the voltage level increases, the model differences will also gradually increase. In terms of training time indicators, the three models have very similar training times under 35 kV conditions, with a difference of less than 3%. For voltage levels of 110 and 220 kV, the training time of the research model is still the shortest, demonstrating its efficiency in processing higher dimensional data. The average training time of the research model is 35.3 ms, while the average of ASC-LSTM is 37.3 ms, and the MTL is 36.5 ms. Therefore, in terms of training time, the research model has relatively reduced by 4.33%. The testing time of each model still maintains the same pattern. The average testing time for the research model is 15.0 ms, while ASC-LSTM is 17.4 ms and MTL is 20.3 ms. Therefore, in the testing time indicator, the research model has relatively decreased by 19.95%. In the prediction accuracy indicators, at the 35 kV voltage level, the accuracy of the three models is relatively high, and the difference is small. At the 110 kV voltage level, the accuracy of the research model is significantly higher than the other two models by 2.2%, indicating its good performance in moderately complex tasks. At the 220 kV voltage level, the accuracy of the research model far exceeds that of other models, especially compared to the MTL model, with an accuracy improvement of 4.6%. This indicates that it has significant advantages in processing high-complexity data. Overall, the research model has shown shorter training and testing times, as well as higher accuracy on datasets of different voltage levels, especially on high complexity 220 kV datasets, where its performance advantage is more pronounced. Two benchmark models of the auto-regression model and back propagation neural network (BPNN) are selected to verify the proposed LSTM–SVM model. Three different data sets are selected for the three load data sets provided for the official websites of three foreign regions. The first is the power load data of Region A from February 1, 2023, to August 31, 2023. The sampling rate of the data is 1 h, and the number of samples is 5,112. The second is the power load data of Region B in 2023, and the sampling rate of the data is 1 h and 8,760 samples. The third is the power load data of Region C in the whole year of 2023, the sampling rate of the data is 1 h, and the sample number is 8,760 samples. The power load data of the three regions are processed by data preprocessing, and the data processed is divided into the dataset. The results of daily load prediction of each model in three different datasets are shown in Figure 9.
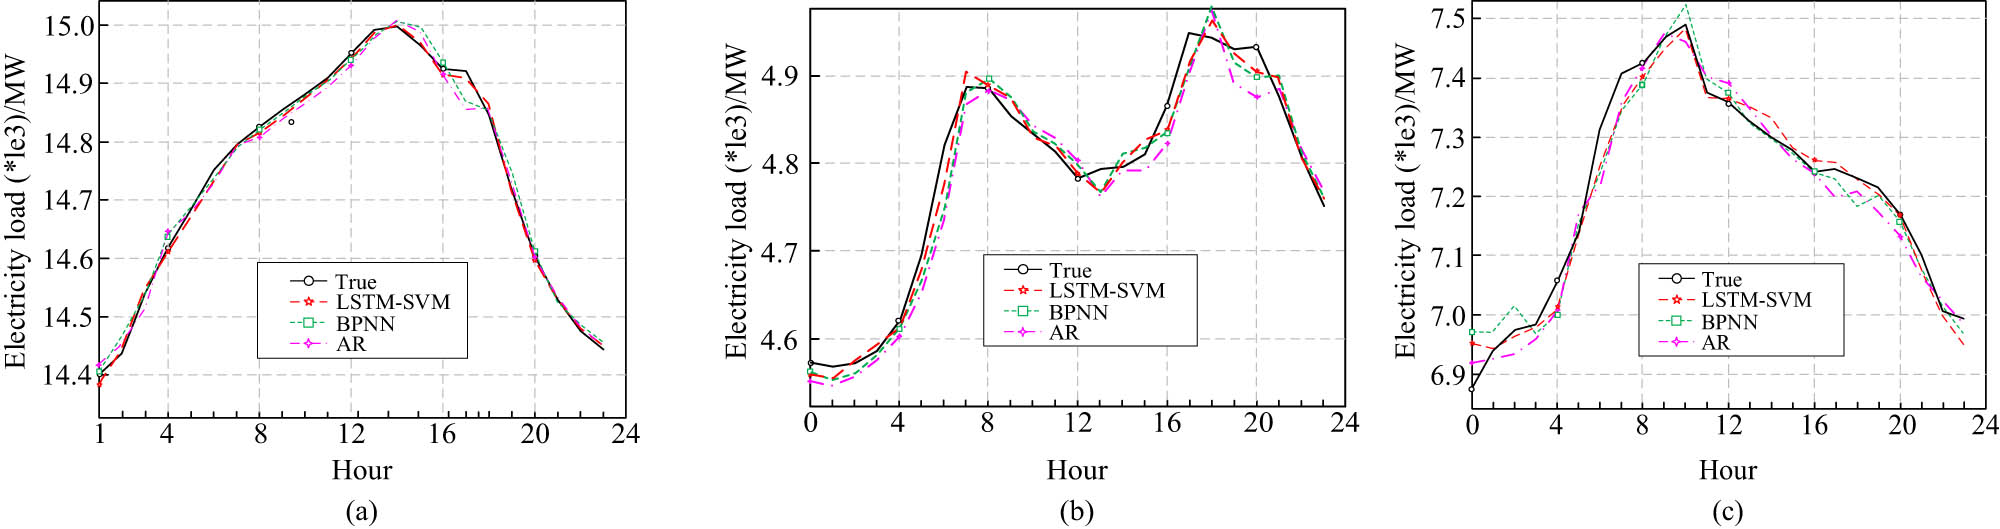
Daily load prediction results for each model in three different datasets: (a) Region A, (b) Region B, and (c) Region C.
From Figure 9(a), in Region A, the prediction effect of each model is optimal, and the load prediction curve in the figure almost coincides with the actual situation. In Figure 9(b) and (c), with the increase of mean absolute percent error (MAPE), the prediction value and actual error of each model also increase, reducing the accuracy of the prediction results. Among all the models, only the predicted value of the LSTM–SVM model is the closest to the real load curve, especially at the inflection point. While other models may be able to describe the overall trend of the load curve, their predictive accuracy will diminish as the difficulty of the prediction increases. This can result in significant practical limitations. The MAPE for individual models within 7 days is shown in Figure 10.
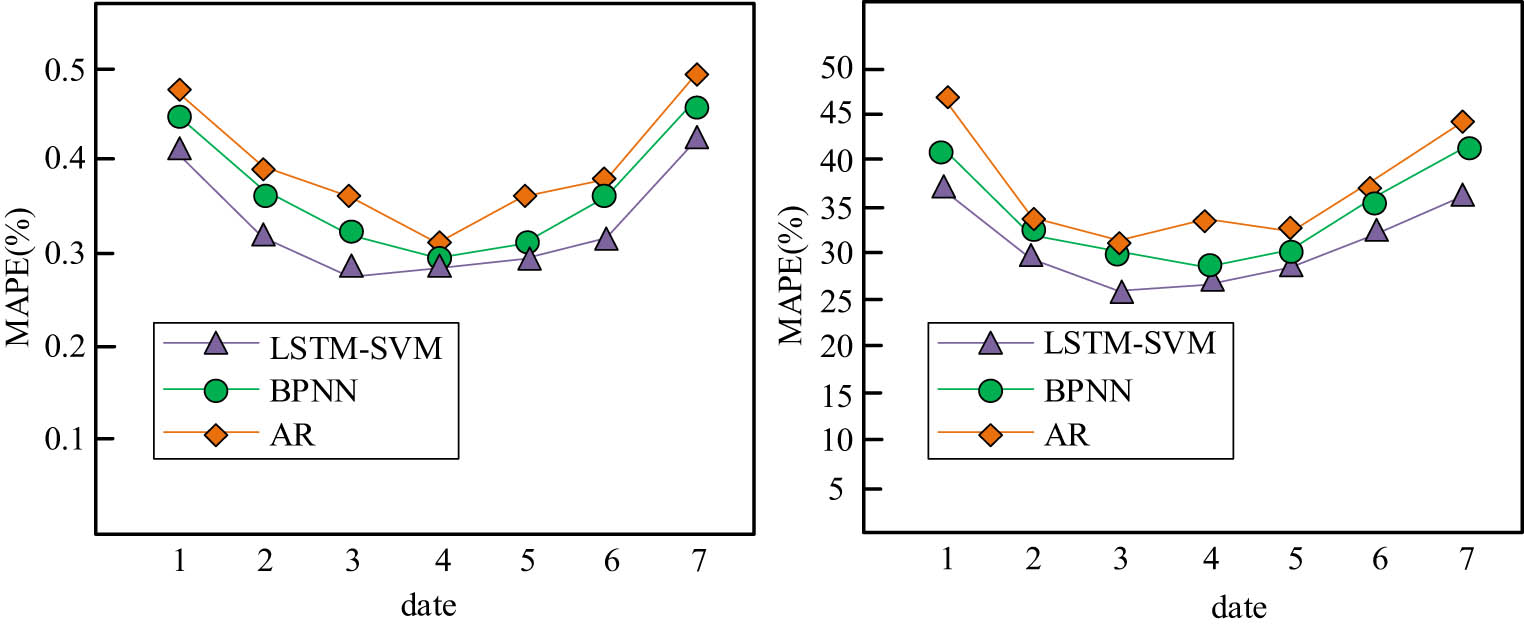
Comparison of weekly load prediction errors for each model.
Figure 10 shows that the weekly load prediction accuracy of the LSTM–SVM model is much better than BPNN and AR, while BPNN is higher than AR. A comparison between the predicted load value and the actual load value indicates that the load value prediction reaches an optimal level based on the LSTM–SVM model. This study further simulates the practical application of each model, taking the electricity data of a certain enterprise on a certain day as an example, and dividing it into hourly intervals. Its 24-h electricity load and real-time electricity price are shown in Figure 11.
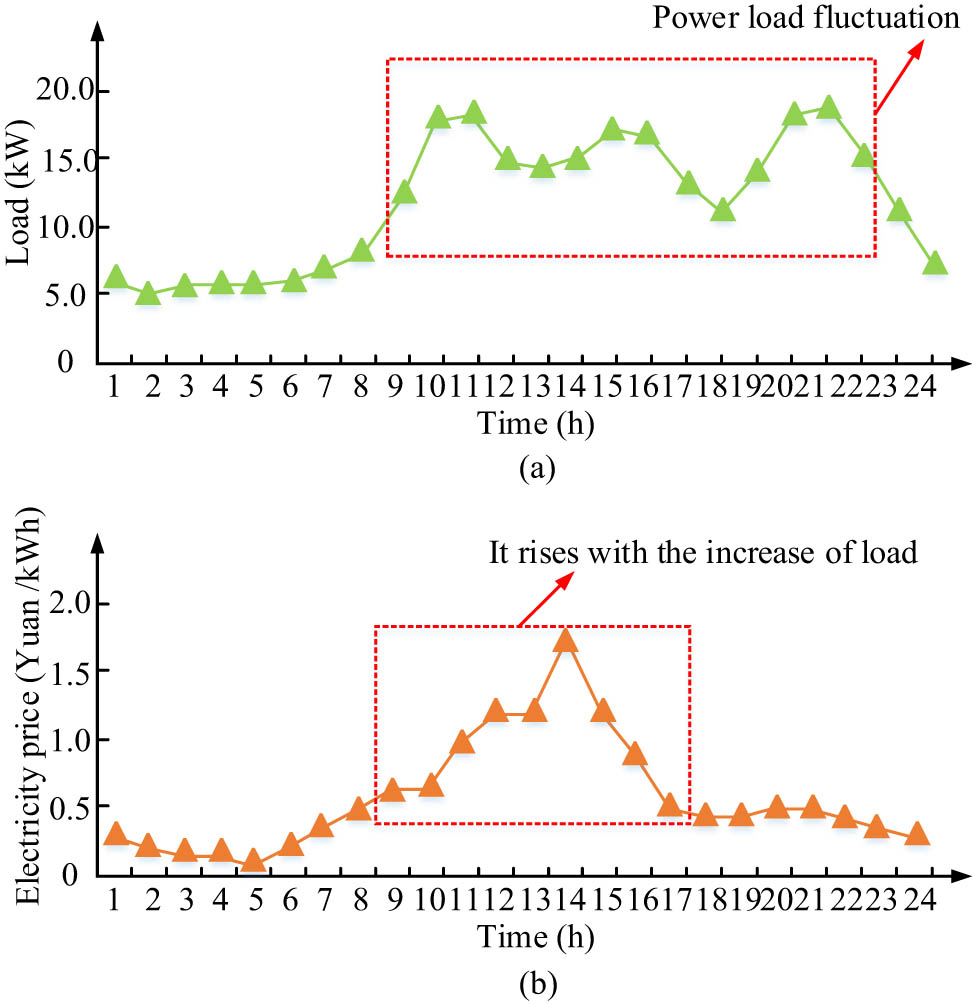
Real-time change curve of power load and electricity price: (a) 24 h real-time power load and (b) 24 h real-time electricity prices.
In Figure 11(a) and (b), there is a positive correlation between electricity price and electricity load. During the early morning hours, from 1 to 6 o’clock, most users are resting, resulting in a relatively low overall electricity load and corresponding lower electricity prices. As the daytime time increases, the electricity load increases and the electricity price reaches its peak at around 14 o’clock. With the arrival of night, both the electricity load and price show a slight increase, and after 22:00, the price gradually decreases again. This also provides a basis for enterprise electricity planning, which can avoid using too much electricity during peak periods. This study analyzes the performance of the design model in practical applications based on the above data. The extensive use of electricity can cause greenhouse gas emissions and environmental pollution. Therefore, this study takes CO2 emissions as one of the indicators for emission reduction. In addition, power control is also beneficial for reducing the operating costs of enterprises and can be used as an evaluation indicator. Due to the large amount of data, this study only selects the peak period from 10 am to 5 pm for comparison. Table 5 shows the specific results.
Actual application effect of the optimized LSTM–SVM model in enterprise emission reduction
| Pre-warning optimization | After optimized early warning | ||||
|---|---|---|---|---|---|
| Time (h) | CO2 emissions (kg) | Cost (yuan) | Time (h) | CO2 emissions (kg) | Cost (yuan) |
| 10 | 35.42 | 172.45 | 10 | 30.61 | 146.37 |
| 11 | 52.57 | 241.61 | 11 | 34.89 | 161.60 |
| 12 | 49.86 | 230.89 | 12 | 32.43 | 145.83 |
| 13 | 49.24 | 225.64 | 13 | 32.58 | 146.75 |
| 14 | 59.99 | 320.89 | 14 | 31.04 | 126.81 |
| 15 | 57.15 | 265.15 | 15 | 33.86 | 151.74 |
| 16 | 42.08 | 209.53 | 16 | 31.01 | 137.36 |
| 17 | 26.56 | 108.57 | 17 | 24.07 | 100.82 |
In Table 5, during peak electricity usage, the optimized CO2 emissions are lower than before optimization. For example, at 10 a.m., the emissions before and after optimization decrease by 15.72%. As the load increases, the gap between the two models also gradually widens. This reduction trend remains consistent throughout the entire time frame, demonstrating the effectiveness of optimization measures in reducing carbon emissions. The optimized cost is lower than before at every time point. For example, at 14:00 in the afternoon, the optimized cost is relatively reduced by 60.48%. In summary, the EDEW system based on LSTM–SVM significantly reduces CO2 emissions and costs. It can not only help companies reduce emissions but also lower their operating economic costs. To further verify the application effect of the proposed method, the actual operation results of the equipment of the central air conditioning water system in the enterprise are also collected separately, as shown in Table 6.
Time-time operation results of central air conditioning water system equipment in enterprises
| Time | Actual load (kW) | Load prediction (kW) | Fractional error (%) | Wet bulb temperature (°C) | Cooling water outlet temperature (°C) | Frozen water outlet temperature (°C) | Cooling water flow (m2/h) | Frozen water flow (m2/h) |
|---|---|---|---|---|---|---|---|---|
| 0:00 | 894.5 | 846.8 | −5.33 | 22.68 | 29.54 | 12.00 | 240.0 | 242.7 |
| 1:00 | 938.6 | 967.7 | 3.10 | 22.14 | 29.47 | 12.00 | 240.0 | 277.3 |
| 2:00 | 878.2 | 963.4 | 9.70 | 21.93 | 29.24 | 12.00 | 240.0 | 276.1 |
| 3:00 | 898.0 | 951.9 | 6.00 | 21.85 | 29.11 | 12.00 | 240.0 | 272.8 |
| 4:00 | 918.0 | 928.0 | 1.09 | 21.86 | 29.02 | 12.00 | 240.0 | 266.0 |
| 5:00 | 913.7 | 964.8 | 5.60 | 21.67 | 28.97 | 12.00 | 240.0 | 276.5 |
| 6:00 | 856.7 | 797.6 | −6.90 | 21.92 | 28.56 | 12.00 | 240.0 | 228.6 |
| 7:00 | 870.9 | 894.4 | 2.70 | 22.02 | 29.05 | 12.00 | 240.0 | 256.3 |
| 8:00 | 941.5 | 985.8 | 4.70 | 22.53 | 29.94 | 12.00 | 240.0 | 282.5 |
| 9:00 | 1155.7 | 1049.3 | −9.20 | 24.35 | 32.07 | 11.86 | 240.0 | 287.4 |
| 10:00 | 1493.3 | 1500.8 | 0.50 | 25.85 | 35.53 | 11.05 | 240.0 | 327.0 |
| 11:00 | 1527.8 | 1385.7 | −9.30 | 25.07 | 34.23 | 1,129 | 240.0 | 321.0 |
| 12:00 | 1396.1 | 1337.5 | −4.20 | 25.00 | 33.95 | 11.37 | 240.0 | 316.5 |
| 13:00 | 1390.4 | 1423.7 | 2.40 | 25.00 | 34.32 | 11.24 | 240.0 | 325.3 |
| 14:00 | 1391.9 | 1287.5 | −7.50 | 24.96 | 33.69 | 11.45 | 240.0 | 311.5 |
| 15:00 | 1395.5 | 1281.1 | −8.20 | 24.93 | 33.64 | 11.46 | 240.0 | 311.0 |
| 16:00 | 1473.8 | 1490.0 | 1.10 | 25.85 | 35.48 | 11.07 | 240.0 | 326.0 |
| 17:00 | 1551.0 | 1464.2 | −5.60 | 25.83 | 35.35 | 11.11 | 240.0 | 323.7 |
| 18:00 | 1405.3 | 1509.3 | 7.40 | 25.57 | 35.28 | 11.06 | 240.0 | 329.7 |
| 19:00 | 1293.3 | 1275.2 | −1.40 | 23.81 | 32.46 | 11.54 | 240.0 | 317.0 |
| 20:00 | 1151.7 | 1192.0 | 3.50 | 24.94 | 33.27 | 11.60 | 240.0 | 301.1 |
| 21:00 | 1252.6 | 1277.6 | 2.00 | 24.64 | 33.32 | 11.48 | 240.0 | 312.3 |
| 22:00 | 1191.5 | 1172.5 | −1.60 | 24.07 | 32.30 | 11.68 | 240.0 | 303.8 |
| 23:00 | 826.8 | 878.1 | 6.21 | 22.82 | 29.80 | 12.00 | 240.0 | 251.7 |
In Table 6, the difference between the load forecasting results at each time is within ±10%, the predicted total load of the whole day is 28006.7 kW, the actual total load is 27824.9 kW, and the relative error is −0.70%, with a good load forecasting effect. From the perspective of the operation parameters of the equipment, the outlet temperature of the frozen water on the day is set at 11–12°C. One cooling water pump and a cooling tower are in operation, and two chilled water pumps are running. This can assist the enterprise in reducing emissions and the economic cost associated with its operations.
To verify the generality of the proposed method, the research considers the ocean carrier of a multi-energy electric propulsion ship and optimizes the power of its oil generator, energy storage device, and propulsion motor. The comparison results before and after optimization are shown in Table 7.
Comparison results before and after optimization
| Index | Before optimization | Before optimization |
|---|---|---|
| Total ship operating cost (S) | 367761.95 | 359945.42 |
| Carbon dioxide emissions (kg) | 661502.96 | 598539.75 |
| Nitrogen oxide emissions (kg) | 986985.77 | 9205673654.00 |
| Carbon monoxide emissions (kg) | 136456.72 | 127109.37 |
| Sulfur dioxide emission (kg) | 48620.49 | 43844.85 |
| Fuel cost (S) | 63218.05 | 62186.31 |
In Figure 7, the total operating cost of optimized ocean carriers is 359945.42 S, which reduces the total operating cost by 2.1254% compared with that before optimization. The optimized fuel cost of the ocean carriers is 62186.31, a reduction of 1.6320% compared with before the optimization. The optimized ocean carrier reduces a total of 143504.5981 kg of contaminated gas than before the optimization. The results demonstrate that the research method has substantial applicability and universality and offers valuable insights that can be referenced in other industries.
5 Conclusion
This study analyzed the emission reduction of large steel enterprises. First, an LSTM basic model was constructed, and predictions were made based on shock load and stable load, respectively. To address the demand for large samples in the model, an SVM model was introduced for optimization. The experiment was segmented into two parts: performance analysis of the model itself and a simulation experiment application. The experimental results showed that the minimum RPE of the LSTM–SVM model was 0.20%, which was 1.86% lower than SVM. The maximum error fluctuation of LSTM–SVM was 0.78%, which was 1.55 and 1.04% lower than LSTM and SVM, respectively. The AUC value of LSTM–SVM was 0.94, which was 12.77% higher than the LSTM model. The accuracy and recall were 12.85 and 11.60% higher than LSTM, respectively. In comparison with other models, the training time of the research model on 35 kV was 5.3 and 4.9% faster than ASC-LSTM and MTL. As the voltage level increased, the average training time of the research model decreased by 5.05%. At 220 kV, the testing time of the research model was 17.5 and 36.0% faster than ASC-LSTM and MTL. The accuracy of the model has always been the best. At 220 kV, the research model had an accuracy of 6.5 and 4.8% higher than ASC-LSTM and MTL. This study further analyzed the practical application of the model. First, the 24-h variation curves of electricity prices and loads were understood, and peak periods were selected for comparative research. The results verified that after optimization, the carbon emissions and electricity costs of the enterprise were reduced by 48.26 and 60.48%, respectively. In summary, the proposed machine learning-based EDEW method can help enterprises achieve emission reduction and cost control. However, due to the fact that large enterprises update their databases every few years, the sample data obtained from research are limited and may deviate from the actual situation. Therefore, it is necessary to search for as much sample data as possible in the future to improve the accuracy of the model.
-
Funding information: The authors state no funding is involved.
-
Author contributions: Kun Li and Meng Su: conceptualization, resources, writing – original draft; Qiang Liu and Bin Zhang: writing – review and editing. All authors have accepted responsibility for the entire content of this manuscript and approved its submission.
-
Conflict of interest: The authors state no conflict of interest.
-
Data availability statement: The datasets generated during and/or analysed during the current study are available from the corresponding author on reasonable request.
References
[1] Wu J, Li T, Wang J, Zhang D, Peng L. Establishment of HCFC-22 national-provincial-gridded emission inventories in China and the analysis of emission reduction potential. Env Sci Technol. 2022;56(2):814–22.10.1021/acs.est.1c07344Suche in Google Scholar PubMed
[2] Morales Pedraza J. The role of renewable energy in the transition to green, low-carbon power generation in Asia. GLCE. 2023;1(2):68–84.10.47852/bonviewGLCE3202761Suche in Google Scholar
[3] Jiang Y, Ding D, Dong Z, Liu S, Chang X, Zheng H. Extreme emission reduction requirements for China to achieve World Health Organization global air quality guidelines. Env Sci Technol. 2023;57(11):4424–33.10.1021/acs.est.2c09164Suche in Google Scholar PubMed
[4] Lao Y, Ruan D, Vassantachart A, Fan Z, Ye JC, Chang EL. Voxelwise prediction of recurrent high-grade glioma via proximity estimation-coupled multidimensional support vector machine. Int J Radiat Oncol Biol Phys. 2022;112(5):1279–87.10.1016/j.ijrobp.2021.12.153Suche in Google Scholar PubMed PubMed Central
[5] Guo H, Chen Q, Zheng K, Xia Q, Kang C. Forecast aggregated supply curves in power markets based on LSTM model. IEEE Trans Power Syst. 2021;36(6):5767–79.10.1109/TPWRS.2021.3079923Suche in Google Scholar
[6] Liu J, Zhang Z, Fan X, Zhang Y, Wang J, Zhou K. Power system load forecasting using mobility optimization and multi-task learning in COVID-19. Appl Energy. 2022;310:118303.10.1016/j.apenergy.2021.118303Suche in Google Scholar PubMed PubMed Central
[7] Li J, Luo Y, Wei S. Long-term electricity consumption forecasting method based on system dynamics under the carbon-neutral target. Energy. 2022;244:122572.10.1016/j.energy.2021.122572Suche in Google Scholar
[8] Liu C, Li F, Zhang C, Sun B, Zhang G. A day-ahead prediction method for high-resolution electricity consumption in residential units. Energy. 2023;265:125999.10.1016/j.energy.2022.125999Suche in Google Scholar
[9] Hadjout D, Torres JF, Troncoso A, Sebaa A, Martínez-Álvarez F. Electricity consumption forecasting based on ensemble deep learning with application to the Algerian market. Energy. 2022;243:123060.10.1016/j.energy.2021.123060Suche in Google Scholar
[10] Obst D, De Vilmarest J, Goude Y. Adaptive methods for short-term electricity load forecasting during COVID-19 lockdown in France. IEEE Trans Power Syst. 2021;36(5):4754–63.10.1109/TPWRS.2021.3067551Suche in Google Scholar PubMed PubMed Central
[11] Banik R, Das P, Ray S, Biswas A. Prediction of electrical energy consumption based on machine learning technique. Electr Eng. 2021;103(2):909–20.10.1007/s00202-020-01126-zSuche in Google Scholar
[12] Wei M, Wen M, Luo J. A short-term electricity consumption forecasting approach based on feature processing and hybrid modelling. IET Gener Transm Distrib. 2022;16(10):2003–15.10.1049/gtd2.12409Suche in Google Scholar
[13] Sharma A, Sajjad H, Rahaman MH, Saha TK. Effectiveness of hybrid ensemble machine learning models for landslide susceptibility analysis: evidence from Shimla district of North-west Indian Himalayan region. J Mt Sci. 2024;21(7):2368–93.10.1007/s11629-024-8651-7Suche in Google Scholar
[14] Vesal K, Chomyong K, Sunjoo R, Awais K. Human interaction recognition in surveillance videos using hybrid deep learning and machine learning models. Comput Mater Contin. 2024;81(10):773–87.10.32604/cmc.2024.056767Suche in Google Scholar
[15] Amadou KB, Anthony WG, Lawrence N. Spatial heterogeneity modeling using machine learning based on a hybrid of random forest and convolutional neural network (CNN). J Data Anal Inf Process. 2024;12(3):319–47.10.4236/jdaip.2024.123018Suche in Google Scholar
[16] Hosseini SHR, Allahham A, Walker SL, Taylor P. Uncertainty analysis of the impact of increasing levels of gas and electricity network integration and storage on techno-economic-environmental performance. Energy. 2021;222:119968.10.1016/j.energy.2021.119968Suche in Google Scholar
[17] Wang X, Nie G, Zhao Y, Li B, Kang M, Liu B. Hierarchical memory-guided long-term tracking with meta transformer inquiry network. Knowl Based Syst. 2023;269:110504–17.10.1016/j.knosys.2023.110504Suche in Google Scholar
[18] Song Y, Mu H, Li N, Wang H. Multi-objective optimization of large-scale grid-connected photovoltaic-hydrogen-natural gas integrated energy power station based on carbon emission priority. Int J Hydrog Energy. 2023;48(10):4087–103.10.1016/j.ijhydene.2022.10.121Suche in Google Scholar
[19] Afrin T, Yodo N. A long short-term memory-based correlated traffic data prediction framework. Knowl Based Syst. 2022;237:107755–66.10.1016/j.knosys.2021.107755Suche in Google Scholar
[20] Chen Y, Wang Y, Ma L, Xu Q, Ma Bl. The in-situ synthesis of Cu2O-Cu polyhedral heterostructures and the enhanced photocatalytic properties under visible light. Pollut Env. 2023;7(1):15–21.Suche in Google Scholar
[21] Hu C, Sutunyarak C. Challenges and countermeasures faced by higher vocational colleges in Henan Province in connotation construction. Adv Ind Eng Manag. 2022;11(1):41–4.Suche in Google Scholar
[22] Li Y, Zeng X, Shi Y. Quickly build a high-precision classifier for Φ-OTDR sensing system based on transfer learning and support vector machine. Opt Fiber Technol. 2022;70:102868–75.10.1016/j.yofte.2022.102868Suche in Google Scholar
[23] Lakshmi GVN, Jayalaxmi A, Veeramsetty V. Optimal placement of distributed generation based on DISCO’s financial benefit with loss and emission reduction using hybrid Jaya-Red Deer optimizer. Electr Eng. 2022;105:965–77.10.1007/s00202-022-01709-ySuche in Google Scholar PubMed PubMed Central
© 2025 the author(s), published by De Gruyter
This work is licensed under the Creative Commons Attribution 4.0 International License.
Artikel in diesem Heft
- Research Articles
- Generalized (ψ,φ)-contraction to investigate Volterra integral inclusions and fractal fractional PDEs in super-metric space with numerical experiments
- Solitons in ultrasound imaging: Exploring applications and enhancements via the Westervelt equation
- Stochastic improved Simpson for solving nonlinear fractional-order systems using product integration rules
- Exploring dynamical features like bifurcation assessment, sensitivity visualization, and solitary wave solutions of the integrable Akbota equation
- Research on surface defect detection method and optimization of paper-plastic composite bag based on improved combined segmentation algorithm
- Impact the sulphur content in Iraqi crude oil on the mechanical properties and corrosion behaviour of carbon steel in various types of API 5L pipelines and ASTM 106 grade B
- Unravelling quiescent optical solitons: An exploration of the complex Ginzburg–Landau equation with nonlinear chromatic dispersion and self-phase modulation
- Perturbation-iteration approach for fractional-order logistic differential equations
- Variational formulations for the Euler and Navier–Stokes systems in fluid mechanics and related models
- Rotor response to unbalanced load and system performance considering variable bearing profile
- DeepFowl: Disease prediction from chicken excreta images using deep learning
- Channel flow of Ellis fluid due to cilia motion
- A case study of fractional-order varicella virus model to nonlinear dynamics strategy for control and prevalence
- Multi-point estimation weldment recognition and estimation of pose with data-driven robotics design
- Analysis of Hall current and nonuniform heating effects on magneto-convection between vertically aligned plates under the influence of electric and magnetic fields
- A comparative study on residual power series method and differential transform method through the time-fractional telegraph equation
- Insights from the nonlinear Schrödinger–Hirota equation with chromatic dispersion: Dynamics in fiber–optic communication
- Mathematical analysis of Jeffrey ferrofluid on stretching surface with the Darcy–Forchheimer model
- Exploring the interaction between lump, stripe and double-stripe, and periodic wave solutions of the Konopelchenko–Dubrovsky–Kaup–Kupershmidt system
- Computational investigation of tuberculosis and HIV/AIDS co-infection in fuzzy environment
- Signature verification by geometry and image processing
- Theoretical and numerical approach for quantifying sensitivity to system parameters of nonlinear systems
- Chaotic behaviors, stability, and solitary wave propagations of M-fractional LWE equation in magneto-electro-elastic circular rod
- Dynamic analysis and optimization of syphilis spread: Simulations, integrating treatment and public health interventions
- Visco-thermoelastic rectangular plate under uniform loading: A study of deflection
- Threshold dynamics and optimal control of an epidemiological smoking model
- Numerical computational model for an unsteady hybrid nanofluid flow in a porous medium past an MHD rotating sheet
- Regression prediction model of fabric brightness based on light and shadow reconstruction of layered images
- Dynamics and prevention of gemini virus infection in red chili crops studied with generalized fractional operator: Analysis and modeling
- Qualitative analysis on existence and stability of nonlinear fractional dynamic equations on time scales
- Fractional-order super-twisting sliding mode active disturbance rejection control for electro-hydraulic position servo systems
- Analytical exploration and parametric insights into optical solitons in magneto-optic waveguides: Advances in nonlinear dynamics for applied sciences
- Bifurcation dynamics and optical soliton structures in the nonlinear Schrödinger–Bopp–Podolsky system
- Review Article
- Haar wavelet collocation method for existence and numerical solutions of fourth-order integro-differential equations with bounded coefficients
- Special Issue: Nonlinear Analysis and Design of Communication Networks for IoT Applications - Part II
- Silicon-based all-optical wavelength converter for on-chip optical interconnection
- Research on a path-tracking control system of unmanned rollers based on an optimization algorithm and real-time feedback
- Analysis of the sports action recognition model based on the LSTM recurrent neural network
- Industrial robot trajectory error compensation based on enhanced transfer convolutional neural networks
- Research on IoT network performance prediction model of power grid warehouse based on nonlinear GA-BP neural network
- Interactive recommendation of social network communication between cities based on GNN and user preferences
- Application of improved P-BEM in time varying channel prediction in 5G high-speed mobile communication system
- Construction of a BIM smart building collaborative design model combining the Internet of Things
- Optimizing malicious website prediction: An advanced XGBoost-based machine learning model
- Economic operation analysis of the power grid combining communication network and distributed optimization algorithm
- Sports video temporal action detection technology based on an improved MSST algorithm
- Internet of things data security and privacy protection based on improved federated learning
- Enterprise power emission reduction technology based on the LSTM–SVM model
- Construction of multi-style face models based on artistic image generation algorithms
- Research and application of interactive digital twin monitoring system for photovoltaic power station based on global perception
- Special Issue: Decision and Control in Nonlinear Systems - Part II
- Animation video frame prediction based on ConvGRU fine-grained synthesis flow
- Application of GGNN inference propagation model for martial art intensity evaluation
- Benefit evaluation of building energy-saving renovation projects based on BWM weighting method
- Deep neural network application in real-time economic dispatch and frequency control of microgrids
- Real-time force/position control of soft growing robots: A data-driven model predictive approach
- Mechanical product design and manufacturing system based on CNN and server optimization algorithm
- Application of finite element analysis in the formal analysis of ancient architectural plaque section
- Research on territorial spatial planning based on data mining and geographic information visualization
- Fault diagnosis of agricultural sprinkler irrigation machinery equipment based on machine vision
- Closure technology of large span steel truss arch bridge with temporarily fixed edge supports
- Intelligent accounting question-answering robot based on a large language model and knowledge graph
- Analysis of manufacturing and retailer blockchain decision based on resource recyclability
- Flexible manufacturing workshop mechanical processing and product scheduling algorithm based on MES
- Exploration of indoor environment perception and design model based on virtual reality technology
- Tennis automatic ball-picking robot based on image object detection and positioning technology
- A new CNN deep learning model for computer-intelligent color matching
- Design of AR-based general computer technology experiment demonstration platform
- Indoor environment monitoring method based on the fusion of audio recognition and video patrol features
- Health condition prediction method of the computer numerical control machine tool parts by ensembling digital twins and improved LSTM networks
- Establishment of a green degree evaluation model for wall materials based on lifecycle
- Quantitative evaluation of college music teaching pronunciation based on nonlinear feature extraction
- Multi-index nonlinear robust virtual synchronous generator control method for microgrid inverters
- Manufacturing engineering production line scheduling management technology integrating availability constraints and heuristic rules
- Analysis of digital intelligent financial audit system based on improved BiLSTM neural network
- Attention community discovery model applied to complex network information analysis
- A neural collaborative filtering recommendation algorithm based on attention mechanism and contrastive learning
- Rehabilitation training method for motor dysfunction based on video stream matching
- Research on façade design for cold-region buildings based on artificial neural networks and parametric modeling techniques
- Intelligent implementation of muscle strain identification algorithm in Mi health exercise induced waist muscle strain
- Optimization design of urban rainwater and flood drainage system based on SWMM
- Improved GA for construction progress and cost management in construction projects
- Evaluation and prediction of SVM parameters in engineering cost based on random forest hybrid optimization
- Museum intelligent warning system based on wireless data module
- Optimization design and research of mechatronics based on torque motor control algorithm
- Special Issue: Nonlinear Engineering’s significance in Materials Science
- Experimental research on the degradation of chemical industrial wastewater by combined hydrodynamic cavitation based on nonlinear dynamic model
- Study on low-cycle fatigue life of nickel-based superalloy GH4586 at various temperatures
- Some results of solutions to neutral stochastic functional operator-differential equations
- Ultrasonic cavitation did not occur in high-pressure CO2 liquid
- Research on the performance of a novel type of cemented filler material for coal mine opening and filling
- Testing of recycled fine aggregate concrete’s mechanical properties using recycled fine aggregate concrete and research on technology for highway construction
- A modified fuzzy TOPSIS approach for the condition assessment of existing bridges
- Nonlinear structural and vibration analysis of straddle monorail pantograph under random excitations
- Achieving high efficiency and stability in blue OLEDs: Role of wide-gap hosts and emitter interactions
- Construction of teaching quality evaluation model of online dance teaching course based on improved PSO-BPNN
- Enhanced electrical conductivity and electromagnetic shielding properties of multi-component polymer/graphite nanocomposites prepared by solid-state shear milling
- Optimization of thermal characteristics of buried composite phase-change energy storage walls based on nonlinear engineering methods
- A higher-performance big data-based movie recommendation system
- Nonlinear impact of minimum wage on labor employment in China
- Nonlinear comprehensive evaluation method based on information entropy and discrimination optimization
- Application of numerical calculation methods in stability analysis of pile foundation under complex foundation conditions
- Research on the contribution of shale gas development and utilization in Sichuan Province to carbon peak based on the PSA process
- Characteristics of tight oil reservoirs and their impact on seepage flow from a nonlinear engineering perspective
- Nonlinear deformation decomposition and mode identification of plane structures via orthogonal theory
- Numerical simulation of damage mechanism in rock with cracks impacted by self-excited pulsed jet based on SPH-FEM coupling method: The perspective of nonlinear engineering and materials science
- Cross-scale modeling and collaborative optimization of ethanol-catalyzed coupling to produce C4 olefins: Nonlinear modeling and collaborative optimization strategies
- Unequal width T-node stress concentration factor analysis of stiffened rectangular steel pipe concrete
- Special Issue: Advances in Nonlinear Dynamics and Control
- Development of a cognitive blood glucose–insulin control strategy design for a nonlinear diabetic patient model
- Big data-based optimized model of building design in the context of rural revitalization
- Multi-UAV assisted air-to-ground data collection for ground sensors with unknown positions
- Design of urban and rural elderly care public areas integrating person-environment fit theory
- Application of lossless signal transmission technology in piano timbre recognition
- Application of improved GA in optimizing rural tourism routes
- Architectural animation generation system based on AL-GAN algorithm
- Advanced sentiment analysis in online shopping: Implementing LSTM models analyzing E-commerce user sentiments
- Intelligent recommendation algorithm for piano tracks based on the CNN model
- Visualization of large-scale user association feature data based on a nonlinear dimensionality reduction method
- Low-carbon economic optimization of microgrid clusters based on an energy interaction operation strategy
- Optimization effect of video data extraction and search based on Faster-RCNN hybrid model on intelligent information systems
- Construction of image segmentation system combining TC and swarm intelligence algorithm
- Particle swarm optimization and fuzzy C-means clustering algorithm for the adhesive layer defect detection
- Optimization of student learning status by instructional intervention decision-making techniques incorporating reinforcement learning
- Fuzzy model-based stabilization control and state estimation of nonlinear systems
- Optimization of distribution network scheduling based on BA and photovoltaic uncertainty
- Tai Chi movement segmentation and recognition on the grounds of multi-sensor data fusion and the DBSCAN algorithm
- Special Issue: Dynamic Engineering and Control Methods for the Nonlinear Systems - Part III
- Generalized numerical RKM method for solving sixth-order fractional partial differential equations