Sediment accumulation in an 8 inch sewer pipe for a sample of various particles obtained from the streets of Karbala city, Iraq
-
Mohammed Aswad Kokaz
 ,
Basim K. Nile
,
Basim K. Nile

Abstract
This work investigates the intricate interplay between particle size and water flow velocity in connection to sedimentation within the sewage systems. The experimental design involves simulating the sedimentation process in a laboratory setup using an 8 inch unplasticized polyvinyl chloride pipe with a controlled slope. Three factors of flow and discharge velocity detailed in this work are particle size, velocity, and sedimentation rate, which are determined through calculations based on the Manning equation. For the numerical simulations, the software packages Fluent and Rocky were used. Sediment transportation under laminar flow conditions can be analyzed by means of numerical simulation. The size, shape, and velocity of the fluid in which the particles are suspended are only a few of the variables taken into consideration while assessing the drag force acting on the particles. The results show that the smaller particles escape the entry further because they are more movable within the conduit. Conversely, it is demonstrated that increased settling pressures near the entrance increase the probability of larger particle sizes settling. Higher water velocities have been found to have a favorable effect on the sediment mobility, which decreases the particle accumulation. This study presents practical methods to mitigate sedimentation in sewage systems, including increasing water flow rates and employing filtration methods to keep larger particles out of the system. This work adds a great deal to the body of information previously known on sedimentation behavior in these systems with its incisive finds that may boost the longevity and efficiency of sewage systems. More research is required to determine the value of the proposed treatments.
1 Introduction
Storm networks, like other components of urban infrastructure, are crucial to society’s functioning. One of the main issues these networks deal with is pipe blockage from silt accumulation in sewage systems, which results in flooding during heavy rainy seasons. The purpose of this effort is to enhance storm network performance by applying a novel filter. A pipe network model was constructed to mirror the rain flow on a two-lane street [1]. Storm sewer systems in urban areas encounter numerous challenges, especially those that are aging and have exceeded their intended lifespan. Physically based models, such as Autodesk Storm and Sanitary Analysis (ASSA) and multiple nonlinear regression (MNLR), were utilized. Peak flooding occurs more often and is linked to rising rainfall output, which stresses how urgent it is to solve these problems [2]. The planning, design, and operation of projects involving the structure of water resources rely on models that visualize the relationship between intensity, duration, and frequency (IDF) curves and rainfall intensity. The purpose of this work is to calculate and estimate IDF curve equations for the city of Najaf in Iraq. Moreover, it searches for the distribution that produces the maximum rainfall intensity among the three frequently used in the industry. The relationship between rainfall intensity and various return periods is explained by IDF curves [3].
Runoff from rainfall is essential to many aspects of water resources management, including irrigation, flood control, and drainage system design. Deriving accurate hydrological models and building robust storm networks require a special understanding of precipitation patterns. The city of Karbala in Iraq has witnessed a huge population increase and the effects of climate change since 2003, so it is very important to study the rainfall rates in this city. Therefore, the purpose of this work is to study the maximum daily depth of rainfall in Karbala and use frequency analysis to predict its probability of occurrence in the future [4].
Precipitation-generated surface runoff is important for many aspects of managing and developing water resources, such as irrigation, scheduling, flooding control, irrigation design, and drainage networks. The purpose of the study is to determine how the surface runoff rate of Karbala desert soil is affected by the amount of precipitation and the slope of the soil [5]. Because anthropogenic influences including land use, drainage systems, and concrete structures change the direction of surface overland flow, modeling surface runoff in urban captures is difficult. The intricacy of modeling urban runoff presents challenges when creating urban drainage systems [6]. Over the last few decades, research has focused on protecting water resources, especially with regard to the consequences of pollution on natural water bodies found in metropolitan areas. This study uses storm water management model user's manual version 5.1 to analyze the major variations in total suspended solids (TSS) and biochemical oxygen demand characteristics in wastewater within sewer networks during wet seasons. For pollutant loading modeling, it makes use of 30 years’ worth of temperature, rainfall, and sewage flow data from Karbala, Iraq (1980–2010) [7].
Urban planning and design are aided by the use of numerical models to evaluate sedimentation in urban environments using simulation approaches. The tracking of sediment particle movement is made easier by the integration of ANSYS Fluent and Rocky, which reveals important influences of particle size and speed on sedimentation patterns [8]. Hydraulic parameters, sediment content, and hydrodynamic variables are the main subjects of an assessment close to the Kufa Barrage. At ten cross-sections, silt concentrations and velocity are evaluated using Acoustic Doppler Current Profilers at different water depths. Depth-integrated sampling highlights light on the possibility of sediment transfer [9].
In order to create an empirical formula, field measurements in the upstream area require measuring hydraulic and fluid parameters as well as gathering sediment sample data. These equations (R2 = 0.979), which were obtained by means of statistical and dimensional studies, closely match the observed suspended sediment drainages [10]. Urban sinkholes are frequently caused by soil erosion, which is made worse by water passing through malfunctioning sewage systems. To anticipate the rates of erosion on sandy soil substrates, researchers have proposed using dimensional analysis and a dimensionless model [11]. Sediment transportation in sewer systems is a major engineering challenge, which means that models to forecast critical speed or shear stress for self-cleaning flow conditions in sewer pipelines must be developed [12]. Urban drain systems are often burdened by sediments from sewers. To find bed deposits, methods such as temperature monitoring and laboratory tests that replicate sewage temperature gradients are used [13]. Although gully pots allow stormwater to enter the system, removing silt can be costly and dangerous for the ecosystem. Understanding these dangers is helped by mineral analysis. Assessing the rates of sedimentation and mineral buildup is essential for upkeep and understanding the effects of metropolitan areas [14]. Localized scooting around piers is typically the cause of bridge collapse. This work uses artificial neural networks and genetic programming to anticipate exploration, integrating factors obtained from dimensional analysis [15]. Because of the difficulty in observing slurry transit within urban stormwater sewers, little study has been done in this area. Utilizing ANSYS Fluent computational fluid dynamics (CFD) software, forecasting technologies for soil slurry flow during rainstorm events are developed [16].
While SewerSedFoam simulates three sediment classes and tackles the effects of erosion and sediment deposition on flow velocity, the interFoam flow solver incorporates suspended sediment transport, bedload transfer, and deposited bed morphology [17]. Data on runoff, sediment movement, and mass balances in pipeline systems and gully pots are provided by a number of experiments [16]. Sewers carry comparable amounts of contaminants and sediments even with lower water usage, which may result in higher wastewater concentrations and perhaps excessive solids deposition. Stormwater ponds help improve the quality of water by facilitating the sedimentation of pollutants from runoff [18].
Real-time control (RTC) methods to optimize sewer operations have been investigated in response to the global sewage pollution challenge. Simplified models enable the quick adoption of RTC strategies, with a particular emphasis on TSS [19]. Although less water is used per person in economic co-operation and development nations, the same quantities of contaminants and solids are still transported, which might lead to an overabundance of solids deposit. Stormwater runoff introduces suspended materials into aquatic bodies, which adds pollution [20]. Optimizing stormwater pools requires an understanding of the sediment processes involved. To do this, a framework based on discrete phase modeling has been introduced, which allows for a full simulation of sediment movement.
2 Problem statement
The sedimentation of granular materials in sewer pipes is a common problem that can significantly influence the operation and reliability of urban sewer networks.
3 Material and mythology
3.1 Study area and components of laboratory experimental device
A pump equipped with a large 2,000 L water tank was used in the Karbala plant field to carefully monitor the sizes of transported sand grain while operating at a controlled velocity to ensure accurate control. An 8 inch pipe that connects to the water tank at the top enables easier water movement and has a sediment feeder at its beginning. In the Karbala plant field, a pump with a sizable 2,000 L water tank was utilized to precisely regulate the flow of sand particles while running at a regulated speed. A sediment feeder is located at the beginning of an 8 inch pipe that links to the water tank at the top, making water circulation simpler. As sediment passes through the unit’s supplied sand particles, transmission controls are used to switch on and off the pump at a predefined flow rate. As seen in Figure 1, silt of varying sizes was continuously added to the flow throughout the first 15 min. The streets of Karbala were used to gather the particle size in order to determine the particle size that impacts sedimentation and examined through a sieve. As it traveled through the split at the top of the pipe, as indicated in Figure 1, the migration of the sediment to the pipe bed for each interval was likewisemonitored and recorded.

The sand collection and sediment occurrence on the bed of the pipe.
The process involves several stages, including sieve analysis, where samples are dried, and their dry weight is measured. Determining the number of particles in an 8-inch UPVC pipe with a 0.44 cm slope across a 6 m distance is the goal of this experiment (Figure 2).

The procedure of the laboratory sediment analysis.
Three main parameters that affect the particle stability were examined in this study, particle size, velocity, and the ratio of sedimentation rate to water flow. The Manning equation may be used to determine the flow and discharge velocity in a pipe with partial flow.
Dimensional analysis must first evaluate the dimensions of each term in the supplied equation in order to discover the dimensions of velocity in order to get the velocity equation [21].
Q is the flow rate with dimensions of volume per time, represented as (L 3/T). A is the cross-sectional area with dimensions of area represented as (L 2). R is the hydraulic radius and S is the slope, which are dimensionless. Given that
Now, let us assign dimensions to each term.
Q = L 3/T
A = L 2
R = L (dimensionless exponent does not change the dimensions)
S = 1 (dimensionless)
Now, equating the dimensions on both sides
Let us denote the dimensions of velocity (V) as
Now, we equate dimensions
Solving for
Comparing with the dimension of velocity [L/T]
So, n = [L].
Thus, the velocity equation obtained from the dimensional analysis is
As shown in Table 1, the Manning equation depicts two different pipe flow scenarios, one with a larger hydraulic diameter and the other with a smaller diameter. In order to evaluate how flow rates, particle sizes, and sedimentation rates affect the settling of particles inside the sewage line, tests were conducted in both scenarios. The results were achieved numerically under laminar flow conditions using ANSYS Fluent and Rocky software.
Flow characterization based on flow depth and hydraulic radius
| Scenario | Flow depth (h) and diameter of pipe (D) | Hydraulic radius (R) | Flow characterization | Particle size (mm) |
|---|---|---|---|---|
| Less than half full flow | h < D/2 | R = A/P | Subcritical, slower flow | d = 1.2, 1, 0.8, 0.6, and 0.4 |
| Small A compared to P | Flatter velocity profile | |||
| More than half full flow | h > D/2 | R = A/P | Supercritical, faster flow | d = 1.2, 1, 0.8, 0.6, and 0.4 |
| Significant A compared to P | Steeper velocity profile |
3.2 Numerical method
Rocky and ANSYS software were used to analyze the numerical data, with an emphasis on simulating the sedimentation in sewage lines. This made it easier to see how water and silt move through sewer lines and to determine if a programmer would work together. Deriving equations for granular systems is difficult since flow properties are dynamic and constantly changing. To guarantee precision and accuracy, constitutive relations related to phase interactions and particle material rheology must be established. The current methodology used in this work makes use of a continuum interpenetrating framework, which excludes incursion and does not include specific particle-level information. The addition of particle size distribution in the prescription process leads to an escalation in computing expenses. The integration of discrete particle methods with the finite volume method, known as discrete element method-computational fluid dynamics, presents a viable and efficient approach for simulating granular-fluid systems as shown in Figure 3.

Illustrative diagram for the numerical analysis of sediment transport inside the pipe.
3.3 Drag force
The drag force, commonly represented as F D, and another component including all forces except drag, referred to as F N-D, frequently constitute the resulting force arising from fluid interaction, denoted as F fp. The effect of drag force on sediment transport can be observed in Equation (5) through its influence on the area of particles. In the subsequent manner
Authors can select the pressure gradient force (F p), added (virtual) mass force (F VM), and raise force (F L) as some of the common non-drag forces. In order to prevent incursion, researchers may say it like this
Depending on the flow conditions, the majority of these forces can be ignored and only the drag and pressure gradient forces need to be considered, such as in cases where the specific mass difference between the fluid and molecules is high (ρp
Unless otherwise indicated, the drag coefficient C D is used to determine the drag force, F D, that affects the particles.
In fluid dynamics, variables such as the relative velocity between the particle and fluid (u – v p) and the projected area of the particle in the direction of the flow (Á) influence the drag force experienced by a particle traveling through a fluid. The Rocky package includes a number of drag correlations that account for differences in particle shape (spherical and non-spherical) and particle concentration (divide or dense flows) [22]. The idea of the relative particle Reynolds number, Rep, which is based on the relative vellications of the particle and the fluid, is used in these communications. Figure 4 explains the effect of the drag force. Using the appropriate drag correlation depending on the flow conditions and particle characteristics is made possible by the Rocky package.

The drag force effect on the particle.
The size, shape, and fluid characteristics of the particle as well as the fluid’s velocity through the pipe all affect how much drag a particle experiences in a sewage system. A typical way to describe the drag force acting on a particle in a liquid is to use the drag equation, which is given as
There are other factors to take into account when calculating the drag force a particle experiences in a sewage tube. This consists of the following parameters are F drag represents the drag force; ρf denotes the fluid density; indicates the fluid velocity relative to the particle; and C d is the particle’s drag coefficient. Additionally, A represents the particle’s projected area perpendicular to the flow direction. In this case, the flow rate of water is 0.49 m/s for an 8-inch pipe size, and this information can be used to calculate the particle’s velocity. It is important to note that a particle’s size and shape influence its projected area and drag coefficient.
Most of the small particles in waste water are either irregularly shaped or spherical, and that in turn determines their bulk drag force by means of its Reynolds number. This gives one an insight into how fluid regimes may be distributed around and even within individual particles. Therefore, you require additional details about the specific situation and characteristics of the carriages to properly calculate the drag force – such as the Reynolds number, elasticity at this flow, as well as the size and shape of each individual particle.
This includes information on Reynolds number (method for fluid), fluid density, and particle size and shape. These extensive data allow for the accurate calculation of the drag force that the particle experiences.
3.4 Particle mass and particle count
The water flow was mixed with particles of sizes 1.2, 1, 0.8, 0.6, and 0.4 mm at a rate of 17.3 g/min. By carefully tracking each particle as it passed through the pipe, the total number of particles that passed through it was precisely calculated using Rocky software. Notably the term “particle out count” refers to the particles that were forced out of the pipe by the water flow, whereas the term “particle count” refers to the particles that are still inside the pipe as either surface residents or being transported.
Particle mass refers to the amount of particles that are added to a stream of water as it flows. More specifically, particle out mass indicates the particles leaving the pipeline’s outflow, while particle in mass indicates the particles that have settled inside the pipeline. Figure 5, which displays the particle count at the input and outflow of the diesel beseeching, provides pipe. Figure 5 provides insights into the behavior of particles as they enter and exit the pipe, showing the number of particles counted at the inlet compared to those counted at the exit. Subtracting the total particle injection count from the particle count at the output yields the quantity of sedimentation within the pipe. After the software ran for 30 s, it was discovered that some of the injected particles, specifically those with a size of 0.8%, came out of the pipe through the outlet. The green curve represents the second time point, indicating when the particle size departs from the pipe, while the departure is shown in red.

Illustrates the particle in count and particle out count.
Figure 6 displays the information about mass-inflow and mass-outflow. It shows the total mass of particles injected over a 120-s period. As shown by the blue curve, the masses of the particles recorded at the same time as the number of particles exiting the pipe were also measured at 29 seconds The numerical study explores various models to determine how they affect the movement of silt. According to the study, sediments with varying sizes respond differently to a given water flow velocity. The sediment weight in pipe can be calculated using Equation (8).

Illustrates the particle in mass and particle out mass.
As seen in Figure 7, the 1 mm sized particles, on the other hand, were scattered over a greater distance down the pipe but remained inside it. This indicates that there was no mass outflow. As a result, the total weight introduced into the water flow is equal to the total weight of sedimentation inside the pipe. Moreover, as Figure 8 illustrates, the sedimentation region moved farther away from the pipe’s starting point as compared to the dispersion of particles sized at 1.2, 1, 0.8, 1, and 1.2 mm, respectively. This is according to the examination of sediment sizes. For example, when 0.4 mm sized silt was sporadic distributed throughout the pipe, a sizable amount of weight came out of the pipe.

Relationship between flow velocity and sediment transport.
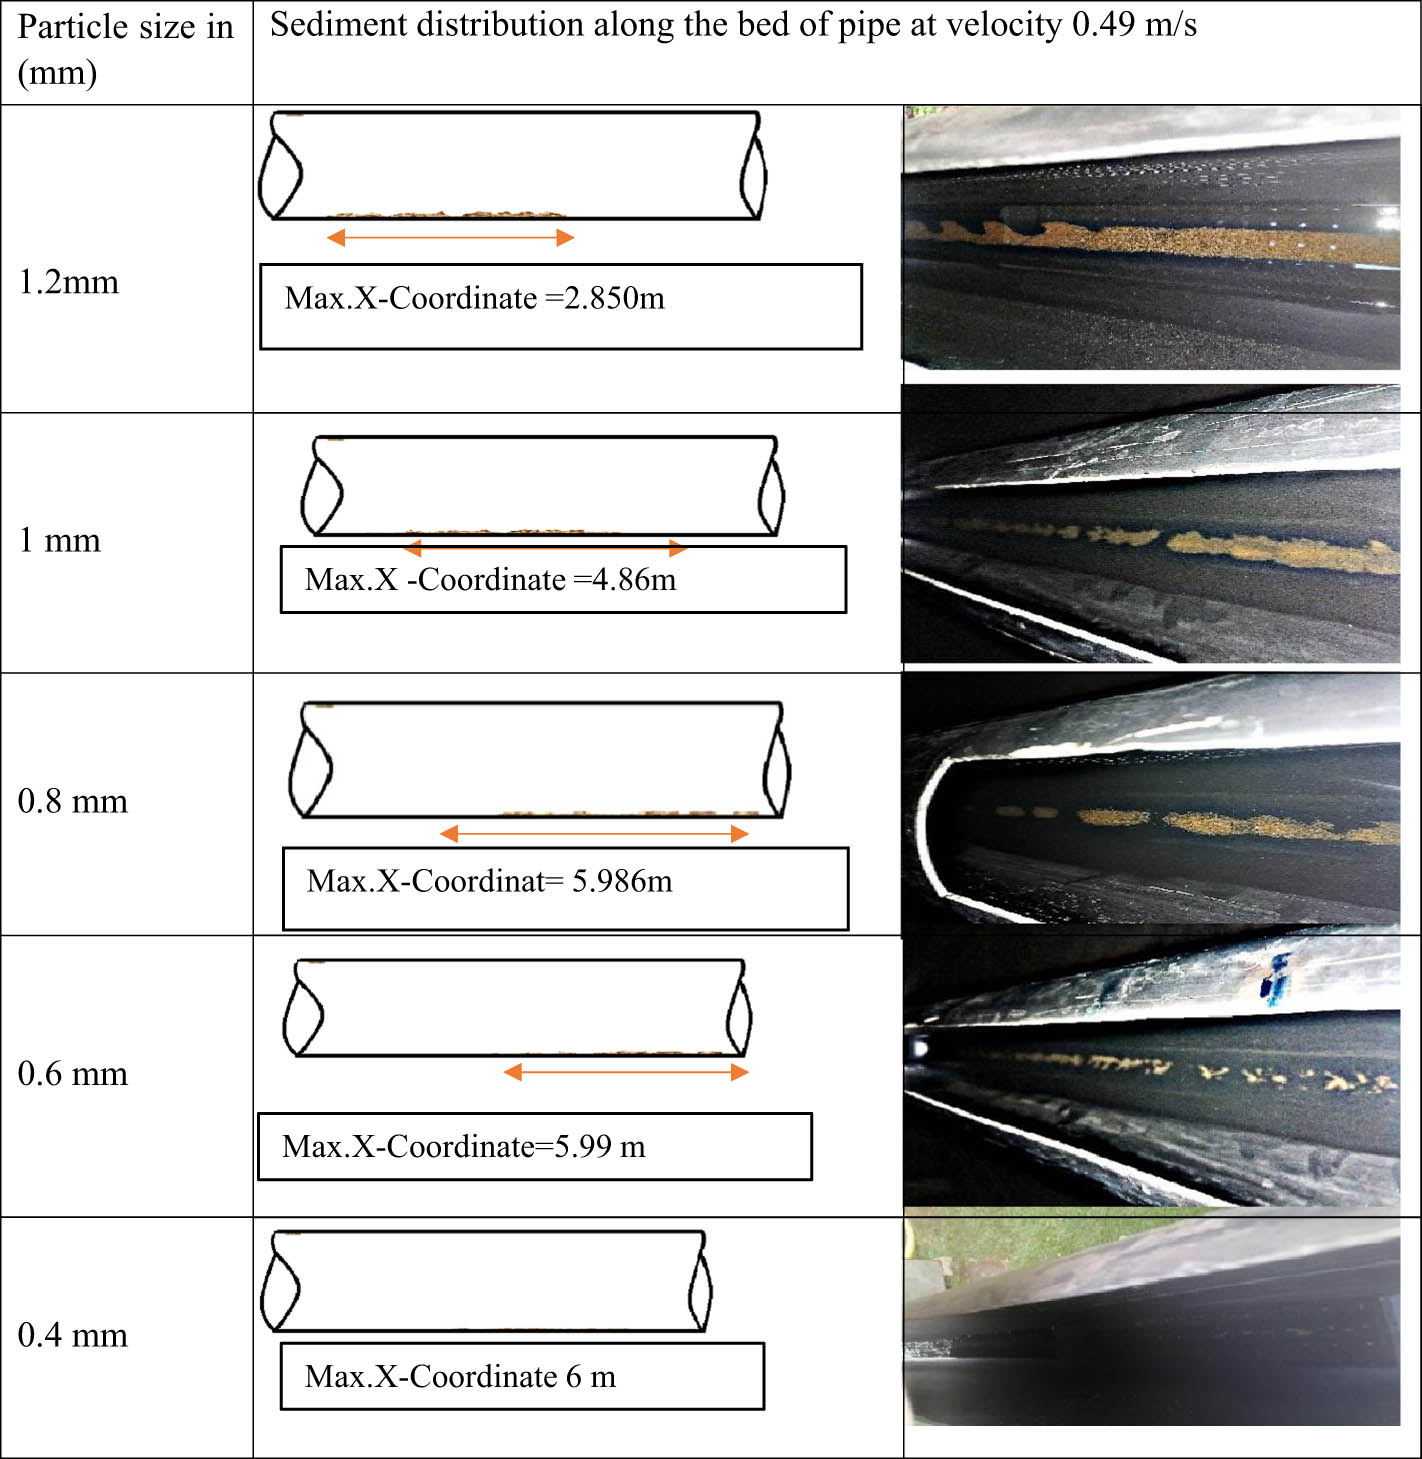
Depicts the sediment transport within a pipe and the sediment settled on the pipe’s bed at a velocity of 0.49 m/s. D represents the particle size and d represents the particle distribution on the bed.
4 Results
4.1 Experiential result
4.1.1 Effect of water velocity and particle size on sediment weight
Equation (8), which illustrates the particle-mass-inflow and mass-outflow in a sewer pipe, can be understood by applying the concept of mass conservation. It is possible to discretize the time domain and solve equations iteratively through empirical analysis. To calculate the mass of particles leaving the system, extract the mass entering from an accumulator. With a total particle feed rate of 130 g/s, Figure 7 shows sediment weights for a range of particle sizes (1.2, 1, 0.8, 0.6, and 0.4 mm) at various velocities (0.1, 0.2, 0.3, .35, 0.4, and 0.49 m/s). According to the findings shown in Figure 8, sediment weight falls for each particle size as velocity rises. For example, the sediment weight for 1.2 mm particles is 129.3 g at a velocity of 0.1 m/s and drops to 123.5 g at a velocity of 0.49 m/s.
Figure 8 shows that this trend holds true for other particle sizes as well. Similarly, with 0.4 mm particle size, the weight of the sediment drops as the velocity increases, going from 126 g at 0.1 m/s to 30 g at 0.49 m/s. Particles of varying sizes appear to be sediment along the pipe bed at a constant velocity of 0.49 m/s, as seen in Figure 8. The range of particle sizes is 1.2–0.4 mm. The results show that 1.2 mm particles indicate deposition within that range when they settle between the 50 and 120 cm locations along the pipe from the input. On the other hand, 0.4 mm particles do not show signs of sedimentation inside the pipe, indicating that the water flow drag force is responsible for their passage through and out of the exit.
4.2 Numerical result
4.2.1 Particle in mass and particle out mass
Particle mass input, particle mass output, and sedimentation inside the network of sewer pipes must all be taken into account in the domain of sewer system-sediment-transport simulations. Particle feeding and its dependence on velocity are demonstrated in Figure 9, where the effect of water drags forces on particle masses leaving the conduit and settling at its bed is highlighted.

Sediment weight in the pipe at different velocities and particle size of 0.4 mm.
Numerous numerical investigations have been conducted on this phenomenon, especially with regard to equation (5). Drag force effects on particle size are responsible for the total sedimentation seen at particle sizes of 1.2 and 1 mm within the pipe, showing the clear impact of sediment size on sedimentation. The wandering particles result from an increase in drag force due to their size as they settle against the bed of the pipe. Additionally, Figure 9 shows how particles of different sizes (0.8 mm, 0.6 mm, and 0.4 mm) behave differently, with varying sediment masses exiting the pipe depending on their size. Figure 10 further illustrates this phenomenon by comparing the behaviors of the smallest and largest particle sizes.

Shows the weight of sediments and mass out accumulated for particle sizes of 1.2 and 0.4 mm.
The impact of the sediment phenomenon is more evident when particle sizes of 1.2 and 0.4 mm are taken into account, as Figure 10 illustrates. The figure shows that at different vellications, sediments with a size of 1.2 mm were consistently deposited on the pipe’s bed. On the other hand, as shown by Figure 10, the majority of the sediment mass for particles with a size of 0.4 mm remained suspended in the pipe flow, with just small amounts settling on the pipe’s bottom.
5 Discussion
The data show that there is a strong relationship between the size of the sediment particles and the process of sedimentation in pipes. In fluid flow, smaller molecules move more easily and can cover greater distances before settling. On the other hand, due to the drag force, which is related to the exposed surface, larger particles have a tendency to settle closer to the intake side. Smaller particles can travel more quickly because the drag force is less strong. This factor reduces the surface exposed to liquid, thus increasing drag force and accelerating stability. The velocity of water and sedimentation are interdependent. Refilling with sediment can be analyzed based on how the fluid force decreases at slower velocities, which shortens the sediment's kinetic distance. High water velocity plays a crucial role in flushing sediment out of the pipe, highlighting the importance of proximity parameters alongside high water velocity. The sediment distribution seemed to go along the x-coordinate from 0 to 148.1 cm at 1.2 mm particle size for 0.49 cm/s. There may be variations to a particle with an impact based on the flow dynamics leading to an increased sediment buildup.
6 Conclusion
From the research, it is proven that particle size and water velocity have effects on sediment behaviors. In the first case, particle size influenced the diffusion of settled particles along the base of the pipe, which is evident from the differences in the x-coordinates that the particles reached before settling. Additionally, water velocity affected the quantity of sediment and the distribution points on the pipe’s bed.
Since fine particles settled slower than larger particles, especially at low sedimentation velocities, the maximum settling locations of finer particles are decreasing. Hence, as the research points out, smaller particles attain lower maximum positions at a given deposition velocity. This notion further supported the fact that this interpretation was indeed upheld by the statement that the results of the numerical analysis agreed with the theoretical concerns.
This study tests the effect of sediment dispersion in reducing the pipe efficiency as the particle size decreases. Its findings show that, with a fine particle of 0.6–0.4 d dimension, a relative efficiency ratio has an increased detrimental impact. The values and results described in this article might provide new critical information in the physics of sedimentation of particles and its aspects and variables of that in a sewer.
A rising torque power due to a higher water flow velocity triggers posts to settle further apart; the phenomenon is most pronounced for large particles.
The article reports that “the study showed that when high water flow rates are maintained, several suspensions can be reduced, resulting in a clear sewer system and continuous flow of water.”
There are two ways to reduce bottlenecks in sewage lines due to the accumulation of silt which are
Increasing water velocity positively impacts sediment transport, facilitating the deposition of particles at greater distances along the x-coordinate, especially in sewer networks with reduced diameters.
Installing filters within the sewage network is another method to mitigate silt accumulation and prevent larger particles from entering the system.
Acknowledgements
Thanks to Allah his majesty, for completing this work. This project would not have been possible without the assistance of many individuals. MAK is grateful to those people, who donated their time and advice, especially supervisors Prof. Dr. Basim Khalil Nile and Prof. Dr. Waqed H. Hassan for their guidance, advice, invaluable remarks, and fruitful discussions throughout the preparation of thesis.
-
Funding information: The authors state no funding involved.
-
Authors contributions: All authors have accepted responsibility for the entire content of this manuscript and consented to its submission to the journal, reviewed all the results and approved the final version of the manuscript. MAK conceptualized the research study; led the data collection process; analyzed and interpreted the data; drafted the initial manuscript; contributed to the conception and design of the work. BKN assisted in the development of the research methodology; played a key role in data acquisition and verification; contributed to the critical revision of the manuscript for important intellectual content; provided resources and access to necessary data or study materials. WHH provided expertise in explaining thebehavior of sediments during transport in networks, crucial for the research focus; assisted with data analysis and interpretation with a focus on analysis of sediment weighing ratios; contributed to manuscript preparation, specifically the sections/topics, and also assisted in drafting and revising the manuscript, ensuring accuracy and integrity.
-
Conflict of interest: Authors state no conflict of interest.
-
Data availability statement: Most datasets generated and analyzed in this study are in this submitted manuscript. The other datasets are available on reasonable request from the corresponding author with the attached information.
References
[1] Mohsen KA, Nile BK, Hassan WH. Experimental work on improving the efficiency of storm networks using a new galley design filter bucket. IOP Conf Ser Mater Sci Eng. 2020;671(1):1757–899.10.1088/1757-899X/671/1/012094Search in Google Scholar
[2] Nile BK. Effectiveness of hydraulic and hydrologic parameters in assessing storm system flooding. Adv Civ Eng. 2018;2018(1):4639172.10.1155/2018/4639172Search in Google Scholar
[3] Majeed AR, Nile BK, Al-Baidhani JH. Selection of suitable PDF model and build of IDF curves for rainfall in Najaf city, Iraq. J Phys Conf Ser. 2021;1973(1):012184.10.1088/1742-6596/1973/1/012184Search in Google Scholar
[4] Al-Awadi AT, Al-Saadi RJM, Mutasher AKA. Frequency analysis of rainfall events in Karbala city, Iraq, by creating a proposed formula with eight probability distribution theories. Smart Sci. 2023;11(3):639–48.10.1080/23080477.2023.2220916Search in Google Scholar
[5] Al-Janabi AH, Al-Saadi RJ, Alwan HH. A laboratory watershed model to study the effect of rainfall intensity and soil surface slope on surface runoff rate of Karbala Desert Soil. Iraqi Geol J. 2023;56(2):146–59.10.46717/igj.56.2E.11ms-2023-11-16Search in Google Scholar
[6] Nayel MO, Nile BK, Al-Hamami HAM. Estimation of the floods that occur in the drainage network during the rainy season. J Eng Appl Sci. 2018;13(Specialissue 10):8178–87.Search in Google Scholar
[7] Hussein AO, Shahid S, Basim KN, Chelliapan S. Modelling of sewage quality during rainy season. Asian J Microbiol Biotechnol Env Sci. 2015;17(3):593–601.Search in Google Scholar
[8] Kokaz MA, Nile BK, Hassan WH. An experimental and numerical study investigating sediment transport position in the bed of sewer pipes in Karbala. Open Eng. 2024;14(1):568–72.10.1515/eng-2022-0505Search in Google Scholar
[9] Omran ZA, Al-mansori NJH. Sediment transport modelling upstream of Al Kufa Barrage. Open Eng. 2024;14(1):20220542.10.1515/eng-2022-0542Search in Google Scholar
[10] Omran ZA, Al-mansori NJH. Forecasting empirical formula for suspended sediment load prediction at upstream of Al-Kufa barrage, Kufa City, Iraq. Open Eng. 2024;14(1):1–8.10.1515/eng-2022-0541Search in Google Scholar
[11] Nile BK, Al-Baidhani JH, Ghulam AN. A dimensional analysis of local sandy soil erosion induced by Leaky Sewer Pipes. In IOP Conference Series: Materials Science and Engineering. IOP Publishing Ltd; 2020.10.1088/1757-899X/928/2/022142Search in Google Scholar
[12] Montes C, Berardi L, Kapelan Z, Saldarriaga J. Predicting bedload sediment transport of non-cohesive material in sewer pipes using evolutionary polynomial regression–multi-objective genetic algorithm strategy. Urban Water J. 2020;17(2):154–62. 10.1080/1573062X.2020.1748210.Search in Google Scholar
[13] Regueiro-Picallo M, Anta J, Naves A, Figueroa A, Rieckermann J. Towards urban drainage sediment accumulation monitoring using temperature sensors. Env Sci Water Res Technol. 2023;9(12):3200–12.10.1039/D2EW00820CSearch in Google Scholar
[14] Gavrić S, Flanagan K, Wei H, Österlund H, Lundy L, Viklander M. Accumulation and contamination of gully pot sediments from varied land-use types: metal loads, concentrations and speciation. Env Sci Pollut Res. 2023;30(50):109825–40. 10.1007/s11356-023-30062-1.Search in Google Scholar PubMed PubMed Central
[15] Hassan WH, Hussein HH, Mohammed SS, Jalal HK, Nile BK. Evaluation of gene expression programming to predict the local scour depth around a bridge pier. J Eng Sci Technol. 2021;16(2):1232–43.Search in Google Scholar
[16] Naves J, Anta J, Suárez J, Puertas J. Hydraulic, wash-off and sediment transport experiments in a full-scale urban drainage physical model. Sci Data. 2020;7(1):1–13.10.1038/s41597-020-0384-zSearch in Google Scholar PubMed PubMed Central
[17] Murali MK, Hipsey MR, Ghadouani A, Yuan Z. SewerSedfoam: A model for free surface flow, sediment transport, and deposited bed morphology in sewers. Water (Switzerland). 2020;12(1):1–21.10.3390/w12010270Search in Google Scholar
[18] Flanagan K, Blecken GT, Osterlund H, Nordqvist K, Viklander M. Contamination of urban stormwater pond sediments: A study of 259 legacy and contemporary organic substances. Env Sci Technol. 2021;55(5):3009–20.10.1021/acs.est.0c07782Search in Google Scholar PubMed PubMed Central
[19] Sun C, Parellada B, Feng J, Puig V, Cembrano G. Factors influencing the stormwater quality model of sewer networks and a case study of Louis Fargue urban catchment in Bordeaux, France. Water Sci Technol. 2020;81(10):2232–43.10.2166/wst.2020.280Search in Google Scholar PubMed
[20] Yan H, Vosswinkel N, Ebbert S, Lipeme Kouyi G, Mohn R, Uhl M, et al. Numerical investigation of particles’ transport, deposition and resuspension under unsteady conditions in constructed stormwater ponds. Env Sci Eur. 2020;32(1):32–76. 10.1186/s12302-020-00349-y.Search in Google Scholar
[21] Shen W, Davis T, Lin DKJ, Nachtsheim CJ. Dimensional analysis and its applications in statistics. J Qual Technol. 2014;46(3):185–98.10.1080/00224065.2014.11917964Search in Google Scholar
[22] Fantin D, Bos F. CFD-DEM coupling for systems of fluid and non-spherical particles; 2017. http://repository.tudelft.nl/.Search in Google Scholar
© 2024 the author(s), published by De Gruyter
This work is licensed under the Creative Commons Attribution 4.0 International License.
Articles in the same Issue
- Regular Articles
- Methodology of automated quality management
- Influence of vibratory conveyor design parameters on the trough motion and the self-synchronization of inertial vibrators
- Application of finite element method in industrial design, example of an electric motorcycle design project
- Correlative evaluation of the corrosion resilience and passivation properties of zinc and aluminum alloys in neutral chloride and acid-chloride solutions
- Will COVID “encourage” B2B and data exchange engineering in logistic firms?
- Influence of unsupported sleepers on flange climb derailment of two freight wagons
- A hybrid detection algorithm for 5G OTFS waveform for 64 and 256 QAM with Rayleigh and Rician channels
- Effect of short heat treatment on mechanical properties and shape memory properties of Cu–Al–Ni shape memory alloy
- Exploring the potential of ammonia and hydrogen as alternative fuels for transportation
- Impact of insulation on energy consumption and CO2 emissions in high-rise commercial buildings at various climate zones
- Advanced autopilot design with extremum-seeking control for aircraft control
- Adaptive multidimensional trust-based recommendation model for peer to peer applications
- Effects of CFRP sheets on the flexural behavior of high-strength concrete beam
- Enhancing urban sustainability through industrial synergy: A multidisciplinary framework for integrating sustainable industrial practices within urban settings – The case of Hamadan industrial city
- Advanced vibrant controller results of an energetic framework structure
- Application of the Taguchi method and RSM for process parameter optimization in AWSJ machining of CFRP composite-based orthopedic implants
- Improved correlation of soil modulus with SPT N values
- Technologies for high-temperature batch annealing of grain-oriented electrical steel: An overview
- Assessing the need for the adoption of digitalization in Indian small and medium enterprises
- A non-ideal hybridization issue for vertical TFET-based dielectric-modulated biosensor
- Optimizing data retrieval for enhanced data integrity verification in cloud environments
- Performance analysis of nonlinear crosstalk of WDM systems using modulation schemes criteria
- Nonlinear finite-element analysis of RC beams with various opening near supports
- Thermal analysis of Fe3O4–Cu/water over a cone: a fractional Maxwell model
- Radial–axial runner blade design using the coordinate slice technique
- Theoretical and experimental comparison between straight and curved continuous box girders
- Effect of the reinforcement ratio on the mechanical behaviour of textile-reinforced concrete composite: Experiment and numerical modeling
- Experimental and numerical investigation on composite beam–column joint connection behavior using different types of connection schemes
- Enhanced performance and robustness in anti-lock brake systems using barrier function-based integral sliding mode control
- Evaluation of the creep strength of samples produced by fused deposition modeling
- A combined feedforward-feedback controller design for nonlinear systems
- Effect of adjacent structures on footing settlement for different multi-building arrangements
- Analyzing the impact of curved tracks on wheel flange thickness reduction in railway systems
- Review Articles
- Mechanical and smart properties of cement nanocomposites containing nanomaterials: A brief review
- Applications of nanotechnology and nanoproduction techniques
- Relationship between indoor environmental quality and guests’ comfort and satisfaction at green hotels: A comprehensive review
- Communication
- Techniques to mitigate the admission of radon inside buildings
- Erratum
- Erratum to “Effect of short heat treatment on mechanical properties and shape memory properties of Cu–Al–Ni shape memory alloy”
- Special Issue: AESMT-3 - Part II
- Integrated fuzzy logic and multicriteria decision model methods for selecting suitable sites for wastewater treatment plant: A case study in the center of Basrah, Iraq
- Physical and mechanical response of porous metals composites with nano-natural additives
- Special Issue: AESMT-4 - Part II
- New recycling method of lubricant oil and the effect on the viscosity and viscous shear as an environmentally friendly
- Identify the effect of Fe2O3 nanoparticles on mechanical and microstructural characteristics of aluminum matrix composite produced by powder metallurgy technique
- Static behavior of piled raft foundation in clay
- Ultra-low-power CMOS ring oscillator with minimum power consumption of 2.9 pW using low-voltage biasing technique
- Using ANN for well type identifying and increasing production from Sa’di formation of Halfaya oil field – Iraq
- Optimizing the performance of concrete tiles using nano-papyrus and carbon fibers
- Special Issue: AESMT-5 - Part II
- Comparative the effect of distribution transformer coil shape on electromagnetic forces and their distribution using the FEM
- The complex of Weyl module in free characteristic in the event of a partition (7,5,3)
- Restrained captive domination number
- Experimental study of improving hot mix asphalt reinforced with carbon fibers
- Asphalt binder modified with recycled tyre rubber
- Thermal performance of radiant floor cooling with phase change material for energy-efficient buildings
- Surveying the prediction of risks in cryptocurrency investments using recurrent neural networks
- A deep reinforcement learning framework to modify LQR for an active vibration control applied to 2D building models
- Evaluation of mechanically stabilized earth retaining walls for different soil–structure interaction methods: A review
- Assessment of heat transfer in a triangular duct with different configurations of ribs using computational fluid dynamics
- Sulfate removal from wastewater by using waste material as an adsorbent
- Experimental investigation on strengthening lap joints subjected to bending in glulam timber beams using CFRP sheets
- A study of the vibrations of a rotor bearing suspended by a hybrid spring system of shape memory alloys
- Stability analysis of Hub dam under rapid drawdown
- Developing ANFIS-FMEA model for assessment and prioritization of potential trouble factors in Iraqi building projects
- Numerical and experimental comparison study of piled raft foundation
- Effect of asphalt modified with waste engine oil on the durability properties of hot asphalt mixtures with reclaimed asphalt pavement
- Hydraulic model for flood inundation in Diyala River Basin using HEC-RAS, PMP, and neural network
- Numerical study on discharge capacity of piano key side weir with various ratios of the crest length to the width
- The optimal allocation of thyristor-controlled series compensators for enhancement HVAC transmission lines Iraqi super grid by using seeker optimization algorithm
- Numerical and experimental study of the impact on aerodynamic characteristics of the NACA0012 airfoil
- Effect of nano-TiO2 on physical and rheological properties of asphalt cement
- Performance evolution of novel palm leaf powder used for enhancing hot mix asphalt
- Performance analysis, evaluation, and improvement of selected unsignalized intersection using SIDRA software – Case study
- Flexural behavior of RC beams externally reinforced with CFRP composites using various strategies
- Influence of fiber types on the properties of the artificial cold-bonded lightweight aggregates
- Experimental investigation of RC beams strengthened with externally bonded BFRP composites
- Generalized RKM methods for solving fifth-order quasi-linear fractional partial differential equation
- An experimental and numerical study investigating sediment transport position in the bed of sewer pipes in Karbala
- Role of individual component failure in the performance of a 1-out-of-3 cold standby system: A Markov model approach
- Implementation for the cases (5, 4) and (5, 4)/(2, 0)
- Center group actions and related concepts
- Experimental investigation of the effect of horizontal construction joints on the behavior of deep beams
- Deletion of a vertex in even sum domination
- Deep learning techniques in concrete powder mix designing
- Effect of loading type in concrete deep beam with strut reinforcement
- Studying the effect of using CFRP warping on strength of husk rice concrete columns
- Parametric analysis of the influence of climatic factors on the formation of traditional buildings in the city of Al Najaf
- Suitability location for landfill using a fuzzy-GIS model: A case study in Hillah, Iraq
- Hybrid approach for cost estimation of sustainable building projects using artificial neural networks
- Assessment of indirect tensile stress and tensile–strength ratio and creep compliance in HMA mixes with micro-silica and PMB
- Density functional theory to study stopping power of proton in water, lung, bladder, and intestine
- A review of single flow, flow boiling, and coating microchannel studies
- Effect of GFRP bar length on the flexural behavior of hybrid concrete beams strengthened with NSM bars
- Exploring the impact of parameters on flow boiling heat transfer in microchannels and coated microtubes: A comprehensive review
- Crumb rubber modification for enhanced rutting resistance in asphalt mixtures
- Special Issue: AESMT-6
- Design of a new sorting colors system based on PLC, TIA portal, and factory I/O programs
- Forecasting empirical formula for suspended sediment load prediction at upstream of Al-Kufa barrage, Kufa City, Iraq
- Optimization and characterization of sustainable geopolymer mortars based on palygorskite clay, water glass, and sodium hydroxide
- Sediment transport modelling upstream of Al Kufa Barrage
- Study of energy loss, range, and stopping time for proton in germanium and copper materials
- Effect of internal and external recycle ratios on the nutrient removal efficiency of anaerobic/anoxic/oxic (VIP) wastewater treatment plant
- Enhancing structural behaviour of polypropylene fibre concrete columns longitudinally reinforced with fibreglass bars
- Sustainable road paving: Enhancing concrete paver blocks with zeolite-enhanced cement
- Evaluation of the operational performance of Karbala waste water treatment plant under variable flow using GPS-X model
- Design and simulation of photonic crystal fiber for highly sensitive chemical sensing applications
- Optimization and design of a new column sequencing for crude oil distillation at Basrah refinery
- Inductive 3D numerical modelling of the tibia bone using MRI to examine von Mises stress and overall deformation
- An image encryption method based on modified elliptic curve Diffie-Hellman key exchange protocol and Hill Cipher
- Experimental investigation of generating superheated steam using a parabolic dish with a cylindrical cavity receiver: A case study
- Effect of surface roughness on the interface behavior of clayey soils
- Investigated of the optical properties for SiO2 by using Lorentz model
- Measurements of induced vibrations due to steel pipe pile driving in Al-Fao soil: Effect of partial end closure
- Experimental and numerical studies of ballistic resistance of hybrid sandwich composite body armor
- Evaluation of clay layer presence on shallow foundation settlement in dry sand under an earthquake
- Optimal design of mechanical performances of asphalt mixtures comprising nano-clay additives
- Advancing seismic performance: Isolators, TMDs, and multi-level strategies in reinforced concrete buildings
- Predicted evaporation in Basrah using artificial neural networks
- Energy management system for a small town to enhance quality of life
- Numerical study on entropy minimization in pipes with helical airfoil and CuO nanoparticle integration
- Equations and methodologies of inlet drainage system discharge coefficients: A review
- Thermal buckling analysis for hybrid and composite laminated plate by using new displacement function
- Investigation into the mechanical and thermal properties of lightweight mortar using commercial beads or recycled expanded polystyrene
- Experimental and theoretical analysis of single-jet column and concrete column using double-jet grouting technique applied at Al-Rashdia site
- The impact of incorporating waste materials on the mechanical and physical characteristics of tile adhesive materials
- Seismic resilience: Innovations in structural engineering for earthquake-prone areas
- Automatic human identification using fingerprint images based on Gabor filter and SIFT features fusion
- Performance of GRKM-method for solving classes of ordinary and partial differential equations of sixth-orders
- Visible light-boosted photodegradation activity of Ag–AgVO3/Zn0.5Mn0.5Fe2O4 supported heterojunctions for effective degradation of organic contaminates
- Production of sustainable concrete with treated cement kiln dust and iron slag waste aggregate
- Key effects on the structural behavior of fiber-reinforced lightweight concrete-ribbed slabs: A review
- A comparative analysis of the energy dissipation efficiency of various piano key weir types
- Special Issue: Transport 2022 - Part II
- Variability in road surface temperature in urban road network – A case study making use of mobile measurements
- Special Issue: BCEE5-2023
- Evaluation of reclaimed asphalt mixtures rejuvenated with waste engine oil to resist rutting deformation
- Assessment of potential resistance to moisture damage and fatigue cracks of asphalt mixture modified with ground granulated blast furnace slag
- Investigating seismic response in adjacent structures: A study on the impact of buildings’ orientation and distance considering soil–structure interaction
- Improvement of porosity of mortar using polyethylene glycol pre-polymer-impregnated mortar
- Three-dimensional analysis of steel beam-column bolted connections
- Assessment of agricultural drought in Iraq employing Landsat and MODIS imagery
- Performance evaluation of grouted porous asphalt concrete
- Optimization of local modified metakaolin-based geopolymer concrete by Taguchi method
- Effect of waste tire products on some characteristics of roller-compacted concrete
- Studying the lateral displacement of retaining wall supporting sandy soil under dynamic loads
- Seismic performance evaluation of concrete buttress dram (Dynamic linear analysis)
- Behavior of soil reinforced with micropiles
- Possibility of production high strength lightweight concrete containing organic waste aggregate and recycled steel fibers
- An investigation of self-sensing and mechanical properties of smart engineered cementitious composites reinforced with functional materials
- Forecasting changes in precipitation and temperatures of a regional watershed in Northern Iraq using LARS-WG model
- Experimental investigation of dynamic soil properties for modeling energy-absorbing layers
- Numerical investigation of the effect of longitudinal steel reinforcement ratio on the ductility of concrete beams
- An experimental study on the tensile properties of reinforced asphalt pavement
- Self-sensing behavior of hot asphalt mixture with steel fiber-based additive
- Behavior of ultra-high-performance concrete deep beams reinforced by basalt fibers
- Optimizing asphalt binder performance with various PET types
- Investigation of the hydraulic characteristics and homogeneity of the microstructure of the air voids in the sustainable rigid pavement
- Enhanced biogas production from municipal solid waste via digestion with cow manure: A case study
- Special Issue: AESMT-7 - Part I
- Preparation and investigation of cobalt nanoparticles by laser ablation: Structure, linear, and nonlinear optical properties
- Seismic analysis of RC building with plan irregularity in Baghdad/Iraq to obtain the optimal behavior
- The effect of urban environment on large-scale path loss model’s main parameters for mmWave 5G mobile network in Iraq
- Formatting a questionnaire for the quality control of river bank roads
- Vibration suppression of smart composite beam using model predictive controller
- Machine learning-based compressive strength estimation in nanomaterial-modified lightweight concrete
- In-depth analysis of critical factors affecting Iraqi construction projects performance
- Behavior of container berth structure under the influence of environmental and operational loads
- Energy absorption and impact response of ballistic resistance laminate
- Effect of water-absorbent polymer balls in internal curing on punching shear behavior of bubble slabs
- Effect of surface roughness on interface shear strength parameters of sandy soils
- Evaluating the interaction for embedded H-steel section in normal concrete under monotonic and repeated loads
- Estimation of the settlement of pile head using ANN and multivariate linear regression based on the results of load transfer method
- Enhancing communication: Deep learning for Arabic sign language translation
- A review of recent studies of both heat pipe and evaporative cooling in passive heat recovery
- Effect of nano-silica on the mechanical properties of LWC
- An experimental study of some mechanical properties and absorption for polymer-modified cement mortar modified with superplasticizer
- Digital beamforming enhancement with LSTM-based deep learning for millimeter wave transmission
- Developing an efficient planning process for heritage buildings maintenance in Iraq
- Design and optimization of two-stage controller for three-phase multi-converter/multi-machine electric vehicle
- Evaluation of microstructure and mechanical properties of Al1050/Al2O3/Gr composite processed by forming operation ECAP
- Calculations of mass stopping power and range of protons in organic compounds (CH3OH, CH2O, and CO2) at energy range of 0.01–1,000 MeV
- Investigation of in vitro behavior of composite coating hydroxyapatite-nano silver on 316L stainless steel substrate by electrophoretic technic for biomedical tools
- A review: Enhancing tribological properties of journal bearings composite materials
- Improvements in the randomness and security of digital currency using the photon sponge hash function through Maiorana–McFarland S-box replacement
- Design a new scheme for image security using a deep learning technique of hierarchical parameters
- Special Issue: ICES 2023
- Comparative geotechnical analysis for ultimate bearing capacity of precast concrete piles using cone resistance measurements
- Visualizing sustainable rainwater harvesting: A case study of Karbala Province
- Geogrid reinforcement for improving bearing capacity and stability of square foundations
- Evaluation of the effluent concentrations of Karbala wastewater treatment plant using reliability analysis
- Adsorbent made with inexpensive, local resources
- Effect of drain pipes on seepage and slope stability through a zoned earth dam
- Sediment accumulation in an 8 inch sewer pipe for a sample of various particles obtained from the streets of Karbala city, Iraq
- Special Issue: IETAS 2024 - Part I
- Analyzing the impact of transfer learning on explanation accuracy in deep learning-based ECG recognition systems
- Effect of scale factor on the dynamic response of frame foundations
- Improving multi-object detection and tracking with deep learning, DeepSORT, and frame cancellation techniques
- The impact of using prestressed CFRP bars on the development of flexural strength
- Assessment of surface hardness and impact strength of denture base resins reinforced with silver–titanium dioxide and silver–zirconium dioxide nanoparticles: In vitro study
- A data augmentation approach to enhance breast cancer detection using generative adversarial and artificial neural networks
- Modification of the 5D Lorenz chaotic map with fuzzy numbers for video encryption in cloud computing
- Special Issue: 51st KKBN - Part I
- Evaluation of static bending caused damage of glass-fiber composite structure using terahertz inspection