Seismic performance evaluation of concrete buttress dram (Dynamic linear analysis)
-
Noor Nazar Al-Bayati
 ,
Chelang A. Arslan
,
Chelang A. Arslan

Abstract
Due to a variety of reasons, including the water retained inside and the intrinsic weight of the dam itself, dam constructions have the ability to move both horizontally and vertically. If these displacements exceed a crucial limit, a dam’s structural integrity is jeopardized. Concrete buttress dams in particular may be susceptible to high-frequency vibrations because of their slender structure, especially when the flow of water is involved. The Khassa Chi Dam, which is located northeast of Kirkuk City, is the subject of this study’s attempt to offer an alternative since the constructed dam is an embankment dam. In this research, a concrete buttress dam design was studied as an alternative dam to the constructed one. Such designs exemplify one form of gravity dams widely implemented on diverse soil types. Finite element model (FEM) was employed to simulate the behavior of the dam. The simulation utilized DIANA FEA, which relies on governing equations. There are several steps involved in developing an accurate FEM that faithfully simulates the actual behavior of a dam and predicts its future responses. The model is evaluated in later analyses in terms of stress and displacement. In this context, RSA was conducted on the modeled buttress dam. The outcome of the displacement analysis of the buttress dam exhibited its safety across all load combinations after undergoing linear dynamic analysis. This analysis included Eigenvalue Analysis and RSA. The response remained low at seismic frequencies below 3 Hz, and the extent of displacement correlated with the frequency values.
Abbreviation
- RSA
-
response spectrum analysis
- RHA
-
response history analysis
- FEA
-
Finite Element Analysis
- DIANA FEA
-
DIsplacement ANAlyser
- IRAM
-
implicitly restarted Arnoldi method
1 Introduction
A buttress dam is a particular type of gravity dam distinguished by its relatively thin profile. This kind of dam generally consists of a sloping face that holds the water that is being held back. It is supported by buttress walls that are carefully placed along the dam’s axis: a configuration designed to maximize the use of materials. The mass of the structure and the vertical force the reservoir’s water exerts against the sloped front surface are both important factors in the design’s overall stability. This method offers a resource-efficient design in contrast to the traditional homogenous gravity dam [1]. Various dam categories are defined by this fundamental idea based on how the water-retaining facade is set up. These classifications include the massive head type, multiple arch type, Ambursen/flat slab type, and slender buttress dam type.
Buttress walls support the flat reinforced concrete slab that is used to build flat slab buttress dams. On top of the flat slab, these dams have a constant upstream face slope. The Norwegian-American engineer Nils F. Ambursen filed a patent for this design, which was extensively used in the first half of the twentieth century [1]. It is established that each facility possesses a distinct design lifespan determined by factors such as conditions, building type, and the facility’s intended purpose, whether industrial, educational, or hydraulic. Post the designated design lifespan, alternative strategies are explored to ensure the continued functionality of these facilities and the services they provide.
Abbasiverki et al. [2] in their study investigated the nonlinear response of concrete buttress dams to high-frequency vibrations. This study considers how topography affects the consequences of amplification. The topographic amplification of seismic waves on the canyon surface is what causes the uneven stress distribution among the monoliths. When compared to low-frequency excitation, this behavior is more obvious with high-frequency excitation. Vibrations introduced across the stream cause joints to separate and the stress inside the dam to increase. As a result, the dam’s security is jeopardized, especially when high-frequency stimulation is present. Marence et al. [3] studied the evaluation of the reliability of a gravity dam block through the integration of a Directional Adaptive Response Surface full probabilistic method and 3D coupled flow-stress finite element analysis using the DIANA FEA software, The study demonstrated that the response of this particular dam is significantly affected by the topographic amplification of high-frequency excitations. The safety of the dam was compromised as a result of cross-stream vibrations, which led to the opening of joints and an escalation of stresses. The utilization of the foundation modeling approach had a noteworthy influence on the computed response of the dam. The method which assumes zero mass yielded outcomes that were deemed untrustworthy, particularly in instances of excitations with high frequencies. The utilization of the analytical method for free-field modeling resulted in joint openings that were deemed unreliable. Hence, it is advisable to employ a precise methodology for the modeling of foundations, particularly when nonlinearity is taken into account. Løkke and Chopra [4] offered an assessment of the precision of the response spectrum analysis (RSA) method. This is achieved by conducting a comparative analysis between the outcomes of the RSA technique and those derived from the response history analysis (RHA) of the dam. The latter is modeled as a finite-element system that incorporates the interaction between the dam, water, and foundation. The RHA procedure was utilized to determine the earthquake response of a real dam to a set of 58 ground motions. These motions were carefully chosen and adjusted to align with a target spectrum that was established through a probabilistic seismic hazard analysis for the specific location of the dam. The benchmark result was obtained by determining the median of the peak responses of the dam to 58 ground motions. The estimation of the peak response was conducted through the RSA procedure, which was directly derived from the median response spectrum. The findings indicate that the RSA method is capable of providing stress estimates with an acceptable level of accuracy for the initial stage of dam design and for assessing the safety of already existing dams. The RSA procedure has achieved a noteworthy level of accuracy, particularly given the intricate impacts of dam–water–foundation interaction and reservoir bottom absorption on the system’s dynamics, as well as the numerous approximations required to formulate the procedure. Jonker et al. [5] in their research examined the structural analyses of the Clover Dam made during the safety review. 3-D finite element studies for thermal, static, and seismic loads were used in the structural evaluations. The review’s conclusion was that the dam’s gravity and buttress components don’t adhere to modern design requirements. The operating limitations and the limited access to the places inside the dam where remedial work was needed made it difficult to create workable repair alternatives. In this research, an alternative buttress dam stability was investigated by testing the linear behavior of the proposed dam under different frequency seismic excitations.
The city of Kirkuk is one of the northern cities dependent on the Tigris River for its water supply because of the water imbalance during the seasons of the year, the resort has resorted to the construction of a seasonal dam on the river Khassa Chai. The purpose of constructing the dam: Providing part of the drinking water needs of the city of Kirkuk, strengthening groundwater, activating tourism in the region, and agriculture and animal husbandry.
The site of the dam at Kirkuk Governorate/on a private valley 15 km north-east of the city of Kirkuk, since the dams are one of the infrastructures with a definite age, this research suggests the construction of a concrete buttress dam on Khassa Chi. The research aims to make a comparison between the construction of an old earth dam and the proposed buttress dam on Khassa Chi by considering the displacement analysis due to different frequencies of earthquakes (Figures 1 and 2).

Location of Khassa Chi Proposed dam.

Khassa Chi dam currently.
2 Earthquake analysis for buttress dam
Large earthquakes frequently happen near plate boundaries. However, the interior of the plates releases 95% of the seismic energy. These are referred to as intraplate earthquakes [6]. Intraplate seismology understanding has advanced during the past few decades. Intraplate earthquakes are less stationary than previously thought, suggesting a more sporadic occurrence in space. It is, however, impossible to forecast with any degree of accuracy when or where an earthquake will occur. Instead, probabilistic estimates – i.e., the likelihood that an earthquake of a given magnitude will occur in a particular location – are made [1]. The design earthquake motion is often provided as outcrop motions for dynamic assessments. However, the seismic input needs to be applied at the foundation’s base for a direct FE analysis [2].
2.1 Eigenvalue analysis for buttress dam
An important sort of vibration analysis is frequency response analysis, which determines how a structure reacts to a vibration of a certain amplitude. Eigenvalue analysis, also known as modal analysis, is a type of vibration analysis that aims to determine a structure’s natural frequencies. The primary use of Eigenvalue Analysis is to address resonance issues that may result in mechanical damage to the structure [7].
Finite element (FE) analysis has become a primary tool in the structural evaluation of concrete dams by analyzing the intrinsic value of the structure; a set of determinants is defined as the stiffness matrix to determine the coordinates of the structural model which are the locations and directions of the point forces and displacements; the mass matrix for locating forces on nodes and include Execute Eigenvalue Analysis for set IRAM or FEASR as solution method in this research select the (IRAM). The size of the subspace in this method is chosen empirically. A poor choice of this size could lead to the non-convergence of the method [8] and definition of solver type as well as number of eigenfrequencies and boundary of frequency.
2.2 Response spectrum analysis
The Response Spectrum Analysis technique is utilized to approximate the structural response to brief, stochastic, transient dynamic occurrences. Instances of such occurrences include seismic activities and tremors. The absence of precise information regarding the load’s temporal evolution poses a challenge for conducting an analysis that accounts for time-dependency. The event’s brief duration precludes it from being classified as an ergodic or stationary process, thereby rendering a random response methodology inapplicable [9].
The methodology of the response spectrum technique relies on a distinctive form of mode superposition. The concept entails furnishing an input that establishes a threshold for the maximum level of excitation that an eigenmode, characterized by a specific natural frequency and damping, can experience as a result of an event of this nature.
2.3 Steps of analysis
The definitions of the elements, including the material and geometrical qualities assigned to them, are checked during model evaluation. Moreover, the element assembly, or ordering of the element and nodal variables in the system set of degrees of freedom, is defined. The model evaluation can be configured with the following parameters:
An extended test of the aspect ratio and geometry of elements;
Employing a set of material safety factors;
Nodal normal of shell elements averaged;
A choice for assessing reinforcements;
Tolerance for constructing vector-based variable directions;
Automated tie-downs.
2.3.1 Analysis of structural Eigenvalues
The natural or Eigen frequencies and corresponding shape modes of a structure are identified using an eigenvalue analysis; Diana offers several types for carrying out an eigenvalue analysis: standard eigenvalue analysis, free vibration analysis, linearized stability analysis, heat flow analysis, fluid–structure interaction analysis, unsupported system with shift, and nonlinear system with shift [10].
2.3.2 The free vibration equations
To be resolved in the mode superposition approach, which are expressed as:
where K is the matrix of symmetric stiffness, M is The finite element mass matrix, ꞷ is the angular speed, and eigenvector is the mode shape vector that corresponds to the mode
2.3.3 The Execute Eigenvalue analysis
A user-specified number of Eigen pairs is calculated by the Arnoldi method-based eigenvalue analysis. It is possible to calculate up to n Eigen pairs, where n is the dimension of the system matrix [11].
According to the method of eigenvalue analysis used, the resulting eigenvalues are output in ascending order of absolute value: Standard eigenproblem, Free vibration, and Stability analysis [12].
2.3.4 Analysis of response spectrum
Response Spectrum Analysis is a way to figure out how a system will respond linearly when it is exposed to a base excitation spectrum. The Response Spectrum Method, as described by Gupta [13], is used to build Diana. Maximum forces, [11] which can be calculated from maximum relative displacements, are of special interest during the design process. Reaction Spectrum Analysis outputs are typically presented as multimodal summaries [14].
The algorithm in DIANA FEA works under the assumption that damping has a negligible contribution. In most cases, damping is already factored into the response spectrum indirectly.
Alternatively, sections of the critical damping factor
and the pseudo-inertia forces
Equilibrium of the forces gives
where a is the acceleration force,
The spectral acceleration SA is the absolute pseudo-acceleration’s maximum value
where the spectral displacement SD is
3 Load and load combinations [14]
3.1 Dead load
In the numerical model, gravity loads are typically categorized as body forces. With this process, the density and the gravitational acceleration could be calculated. Hence, the gravitational forces are determined by the modeled structure’s volume.
Here, V is the structure volume (mᴈ), γ: Unit weight of material (kg/mᴈ).
3.2 Hydrostatic water pressure
Is typically the main static external force at work on major dams? It is important to take into account hydrostatic pressure both upstream and downstream by combining the least advantageous two [15]. Equation (9) is used for calculating the hydrostatic pressure:
where
3.3 Uplift pressure
The uplift forces depend on the type of foundation at the bottom of the dam, where the uplift forces are taken into consideration if the foundation type is of type Mat foundation, and the intended forces are neglected in the case of the type of foundation continuously isolated [16]. In this research, foundation type isolated was assumed, and thus, the uplift forces could be neglected [16]; equation can be used to compute the uplift pressure distribution [17] (Figure 3):

Uplift pressure under dam.
where
3.4 Ice load
A shift in the amount of an already-developed ice cover at a reservoir causes the ice load on dams to change. The volume of the ice grows as the temperature rises, and vice versa. The ice cover will crack as the volume decreases, and those cracks are immediately filled with ice-cold water. The ice cover will be pushed by a rise in temperature, resulting in horizontal pressure from the ice cover to the surroundings. The thickness of the ice cover, the length of the hot weather, and the speed at which the temperature is rising all affect how much pressure is present [18].
The amount of the ice load can generally be considered with a range of 50–200 kN/m, The thickness of the ice cover can consequently be considered to be between (0.6 and 1) m. The thickness of the ice cover is expected to have a triangular distribution of the ice pressure, with the design water level having the highest pressure [17].
3.5 Earthquake loads
Typically, outcrop motions are used to represent the design earthquake motions for dynamic studies. However, the seismic input needs to be applied at the foundation’s base for a direct FE analysis [2].
After taking into account the accelerations that may be anticipated at each project site, as defined by the geology of the site, proximity to major faults, and earthquake history of the region, as indicated by seismic records available, earthquake loadings should be chosen. For projects without comprehensive seismicity investigations, the likelihood zone can be determined using seismic risk maps. For buildings in zones 0 and 1, an earthquake analysis is not necessary unless site analyses reveal the existence of faults that could cause structural damage in the event of an earthquake or previous earthquake epicenters are found nearby. The magnitude of the earthquake forces can be determined using the following techniques: Seismic Coefficient Method, Pseudo Dynamic Method, and Dynamic Methods [19].
3.6 Wind pressures
If a dam superstructure is carrying big crest gates, a wind pressure of 30 pounds per square foot in any direction should be used in the stability analysis.
4 Geometry and material characteristics of a concrete buttress dam
The concrete buttress dam that this research investigated was chosen due to its low cost and suitability for all soil types. Mass concrete’s strength and durability are affected by numerous variables. The concrete must be strong enough to safely withstand the design loads throughout the structure’s lifetime. The concrete must be resistant to the effects of weathering (freeze–thaw cycles), chemical activity, and erosion. The concrete’s strength and durability must be uniform throughout the construction, as the weakest point will determine its structural sufficiency [2].
The design of the dam was based on the data available in the site investigations of the dam site of Khassa Chi [20].
The design criteria for buttress dams are very similar to those for gravity dam structures. The key difference is the incorporation of the buttress thickness, represented by the letter “t,” which takes on the responsibility of supporting the additional load resulting from the size of the dam. This area includes the total of the separate space between succeeding buttresses (shown as ‘x’) and the actual buttress thickness (expressed as ‘t’).
As a result, it carries the weight of (x + t) meters of dam extension within a meter’s length of the buttress section. This is different from gravity dam segment lengths, which are often measured in units of meters. In order to take into account this situation, it is cleverly possible to change the density of water’s unit weight by using a surcharge factor, designated by the letter “S.” The form of this surcharge factor is S = (x + t)/t. As a result, w*(x + t)/t is the effective unit weight of water [21].
The bases of the dam were designed as the first stage in the design stage by relying on the sliding criterion and the stress criterion. The value of the largest base was taken to ensure the safety aspect and by relying on the available hydrological data, The study revealed that under normal operating conditions, the water height measures 55 m with an inclination angle of 50° [21]. This measurement corresponds to the initial section of the buttress. Subsequently, an additional section of the buttress was incorporated, measuring 1.5 m in width. The design of the final section of the buttress, with a width of 12 m, was based on the inclination of the initial section. Table 1 shows details [21].
The recommended buttress spacing depended on dam height
| Mean Dam height in m | The recommended buttress spacing in m |
|---|---|
|
|
4.5 |
| 15–30 | 4.5–7.5 |
| 30–45 | 7.5–12 |
|
|
12–15 |
Bold value represents the maximum and minimum limits.
By adding 3 m as free board the final dam height has been reached, employment DIANA FEA program for designing the dam, giving properties for each material, as will be shown in Table 2. All other design considerations were taken into consideration as selecting the slenderness ratio is the ratio of the height of the buttress to the thickness of the buttress, A lower slenderness ratio implies a wider base compared to the height, resulting in a more squat or stubby dam shape. This configuration offers inherent stability and resistance against overturning due to the greater base width. Lower slenderness ratios are often preferred in areas with high seismic activity to enhance the dam’s resistance to seismic forces. massiveness factor and plotting suitable master curve. The height of the dam is 58 and 55 m is max water level, based on represents the highest level of water ever observed in Khassa Chai natural conditions, to which a freeboard of 3 meters is added, and the freeboard significance stems from the fact that a sufficient freeboard reduces the likelihood of an uncontrolled release of water or tailings on the dam, preventing social and environmental effects upstream of the impoundment [22] (Figures 4 and 5).
Material properties for concrete dam and foundation and reservoir model
| Properties material | Density (kg/m3) | Young’s modulus (N/m2) | Poisson’s ratio | Mass density specification | Material class |
|---|---|---|---|---|---|
| Dam | 2,400 | 3.2 × 10¹⁰ | 0.2 | — | Concrete and masonry |
| Foundation | 0 | 8 × 10⁹ | 0.2 | Saturated density | Soil and rock |
| Reservoir | 1,000 | — | — | — | — |

Geometry of concrete buttress dam case study.

(a) Dam Model, (b) foundation model.
A dam is divided into a front side, which is a flat slab with a thickness of 3 meters, with a slope of 50 degrees. The angle of inclination is from 40 to 50 degrees, where the lower the angle, the better, as it will better resist forces coming from water from upstream [21].
The back side of the dam consists of three parts of the buttress, the first part is 46 m wide and 55 m high, which is located below the front slab, and the second Which is the insulation wall part is 1.5 m wide, and 58 m high, in which is located drainage gallery, and the third part is represented by a width of 12 m at the base and a height of 58 meters and all pillars are 4.5 meters thick, The foundation of the dam is 3 meters deep and 3 meters wide, which extends below the slab along the length of the dam, The concrete material has young’s modulus = 3.2 × 10¹⁰ N/m₂, density = 2,400 kg/m³, and Poisson’s ratio = 0.2.
4.1 Properties of foundation
The Khassa Chi valley traverses the northwest plunge of the Qadir Karam syncline in the project area. The Bakhtiari series has a dip direction that is virtually perpendicular to the valley; therefore, the bed slopes downwards from left to right banks. The dip angle is minor, ranging from 5 to 8 degrees.
The Khassa Chi River bed is situated in close proximity to the boundary between the comparatively pliable stratum of the left bank and the relatively dense stratum of the right bank, where the latter is presumed to overlay the stratum that is visible on the left bank.
The abutment on the left bank primarily consists of reddish clayey-silty marls, which are typically overlaid by clayey weathering products. Several thin layers of loosely cemented soft sandstone are present within the marls.
The predominant geological composition on the right bank consists of silty and sandy clay. The series under consideration exhibits a significant occurrence of beds composed of conglomerates that are well-cemented locally. Conglomerates are commonly observed as vast lenses.
The Khassa Chi valley is characterized by a prominent relief, primarily composed of conglomerates that constitute a significant portion of the series, situated above the crest elevation of the proposed dam. The site exhibits various instances of erosion and alluvial deposition. The upper terrace is characterized by the presence of thin layers of gravel and sand located at the apex of the left bank abutment. Conglomerates that are well cemented are situated on pre-existing formations in the vicinity of the slope that intersects the abutment of the left bank in the lower region.
The foundation on which the dam rests was chosen to be continuous strip footing, and in this case, the effect of the uplift forces resulting from groundwater behind and below the dam is neglected due to its low value [16], where the concrete part is under the front slab only and is 3 meters wide and 3 meters deep, and the foundation remains for the bottom of the buttress parts of the earth materials. The Khassa Chai valley is 300–350 m wide; it contains cobbles, gravel, and sand which are 3.5 to 5.0 meters thick.
4.2 Finite element modeling
The majority of the study was devoted to investigating and comprehending the modeling approach for buttress dam Analysis and all of its possible applications in DIANA.
Diana has several options for modeling structures such as a Rectangle system, coordinate system, and Relative Coordinate System; in this research, a coordinate system was used to model the dam structure [23], The system of equations to be solved for problems involving linear elasticity is:
where K is the stiffness matrix of system, u is a vector representing the unknown nodal degrees of freedom, such as rotation and displacement, and f is the nodal force vector that corresponds to the degrees of freedom u; each part of the dam was modeled DIANA program using the selected coordinates as shown:
Figure 6 depicts the dam–reservoir–foundation system’s finite element model for this study:

FEM for dam case study.
After modeling a dam, a water level in a reservoir is given, and then, the properties of each of the materials are determined as shown in Table 1. After applying mesh to it, the number of elements was determined as 177,081 elements as follows:
|
|
|
|
|
|
|
|
4.3 Boundary conditions
4.3.1 Constraints
The exterior faces of the base that lie in the YZ plane are constrained in the X direction, Similarly, we impose Y-axis constraints on the foundation’s outer faces aligned with the XZ plane, and Z-axis constraints on the foundation’s bottom face.
The reservoir-free surfaces’ head potential must be zeroed out. Because of this, we employ a fixed head potential on the reservoir’s upper and lower faces. The following sections provide the results of the concrete buttress dam analyses.
A set of hypotheses was identified
The distance of the near field reservoir has been determined at 150 m.
the type of foundation is isolated footing and uplift pressure is ignored.
the connection between the front slab and the buttress is rigid connection.
To begin, the mechanical properties of the FE models are analyzed by an eigenvalue analysis; in the first static step, loads of gravity and hydrostatic pressure are applied, and then, in the second step, nonlinear dynamic analyses are done (Figures 7 and 8):

Constraints of buttress dam foundation.

Definition of a frequency function for the combined load and earthquake (a response spectrum).
5 Results and discussion
5.1 Structural response analysis without reservoir
5.1.1 Eigenvalue analysis
A color map gradient from cool colors to warm colors to represent the level of displacement. Typically, warm colors such as red or orange are used to represent higher values, indicating areas of potential concern or higher displacement, while cool colors such as red and green refer to lower values. A preliminary design of the buttress dam with initial dimensions is done by using the DIANA FEA program, for load combination design (dead load only) with max. displacement +1 and min. displacement −1 and without considered reservoir (Figures 9–11).

Mode 1 with Eigen frequency 0.98950 × 10⁻¹ Hz: (a) displacement in the x direction, (b) displacement in the y direction, (c) displacement in the z direction, and (d) displacement in the xyz direction.

Mode 2 with Eigen frequency 0.43983 Hz: (a) displacement in the x direction, (b) displacement in the y direction, (c) displacement in the z direction, and (d) displacement in the xyz direction.
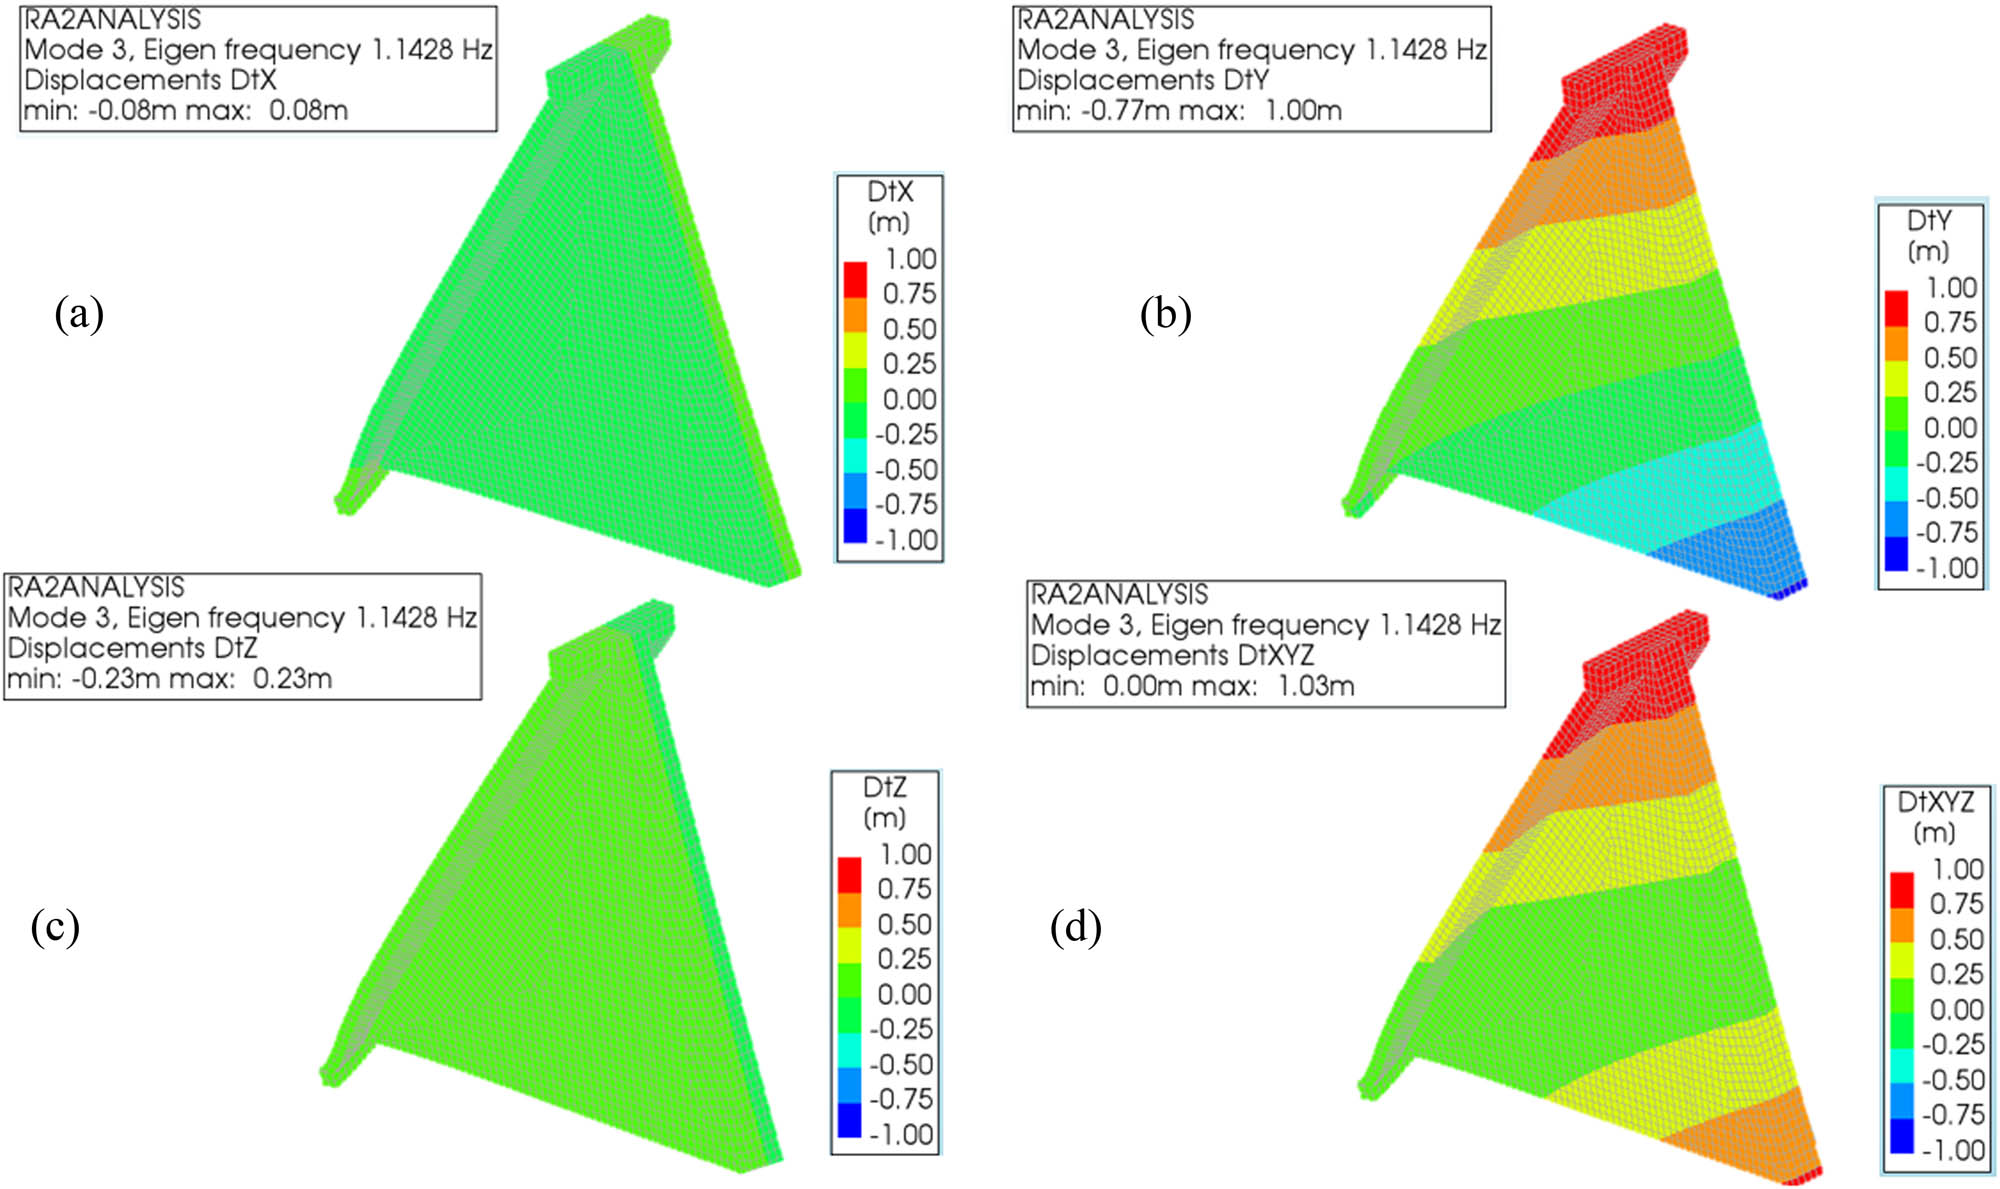
Mode 3 with Elgen frequency 1.1428 Hz: (a) displacement in the x direction, (b) displacement in the y direction, (c) displacement in the z direction, and (d) displacement in the xyz direction.
5.1.2 Response spectrum analysis
The analysis is being performed to obtain a quick estimate of the maximum displacement, the SRSS method is recommended in the previous study as a better choice. The range is specified displacement 0.2 as the maximum and −0.2 as a minimum in analysis displacement in Superposition type SRSS for Response Spectrum Analysis in DIANA FEA; the SRSS method takes into account the uncertainty in the results of the modal analyses. In other words, the SRSS method assumes that there is a chance that the actual maximum displacement could be slightly less than 0.2 and a chance that it could be slightly more than 0.2. The SRSS method then calculates a displacement that is likely to be exceeded only 50% of the time. This is a conservative approach that is often used in engineering design. It ensures that the structure is designed to withstand the most likely maximum displacement, while also taking into account the possibility of a slightly larger displacement. From the observation of figures, there appears a group of figures affected by vertical and horizontal forces; for example, the first figure of DtXH refers to the displacement of a point on a structure due to the horizontal component of a load, DtYL refers to the displacement of a point on a structure due to the vertical component of a load (Figure 12).

Superposition type SRSS for RSA.
5.2 Structural response analysis with reservoir
5.2.1 Eigenvalue analysis
Rage of displacements is (1, −1) and with an application with combination 2 for the eigenvalue and response spectrum analyses with reservoir (Deadweight and Hydrostatic Pressure load sets (Figures 13–15)).
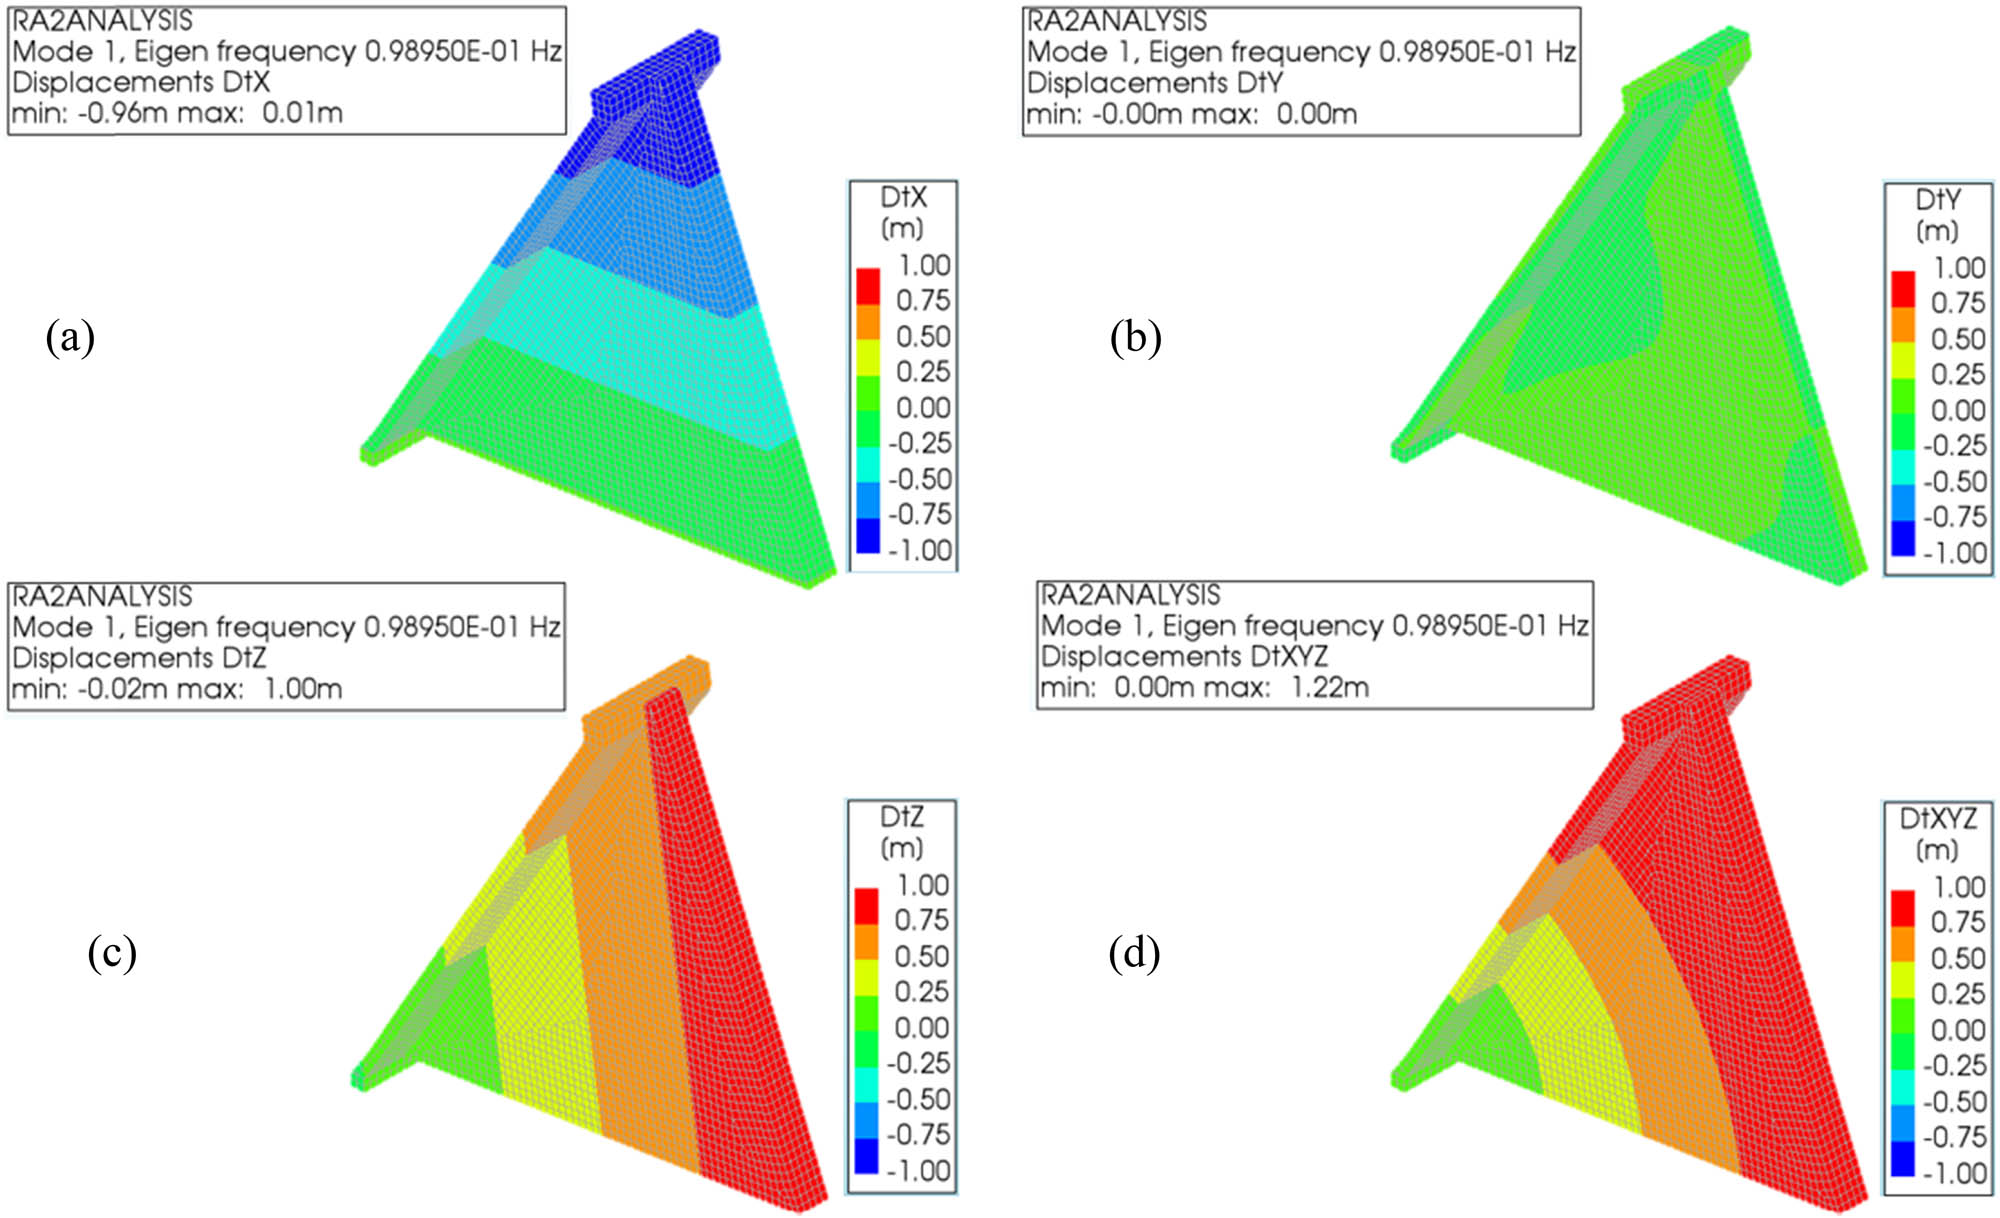
Mode 1 with Elgen frequency 0.98950 × 10⁻¹ Hz: (a) displacement in the x direction, (b) displacement in the y direction, (c) displacement in the z direction, and (d) displacement in the xyz direction.

Mode 2 with Elgen frequency 0.43983 Hz: (a) displacement in the x direction, (b) displacement in the y direction, (c) displacement in the z direction, and (d) displacement in the xyz direction.

Mode 3 with Elgen frequency 1.1428 Hz: (a) displacement in the x direction, (b) displacement in the y direction, (c) displacement in the z direction, and (d) displacement in the xyz direction.

Superposition-type SRSS for Response Spectrum Analysis.
5.2.2 Response spectrum analysis
The range is specified displacement 0.25 as the maximum and −0.25 as a minimum in analysis displacement in Superposition-type SRSS for Response Spectrum Analysis in DIANA FEA (Figure 16).
5.3 Stress
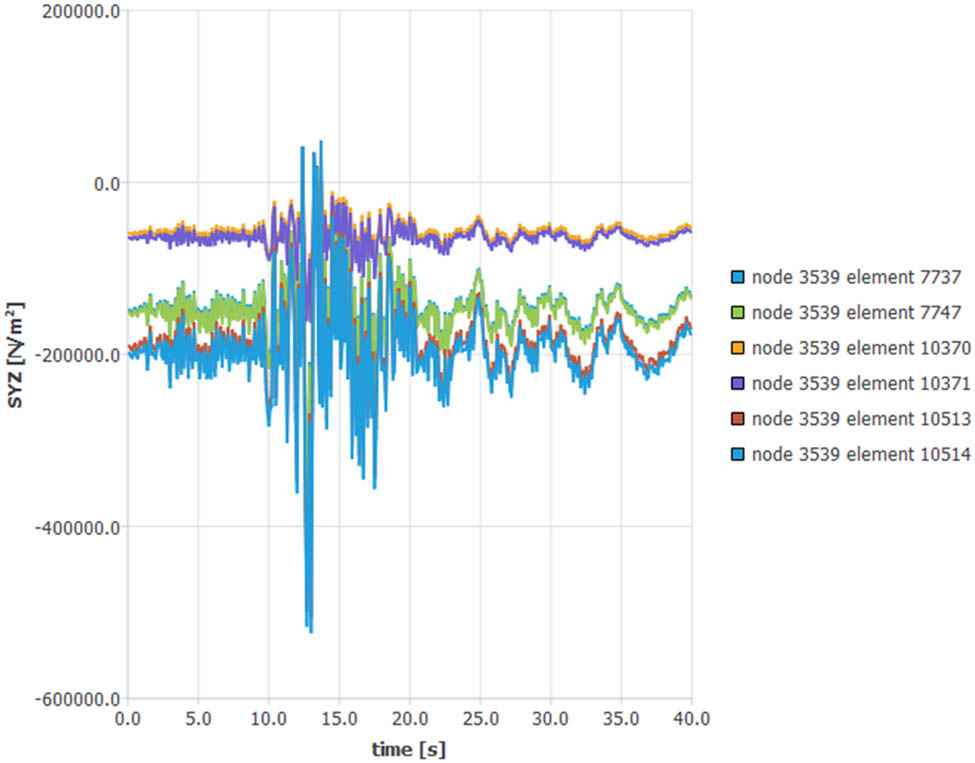
Figure 17 shows 6 Modes, which appear as stress for each of them in response to the force applied to the dam; in Figures 18–23, the first mode represents the normal stress component in the x-direction. It indicates the stress acting along the horizontal axis of the dam, Figure 17 shows the dam response to the model in the form of stress for node 3,539, which shares a group of elements. The amount of stress to which a node from each element is exposed varies, as the highest stress to which a node of an element is exposed appears from 7,737, and this element is shared with the upstream slab for this reason the stress to the x-direction becomes high on this node. The second mode shows the normal stress component in the y-direction. It indicates the stress acting along the vertical axis of the dam. The response of this dam to stress is shown in Figure 11, and the highest value of stress is also shown in the same previous element.

Element stress for all directions.

The normal stress component in the x-direction.

The normal stress component in the z-direction.
The shear stress component in the zy-plane.

The normal stress component in the y-direction.

The shear stress component in the xy-plane.
Stress in the third mode represents the normal stress component in the z-direction. It indicates the stress acting perpendicular to the surface of the dam. The stress of this model is represented in Figure 19; the data indicate that the highest stress comes from element 10,371, which is a common element between the node and freeboard. fourth mode appears the shear stress component in the xy-plane. It indicates the stress acting parallel to the base of the dam in the horizontal plane. data in Figure 20 refer to the maximum stress that came from 7,747 and this element is common with isolated footing. The fifth mode appears the shear stress component in the zy-plane. It indicates the stress acting parallel to the surface of the dam but in a different vertical plane. Data in Figure 21 refer to the maximum stress that came from 7,747, and this element is common with the upstream slab and refers to stress coming from hydrostatic pressure in the reservoir; final mode represents the shear stress component in the xz plane. It indicates the stress acting parallel to the side of the dam but in the vertical plane. Data in Figure 21 refer to the maximum stress that came from 7,737, and this element is common with the upstream slab and refers to stress coming from the abutment.

The shear stress component in the xz-plane.
6 Conclusions
The aim of this research article is to investigate a buttress concrete dam as an alternative to the Khassa Chai dam, especially the current one, which is considered one of the vital dams in the city of Kirkuk, using the Diana engineering program by subjected a dam under different seismic frequencies that ranged from (0.8710 × 10⁻¹ − 13.412) Hz, Where 10 mods were made with different seismic frequencies by using eigenvalue analysis, it was determined that a typical buttress has natural frequencies that are less than 3.7 Hz, which is a rather high frequency, due to the slenderness of the concrete buttresses, Since the city of Kirkuk is far from a seismic line, 3.7 Hz is considered very high for this region.
The design of this dam was based on the assumption that the foundation of a dam is a continuous strip footing, which means neglecting the lifting force resulting from the bottom of the dam due to the presence of groundwater, in addition to the movement of water from the upstream to the downstream.
The dynamic linear analysis included two methods: Eigenvalue analysis and Response spectrum analysis for evaluating dam model. Linear eigenvalue analyses are limited in their ability to account for nonlinear behavior; thus, the modeling of contraction joints as hinges is necessary. The natural frequencies associated with the free vibration modes of the monoliths in the buttress dam are relatively high.
To implement the Eigenvalue analysis method, the (IRAM) was chosen to determine the range of convergence in the values of the frequencies of specific 10 models. Despite the convergence of the applied frequency values, the results show a difference in the response of the dam for each of the randomly applied values of the frequencies, where the response spectrum appears in the results of the analysis that the response of the dam is low in the low frequencies, while the response of the dam increases in the high frequencies, which are non-Realistic frequencies in the Kirkuk area where the dam is located.
To execute damping of the dam, the RSA was the chosen (Implicitly included in the excitation spectrum) method for damping for reducing or preventing oscillation resulting from the frequency of seismic. The SRSS method was chosen in a Modal superposition. This approach is applicable in cases where all modes can be regarded as decoupled, meaning that each mode possesses a frequency that is sufficiently distant from its adjacent modes to conclude that those modes do not interfere with one another. The results ensured the safety of the dam from all load combinations applied to the suggested dam.
Acknowledgements
NNA, CAA, and WHH would like to particularly acknowledge and thank my supervisor for giving me this opportunity to complete this excellent project on the topic of optimizations, which also enabled me to conduct a great deal of research and learn about a ton of new topics. My knowledge and abilities significantly increased as a result.
-
Funding information: Authors declare that the manuscript was done depending on the personal effort of the author, and there is no funding effort from any side or organization.
-
Conflict of interest: The authors state no conflict of interest.
-
Data availability statement: Most data sets generated and analyzed in this study are comprised in this submitted manuscript. The other data sets are available on reasonable request from the corresponding author with the attached information. The data used to support this study are provided by the Ministry of Water Resources – The General Authority for Dams and Reservoirs – Private Jai Dam Project Management, and the Diana official website.
References
[1] Forsgren E, Berneheim I. Behavior of Swedish Concrete Buttress Dams at Sesmic Loading. Royal Institute of Technology (KTH). Kth publications; 2016. https://kth.diva-portal.org/smash/get/diva2:944687/FULLTEXT01.pdf.Search in Google Scholar
[2] Abbasiverki R, Malm R, Ansell A, Nordström E. Nonlinear behaviour of concrete buttress dams under high-frequency excitations taking into account topographical amplifications. Shock Vib. 2021;2021:1–22.10.1155/2021/4944682Search in Google Scholar
[3] Marence M, Evangeliou P. Reliability assessment of gravity dam block by coupling a Directional Adaptive Response Surface full probabilistic method and 3D coupled flow-stress finite element analysis using the DIANA FEA software; 14th ICOLD International Benchmark Workshop on Numerical Analysis of Dams, Stockholm, Sweden; 2017. https://www.mendeley.com/catalogue/fa721551-5b68-3704-a3e9-eeba5ece2b8c/?utm_source=desktop&utm_medium=1.19.8&utm_campaign=open_catalog&userDocumentId=%7Be3f0c511-48b3-4f70-9441-2559edb33cb4%7D.Search in Google Scholar
[4] Løkke A, Chopra AK. Response spectrum analysis of concrete gravity dams including dam-water-foundation interaction. J Struct Eng. 2015 Aug;141(8):4014202. 10.1061/(ASCE)ST.1943-541X.0001172.Search in Google Scholar
[5] Jonker M, Lopez F, Bosler J. Safety evaluation of a slab and buttress dam. In: Proceedings, NZSOLD-ANCOLD 2007 Conference on Dams. Advancing excellence in dams technical practice and the management of dams in Australia; 2007. p. 17–21.Search in Google Scholar
[6] Talwani P. Intraplate earthquakes. In: Talwani P, editor. Intraplate Earthquakes. United Kingdam: Cambridge University Press; 2012. 1–354. https://www.google.iq/books/edition/Intraplate_Earthquakes/RSFGAwAAQBAJ?hl=ar&gbpv=1&dq=Intraplate Earthquakes Talwani 2014&pg=PP1&printsec=frontcover.10.1017/CBO9781139628921.002Search in Google Scholar
[7] Degtyareva OG, Degtyarev GV, Lavrov NL, Aliev DU. Constructive-technological decisions in regulating the flow of atmospheric precipitation. Mag Civ Eng. 2018;82(6):32–48.Search in Google Scholar
[8] Shahzadeh Fazeli SA, Emad N, Liu Z. A key to choose subspace size in implicitly restarted Arnoldi method. Numer Algorithms. 2015;70(2):407–26. https://hal.science/hal-01070577/document.10.1007/s11075-014-9954-5Search in Google Scholar
[9] Li J, Wang W. Development of a new response spectrum analysis approach for determining elastic shear demands on shear-dominated steel building frames. Buildings. 2023;13(1):258.10.3390/buildings13010258Search in Google Scholar
[10] Zhou J, Li C, Arslan CA, Hasanipanah M, Bakhshandeh Amnieh H. Performance evaluation of hybrid FFA-ANFIS and GA-ANFIS models to predict particle size distribution of a muck-pile after blasting. Engineering with Computers. Vol. 37. London: Springer; 2021. http://libdb.csu.edu.cn:80/rwt/SPRINGERLINK/https/MSYXTLUQPJUB/10.1007/s00366-019-00822-0.Search in Google Scholar
[11] Huang Y. Random bit generation based on a self-chaotic microlaser with enhanced chaotic bandwidth. Nanophotonics. 2023;1:1–8. 10.1515/nanoph-2023-0549.Search in Google Scholar
[12] Zhou J, Nekouie A, Arslan CA, Pham BT, Hasanipanah M. Novel approach for forecasting the blast-induced AOp using a hybrid fuzzy system and firefly algorithm. Eng Comput. 2020;36(2):703–12.10.1007/s00366-019-00725-0Search in Google Scholar
[13] Gupta AK. Response Spectrum Method. Structural Dynamics. Blackwell Scientific Publications. Taylor & Francis; 2002. p. 102–53.Search in Google Scholar
[14] De Witte FC, Kikstra WP. DIANA finite element analysis. User’s manual. Anal Proced. 2005;1–23. https://manuals.dianafea.com/d106/.Search in Google Scholar
[15] Kraftnät S, Energi S. Dammsäkerhet och klimatförändringar. Final report from the Committee for dimensioning flows for dam facilities in a climate change perspective; 2011.Search in Google Scholar
[16] Mobasher AM. Design of irrigation structures; 2021. p. 3–5.Search in Google Scholar
[17] Chaoran F, Bjartmar PH. Progressive failure analyses of concrete buttress dams; 2015. https://www.diva-portal.org/smash/record.jsf?pid=diva2:824952.Search in Google Scholar
[18] Zuwak I, Kordoghly W. Numerical study of the effect of thermal ice loads on concrete dams. Royal Institute of Technology (KTH). KTH publications; 2020. http://kth.diva-portal.org/smash/get/diva2:1453911/FULLTEXT01.pdf.Search in Google Scholar
[19] Zangar CN. Hydrodynamic pressures on dams due to horizantal earthquake effect. Transactions on the Built Environment; 1895. p. 60.Search in Google Scholar
[20] Kadoury H. Site investigations of the dam site of Khassa Chi. kirkuk, Iraq: 2005.Search in Google Scholar
[21] Santosh Kumar Garg. Irrigation engineering and hydraulic structures. Vol. 20. New Zealand Agricultural Science. Khanna Piblishers; 1986. p. 2–7.Search in Google Scholar
[22] Quelopana H, Barrera S. A definition of freeboard. In: 3rd International Seminar on Tailings Management; 2015. p. 12.Search in Google Scholar
[23] Chai S. Finite element analysis for civil engineering with DIANA software. Jiangsu, China: Jointly published with Nanjing University Press; 2020. p. 644. www.EngineeringBooksPDF.com.10.1007/978-981-15-2945-0Search in Google Scholar
© 2024 the author(s), published by De Gruyter
This work is licensed under the Creative Commons Attribution 4.0 International License.
Articles in the same Issue
- Regular Articles
- Methodology of automated quality management
- Influence of vibratory conveyor design parameters on the trough motion and the self-synchronization of inertial vibrators
- Application of finite element method in industrial design, example of an electric motorcycle design project
- Correlative evaluation of the corrosion resilience and passivation properties of zinc and aluminum alloys in neutral chloride and acid-chloride solutions
- Will COVID “encourage” B2B and data exchange engineering in logistic firms?
- Influence of unsupported sleepers on flange climb derailment of two freight wagons
- A hybrid detection algorithm for 5G OTFS waveform for 64 and 256 QAM with Rayleigh and Rician channels
- Effect of short heat treatment on mechanical properties and shape memory properties of Cu–Al–Ni shape memory alloy
- Exploring the potential of ammonia and hydrogen as alternative fuels for transportation
- Impact of insulation on energy consumption and CO2 emissions in high-rise commercial buildings at various climate zones
- Advanced autopilot design with extremum-seeking control for aircraft control
- Adaptive multidimensional trust-based recommendation model for peer to peer applications
- Effects of CFRP sheets on the flexural behavior of high-strength concrete beam
- Enhancing urban sustainability through industrial synergy: A multidisciplinary framework for integrating sustainable industrial practices within urban settings – The case of Hamadan industrial city
- Advanced vibrant controller results of an energetic framework structure
- Application of the Taguchi method and RSM for process parameter optimization in AWSJ machining of CFRP composite-based orthopedic implants
- Improved correlation of soil modulus with SPT N values
- Technologies for high-temperature batch annealing of grain-oriented electrical steel: An overview
- Assessing the need for the adoption of digitalization in Indian small and medium enterprises
- A non-ideal hybridization issue for vertical TFET-based dielectric-modulated biosensor
- Optimizing data retrieval for enhanced data integrity verification in cloud environments
- Performance analysis of nonlinear crosstalk of WDM systems using modulation schemes criteria
- Nonlinear finite-element analysis of RC beams with various opening near supports
- Thermal analysis of Fe3O4–Cu/water over a cone: a fractional Maxwell model
- Radial–axial runner blade design using the coordinate slice technique
- Theoretical and experimental comparison between straight and curved continuous box girders
- Effect of the reinforcement ratio on the mechanical behaviour of textile-reinforced concrete composite: Experiment and numerical modeling
- Experimental and numerical investigation on composite beam–column joint connection behavior using different types of connection schemes
- Enhanced performance and robustness in anti-lock brake systems using barrier function-based integral sliding mode control
- Evaluation of the creep strength of samples produced by fused deposition modeling
- A combined feedforward-feedback controller design for nonlinear systems
- Effect of adjacent structures on footing settlement for different multi-building arrangements
- Analyzing the impact of curved tracks on wheel flange thickness reduction in railway systems
- Review Articles
- Mechanical and smart properties of cement nanocomposites containing nanomaterials: A brief review
- Applications of nanotechnology and nanoproduction techniques
- Relationship between indoor environmental quality and guests’ comfort and satisfaction at green hotels: A comprehensive review
- Communication
- Techniques to mitigate the admission of radon inside buildings
- Erratum
- Erratum to “Effect of short heat treatment on mechanical properties and shape memory properties of Cu–Al–Ni shape memory alloy”
- Special Issue: AESMT-3 - Part II
- Integrated fuzzy logic and multicriteria decision model methods for selecting suitable sites for wastewater treatment plant: A case study in the center of Basrah, Iraq
- Physical and mechanical response of porous metals composites with nano-natural additives
- Special Issue: AESMT-4 - Part II
- New recycling method of lubricant oil and the effect on the viscosity and viscous shear as an environmentally friendly
- Identify the effect of Fe2O3 nanoparticles on mechanical and microstructural characteristics of aluminum matrix composite produced by powder metallurgy technique
- Static behavior of piled raft foundation in clay
- Ultra-low-power CMOS ring oscillator with minimum power consumption of 2.9 pW using low-voltage biasing technique
- Using ANN for well type identifying and increasing production from Sa’di formation of Halfaya oil field – Iraq
- Optimizing the performance of concrete tiles using nano-papyrus and carbon fibers
- Special Issue: AESMT-5 - Part II
- Comparative the effect of distribution transformer coil shape on electromagnetic forces and their distribution using the FEM
- The complex of Weyl module in free characteristic in the event of a partition (7,5,3)
- Restrained captive domination number
- Experimental study of improving hot mix asphalt reinforced with carbon fibers
- Asphalt binder modified with recycled tyre rubber
- Thermal performance of radiant floor cooling with phase change material for energy-efficient buildings
- Surveying the prediction of risks in cryptocurrency investments using recurrent neural networks
- A deep reinforcement learning framework to modify LQR for an active vibration control applied to 2D building models
- Evaluation of mechanically stabilized earth retaining walls for different soil–structure interaction methods: A review
- Assessment of heat transfer in a triangular duct with different configurations of ribs using computational fluid dynamics
- Sulfate removal from wastewater by using waste material as an adsorbent
- Experimental investigation on strengthening lap joints subjected to bending in glulam timber beams using CFRP sheets
- A study of the vibrations of a rotor bearing suspended by a hybrid spring system of shape memory alloys
- Stability analysis of Hub dam under rapid drawdown
- Developing ANFIS-FMEA model for assessment and prioritization of potential trouble factors in Iraqi building projects
- Numerical and experimental comparison study of piled raft foundation
- Effect of asphalt modified with waste engine oil on the durability properties of hot asphalt mixtures with reclaimed asphalt pavement
- Hydraulic model for flood inundation in Diyala River Basin using HEC-RAS, PMP, and neural network
- Numerical study on discharge capacity of piano key side weir with various ratios of the crest length to the width
- The optimal allocation of thyristor-controlled series compensators for enhancement HVAC transmission lines Iraqi super grid by using seeker optimization algorithm
- Numerical and experimental study of the impact on aerodynamic characteristics of the NACA0012 airfoil
- Effect of nano-TiO2 on physical and rheological properties of asphalt cement
- Performance evolution of novel palm leaf powder used for enhancing hot mix asphalt
- Performance analysis, evaluation, and improvement of selected unsignalized intersection using SIDRA software – Case study
- Flexural behavior of RC beams externally reinforced with CFRP composites using various strategies
- Influence of fiber types on the properties of the artificial cold-bonded lightweight aggregates
- Experimental investigation of RC beams strengthened with externally bonded BFRP composites
- Generalized RKM methods for solving fifth-order quasi-linear fractional partial differential equation
- An experimental and numerical study investigating sediment transport position in the bed of sewer pipes in Karbala
- Role of individual component failure in the performance of a 1-out-of-3 cold standby system: A Markov model approach
- Implementation for the cases (5, 4) and (5, 4)/(2, 0)
- Center group actions and related concepts
- Experimental investigation of the effect of horizontal construction joints on the behavior of deep beams
- Deletion of a vertex in even sum domination
- Deep learning techniques in concrete powder mix designing
- Effect of loading type in concrete deep beam with strut reinforcement
- Studying the effect of using CFRP warping on strength of husk rice concrete columns
- Parametric analysis of the influence of climatic factors on the formation of traditional buildings in the city of Al Najaf
- Suitability location for landfill using a fuzzy-GIS model: A case study in Hillah, Iraq
- Hybrid approach for cost estimation of sustainable building projects using artificial neural networks
- Assessment of indirect tensile stress and tensile–strength ratio and creep compliance in HMA mixes with micro-silica and PMB
- Density functional theory to study stopping power of proton in water, lung, bladder, and intestine
- A review of single flow, flow boiling, and coating microchannel studies
- Effect of GFRP bar length on the flexural behavior of hybrid concrete beams strengthened with NSM bars
- Exploring the impact of parameters on flow boiling heat transfer in microchannels and coated microtubes: A comprehensive review
- Crumb rubber modification for enhanced rutting resistance in asphalt mixtures
- Special Issue: AESMT-6
- Design of a new sorting colors system based on PLC, TIA portal, and factory I/O programs
- Forecasting empirical formula for suspended sediment load prediction at upstream of Al-Kufa barrage, Kufa City, Iraq
- Optimization and characterization of sustainable geopolymer mortars based on palygorskite clay, water glass, and sodium hydroxide
- Sediment transport modelling upstream of Al Kufa Barrage
- Study of energy loss, range, and stopping time for proton in germanium and copper materials
- Effect of internal and external recycle ratios on the nutrient removal efficiency of anaerobic/anoxic/oxic (VIP) wastewater treatment plant
- Enhancing structural behaviour of polypropylene fibre concrete columns longitudinally reinforced with fibreglass bars
- Sustainable road paving: Enhancing concrete paver blocks with zeolite-enhanced cement
- Evaluation of the operational performance of Karbala waste water treatment plant under variable flow using GPS-X model
- Design and simulation of photonic crystal fiber for highly sensitive chemical sensing applications
- Optimization and design of a new column sequencing for crude oil distillation at Basrah refinery
- Inductive 3D numerical modelling of the tibia bone using MRI to examine von Mises stress and overall deformation
- An image encryption method based on modified elliptic curve Diffie-Hellman key exchange protocol and Hill Cipher
- Experimental investigation of generating superheated steam using a parabolic dish with a cylindrical cavity receiver: A case study
- Effect of surface roughness on the interface behavior of clayey soils
- Investigated of the optical properties for SiO2 by using Lorentz model
- Measurements of induced vibrations due to steel pipe pile driving in Al-Fao soil: Effect of partial end closure
- Experimental and numerical studies of ballistic resistance of hybrid sandwich composite body armor
- Evaluation of clay layer presence on shallow foundation settlement in dry sand under an earthquake
- Optimal design of mechanical performances of asphalt mixtures comprising nano-clay additives
- Advancing seismic performance: Isolators, TMDs, and multi-level strategies in reinforced concrete buildings
- Predicted evaporation in Basrah using artificial neural networks
- Energy management system for a small town to enhance quality of life
- Numerical study on entropy minimization in pipes with helical airfoil and CuO nanoparticle integration
- Equations and methodologies of inlet drainage system discharge coefficients: A review
- Thermal buckling analysis for hybrid and composite laminated plate by using new displacement function
- Investigation into the mechanical and thermal properties of lightweight mortar using commercial beads or recycled expanded polystyrene
- Experimental and theoretical analysis of single-jet column and concrete column using double-jet grouting technique applied at Al-Rashdia site
- The impact of incorporating waste materials on the mechanical and physical characteristics of tile adhesive materials
- Seismic resilience: Innovations in structural engineering for earthquake-prone areas
- Automatic human identification using fingerprint images based on Gabor filter and SIFT features fusion
- Performance of GRKM-method for solving classes of ordinary and partial differential equations of sixth-orders
- Visible light-boosted photodegradation activity of Ag–AgVO3/Zn0.5Mn0.5Fe2O4 supported heterojunctions for effective degradation of organic contaminates
- Production of sustainable concrete with treated cement kiln dust and iron slag waste aggregate
- Key effects on the structural behavior of fiber-reinforced lightweight concrete-ribbed slabs: A review
- A comparative analysis of the energy dissipation efficiency of various piano key weir types
- Special Issue: Transport 2022 - Part II
- Variability in road surface temperature in urban road network – A case study making use of mobile measurements
- Special Issue: BCEE5-2023
- Evaluation of reclaimed asphalt mixtures rejuvenated with waste engine oil to resist rutting deformation
- Assessment of potential resistance to moisture damage and fatigue cracks of asphalt mixture modified with ground granulated blast furnace slag
- Investigating seismic response in adjacent structures: A study on the impact of buildings’ orientation and distance considering soil–structure interaction
- Improvement of porosity of mortar using polyethylene glycol pre-polymer-impregnated mortar
- Three-dimensional analysis of steel beam-column bolted connections
- Assessment of agricultural drought in Iraq employing Landsat and MODIS imagery
- Performance evaluation of grouted porous asphalt concrete
- Optimization of local modified metakaolin-based geopolymer concrete by Taguchi method
- Effect of waste tire products on some characteristics of roller-compacted concrete
- Studying the lateral displacement of retaining wall supporting sandy soil under dynamic loads
- Seismic performance evaluation of concrete buttress dram (Dynamic linear analysis)
- Behavior of soil reinforced with micropiles
- Possibility of production high strength lightweight concrete containing organic waste aggregate and recycled steel fibers
- An investigation of self-sensing and mechanical properties of smart engineered cementitious composites reinforced with functional materials
- Forecasting changes in precipitation and temperatures of a regional watershed in Northern Iraq using LARS-WG model
- Experimental investigation of dynamic soil properties for modeling energy-absorbing layers
- Numerical investigation of the effect of longitudinal steel reinforcement ratio on the ductility of concrete beams
- An experimental study on the tensile properties of reinforced asphalt pavement
- Self-sensing behavior of hot asphalt mixture with steel fiber-based additive
- Behavior of ultra-high-performance concrete deep beams reinforced by basalt fibers
- Optimizing asphalt binder performance with various PET types
- Investigation of the hydraulic characteristics and homogeneity of the microstructure of the air voids in the sustainable rigid pavement
- Enhanced biogas production from municipal solid waste via digestion with cow manure: A case study
- Special Issue: AESMT-7 - Part I
- Preparation and investigation of cobalt nanoparticles by laser ablation: Structure, linear, and nonlinear optical properties
- Seismic analysis of RC building with plan irregularity in Baghdad/Iraq to obtain the optimal behavior
- The effect of urban environment on large-scale path loss model’s main parameters for mmWave 5G mobile network in Iraq
- Formatting a questionnaire for the quality control of river bank roads
- Vibration suppression of smart composite beam using model predictive controller
- Machine learning-based compressive strength estimation in nanomaterial-modified lightweight concrete
- In-depth analysis of critical factors affecting Iraqi construction projects performance
- Behavior of container berth structure under the influence of environmental and operational loads
- Energy absorption and impact response of ballistic resistance laminate
- Effect of water-absorbent polymer balls in internal curing on punching shear behavior of bubble slabs
- Effect of surface roughness on interface shear strength parameters of sandy soils
- Evaluating the interaction for embedded H-steel section in normal concrete under monotonic and repeated loads
- Estimation of the settlement of pile head using ANN and multivariate linear regression based on the results of load transfer method
- Enhancing communication: Deep learning for Arabic sign language translation
- A review of recent studies of both heat pipe and evaporative cooling in passive heat recovery
- Effect of nano-silica on the mechanical properties of LWC
- An experimental study of some mechanical properties and absorption for polymer-modified cement mortar modified with superplasticizer
- Digital beamforming enhancement with LSTM-based deep learning for millimeter wave transmission
- Developing an efficient planning process for heritage buildings maintenance in Iraq
- Design and optimization of two-stage controller for three-phase multi-converter/multi-machine electric vehicle
- Evaluation of microstructure and mechanical properties of Al1050/Al2O3/Gr composite processed by forming operation ECAP
- Calculations of mass stopping power and range of protons in organic compounds (CH3OH, CH2O, and CO2) at energy range of 0.01–1,000 MeV
- Investigation of in vitro behavior of composite coating hydroxyapatite-nano silver on 316L stainless steel substrate by electrophoretic technic for biomedical tools
- A review: Enhancing tribological properties of journal bearings composite materials
- Improvements in the randomness and security of digital currency using the photon sponge hash function through Maiorana–McFarland S-box replacement
- Design a new scheme for image security using a deep learning technique of hierarchical parameters
- Special Issue: ICES 2023
- Comparative geotechnical analysis for ultimate bearing capacity of precast concrete piles using cone resistance measurements
- Visualizing sustainable rainwater harvesting: A case study of Karbala Province
- Geogrid reinforcement for improving bearing capacity and stability of square foundations
- Evaluation of the effluent concentrations of Karbala wastewater treatment plant using reliability analysis
- Adsorbent made with inexpensive, local resources
- Effect of drain pipes on seepage and slope stability through a zoned earth dam
- Sediment accumulation in an 8 inch sewer pipe for a sample of various particles obtained from the streets of Karbala city, Iraq
- Special Issue: IETAS 2024 - Part I
- Analyzing the impact of transfer learning on explanation accuracy in deep learning-based ECG recognition systems
- Effect of scale factor on the dynamic response of frame foundations
- Improving multi-object detection and tracking with deep learning, DeepSORT, and frame cancellation techniques
- The impact of using prestressed CFRP bars on the development of flexural strength
- Assessment of surface hardness and impact strength of denture base resins reinforced with silver–titanium dioxide and silver–zirconium dioxide nanoparticles: In vitro study
- A data augmentation approach to enhance breast cancer detection using generative adversarial and artificial neural networks
- Modification of the 5D Lorenz chaotic map with fuzzy numbers for video encryption in cloud computing
- Special Issue: 51st KKBN - Part I
- Evaluation of static bending caused damage of glass-fiber composite structure using terahertz inspection