Predicted evaporation in Basrah using artificial neural networks
-
Zuhal Abdul Hadi Hamza


Abstract
Accurate evaporation estimation is crucial for managing hydrologic, hydraulic, and agricultural systems, among many other applications of water resources. Empirical formulae for estimating evaporation exist, but their performance is not always sufficient due to the intricacy of the process and its nonlinear connection with other elements of the hydrological cycle. For this reason, a model of artificial neural networks was developed to estimate the daily potential evaporation in the southern Iraqi city of Basrah. A feedforward backpropagation (BP) network with a single hidden layer has been used to construct the mode. Different networks with various neuron counts were assessed. The developed models have been trained, tested, and validated using daily observations of the average rainfall, wind speed, average temperature, average relative humidity, and evaporation. The final evaporation was predicted using an artificial neural network (ANN) model. The proposed model was found to be more suitable to describe evaporation in any region of the world based on the values of the error analysis and the coefficient of determination, according to the ANN model. The Levenberg–Marquardt algorithm (LMA) was determined to have the lowest mean-squared error (MSE) and highest value of the coefficient of correlation (R) of the six proposed BP algorithms. The LMA’s hidden layer’s ideal neuron count was 30 neurons, with an MSE of 0.00288 and R 2 = 99. As a result, ANN displayed excellent performance in terms of evaporation prediction value. The study’s findings highlight the significance of predicting evaporation as the main metric for evaluating the effects of climate change on water resources.
1 Introduction
Evaporation is an important factor in the hydrological cycle and an essential element of the water budget of any region. Its accurate estimation is a basic requirement for engineers and researchers in many fields, such as planning and overseeing irrigation projects and planning water resources, especially in areas that suffer from a shortage of available water resources [1,2,3,4].
The main meteorological variables that affect evaporation rate are air temperature, wind speed, relative humidity, and vapor pressure [5]. There are two ways to measure evaporation: direct methods and indirect methods. One of the techniques for direct measurement is pan evaporation [6]. Pan evaporation is the most widely used direct method. But sometimes, daily evaporation data may be missing, causing failure of measurements or recording. This missing data can be estimated indirectly using available metrological empirical equations [7,8,9]. Therefore, many studies have been conducted to determine the reliable relationship between evaporation and meteorological factors, among which ANNs have gained great popularity over the past few years due to their ability to model complex processes with high accuracy [9–11].
This study aims to determine the significance of prediction evaporation as the main metric for evaluating the effects of climate change on water resources. Table 1 shows some of these studies.
Some of the previous studies on evaporation
| Researcher | year | Results | References |
|---|---|---|---|
| Chaudhari et al. | 2012 | They modeled evaporation in the Nasik region of India using an ANN. The data used maximum and minimum humidity, maximum and minimum temperature, wind speed, and hours of solar radiation. They showed that the ANN gave better results compared to experimental methods. The results of ANN were R = 0.89 and RMSE = 1.03 mm/day | [12] |
| Dalkilic et al. | 2014 | They compared the performance of four models for forecasting daily evaporation. These models are the empirical Penman equation, the ANN with the LMA training algorithm, the radial basis neural network, and the generalized regression neural network. The study found that ANN models give better results than the Penman equation. The LMA network also outperforms the best of the models in estimating daily evaporation, with the RMSE = 1.51 mm/day and R = 0.853 | [13] |
| Benzaghta | 2014 | He conducted a study that involved applying both ANN and empirical equations (Penman, Priestley Taylor, and Stevens Stewart) to estimate evaporation from a reservoir in Libya. Meteorological variables measured included daily monitoring of air temperature, wind speed, and relative humidity. By comparing the results of previous models and measured evaporation values, it was found that ANN gives better performance than empirical equations in estimating evaporation | [14] |
| Pallavi and Rajeev | 2016 | They developed an ANN model to evaluate daily evaporation in India. An error backpropagation (BP) feedforward network was used to create the model. According to the study, ANN(4-9-1) is the most accurate model for estimating evaporation, with a R = 0.987 correlation coefficient and an RMSE of 1.276 mm/day | [15] |
| Banhatti and Dubey | 2016 | They used an ANN to estimate daily evaporation from Abaya Lake in Ethiopia. The data used as input to the networks were temperature, precipitation, hours of sunshine, and wind speed. The results showed that there is a strong agreement between the values predicted by ANN and the actual observed values. It is also better accurate than the Penman results in calculating evaporation from this lake | [16] |
| Hussain and Saad | 2017 | Used twenty-two climatological stations for the period 2004–2013 in Iraq for calculating the conversion constant needed to calculate the value of evaporation and comparing it to measured values from seismology and the Iraqi meteorological organization. They showed a high correlation coefficient using CROPWAT 8.0. They formulated and suggested using the computed evapotranspiration value to determine the amount of evaporation for missing data from climatological Iraqi stations. The distributions of evaporation, evapotranspiration, and pan evaporation coefficient in Iraq are depicted on geological information system maps | [17] |
| Goutam et al. | 2020 | Employed a framework for non-parametric analysis to examine seasonal hydro-climate regimes. Using future climate projections from the coupled model intercomparison project phase 5 model, they used to evaluate changes in water availability caused by concurrent changes in mean and seasonal precipitation and evaporation changes. They demonstrated that, of the nine regimes, four had higher variation in precipitation and five had decreased variation in evaporation combined with higher mean evaporation and precipitation. Increases in the predicted seasonal variation of precipitation regimes that are already quite variable | [18] |
| Pedro et al. | 2021 | They investigated technological alternatives to reduce evaporation in Mexico. Using information from the El Cazadero or 32006 weather station, they used Penman’s semi-empirical equation to calculate the water evaporation in the El Cazadero Dam, which is situated in the State of Zacatecas, Mexico. This study area was chosen because of its aridity and recurrent drought issues that have an impact on the availability of water. When the theoretical model’s evaporation results are compared to the weather station’s reports, a strong correlation is observed. Furthermore, the hydrological year between November 2010 and October 2011, during which a severe drought occurred, was estimated using the average daily evaporation results. This estimate’s magnitude and economic significance point to the need for additional research and suggested governmental measures to create and put into effect technological substitutes that lessen this occurrence | [19] |
| Kumar and Singh | 2022 | They employed weekly pan evaporation modeling, multiple linear regression, multivariate adaptive regression splines, support vector machines, and random forest techniques for the Ranichauri station, which is located in Uttarakhand, India’s Mid-Himalayan region. The effectiveness of weekly pan evaporation estimating models was evaluated using statistical indices such as coefficient of determination (R 2), Nash–Sutcliffe coefficient of efficiency (NSE), and RMSE. The weekly pan evaporation values show both under- and over-predicted results. The findings indicated that the support vector regression (SVR) model had the highest R 2 value for the testing period, and the RMSE values ranged from 0.542 to 0.689, while the NSE values ranged from 0.953 to 0.974. Consequently, it was discovered that the SVR model was better and that it could be used to forecast weekly pan evaporation values for the Ranichauri site | [20] |
| Dibs et al. | 2023 | They were able to refine the method for estimating the accurate method of the land use and land cover patterns. They did this by (a) adopting a noise removal model; (b) resampling satellite images; (c) image fusion, which involves combining and integrating between the visible and thermal images using the Grim Schmidt spectral method; and (d) applying image classification using Mahalanobis distance classifier (MH), maximum likelihood (ML), and ANN classifiers on datasets captured from the Landsat-8 thermal infrared (TIRS) and operational land imager (OLI) satellite systems. These images were captured from OLI and TIRS sensors in 2015 and 2020 to generate approximately 12 LC maps. (e) A comparison between each of the 12 classifiers was made. Compared to the other applied image classification techniques, they showed that the ANN technique has the highest accuracy when applied to the integrated images of the combined TIRS and OLI datasets. For the years 2015 and 2020, the kappa coefficients were 0.94 and 0.97, respectively, and the obtained overall accuracy was 96.31% and 98.40%. Still, the ML classifier outperforms the MH in terms of results | [21] |
ANNs are widely utilized in engineering and many other sectors due to their ease of use in modeling, simulation, and prediction. Most studies, as in the case of this study, relied on two criteria to judge the accuracy of the results: the root mean square error (RMSE), which is considered ideal when its value reaches zero. The second is the correlation coefficient R, which is considered good and can be relied upon when its value is limited between 0.75 and 1.
Previous researchers have demonstrated the versatility of effective ANN applications in hydrological studies. Nevertheless, a review of the literature reveals no prior attempts to model the evaporation process. This article suggests that process behavior estimates, like evaporation, can be made even in the absence of complete data. As far as the author is aware, no research has been published in this area of Basrah.
1.1 Research problems
The measurements of evaporation precisely and consistently are a difficult process, and there are big problems regarding the evaporation measurements because there are no trusted evaporation data many times. Despite the fact that there are many empirical equations to estimate evaporations, these equations represent significantly different local circumstances. So it leads to different results when applied in other places. While there is no single model that can be applied under climate conditions, it is difficult to choose the best evaporation model for a particular region. In the absence of a measured rate of evaporation for long periods, as in the study case, a question arises about the ability to find methods that have the ability to model complicated and non-linear relationships and give precise and trusted estimations for daily evaporation depending on a specific number of parameters available in the monitoring stations of the studied area.
1.2 Aims of research
With the increasing water need and the shortage of available water resources, as huge amounts of water are lost annually due to evaporation, the importance of accurately estimating evaporation losses is a fundamental factor in the management, investment, and development of water resources, which calls for searching for more accurate alternative methods to estimate these losses. Therefore, this study aims to find an ANN model to estimate evaporation in the city of Basrah based on the data available in the study area.
2 Methodology of the research
2.1 Climatic data
Climatic data were collected from the Basrah Airport Meteorological Station. The station is located in the city of Basrah in the southern part of Iraq, about 20 km from the city center. Figure 1 shows the location of the study area. The data included daily measurements of wind speed, precipitation, temperature, and relative humidity. For the period extended from 2015 to 2020, these data were used as inputs to the model. The data also included daily measurements of evaporation, which were used as outputs of the model.

Location of the study area.
The box-and-whisker plot of the climate parameters, which were obtained over 5 years from 2015 to 2020, is shown in Figure 2. The values displayed are minimum, first quartile, median, third quartile, and maximum.

Box-and-whisker graphic showing the research area’s climate parameters.
2.2 Statistical analysis
Rain, wind speed, temperature, relative humidity, and daily evaporation are all statistically analyzed in Table 2. In addition to the mean, median, skewness, kurtosis, minimum, maximum, and standard deviation are included in the statistical analysis. A significant negative impact on the model’s performance has resulted from the moderate to severely skewed nature of the provided data. The standard deviation of the dataset indicates that values further from zero are indicative of more variability in the data. Consequently, the variance in the data is larger than the mean. The statistical features indicate that the climatic parameters are platykurtic and leptokurtic when the kurtosis values are greater than or equal to 3.
Climate parameters’ statistical restrictions in the research area from 2015 to 2020
| Statistical Parameters | Min | Max | Mean | Median | Stan. Dev. | Skewness | Kurtosis |
|---|---|---|---|---|---|---|---|
| Rain (mm) | 0 | 64.5 | 8.62 | 0.6 | 14.63 | 2.14 | 3.96 |
| Wind (m/s) | 1.7 | 7.7 | 3.97 | 3.9 | 1.12 | 0.734 | 0.968 |
| Temp. © | 10.4 | 47.5 | 27.39 | 28.1 | 9.7 | −0.68 | −1.27 |
| Humidity | 17 | 80 | 40.87 | 35.5 | 17.55 | 0.501 | −1.04 |
| Evaporation (mm/day) | 41.4 | 630.5 | 284.17 | 255.05 | 176.59 | 0.325 | −1.3 |
2.3 ANN
In recent years, the ANN approach has emerged as a dependable mathematically structured data processing tool that emulates the neural architecture and biological functions of the human brain because of its numerous potential applications. Layered feedforward neural networks, also known as multi-layer perception with BP learning algorithms, are a common type of ANN that is frequently used for process modeling [22–25].
The basic features of ANN are network structure, computational function, and network training.
2.4 Network structure
It is the number and organization of neurons, the type of connections between neurons, and the direction of the information flow in the network. The number of neurons in the input layer is the number of independent variables, while the number of neurons in the output layer corresponds to the number of predictable variables. The simple neural network model features a network consisting of three layers of processing units: an input layer, a hidden layer, and an output layer, which are connected to each other, as shown in Figure 3.

General structure of an ANN.
2.5 Computational functions
It is another feature of a neural network that consists of the processes of individual neurons and the way they are connected. Information is transmitted through connections between neurons in layers with the help of connected weights, where the weight expresses the intensity of the connection between a neuron before it and a neuron after it.
2.6 Network training
It aims to determine the main control parameters of ANN, which are called weights. The process of estimating these parameters is known as training, where the optimal connection weights are determined by minimizing the value of the error function.
Figure 3 illustrates the common arrangement utilizing input variables. The evaporation was forecast using an ANN model using the mathematical program MATLAB. While 30% of the data were used for model validation, 70% were used for model training. The ANN model’s three-layered BP neural network was designed with a linear transfer function (purlin) at the output layer and a tangent sigmoid transfer function (tansing) at the hidden layer. All input data must be normalized (X norma) in the range of 0.1 to 0.9 because the function used in the hidden layer was sigmoid, and the normalization makes the values of the ANN elements close to each other, which improves the efficiency and effectiveness of the calculations and the quality of the performance of the network, and reduces the value of the error [26]. The following equation was used for this purpose:
where X norma is the normalized value, X i is the real value that needs to be normalized min, (X i ) is the minimum value, and max (X i ) is the maximum value.
By identifying a collection of biases and connection weights that result in the ANN generating outputs that are equal to or nearly equal to the target values, the training process’s main objective is to minimize error.
As the error function, mean-squared error (MSE) is employed. The following equation describes how MSE gauges the network’s accuracy in terms of performance [27].
where N is the number of data points, Y pred is the predicted value of evaporation using the ANN model, and Y obs is the observed value of evaporation:
where
3 Results and discussion
In this research, ANN models were built to estimate daily evaporation using data from the meteorological station located in the study area. This data includes daily measurements of rainfall, wind speed, temperature, humidity, and evaporation. For the time period between 2015 and 2020, Table 2 displays a summary of the statistical analysis of the data, such as minimum, maximum, mean, median, standard deviation, skewness, and kurtosis.
After performing the data normalization process using equation (1), use the Matlab program to build ANN. Network inputs included rainfall values, wind speed, temperature, and relative humidity, while evaporation data were used as network outputs. The data were divided into three sets: a training set, a validation set, and a test, with ratios of 70, 15, and 15, respectively. The training set was used to train the network, while the validation set was used to monitor or select the performance of the network at regular stages during training, where training stops when errors in the validation set reach a minimum. Finally, the network performance is evaluated on a test dataset that was not involved in the training process.
ANN modeling: for all BP algorithms, ten neurons were employed in the hidden layer. Six BP algorithms were compared to choose the best one. Levenberg–Marquardt BP with a minimum MSE emerged as the top algorithm among six BP algorithms (Table 3). Consequently, LMA was employed as the training method for the investigation. The best choice was determined by minimizing the MSE of the training and prediction sets. Optimization was carried out using LMA as the training algorithm, and a range of neuron counts from 5 to 40. Figure 4 shows the link between the MSE and the number of neurons in the LMA. As seen in Figure 4, when the number of neurons increased from 5 to 40, the MSE significantly dropped from 0.017 to 0.00288. The MSE did not significantly change when the number of neurons reached more than 30; it was then discovered. As can be seen in Figure 4, neuron 30 was chosen to represent the most appropriate BP algorithms (minimum error).
Comparison of six BP algorithms with 10 neurons in the hidden layer
| BP algorithm | Function | MSE | Epoch | R | BLE |
|---|---|---|---|---|---|
| Batch gradient descent | Train gd | 0.093601 | 211 | 0.8612 | E = 0.74T − 0.03 |
| Flecher–Reeves conjugate gradient BP | Train cgf | 0.061912 | 9 | 0.89419 | E = 0.8T − 0.047 |
| Broyden-Flecher-Goldfarb-Shanno quasi-Newton BP | Train bfg | 0.047039 | 23 | 0.91982 | E = 0.97T − 0.033 |
| Polak–Ribiere conjugate gradient BP | Train cgp | 0.078679 | 5 | 0.90358 | E = 0.79T − 0.021 |
| Powell–Beale conjugate gradient BP | Train cgb | 0.044414 | 54 | 0.90449 | E = 0.9T − 0.065 |
| Levenberg–Marquardt BP | Train lm | 0.015785 | 50 | 0.95898 | E = 0.92T − 0.008 |

Relationship between neuron count and MSE in the LMA.
Once the right method has been chosen, a network is built by adjusting the hidden layer’s neuron count, which is found through experimentation to produce the lowest error. Several experiments were conducted on ANN with different structures by altering the number of neurons within the hidden layer. Each of these networks was trained 1,000 times, and then, the values of R were observed each time. Table 4 shows the criteria for evaluating the best performance of the resulting models with different structures.
Performance assessment standards for the top-performing models that are produced
| No. of hidden layer | No. of epoch | MSE | R | |||
|---|---|---|---|---|---|---|
| Training | Validation | Testing | All | |||
| 5 | 34 | 0.038415 | 0.935 | 0.938 | 0.946 | 0.937 |
| 10 | 31 | 0.026979 | 0.95 | 0.957 | 0.968 | 0.954 |
| 15 | 40 | 0.011151 | 0.965 | 0.983 | 0.984 | 0.97 |
| 20 | 18 | 0.016892 | 0.958 | 0.974 | 0.987 | 0.964 |
| 25 | 55 | 0.0173 | 0.969 | 0.974 | 0.985 | 0.972 |
| 30 | 47 | 0.00288 | 0.990 | 0.996 | 0.994 | 0.992 |
| 35 | 93 | 0.0033 | 0.995 | 0.995 | 0.999 | 0.996 |
| 40 | 22 | 0.012883 | 0.968 | 0.979 | 0.991 | 0.973 |
We find from Table 4 that the ANN with (4-30-1) structure, which contains one hidden layer with 30 neurons, gives the best results and is most appropriate to the values of the studied phenomenon, and it uses the LM training algorithm. The correlation coefficients reached 0.99, 0.996, and 0.994 for the training, validation, and testing phases, respectively.
The networks were found to have a good understanding of the events they had been trained to identify. In addition, ANN demonstrated efficacy in generalizing training by forecasting evaporation for sets of unknown cases. High correlation coefficients and low mean square errors, which reached 0.992 and 0.00288, respectively, provided support for these positive results.
For the total dataset, the network gave a value of MSE = 0.00288. Figure 5 shows the network’s performance during the three stages and the mechanism for choosing the best epoch.

Network performance (4-30-1) during the three-stage and the mechanisms for selecting the best epoch.
3.1 Evaluation of network performance
Performance metrics were calculated independently for the training and unseen test data network forecasts. These metrics are crucial for demonstrating how well the network absorbs the events. It was trained to recognize and, to the extent that it can draw conclusions from its training, forecast events that were not addressed in the training (validation phase).
The purpose of validation is to assess the trained ANN’s behavior on unseen data. Throughout training, multiple examples are given to an ANN. The ANN modifies its internal parameters based on these labeled examples in order to obtain the desired outputs as close as possible.
In order to demonstrate the models’ efficacy on data that was not seen during training, validation techniques are employed. This analysis helps us determine whether the model needs to be more intelligent by highlighting trends or whether it has somehow picked up duplicate information from the training set and is unable to forecast new samples. It also helps us understand how adaptable the model is to new situations. The ANN has been overly focused on training data and making sure it learns the fundamental correlations and patterns that can be applied to new, unknown data.
So, validation is an essential and crucial stage in the creation and assessment of any ANN model. Information regarding the dependability and efficacy of ANNs is obtained through validation techniques. ANN’s capabilities in performance evaluation, generalization estimation, hyperparameter tuning, model selection, and overfitting control will be validated by finding the effective control of fitness value. Training with validation allows for the development of reliable, accurate, and well-generalized models that can be relied upon to produce predictions on data that have not been seen yet.
The simplest method for comparing various networks is to assess the error function using data that is separate from the training set, as our objective is to identify the network that performs the best on fresh data. A suitable error function that is defined in relation to a training data set is minimized in order to train different networks. Next, the error function of each network is assessed using a separate validation set to compare their performance. The network with the lowest error in relation to the validation set is chosen. An example of this process in action is early stopping, in which the training stops when the error on the validation set increases, selecting the prior model (the one with the least error), and the candidate models are progressively iterative versions of the same network.
Figure 5 shows the MSE variation concerning epochs for training, validation, and testing. The best validation performance is 0.0028866 at 47 epochs. The validation error is at its minimum at the 47th epoch; hence, training was stopped at that point.
The training and validation results are encouraging and accurately demonstrated with the minimum value of mean square error. A comparison between the actual, known daily evaporation and the predicted amount was one of the evaluation measures. For both training and validation, the correlation coefficient (R) and MSE were employed as additional evaluation metrics. The MSE indicates the network’s accuracy, whereas the correlation coefficient assesses how well the network describes the relationship between actual and predicted outputs.
Figure 6 also shows the values of the correlation coefficients between the values calculated by the network and the evaporation values taken from the evaporation basin for the three stages and the total data set. These values are high, which indicates the ability of the chosen model to simulate the studied phenomenon.

Regression plot between evaporation values and values generated by ANN for different groups.
These validated results in Figure 6 demonstrate the ANN output’s stability across all climate data variables and the quick convergence of the output’s evaporation to the predicted values, thereby demonstrating the efficacy of the suggested ANN modules. Furthermore, a significant improvement was achieved in the validation stage. The network was capable of predicting evaporation for unseen cases with an accuracy of 0.0028.
3.2 Comparison with measuring evaporation
The predicted evaporation obtained from the suggested ANN model is compared with the measuring values of evaporations, as shown in Figure 7. In this figure, the coefficient of correlation R 2 = 0.9875. This value indicates that the proposed ANN model can predict accurate results, which provides an efficient method for predicting evaporation.
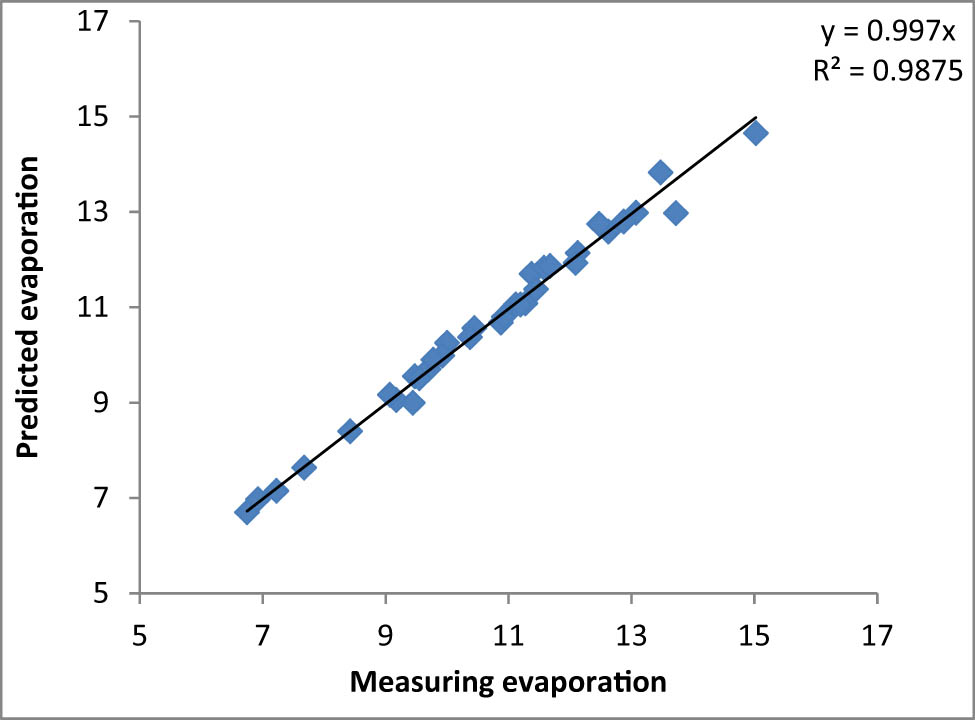
Regression analysis between predicted and measured values.
4 Conclusions
The following are the most significant inferences that can be drawn from the current investigation:
The ANN with the structure (4-30-1) showed its ability to calculate the evaporation per day from the airport station in the city of Basrah depending on the rainfall rate, wind speed, temperature, and relative humidity, with an MSE equal to 0.00288 and a correlation coefficient of 99.6 for the validation set based on the results.
The predicted values were very close to the measured rates.
The study can use the ANN created to supplement missing evaporation data for long periods of time.
For both predicted and measured evaporation, the best representation model is a linear equation with a coefficient of determination (R 2) of 0.987.
Our findings have important environmental, social, and economic implications because global warming will cause global evaporation loss to increase and worsen over time.
It is recommended to expand the use of ANN and artificial intelligence methods to predict hydrological phenomena and processes related to water resources.
-
Conflict of interest: The authors state no conflict of interest.
-
Data availability statement: Most datasets generated and analyzed in this study are in this submitted manuscript. The other datasets are available on reasonable request from the corresponding author with the attached information.
References
[1] Ghaemi A, Rezaie-Balf M, Adamowski J, Kisi O, Quilty J. On the applicability of maximum overlap discrete wavelet transform integrated with MARS and M5 model tree for monthly pan evaporation prediction. Agric For Meteorol. 2019;278:107647.10.1016/j.agrformet.2019.107647Search in Google Scholar
[2] Jing W, Zaher MY, Shamsuddin S, Mandeep KS, Hai T, Ozgur K. Implementation of evolutionary computing models for reference evapotranspiration modeling: short review, assessment and possible future research directions. Eng Appl Comput Fluid Mech. 2019;13(1):811–23.10.1080/19942060.2019.1645045Search in Google Scholar
[3] Ashrafzadeh A, Malik A, Jothiprakash V, Ghorbani MA, Biazar SM. Estimation of daily pan evaporation using neural networks and meta-heuristic approaches. ISH J Hydraulic Eng. 2020;26(4):421–9.10.1080/09715010.2018.1498754Search in Google Scholar
[4] Ghorbani M, Deo RC, Yaseen ZM, Kashani MH, Mohammadi B. Pan evaporation prediction using a hybrid multilayer perceptron-firefly algorithm (MLP-FFA) model: Case study in North Iran. Theor Appl Climatol. 2018a;133:1119–31.10.1007/s00704-017-2244-0Search in Google Scholar
[5] Yaseen M, Al-Juboori M, Ufuk B, Al-Nasri N, Kwok C, Chonchong Q, et al. Prediction of evaporation in arid and semi-arid regions: a comparative study using different machine learning models. Eng Appl Comput Fluid Mech. 2020;14:70–89.10.1080/19942060.2019.1680576Search in Google Scholar
[6] Kisi O, Genc O, Dinc S, Zounemat-Kermani M. Daily pan evaporation modeling using chisquared automatic interaction detector, neural networks, classification and regression tree. Computers Electron Agric. 2016;122:112–7.10.1016/j.compag.2016.01.026Search in Google Scholar
[7] Wu C, Lin G, Lin Y. The effect of data quality on model performance with application to daily evaporation estimation. Stoch Env Res Risk Assess. 2013;27(7):1661–71.10.1007/s00477-013-0703-4Search in Google Scholar
[8] Seifi A, Soroush F. Pan evaporation estimation and derivation of explicit optimized equations by novel hybrid meta-heuristic ANN based methods in different climates of Iran. Computers Electron Agric. 2020;173(10):105418.10.1016/j.compag.2020.105418Search in Google Scholar
[9] Ghorbani M, Khatibi R, Hosseini B, Bilgili M. Relative importance of parameters affecting wind speed prediction using artificial neural networks. Theor Appl Climatol. 2013;114:107–14.10.1007/s00704-012-0821-9Search in Google Scholar
[10] Malik A, Kumar A, Kim S, Masha HK, Karimi V, Sharafati A. Modeling monthly pan evaporation process over the Indian central Himalayas: application of multiple learning artificial intelligence model. Eng Appl Comput Fluid Mech. 2020a;14(1):323–38.10.1080/19942060.2020.1715845Search in Google Scholar
[11] Bruton J, McClendon R, Hoogenboom G. Estimating daily pan evaporation with artificial neural networks. Trans ASAE. 2000;43(2):491–6.10.13031/2013.2730Search in Google Scholar
[12] Chaudhari N, Londhe S, Khare K. Estimation of pan evaporation using soft computing tools. Int J Hydrol Sci Technol. 2012;2(4):373–90.10.1504/IJHST.2012.052375Search in Google Scholar
[13] Dalkilic Y, Okkan U, Baykan N. Comparison of different ANN approached in daily pan evaporation prediction. J Water Resour Prot. 2014;6(4):319–26.10.4236/jwarp.2014.64034Search in Google Scholar
[14] Benzaghta AM. Estimation of evaporation from a reservoir in semi-arid environments using artificial neural network and climate based models. Br J Appl Sci Technol. 2014;4(24):3501–18.10.9734/BJAST/2014/3557Search in Google Scholar
[15] Pallavi K, Rajeev S. Predicting reservoir evaporation using artificial neural network. Int J Innov Res Sci Eng Technol. 2016;5(4):5851–7.Search in Google Scholar
[16] Banhatti A, Dubey N. Estimation of daily pan evaporation for lake Abaya using artificial neural networks. Int J Computer Appl. 2016;(975-8887):15–9.Search in Google Scholar
[17] Hussain A, Saad H. Estimation of daily evaporation from calculated evapotranspiration in Iraq. J Madent Alelem Coll. 2017;9(2):84–96.Search in Google Scholar
[18] Goutam K, Ashok K, Yoshihide W, Mann ME. Climate change will affect global water availability through compounding changes in seasonal precipitation and evaporation. Nat Commun. 2020;11:3044.10.1038/s41467-020-16757-wSearch in Google Scholar PubMed PubMed Central
[19] Pedro A, Guido A, Yves A, Pardavell J, Pino D. Estimation of water loss due to evaporation in the El Cazadero Dam, Mexico, during a Drought. Editor Neogranadina. 2021;31(1):73–91.10.18359/rcin.5406Search in Google Scholar
[20] Kumar P, Singh AK. A comparison between MLR, MARS, SVR and RF Techniques: Hydrological time-series modeling. J Human Earth Future. March 2022;3(1):90–8.10.28991/HEF-2022-03-01-07Search in Google Scholar
[21] Dibs H, Ali AH, Al-Ansari N, Abed SA. Fusion landsat-8 thermal TIRS and OLI datasets for superior monitoring and change detection using remote sensing. Emerg Sci J. 2023;7(2):428–44.10.28991/ESJ-2023-07-02-09Search in Google Scholar
[22] Elbeltagi A, Aslam M, Malik A, Mehdinejadiani B, Srivastava A, Bhatia S, et al. The impact of climate changes on the water footprint of wheat and maize production in the Nile Delta, Egypt. Sci Total Environ. 2020;743:140770.10.1016/j.scitotenv.2020.140770Search in Google Scholar PubMed
[23] Elbeltagi A, Deng J, Wang K, Malik A, Maroufpoor S. Modeling long-term dynamics of crop evapotranspiration using deep learning in a semi-arid environment. Agric Water Manag. 2020;241:106334.10.1016/j.agwat.2020.106334Search in Google Scholar
[24] Rasamoelina A, Adjailia F, Sincak P. A review of activation function for artificial neural network. In Proceedings IEEE 18th World Symposium on Applied Machine Intelligence and Informatics (SAMI); 2020. p. 281–6.10.1109/SAMI48414.2020.9108717Search in Google Scholar
[25] Pomerat J, Segev A, Datta R. On neural network activation functions and optimizers in relation to polynomial regression. In Proceedings IEEE International Conference on Big Data; Dec. 2019. p. 6183–5.10.1109/BigData47090.2019.9005674Search in Google Scholar
[26] Karami H, Ghazvinian H, Dehghanipour M, Ferdosian M. Investigating the performance of neural network based group method of data Handling to pans daily evaporation estimation (case study: Garmsar City). J Soft Comput Civ Eng. 2021;5(2):1–18.Search in Google Scholar
[27] Moriasi N, Gitau W, Pai N, Daggupati P. Hydrologic and water quality models: Performance measures and evaluation criteria. Trans ASABE. 2015;58(6):1763–85.10.13031/trans.58.10715Search in Google Scholar
© 2024 the author(s), published by De Gruyter
This work is licensed under the Creative Commons Attribution 4.0 International License.
Articles in the same Issue
- Regular Articles
- Methodology of automated quality management
- Influence of vibratory conveyor design parameters on the trough motion and the self-synchronization of inertial vibrators
- Application of finite element method in industrial design, example of an electric motorcycle design project
- Correlative evaluation of the corrosion resilience and passivation properties of zinc and aluminum alloys in neutral chloride and acid-chloride solutions
- Will COVID “encourage” B2B and data exchange engineering in logistic firms?
- Influence of unsupported sleepers on flange climb derailment of two freight wagons
- A hybrid detection algorithm for 5G OTFS waveform for 64 and 256 QAM with Rayleigh and Rician channels
- Effect of short heat treatment on mechanical properties and shape memory properties of Cu–Al–Ni shape memory alloy
- Exploring the potential of ammonia and hydrogen as alternative fuels for transportation
- Impact of insulation on energy consumption and CO2 emissions in high-rise commercial buildings at various climate zones
- Advanced autopilot design with extremum-seeking control for aircraft control
- Adaptive multidimensional trust-based recommendation model for peer to peer applications
- Effects of CFRP sheets on the flexural behavior of high-strength concrete beam
- Enhancing urban sustainability through industrial synergy: A multidisciplinary framework for integrating sustainable industrial practices within urban settings – The case of Hamadan industrial city
- Advanced vibrant controller results of an energetic framework structure
- Application of the Taguchi method and RSM for process parameter optimization in AWSJ machining of CFRP composite-based orthopedic implants
- Improved correlation of soil modulus with SPT N values
- Technologies for high-temperature batch annealing of grain-oriented electrical steel: An overview
- Assessing the need for the adoption of digitalization in Indian small and medium enterprises
- A non-ideal hybridization issue for vertical TFET-based dielectric-modulated biosensor
- Optimizing data retrieval for enhanced data integrity verification in cloud environments
- Performance analysis of nonlinear crosstalk of WDM systems using modulation schemes criteria
- Nonlinear finite-element analysis of RC beams with various opening near supports
- Thermal analysis of Fe3O4–Cu/water over a cone: a fractional Maxwell model
- Radial–axial runner blade design using the coordinate slice technique
- Theoretical and experimental comparison between straight and curved continuous box girders
- Effect of the reinforcement ratio on the mechanical behaviour of textile-reinforced concrete composite: Experiment and numerical modeling
- Experimental and numerical investigation on composite beam–column joint connection behavior using different types of connection schemes
- Enhanced performance and robustness in anti-lock brake systems using barrier function-based integral sliding mode control
- Evaluation of the creep strength of samples produced by fused deposition modeling
- A combined feedforward-feedback controller design for nonlinear systems
- Effect of adjacent structures on footing settlement for different multi-building arrangements
- Analyzing the impact of curved tracks on wheel flange thickness reduction in railway systems
- Review Articles
- Mechanical and smart properties of cement nanocomposites containing nanomaterials: A brief review
- Applications of nanotechnology and nanoproduction techniques
- Relationship between indoor environmental quality and guests’ comfort and satisfaction at green hotels: A comprehensive review
- Communication
- Techniques to mitigate the admission of radon inside buildings
- Erratum
- Erratum to “Effect of short heat treatment on mechanical properties and shape memory properties of Cu–Al–Ni shape memory alloy”
- Special Issue: AESMT-3 - Part II
- Integrated fuzzy logic and multicriteria decision model methods for selecting suitable sites for wastewater treatment plant: A case study in the center of Basrah, Iraq
- Physical and mechanical response of porous metals composites with nano-natural additives
- Special Issue: AESMT-4 - Part II
- New recycling method of lubricant oil and the effect on the viscosity and viscous shear as an environmentally friendly
- Identify the effect of Fe2O3 nanoparticles on mechanical and microstructural characteristics of aluminum matrix composite produced by powder metallurgy technique
- Static behavior of piled raft foundation in clay
- Ultra-low-power CMOS ring oscillator with minimum power consumption of 2.9 pW using low-voltage biasing technique
- Using ANN for well type identifying and increasing production from Sa’di formation of Halfaya oil field – Iraq
- Optimizing the performance of concrete tiles using nano-papyrus and carbon fibers
- Special Issue: AESMT-5 - Part II
- Comparative the effect of distribution transformer coil shape on electromagnetic forces and their distribution using the FEM
- The complex of Weyl module in free characteristic in the event of a partition (7,5,3)
- Restrained captive domination number
- Experimental study of improving hot mix asphalt reinforced with carbon fibers
- Asphalt binder modified with recycled tyre rubber
- Thermal performance of radiant floor cooling with phase change material for energy-efficient buildings
- Surveying the prediction of risks in cryptocurrency investments using recurrent neural networks
- A deep reinforcement learning framework to modify LQR for an active vibration control applied to 2D building models
- Evaluation of mechanically stabilized earth retaining walls for different soil–structure interaction methods: A review
- Assessment of heat transfer in a triangular duct with different configurations of ribs using computational fluid dynamics
- Sulfate removal from wastewater by using waste material as an adsorbent
- Experimental investigation on strengthening lap joints subjected to bending in glulam timber beams using CFRP sheets
- A study of the vibrations of a rotor bearing suspended by a hybrid spring system of shape memory alloys
- Stability analysis of Hub dam under rapid drawdown
- Developing ANFIS-FMEA model for assessment and prioritization of potential trouble factors in Iraqi building projects
- Numerical and experimental comparison study of piled raft foundation
- Effect of asphalt modified with waste engine oil on the durability properties of hot asphalt mixtures with reclaimed asphalt pavement
- Hydraulic model for flood inundation in Diyala River Basin using HEC-RAS, PMP, and neural network
- Numerical study on discharge capacity of piano key side weir with various ratios of the crest length to the width
- The optimal allocation of thyristor-controlled series compensators for enhancement HVAC transmission lines Iraqi super grid by using seeker optimization algorithm
- Numerical and experimental study of the impact on aerodynamic characteristics of the NACA0012 airfoil
- Effect of nano-TiO2 on physical and rheological properties of asphalt cement
- Performance evolution of novel palm leaf powder used for enhancing hot mix asphalt
- Performance analysis, evaluation, and improvement of selected unsignalized intersection using SIDRA software – Case study
- Flexural behavior of RC beams externally reinforced with CFRP composites using various strategies
- Influence of fiber types on the properties of the artificial cold-bonded lightweight aggregates
- Experimental investigation of RC beams strengthened with externally bonded BFRP composites
- Generalized RKM methods for solving fifth-order quasi-linear fractional partial differential equation
- An experimental and numerical study investigating sediment transport position in the bed of sewer pipes in Karbala
- Role of individual component failure in the performance of a 1-out-of-3 cold standby system: A Markov model approach
- Implementation for the cases (5, 4) and (5, 4)/(2, 0)
- Center group actions and related concepts
- Experimental investigation of the effect of horizontal construction joints on the behavior of deep beams
- Deletion of a vertex in even sum domination
- Deep learning techniques in concrete powder mix designing
- Effect of loading type in concrete deep beam with strut reinforcement
- Studying the effect of using CFRP warping on strength of husk rice concrete columns
- Parametric analysis of the influence of climatic factors on the formation of traditional buildings in the city of Al Najaf
- Suitability location for landfill using a fuzzy-GIS model: A case study in Hillah, Iraq
- Hybrid approach for cost estimation of sustainable building projects using artificial neural networks
- Assessment of indirect tensile stress and tensile–strength ratio and creep compliance in HMA mixes with micro-silica and PMB
- Density functional theory to study stopping power of proton in water, lung, bladder, and intestine
- A review of single flow, flow boiling, and coating microchannel studies
- Effect of GFRP bar length on the flexural behavior of hybrid concrete beams strengthened with NSM bars
- Exploring the impact of parameters on flow boiling heat transfer in microchannels and coated microtubes: A comprehensive review
- Crumb rubber modification for enhanced rutting resistance in asphalt mixtures
- Special Issue: AESMT-6
- Design of a new sorting colors system based on PLC, TIA portal, and factory I/O programs
- Forecasting empirical formula for suspended sediment load prediction at upstream of Al-Kufa barrage, Kufa City, Iraq
- Optimization and characterization of sustainable geopolymer mortars based on palygorskite clay, water glass, and sodium hydroxide
- Sediment transport modelling upstream of Al Kufa Barrage
- Study of energy loss, range, and stopping time for proton in germanium and copper materials
- Effect of internal and external recycle ratios on the nutrient removal efficiency of anaerobic/anoxic/oxic (VIP) wastewater treatment plant
- Enhancing structural behaviour of polypropylene fibre concrete columns longitudinally reinforced with fibreglass bars
- Sustainable road paving: Enhancing concrete paver blocks with zeolite-enhanced cement
- Evaluation of the operational performance of Karbala waste water treatment plant under variable flow using GPS-X model
- Design and simulation of photonic crystal fiber for highly sensitive chemical sensing applications
- Optimization and design of a new column sequencing for crude oil distillation at Basrah refinery
- Inductive 3D numerical modelling of the tibia bone using MRI to examine von Mises stress and overall deformation
- An image encryption method based on modified elliptic curve Diffie-Hellman key exchange protocol and Hill Cipher
- Experimental investigation of generating superheated steam using a parabolic dish with a cylindrical cavity receiver: A case study
- Effect of surface roughness on the interface behavior of clayey soils
- Investigated of the optical properties for SiO2 by using Lorentz model
- Measurements of induced vibrations due to steel pipe pile driving in Al-Fao soil: Effect of partial end closure
- Experimental and numerical studies of ballistic resistance of hybrid sandwich composite body armor
- Evaluation of clay layer presence on shallow foundation settlement in dry sand under an earthquake
- Optimal design of mechanical performances of asphalt mixtures comprising nano-clay additives
- Advancing seismic performance: Isolators, TMDs, and multi-level strategies in reinforced concrete buildings
- Predicted evaporation in Basrah using artificial neural networks
- Energy management system for a small town to enhance quality of life
- Numerical study on entropy minimization in pipes with helical airfoil and CuO nanoparticle integration
- Equations and methodologies of inlet drainage system discharge coefficients: A review
- Thermal buckling analysis for hybrid and composite laminated plate by using new displacement function
- Investigation into the mechanical and thermal properties of lightweight mortar using commercial beads or recycled expanded polystyrene
- Experimental and theoretical analysis of single-jet column and concrete column using double-jet grouting technique applied at Al-Rashdia site
- The impact of incorporating waste materials on the mechanical and physical characteristics of tile adhesive materials
- Seismic resilience: Innovations in structural engineering for earthquake-prone areas
- Automatic human identification using fingerprint images based on Gabor filter and SIFT features fusion
- Performance of GRKM-method for solving classes of ordinary and partial differential equations of sixth-orders
- Visible light-boosted photodegradation activity of Ag–AgVO3/Zn0.5Mn0.5Fe2O4 supported heterojunctions for effective degradation of organic contaminates
- Production of sustainable concrete with treated cement kiln dust and iron slag waste aggregate
- Key effects on the structural behavior of fiber-reinforced lightweight concrete-ribbed slabs: A review
- A comparative analysis of the energy dissipation efficiency of various piano key weir types
- Special Issue: Transport 2022 - Part II
- Variability in road surface temperature in urban road network – A case study making use of mobile measurements
- Special Issue: BCEE5-2023
- Evaluation of reclaimed asphalt mixtures rejuvenated with waste engine oil to resist rutting deformation
- Assessment of potential resistance to moisture damage and fatigue cracks of asphalt mixture modified with ground granulated blast furnace slag
- Investigating seismic response in adjacent structures: A study on the impact of buildings’ orientation and distance considering soil–structure interaction
- Improvement of porosity of mortar using polyethylene glycol pre-polymer-impregnated mortar
- Three-dimensional analysis of steel beam-column bolted connections
- Assessment of agricultural drought in Iraq employing Landsat and MODIS imagery
- Performance evaluation of grouted porous asphalt concrete
- Optimization of local modified metakaolin-based geopolymer concrete by Taguchi method
- Effect of waste tire products on some characteristics of roller-compacted concrete
- Studying the lateral displacement of retaining wall supporting sandy soil under dynamic loads
- Seismic performance evaluation of concrete buttress dram (Dynamic linear analysis)
- Behavior of soil reinforced with micropiles
- Possibility of production high strength lightweight concrete containing organic waste aggregate and recycled steel fibers
- An investigation of self-sensing and mechanical properties of smart engineered cementitious composites reinforced with functional materials
- Forecasting changes in precipitation and temperatures of a regional watershed in Northern Iraq using LARS-WG model
- Experimental investigation of dynamic soil properties for modeling energy-absorbing layers
- Numerical investigation of the effect of longitudinal steel reinforcement ratio on the ductility of concrete beams
- An experimental study on the tensile properties of reinforced asphalt pavement
- Self-sensing behavior of hot asphalt mixture with steel fiber-based additive
- Behavior of ultra-high-performance concrete deep beams reinforced by basalt fibers
- Optimizing asphalt binder performance with various PET types
- Investigation of the hydraulic characteristics and homogeneity of the microstructure of the air voids in the sustainable rigid pavement
- Enhanced biogas production from municipal solid waste via digestion with cow manure: A case study
- Special Issue: AESMT-7 - Part I
- Preparation and investigation of cobalt nanoparticles by laser ablation: Structure, linear, and nonlinear optical properties
- Seismic analysis of RC building with plan irregularity in Baghdad/Iraq to obtain the optimal behavior
- The effect of urban environment on large-scale path loss model’s main parameters for mmWave 5G mobile network in Iraq
- Formatting a questionnaire for the quality control of river bank roads
- Vibration suppression of smart composite beam using model predictive controller
- Machine learning-based compressive strength estimation in nanomaterial-modified lightweight concrete
- In-depth analysis of critical factors affecting Iraqi construction projects performance
- Behavior of container berth structure under the influence of environmental and operational loads
- Energy absorption and impact response of ballistic resistance laminate
- Effect of water-absorbent polymer balls in internal curing on punching shear behavior of bubble slabs
- Effect of surface roughness on interface shear strength parameters of sandy soils
- Evaluating the interaction for embedded H-steel section in normal concrete under monotonic and repeated loads
- Estimation of the settlement of pile head using ANN and multivariate linear regression based on the results of load transfer method
- Enhancing communication: Deep learning for Arabic sign language translation
- A review of recent studies of both heat pipe and evaporative cooling in passive heat recovery
- Effect of nano-silica on the mechanical properties of LWC
- An experimental study of some mechanical properties and absorption for polymer-modified cement mortar modified with superplasticizer
- Digital beamforming enhancement with LSTM-based deep learning for millimeter wave transmission
- Developing an efficient planning process for heritage buildings maintenance in Iraq
- Design and optimization of two-stage controller for three-phase multi-converter/multi-machine electric vehicle
- Evaluation of microstructure and mechanical properties of Al1050/Al2O3/Gr composite processed by forming operation ECAP
- Calculations of mass stopping power and range of protons in organic compounds (CH3OH, CH2O, and CO2) at energy range of 0.01–1,000 MeV
- Investigation of in vitro behavior of composite coating hydroxyapatite-nano silver on 316L stainless steel substrate by electrophoretic technic for biomedical tools
- A review: Enhancing tribological properties of journal bearings composite materials
- Improvements in the randomness and security of digital currency using the photon sponge hash function through Maiorana–McFarland S-box replacement
- Design a new scheme for image security using a deep learning technique of hierarchical parameters
- Special Issue: ICES 2023
- Comparative geotechnical analysis for ultimate bearing capacity of precast concrete piles using cone resistance measurements
- Visualizing sustainable rainwater harvesting: A case study of Karbala Province
- Geogrid reinforcement for improving bearing capacity and stability of square foundations
- Evaluation of the effluent concentrations of Karbala wastewater treatment plant using reliability analysis
- Adsorbent made with inexpensive, local resources
- Effect of drain pipes on seepage and slope stability through a zoned earth dam
- Sediment accumulation in an 8 inch sewer pipe for a sample of various particles obtained from the streets of Karbala city, Iraq
- Special Issue: IETAS 2024 - Part I
- Analyzing the impact of transfer learning on explanation accuracy in deep learning-based ECG recognition systems
- Effect of scale factor on the dynamic response of frame foundations
- Improving multi-object detection and tracking with deep learning, DeepSORT, and frame cancellation techniques
- The impact of using prestressed CFRP bars on the development of flexural strength
- Assessment of surface hardness and impact strength of denture base resins reinforced with silver–titanium dioxide and silver–zirconium dioxide nanoparticles: In vitro study
- A data augmentation approach to enhance breast cancer detection using generative adversarial and artificial neural networks
- Modification of the 5D Lorenz chaotic map with fuzzy numbers for video encryption in cloud computing
- Special Issue: 51st KKBN - Part I
- Evaluation of static bending caused damage of glass-fiber composite structure using terahertz inspection