Variability in road surface temperature in urban road network – A case study making use of mobile measurements
-
 and
and

Abstract
This work presents the results of the research on the thermal state of the road surface measured by means of a mobile road condition sensor. A 15 km route circumnavigating the city centre and used by urban traffic was taken as the research area. Sixteen test runs were performed under summer and winter conditions. An analysis of the locations at which the rate of change of surface temperature had extreme values between consecutive test runs (which lasted around 25 min) was carried out. Based on that, critical sections of the test route were identified, and thus points characterised by readings deviating significantly from the mean values. Based on the thermal mapping methodology, an analysis of the rate of surface cooling was carried out. It was shown to be characterised by temporal (as well as spatial) non-uniformity. The rate of change of surface and air temperatures was calculated as a function of time, which was equal to −2.22 and −1.97°C/h, respectively. During the analysis, it came to light that hourly intervals represent the optimal frequency for thermal monitoring of a road network. Exceptions to the above are the aforementioned sections selected on the basis of the mobile measurements, in which permanent monitoring of road conditions via ESS stationary systems are recommended.
1 Introduction
Road Weather Information System (RWIS) solutions are crucial elements of Intelligent Transport Systems, particularly in the context of ensuring road safety. RWIS operate mainly within automatic measurements performed by stationary weather monitoring stations known as Environmental Sensor Stations (ESS), which perform real-time measurements of – among others – meteorological parameters, the state of the road surface, the depth of the water film, and visibility [1]. Such data, together which meteorological models, serve in forecasting the state and temperature of the road surface [2]. During the winter, systems aiding decision-making, based on data from ESS, can lead to effective and rapid snow removal from roads. In turn, during summer, they can support in the management of heavy traffic. All such endeavours have a direct relationship with the durability of the road surface and road traffic safety. Furthermore, presentation of such information on programmable electronic road signage affords the possibility of year-round traffic management and informing drivers of poor conditions of the road network.
Urban road networks are characterised by high density and concentration of civil engineering installations such as overpasses, bridges, and tunnels. Also typical is the presence of numerous junctions and great differences in traffic flow rates between rush hours and night-time hours. Such factors mean that road conditions in neighbouring sections of roads can be in diametric opposition. For that reason, stationary meteorological networks can be insufficient for effective functioning of an urban RWIS.
Well-functioning urban meteorological protection requires regular collection of high-quality meteorological data from the entire road network. Mobile measurements of road surface temperature (RST) permit continuous information on the actual thermal state of the road surface for selected sections of road infrastructure to be obtained. In the same context, identification of strategically relevant locations, at which road conditions representing a potential threat to traffic can occur, also constitute a useful tool.
2 Literature review and previous work
Knowledge of the RST and the conditions currently prevailing there have been the subject of many studies, due to the direct relationship with road safety and effective road maintenance. Under low temperature conditions, localized icing or retention of precipitation can occur. Norrman et al. [3] showed that 34% of all road traffic accidents are caused by the occurrence of slippery road surfaces.
The majority of published studies are based on RST examinations conducted under winter conditions [4,5,6,7], nevertheless, the impact of high temperatures on road safety during summer is also an important topic. High roadway temperatures caused by the occurrence of heatwaves can lead not only to deformation of the surface but also to tyre deformation – and even to their unexpected rupture [8].
When based only on the indications from the ESS, forecasting road conditions in the entire urban network is only possible with the use of forecasting models. They can be divided into two groups, comprising numerical models and statistical models. Numerical models enable the forecast of RST variability while requiring a mass of input data, including measurement data. There are many examples of applications of numerical models in the literature [4,9,10]. Statistical models based on historical data are more commonly used and easier to implement [11,12]. The most common statistical models encountered in the literature use the regression method and facilitate relatively high-quality forecasts [13,14].
Another trend in research on the variability of RST is the increasingly popular application of mobile measurements using optical sensors and GPS. This method allows real measurement data with the required resolution to be obtained. Apart from the surface temperature, mobile sensors simultaneously register other parameters which are useful in road meteorology, such as relative humidity above the surface, water film depth, precipitation, air temperature, surface condition, and altitude. Examples of such commercial applications are the products RCM411 and MARWIS; a comparison of those devices’ performance has been presented by Brustad et al. [7].
In this work, a MARWIS sensor [15] was used for testing. The research team carried out a quantity of tests assessing the general behaviour and operational accuracy of the sensor. The repeatability of the measurements was confirmed in a series of tests conducted on a section of test route (of length 2.5 km) and the short interval applied between test runs allowed – to a great extent – elimination of the impact of changes in atmospheric conditions and the condition of the road surface on the measurement results. In the final stage of preliminary testing, the impact of driving speed on measured surface temperature values was assessed [16]. Maintaining the velocity in the interval 30–60 km/h did not have a significant impact on the measured parameters, demonstrating deviations in RST measurements to be not greater than in the case of stationary measurements. This work presents the results of research on the rate of change of surface temperature and identifies critical points of the road network in terms of those points’ thermal conditions.
3 Materials and methods
3.1 Measuring device
The MARWIS mobile device used in this study is based on a non-intrusive optical measurement method. The sensor was designed to detect the road surface condition by delivering information concerning RST, dew point temperature, relative humidity above the road surface, water film height, ice percentage, and road status. The MARWIS device can be mounted on any vehicle; the mode of mounting is presented in Figure 1 (more detailed information on the device’s technical specification is presented in Table A1).

Measuring equipment and its mode of mounting on the test vehicle.
3.2 Study area
The test runs were carried out in the city of Bielsko-Biala, which is located in the south of Poland, at the foot of the Beskid Mountains. Passing through the city there are – among others – express, national, and provincial roads and a North-Eastern Bypass. Bielsko-Biala has approximately 170,000 inhabitants. Mean traffic intensity within the city is between 20,000 and 40,000 vehicles per day [17].
The test route (Figure 2) ran along the most important communication arteries serving urban traffic in the North-South and East-West directions, surrounding the very centre of the city. From the east, it ran along provincial road No. 940 and part of national road No. 52, from the southern and western sides of the city, it covered a significant part of the Bielsko-Biala western bypass (provincial road No. 942). The northern section was a connector between road testing runs and consisted of single-lane roads of local character. It is worth noting that national and provincial roads have two lanes, sometimes divided by a strip of greenery. Regarding the entire route and its length, provincial roads accounted for 37.5% of the route (DW 942 and DW 940), national roads for 12.5% of the route (DK 52), and local roads for 50% of the route.

Test route and its altitude profile (map source: OpenStreetMaps).
3.3 Testing methodology
The measurement vehicle moved at a constant speed of around 50 km/h, the velocity being chosen on the basis of previous research for measurement stability [16]. The test runs, which are the foundation of the following analyses, were performed under winter conditions (with the air temperature reaching sub-zero values) and under summer conditions (with the air temperature reaching 35°C and strong insolation). The mean air temperature was around 0°C during winter testing and around 26°C during summer measurements; no atmospheric precipitation was noted.
Eighteen test runs were conducted (8 under winter conditions and 10 under summer conditions), each individual 15 km test run therein lasted around 25 min. Winter measurements were conducted in March 2021 and in February 2022 during the evening. Summer measurements were performed in July 2022 in three batches corresponding to different times of the day – morning, afternoon, and evening-night. Detailed weather data for specific measurement days and general atmospheric conditions are presented in Table 1. Each test run was assigned a sequence number (No.).
Weather conditions observed during test days
| No. | Test date | Measurement start time | Mean air temperature (°C) | General conditions |
|---|---|---|---|---|
| 1 | 05.03.2021 | 19:00 | −1.1 | Sleety rain |
| 2 | 06.03.2021 | 19:00 | −3.0 | Clear sky |
| 3 | 08.03.2021 | 19:00 | −2.3 | Light snowfall |
| 4 | 19.03.2021 | 19:00 | 0.1 | Cloudy |
| 5 | 21.03.2021 | 19:00 | −3.0 | Snow |
| 6 | 08.02.2022 | 22:15 | 3.1 | Cloudy |
| 7 | 22:40 | 3.0 | Cloudy | |
| 8 | 23:05 | 2.0 | Cloudy | |
| 9 | 20.07.2022 | 14:53 | 29.8 | Sunny |
| 10 | 15:22 | 29.5 | Sunny | |
| 11 | 15:53 | 27.0 | Sunny | |
| 12 | 20:41 | 25.0 | Clear sky | |
| 13 | 21:07 | 24.0 | Clear sky | |
| 14 | 21:34 | 23.1 | Clear sky | |
| 15 | 22:00 | 22.4 | Clear sky | |
| 16 | 22:27 | 21.7 | Clear sky | |
| 17 | 21.07.2022 | 08:52 | 26.4 | Sunny |
| 18 | 11:04 | 32.4 | Sunny |
The analysis employed visualization of surface thermal characteristics measurement data based on the linear interpolation method. Analyses of the obtained measurement results were carried out in the R environment, employing the packages ggplot2, ggmap, and osmdata (respectively, 18–20). The application of dedicated libraries permitted enabled spatial ordering of measurement results based on GPS indications and interpolation of RST discrete data. As a result, this permitted the visualisation of point data on a base map in a continuous manner, carrying out comparative analyses and observing the gradual cooling (or heating) of the road surface as a function of time.
4 Results and discussion
4.1 General road temperature statistics
As part of the analysis, descriptive statistics were derived in relation to the recorded surface temperature for each of the runs (Table 1) using boxplots (Figure 3). The whiskers extending out of the boxes represent the reasonable extremes of the data (minimum and maximum values not exceeding a distance of 1.5× interquartile range [IQR] from the median). Points beyond the aforementioned reasonable extreme distances are plotted as outliers. The plot shows a clear difference between winter (No. 1–8) and summer (No. 9–18) runs. Winter journeys were characterised by a small dispersion of the recorded surface temperature values along the route. The IQR in those measurement series was within 0.4–1.1°C, and the median value was close to the centre of the IQR, which suggest the values were close to the normal distribution of recorded RST values. Moreover, for measurements No. 6–8, high homogeneity of the recorded values was noted.

RST boxplot (the black line shows the median value; the height of the box shows the IQR).
Under summer conditions, greater dispersion of the recorded temperature values should be expected, due to differences in the thermal state of the road surface caused by the presence of sections with constant shade along the route and others with greater exposure to solar radiation. This is indeed indicated by measurement results No. 12–16, which were carried out in the evening hours (excluding the direct influence of solar radiation) and which were characterised by a much smaller dispersion of the recorded temperature values, with the outlying values closer to the IQR. These measurements also illustrate the gradual cooling of the road surface in subsequent test runs, where the mean RST decreased by about 0.7–1.3°C every 25 min (a decrease of 2.6–4.4% compared to the mean temperature recorded in the immediately preceding test run). Runs No. 9–11 and No. 17 and 18 were performed under conditions of high insolation and high air temperature, which was reflected in the high variability of the RST. It should also be noted that the vast majority of median values were closer to the Q3 quartile, which indicates a slight shift in the distribution towards higher values. Basic RST statistics for all test runs are presented in Table 2.
Basic RST (°C) statistics for all test runs
| Test run no. | Min. | Median | Max. | Q1 | Q3 | IQR |
|---|---|---|---|---|---|---|
| 1 | −3.48 | −2.24 | 3.02 | −2.62 | −1.74 | 0.89 |
| 2 | −1.38 | 0.56 | 4.01 | −0.01 | 1.12 | 1.13 |
| 3 | −0.61 | 0.87 | 3.71 | 0.52 | 1.26 | 0.74 |
| 4 | −1.23 | 0.55 | 2.50 | 0.15 | 0.91 | 0.76 |
| 5 | 0.32 | 1.24 | 2.77 | 1.02 | 1.49 | 0.47 |
| 6 | 1.68 | 2.31 | 3.31 | 2.12 | 2.54 | 0.42 |
| 7 | 1.66 | 2.21 | 3.29 | 2.02 | 2.43 | 0.41 |
| 8 | 1.49 | 2.18 | 3.02 | 1.93 | 2.32 | 0.40 |
| 9 | 26.74 | 47.41 | 51.84 | 45.77 | 48.68 | 2.91 |
| 10 | 27.38 | 46.59 | 51.43 | 44.78 | 47.89 | 3.11 |
| 11 | 27.28 | 45.56 | 50.78 | 41.69 | 46.80 | 5.11 |
| 12 | 25.61 | 29.97 | 31.93 | 28.99 | 30.63 | 1.64 |
| 13 | 25.06 | 28.47 | 32.00 | 27.73 | 29.27 | 1.54 |
| 14 | 23.97 | 27.89 | 30.18 | 27.04 | 28.51 | 1.48 |
| 15 | 22.84 | 26.84 | 29.29 | 26.00 | 27.47 | 1.47 |
| 16 | 23.22 | 26.16 | 28.19 | 25.35 | 26.69 | 1.34 |
| 17 | 23.09 | 31.80 | 36.26 | 28.44 | 33.58 | 5.14 |
| 18 | 25.22 | 42.31 | 46.28 | 40.46 | 43.53 | 3.07 |
4.2 Critical sections identification based on winter and summer conditions
Tests under winter conditions were based mainly on the analysis of the thermal changes in the road surface occurring when air temperatures fluctuated around 0°C, which may cause a sudden change in road conditions on the road surface. In turn, in the summer series of tests, when the air temperatures reached 35°C and the exposure of the road surface to solar radiation was high, the variability of thermal conditions along the test route was analysed. Conducting measurements under conditions with low and high air temperatures made it possible to identify locations critical from the point of view of road meteorology, where the conditions prevailing on the test route during a given run significantly differ from the mean value. It was noted that the location of these sections is repeatable, both in winter and in summer. Figure 4 shows an overview of the test route in terms of the altitude profile, marking the locations and the frequency of outliers in relation to the RST under summer and winter conditions. Figure 5 shows the locations of the critical sections selected on the basis of the frequency of occurrence of outliers, marked with symbols A, B, and C. Table 3 presents the mean RST registered at the critical sections.

Test route overview in terms of altitude profile, location, and the frequency of noted outliers as regards surface temperature under winter or summer conditions.

Locations of selected critical sections (A–C), respectively, for winter conditions (test run No. 6) and summer conditions (test run No. 13) (map source: OpenStreetMaps).
Median temperature and mean values for selected sections registered for test runs No. 6 and No. 13
| Test run | Median | Mean value for section | ||
|---|---|---|---|---|
| A | B | C | ||
| No. 6 (winter conditions) | 2.30 | 3.06 | 2.83 | 1.68 |
| No. 13 (summer conditions) | 28.47 | 25.23 | 25.53 | 31.43 |
The position of section A corresponds to a location featuring two tunnels, one following the other. Both the tunnels themselves and the 100 m long section between them are locations at which conditions on the road surface that reduce road safety may occur. Especially in winter, changes in temperature and road conditions which are sudden and surprising for drivers can occur at those locations.
The position of section B corresponds to a location where the test route ran through the lowest points on the route – around 340 m above sea level (Figure 4). In addition, this area is located between two hills and is heavily shaded by the tree canopy above the edge of the road and a dense row of buildings.
The position of section C corresponds to a part of the route that is subject to increased insolation in summer due to the southern exposure of the slope and a lack of buildings and greenery in the immediate vicinity. In winter, in turn, this section is characterised by consistently lower surface temperatures – this is caused by the road running along an embankment, which results in faster cooling of the ground.
4.3 Analysis of the road surface cooling process in summer conditions
The factor that determines the surface temperature to the greatest extent is the degree of sunlight occurring during the day [8]. This is clearly observable in the summer measurement series, both during individual runs (where lower temperatures were observed in the shaded areas), and during the day as the angle of incidence of sunlight on the road decreases. In the period analysed, the highest mean RST was recorded at around 15:00 (run No. 9), amounting to 46.1°C and was approximately 16°C higher than the air temperature. In turn, the largest difference in mean temperatures was observed between the aforementioned test run and the last one performed that same day at around 23.00 (run No. 16). The amplitude of the mean RST change was 20°C. Several series of measurements were planned after sunset under the conditions leading to a lack of variability of the RST caused by the varying influence of insolation. Figure 6 shows the change in the thermals of the road surface recorded in successive runs with a time interval of around 1 h. The mean surface temperature for runs No. 14 and 16 fell in comparison to test run No. 12 (and thus after around 1 and around 2 h, respectively) by 6.9 and 12.6%. Assuming a 25 min interval, the mean temperature drop of the road surface between consecutive runs amounted to approximately 3%. The dynamics of changes in a period of less than 1 h are so small that it is difficult to capture them on a base map – they are difficult for the system operator to assess visually and further analyse (refer to Figures A1–A9).

Thermal maps showing the gradual cooling of the surface, plotted based on measurement data from runs: No. 12 (base), No. 14 (base + 1 h), and No. 16 (base + 2 h) (map source: OpenStreeMaps).

Median RST and air temperature as a function of time.

Boxplot of the difference in surface temperature between consecutive test runs.

The mean RST difference |ΔT|.
The maps presented in Figure 6 illustrate the gradual process of road surface cooling at hourly intervals, which in this case was the optimal time interval for testing of thermal changes. It is worth noting that cooling down took place unevenly and on a part of the road network the temperature of the road was significantly higher for a long period of time.
4.4 RST changes
In order to analyse the pace of road surface cooling, the data recorded during the longest measurement series were used, showing the change in RST for a period exceeding 2 h (runs No. 12–16). There is a general downward trend in RST. Figure 7 shows the change in the median air temperature and the median RST for the entire route.
The calculated gradient of the fall in the median temperature of the surface is 12.69% greater than the gradient of the fall in median air temperature. Those parameters took values of −2.22 and −1.97°C/h, respectively.
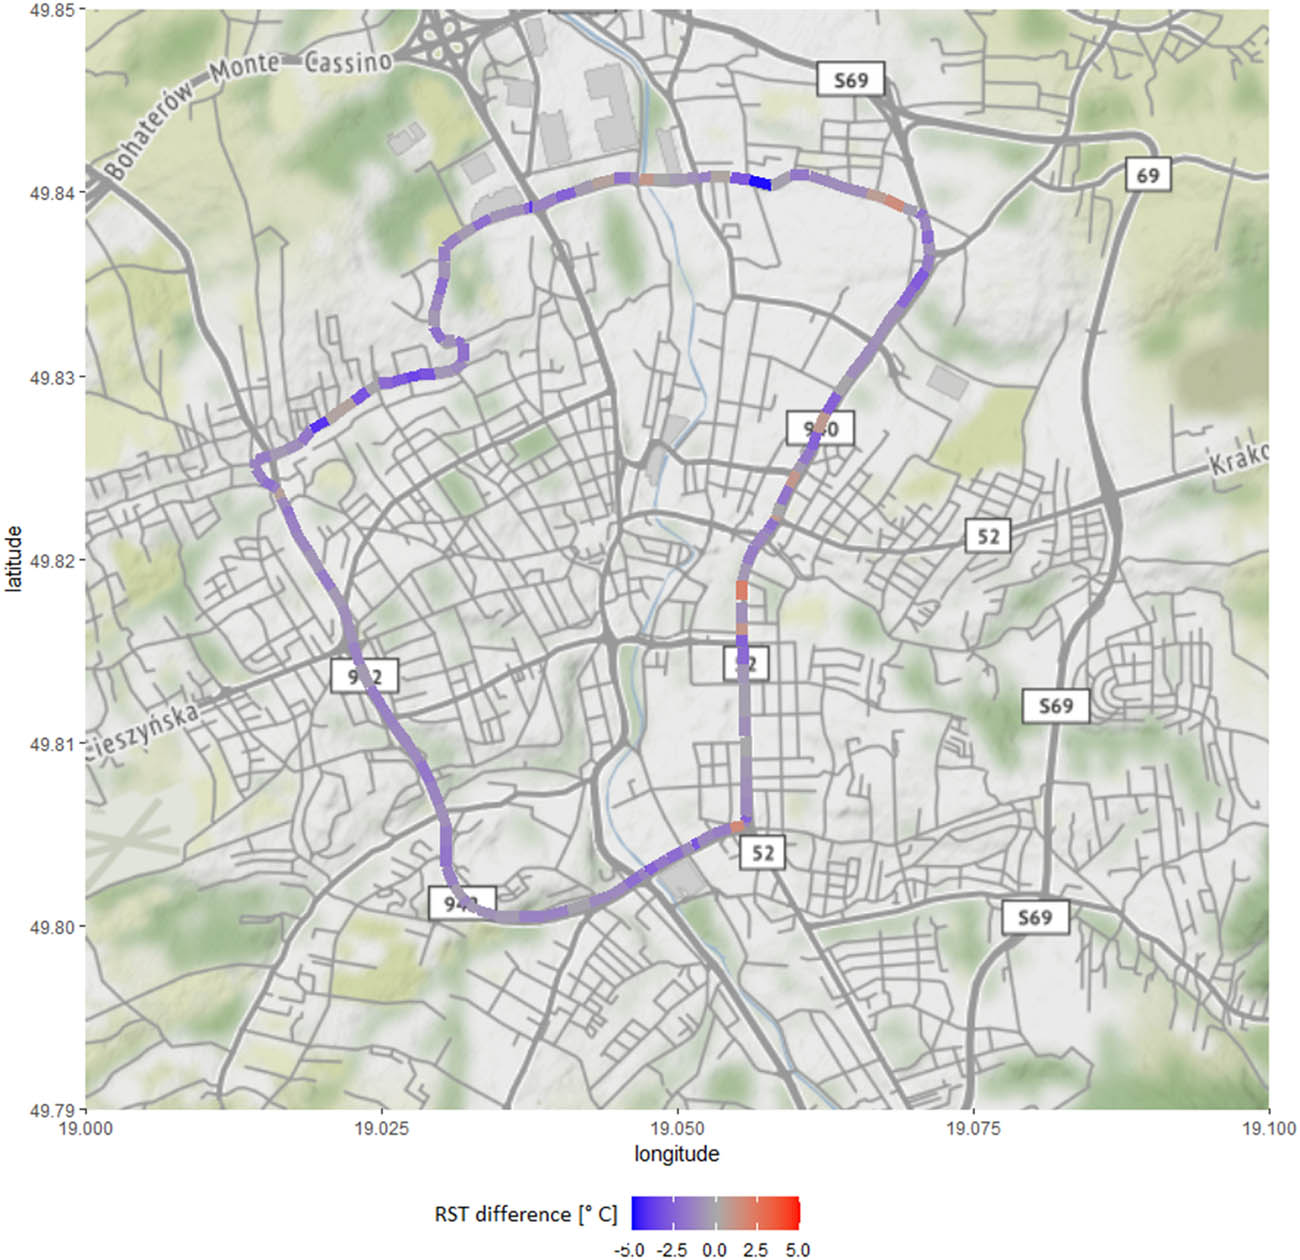
Figure 8 collates the differences in RST calculated for consecutive test runs with reference to the first test run from the series of measurements (No. 12) and thus performed after around 25, 50, 75, and 100 min.
The figure shows uneven cooling of the surface along the entire length of the test route. The median temperature change of the road surface, comparing results from successive test runs with those from the first test run in the measurement series, was, in all cases, within the range −1.2 to −3.9°C. There are certain sections on the test route where the cooling rate is slower – this may be caused, for example, by greater traffic intensity, or by the local microclimate. The range of the difference in temperature changes shows low repeatability over time, but the greatest rate was noted during the first hour of the measurement. The maximum recorded changes in the difference of the temperature of the road surface was within the range 1.96 to −7.29°C.
Figure 9 shows the mean values for the difference in RST measured between consecutive test runs, and the first run of the measurement series (No. 12), for the entire test route and for the sections identified as critical.
Comparing run No. 13 with No. 12 (i.e. to the first 25 min), it can be seen that section C cooled more slowly than in the following intervals. This may be due to the southern exposure of this area, which resulted in an extended period of insolation. Temperature changes of the road surface recorded on sections B and C after approximately 25 min (runs No. 14/12, No. 15/12, No. 16/12) were clearly greater in relation to the mean temperature change along the entire route. The section corresponding to a location with a set of two road tunnels (Section A) was characterised by the lowest temperature variability. The mean temperature change in this section was, without exception, lower than that of the entire route. The measured surface cooling process confirms that the conditions in the selected sections clearly differ from those which are representative for the entire route.
5 Conclusion
During the analyses carried out, three critical sections were identified, where surface temperature readings significantly deviating from the mean values were recorded both in summer and in winter. During summer, at the peak of the day, RST was able to reach values of 20°C higher than the air temperature and reaching even 52°C. On part of the road network, the RST was significantly higher for an extended period of time. This justifies the introduction of monitoring management of road access for heavy vehicles under conditions of high air and road temperatures.
The analysis of data recorded under summer conditions leads to the conclusion that a 3% decrease in the mean RST values between successive runs (i.e. every 25 min) is so small that monitoring at a frequency of more than an hour, would not be economically justified in this case. It is worth noting that the road cooling process was uneven and the proposed interval of one hour provides sufficient resolution to determine the degree and characteristics of variations in RST.
A comparison of the rate of change and the repeatability of RST results enables precise identification of critical sections of the road network. In the context of providing information on road conditions and ensuring road safety, the RWIS city monitoring system should be supported by stationary sensors providing continuous information from all selected critical sections. In the case of those sections, due to the rate of change in the RST, mobile monitoring may not be a sufficient solution. Information on RST should be collected both under conditions of high temperature (well above 0°C) and also when air temperatures are around 0°C. Sections identified as critical should be adequately marked on the road as locations requiring the exercise of special care.
Thermal maps are a tool supporting the effective management of urban roads, but the accuracy of conclusions based thereon depends on the quantity and quality of input data, which must be provided at regular intervals. Obtaining sufficient input data is possible with the use of public transport vehicles for mobile monitoring. In urbanised areas, this guarantees system coverage of the main city communication arteries, and also allows for the constant collection of input information provided at regular intervals.
In the case of the test route employed in this study, the proportion of the road network covered by local urban public transport is 93.5%. During the analysis, it was shown that a 1 h measurement interval is optimal for continuous monitoring of the thermal state of the road surface. Along almost the entire length of the route within the area served by urban public transport, the frequency of scheduled services would facilitate data collection at the required (hourly) intervals.
5.1 Future works
In the course of subsequent work, the authors plan to further develop the concept of supporting the city’s meteorological cover by means of mobile measurements. Planned activities include testing selected public transport lines serving urban communication routes considered critical (due to traffic conditions and the number of passengers), at the required frequency. In the next field tests, a new series of measurements will be carried out (also at other times of the day and at other times of the year), which will extend the spectrum of the observed weather conditions and their impact on the surface temperature. Analysis of the road cooling process will be repeated for winter conditions. The scope of the analysis will be extended to include information on the surface condition, which will allow the identification of areas particularly susceptible to the presence of a water film, black ice, or accumulated snow.
-
Conflict of interest: Authors state no conflict of interest.
-
Data availability statement: The datasets generated during and/or analysed during the current study are available from the corresponding author on reasonable request.
Appendix

Thermal map showing RST difference between run No. 12 and run No. 13 (after 25 min) (map source: OpenStreeMaps).

Thermal map showing RST difference between run No. 12 and run No. 14 (after 50 min) (map source: OpenStreeMaps).

Thermal map showing RST difference between run No. 12 and run No. 15 (after 75 min) (map source: OpenStreeMaps).

Thermal map showing RST difference between run No. 12 and run No. 16 (after 100 min) (map source: OpenStreeMaps).

The percentage of RST occurrence registered during test run No. 12.

The percentage of RST occurrence registered during test run No. 13.

The percentage of RST occurrence registered during test run No. 14.

The percentage of RST occurrence registered during test run No. 15.

The percentage of RST occurrence registered during test run No. 16.
References
[1] Ryguła A, Brzozowski K, Konior A. Utility of information from road weather stations in intelligent transport systems application. In: Mikulski J, editor. Tools of transport telematics. TST 2015. Communications in computer and information science. Vol. 531. Heidelberg: Springer International Publishing; 2015. p. 57–66. 10.1007/978-3-319-24577-5_6.Search in Google Scholar
[2] Ryguła A, Brzozowski K. The utility of short term road surface prediction in area of road weather. Transport Means 2016: Part 1. Kaunas: Kaunas University of Technology; 2016. p. 161–4.Search in Google Scholar
[3] Norrman J, Eriksson M, Lindqvist S. Relationships between road slipperiness, traffic accident risk and winter road maintenance activity. Clim Res. 2000;15(Pt 3):185–93. 10.3354/Cr015185.Search in Google Scholar
[4] Chapman L, Thornes J. A geomatics-based road surface temperature prediction model. Sci Total Environ. 2006;360(Pt 1–3):68–80. 10.1016/j.scitotenv.2005.08.025.Search in Google Scholar
[5] Ruzinskas A, Sivilevicius H. Influence of winter weather changes on road pavement condition in Lithuania. 9th International Conference “Environmental Engineering”. Vilnius: Vilnius Gediminas Technical Univ Press; 2014. 10.3846/enviro.2014.167.Search in Google Scholar
[6] Pszczoła M, Judycki J, Ryś D. Evaluation of pavement temperatures in Poland during winter conditions. Transp Res Procedia. 2016;14:738–47. 10.1016/j.trpro.2016.05.342.Search in Google Scholar
[7] Brustad TF, Pedersen A, Bang B. A field study of sensors for winter road assessment. Transp Res Interdiscip Perspect. 2020;7:100206. 10.1016/j.trip.2020.100206.Search in Google Scholar
[8] Kim YJ, Kim BJ, Shin YS, Kim HW, Kim GT, Kim SJ. A case study of environmental characteristics on urban road-surface and air temperatures during heat-wave days in Seoul. Atmos Oceanic Sci Lett. 2019;12(4):1–9. 10.1080/16742834.2019.1608791.Search in Google Scholar
[9] Bouilloud L, Martin E, Habets F, Boone A, Le Moigne P, Livet J, et al. Road surface condition forecasting in France. J Appl Meteorol Clim. 2009;48(12):2513–27. 10.1175/2009JAMC1900.1.Search in Google Scholar
[10] Feng T, Feng S. A numerical model for predicting road surface temperature in the highway. Procedia Eng. 2012;37:137–42. 10.1016/j.proeng.2012.04.216.Search in Google Scholar
[11] Diefenderfer B, Al-Qadi I, Reubush S, Freeman T. Development and validation of a model to predict pavement temperature profile. Proceedings of the TRB 2003 Annual Meeting; 2003 Jan 12–16. Washington DC, USA: 2003. p. 21.Search in Google Scholar
[12] Marchetti M, Khalifa A, Bues M. Methodology to forecast road surface temperature with principal components analysis and partial least-square regression: Application to an urban configuration. Adv Meteorol. 2015;2015:562621. 10.1155/2015/562621.Search in Google Scholar
[13] Li L, Song Y, Han G. Pavement temperature characteristics and prediction model of Taiwan expressway. J Shandong Meteorol. 2016;02:58–63.Search in Google Scholar
[14] Mohamed A. Road surface temperature and bridge prediction using random Forest and DNN regression; 2020. https://www.researchgate.net/publication/349758275.Search in Google Scholar
[15] lufft.com. MARWIS - mobile advanced road weather information sensor. 2022 (cited 2022 Nov 7). https://www.lufft.com/products/road-runway-sensors-292/marwis-umb-mobile-advanced-road-weather-information-sensor-2308/#:∼:text=MARWIS%20is%20the%20first%20road,road%20and%20runway%20weather%20parameters.Search in Google Scholar
[16] Maczyński A, Brzozowski K, Ryguła A. Repeatability of the road surface temperature indications using a mobile sensor in the context of a road weather information system. Transport Means 2018: Part 2. Kaunas: Kaunas University of Technology; 2018. p. 844–8.Search in Google Scholar
[17] mzd.bielsko.pl. Znamy trendy komunikacyjne użytkowników bielskich dróg. 2022 (cited 2022 Nov 7). https://mzd.bielsko.pl/znamy-trendy-komunikacyjne-uzytkownikow-bielskich-drog/.Search in Google Scholar
[18] Wickham H. ggplot2: Elegant graphics for data analysis. New York: Springer-Verlag; 2016. https://ggplot2.tidyverse.org10.1007/978-3-319-24277-4Search in Google Scholar
[19] Kahle D, Wickham H. ggmap: Spatial visualization with ggplot2. R J. 2013;5(1):144–61. https://journal.r-project.org/archive/2013-1/kahle-wickham.pdf10.32614/RJ-2013-014Search in Google Scholar
[20] Padgham M, Rudis B, Lovelace R, Salmon M. Osmdata. J Open Source Soft. 2017;2(14):305. 10.21105/joss.00305.Search in Google Scholar
© 2024 the author(s), published by De Gruyter
This work is licensed under the Creative Commons Attribution 4.0 International License.
Articles in the same Issue
- Regular Articles
- Methodology of automated quality management
- Influence of vibratory conveyor design parameters on the trough motion and the self-synchronization of inertial vibrators
- Application of finite element method in industrial design, example of an electric motorcycle design project
- Correlative evaluation of the corrosion resilience and passivation properties of zinc and aluminum alloys in neutral chloride and acid-chloride solutions
- Will COVID “encourage” B2B and data exchange engineering in logistic firms?
- Influence of unsupported sleepers on flange climb derailment of two freight wagons
- A hybrid detection algorithm for 5G OTFS waveform for 64 and 256 QAM with Rayleigh and Rician channels
- Effect of short heat treatment on mechanical properties and shape memory properties of Cu–Al–Ni shape memory alloy
- Exploring the potential of ammonia and hydrogen as alternative fuels for transportation
- Impact of insulation on energy consumption and CO2 emissions in high-rise commercial buildings at various climate zones
- Advanced autopilot design with extremum-seeking control for aircraft control
- Adaptive multidimensional trust-based recommendation model for peer to peer applications
- Effects of CFRP sheets on the flexural behavior of high-strength concrete beam
- Enhancing urban sustainability through industrial synergy: A multidisciplinary framework for integrating sustainable industrial practices within urban settings – The case of Hamadan industrial city
- Advanced vibrant controller results of an energetic framework structure
- Application of the Taguchi method and RSM for process parameter optimization in AWSJ machining of CFRP composite-based orthopedic implants
- Improved correlation of soil modulus with SPT N values
- Technologies for high-temperature batch annealing of grain-oriented electrical steel: An overview
- Assessing the need for the adoption of digitalization in Indian small and medium enterprises
- A non-ideal hybridization issue for vertical TFET-based dielectric-modulated biosensor
- Optimizing data retrieval for enhanced data integrity verification in cloud environments
- Performance analysis of nonlinear crosstalk of WDM systems using modulation schemes criteria
- Nonlinear finite-element analysis of RC beams with various opening near supports
- Thermal analysis of Fe3O4–Cu/water over a cone: a fractional Maxwell model
- Radial–axial runner blade design using the coordinate slice technique
- Theoretical and experimental comparison between straight and curved continuous box girders
- Effect of the reinforcement ratio on the mechanical behaviour of textile-reinforced concrete composite: Experiment and numerical modeling
- Experimental and numerical investigation on composite beam–column joint connection behavior using different types of connection schemes
- Enhanced performance and robustness in anti-lock brake systems using barrier function-based integral sliding mode control
- Evaluation of the creep strength of samples produced by fused deposition modeling
- A combined feedforward-feedback controller design for nonlinear systems
- Effect of adjacent structures on footing settlement for different multi-building arrangements
- Analyzing the impact of curved tracks on wheel flange thickness reduction in railway systems
- Review Articles
- Mechanical and smart properties of cement nanocomposites containing nanomaterials: A brief review
- Applications of nanotechnology and nanoproduction techniques
- Relationship between indoor environmental quality and guests’ comfort and satisfaction at green hotels: A comprehensive review
- Communication
- Techniques to mitigate the admission of radon inside buildings
- Erratum
- Erratum to “Effect of short heat treatment on mechanical properties and shape memory properties of Cu–Al–Ni shape memory alloy”
- Special Issue: AESMT-3 - Part II
- Integrated fuzzy logic and multicriteria decision model methods for selecting suitable sites for wastewater treatment plant: A case study in the center of Basrah, Iraq
- Physical and mechanical response of porous metals composites with nano-natural additives
- Special Issue: AESMT-4 - Part II
- New recycling method of lubricant oil and the effect on the viscosity and viscous shear as an environmentally friendly
- Identify the effect of Fe2O3 nanoparticles on mechanical and microstructural characteristics of aluminum matrix composite produced by powder metallurgy technique
- Static behavior of piled raft foundation in clay
- Ultra-low-power CMOS ring oscillator with minimum power consumption of 2.9 pW using low-voltage biasing technique
- Using ANN for well type identifying and increasing production from Sa’di formation of Halfaya oil field – Iraq
- Optimizing the performance of concrete tiles using nano-papyrus and carbon fibers
- Special Issue: AESMT-5 - Part II
- Comparative the effect of distribution transformer coil shape on electromagnetic forces and their distribution using the FEM
- The complex of Weyl module in free characteristic in the event of a partition (7,5,3)
- Restrained captive domination number
- Experimental study of improving hot mix asphalt reinforced with carbon fibers
- Asphalt binder modified with recycled tyre rubber
- Thermal performance of radiant floor cooling with phase change material for energy-efficient buildings
- Surveying the prediction of risks in cryptocurrency investments using recurrent neural networks
- A deep reinforcement learning framework to modify LQR for an active vibration control applied to 2D building models
- Evaluation of mechanically stabilized earth retaining walls for different soil–structure interaction methods: A review
- Assessment of heat transfer in a triangular duct with different configurations of ribs using computational fluid dynamics
- Sulfate removal from wastewater by using waste material as an adsorbent
- Experimental investigation on strengthening lap joints subjected to bending in glulam timber beams using CFRP sheets
- A study of the vibrations of a rotor bearing suspended by a hybrid spring system of shape memory alloys
- Stability analysis of Hub dam under rapid drawdown
- Developing ANFIS-FMEA model for assessment and prioritization of potential trouble factors in Iraqi building projects
- Numerical and experimental comparison study of piled raft foundation
- Effect of asphalt modified with waste engine oil on the durability properties of hot asphalt mixtures with reclaimed asphalt pavement
- Hydraulic model for flood inundation in Diyala River Basin using HEC-RAS, PMP, and neural network
- Numerical study on discharge capacity of piano key side weir with various ratios of the crest length to the width
- The optimal allocation of thyristor-controlled series compensators for enhancement HVAC transmission lines Iraqi super grid by using seeker optimization algorithm
- Numerical and experimental study of the impact on aerodynamic characteristics of the NACA0012 airfoil
- Effect of nano-TiO2 on physical and rheological properties of asphalt cement
- Performance evolution of novel palm leaf powder used for enhancing hot mix asphalt
- Performance analysis, evaluation, and improvement of selected unsignalized intersection using SIDRA software – Case study
- Flexural behavior of RC beams externally reinforced with CFRP composites using various strategies
- Influence of fiber types on the properties of the artificial cold-bonded lightweight aggregates
- Experimental investigation of RC beams strengthened with externally bonded BFRP composites
- Generalized RKM methods for solving fifth-order quasi-linear fractional partial differential equation
- An experimental and numerical study investigating sediment transport position in the bed of sewer pipes in Karbala
- Role of individual component failure in the performance of a 1-out-of-3 cold standby system: A Markov model approach
- Implementation for the cases (5, 4) and (5, 4)/(2, 0)
- Center group actions and related concepts
- Experimental investigation of the effect of horizontal construction joints on the behavior of deep beams
- Deletion of a vertex in even sum domination
- Deep learning techniques in concrete powder mix designing
- Effect of loading type in concrete deep beam with strut reinforcement
- Studying the effect of using CFRP warping on strength of husk rice concrete columns
- Parametric analysis of the influence of climatic factors on the formation of traditional buildings in the city of Al Najaf
- Suitability location for landfill using a fuzzy-GIS model: A case study in Hillah, Iraq
- Hybrid approach for cost estimation of sustainable building projects using artificial neural networks
- Assessment of indirect tensile stress and tensile–strength ratio and creep compliance in HMA mixes with micro-silica and PMB
- Density functional theory to study stopping power of proton in water, lung, bladder, and intestine
- A review of single flow, flow boiling, and coating microchannel studies
- Effect of GFRP bar length on the flexural behavior of hybrid concrete beams strengthened with NSM bars
- Exploring the impact of parameters on flow boiling heat transfer in microchannels and coated microtubes: A comprehensive review
- Crumb rubber modification for enhanced rutting resistance in asphalt mixtures
- Special Issue: AESMT-6
- Design of a new sorting colors system based on PLC, TIA portal, and factory I/O programs
- Forecasting empirical formula for suspended sediment load prediction at upstream of Al-Kufa barrage, Kufa City, Iraq
- Optimization and characterization of sustainable geopolymer mortars based on palygorskite clay, water glass, and sodium hydroxide
- Sediment transport modelling upstream of Al Kufa Barrage
- Study of energy loss, range, and stopping time for proton in germanium and copper materials
- Effect of internal and external recycle ratios on the nutrient removal efficiency of anaerobic/anoxic/oxic (VIP) wastewater treatment plant
- Enhancing structural behaviour of polypropylene fibre concrete columns longitudinally reinforced with fibreglass bars
- Sustainable road paving: Enhancing concrete paver blocks with zeolite-enhanced cement
- Evaluation of the operational performance of Karbala waste water treatment plant under variable flow using GPS-X model
- Design and simulation of photonic crystal fiber for highly sensitive chemical sensing applications
- Optimization and design of a new column sequencing for crude oil distillation at Basrah refinery
- Inductive 3D numerical modelling of the tibia bone using MRI to examine von Mises stress and overall deformation
- An image encryption method based on modified elliptic curve Diffie-Hellman key exchange protocol and Hill Cipher
- Experimental investigation of generating superheated steam using a parabolic dish with a cylindrical cavity receiver: A case study
- Effect of surface roughness on the interface behavior of clayey soils
- Investigated of the optical properties for SiO2 by using Lorentz model
- Measurements of induced vibrations due to steel pipe pile driving in Al-Fao soil: Effect of partial end closure
- Experimental and numerical studies of ballistic resistance of hybrid sandwich composite body armor
- Evaluation of clay layer presence on shallow foundation settlement in dry sand under an earthquake
- Optimal design of mechanical performances of asphalt mixtures comprising nano-clay additives
- Advancing seismic performance: Isolators, TMDs, and multi-level strategies in reinforced concrete buildings
- Predicted evaporation in Basrah using artificial neural networks
- Energy management system for a small town to enhance quality of life
- Numerical study on entropy minimization in pipes with helical airfoil and CuO nanoparticle integration
- Equations and methodologies of inlet drainage system discharge coefficients: A review
- Thermal buckling analysis for hybrid and composite laminated plate by using new displacement function
- Investigation into the mechanical and thermal properties of lightweight mortar using commercial beads or recycled expanded polystyrene
- Experimental and theoretical analysis of single-jet column and concrete column using double-jet grouting technique applied at Al-Rashdia site
- The impact of incorporating waste materials on the mechanical and physical characteristics of tile adhesive materials
- Seismic resilience: Innovations in structural engineering for earthquake-prone areas
- Automatic human identification using fingerprint images based on Gabor filter and SIFT features fusion
- Performance of GRKM-method for solving classes of ordinary and partial differential equations of sixth-orders
- Visible light-boosted photodegradation activity of Ag–AgVO3/Zn0.5Mn0.5Fe2O4 supported heterojunctions for effective degradation of organic contaminates
- Production of sustainable concrete with treated cement kiln dust and iron slag waste aggregate
- Key effects on the structural behavior of fiber-reinforced lightweight concrete-ribbed slabs: A review
- A comparative analysis of the energy dissipation efficiency of various piano key weir types
- Special Issue: Transport 2022 - Part II
- Variability in road surface temperature in urban road network – A case study making use of mobile measurements
- Special Issue: BCEE5-2023
- Evaluation of reclaimed asphalt mixtures rejuvenated with waste engine oil to resist rutting deformation
- Assessment of potential resistance to moisture damage and fatigue cracks of asphalt mixture modified with ground granulated blast furnace slag
- Investigating seismic response in adjacent structures: A study on the impact of buildings’ orientation and distance considering soil–structure interaction
- Improvement of porosity of mortar using polyethylene glycol pre-polymer-impregnated mortar
- Three-dimensional analysis of steel beam-column bolted connections
- Assessment of agricultural drought in Iraq employing Landsat and MODIS imagery
- Performance evaluation of grouted porous asphalt concrete
- Optimization of local modified metakaolin-based geopolymer concrete by Taguchi method
- Effect of waste tire products on some characteristics of roller-compacted concrete
- Studying the lateral displacement of retaining wall supporting sandy soil under dynamic loads
- Seismic performance evaluation of concrete buttress dram (Dynamic linear analysis)
- Behavior of soil reinforced with micropiles
- Possibility of production high strength lightweight concrete containing organic waste aggregate and recycled steel fibers
- An investigation of self-sensing and mechanical properties of smart engineered cementitious composites reinforced with functional materials
- Forecasting changes in precipitation and temperatures of a regional watershed in Northern Iraq using LARS-WG model
- Experimental investigation of dynamic soil properties for modeling energy-absorbing layers
- Numerical investigation of the effect of longitudinal steel reinforcement ratio on the ductility of concrete beams
- An experimental study on the tensile properties of reinforced asphalt pavement
- Self-sensing behavior of hot asphalt mixture with steel fiber-based additive
- Behavior of ultra-high-performance concrete deep beams reinforced by basalt fibers
- Optimizing asphalt binder performance with various PET types
- Investigation of the hydraulic characteristics and homogeneity of the microstructure of the air voids in the sustainable rigid pavement
- Enhanced biogas production from municipal solid waste via digestion with cow manure: A case study
- Special Issue: AESMT-7 - Part I
- Preparation and investigation of cobalt nanoparticles by laser ablation: Structure, linear, and nonlinear optical properties
- Seismic analysis of RC building with plan irregularity in Baghdad/Iraq to obtain the optimal behavior
- The effect of urban environment on large-scale path loss model’s main parameters for mmWave 5G mobile network in Iraq
- Formatting a questionnaire for the quality control of river bank roads
- Vibration suppression of smart composite beam using model predictive controller
- Machine learning-based compressive strength estimation in nanomaterial-modified lightweight concrete
- In-depth analysis of critical factors affecting Iraqi construction projects performance
- Behavior of container berth structure under the influence of environmental and operational loads
- Energy absorption and impact response of ballistic resistance laminate
- Effect of water-absorbent polymer balls in internal curing on punching shear behavior of bubble slabs
- Effect of surface roughness on interface shear strength parameters of sandy soils
- Evaluating the interaction for embedded H-steel section in normal concrete under monotonic and repeated loads
- Estimation of the settlement of pile head using ANN and multivariate linear regression based on the results of load transfer method
- Enhancing communication: Deep learning for Arabic sign language translation
- A review of recent studies of both heat pipe and evaporative cooling in passive heat recovery
- Effect of nano-silica on the mechanical properties of LWC
- An experimental study of some mechanical properties and absorption for polymer-modified cement mortar modified with superplasticizer
- Digital beamforming enhancement with LSTM-based deep learning for millimeter wave transmission
- Developing an efficient planning process for heritage buildings maintenance in Iraq
- Design and optimization of two-stage controller for three-phase multi-converter/multi-machine electric vehicle
- Evaluation of microstructure and mechanical properties of Al1050/Al2O3/Gr composite processed by forming operation ECAP
- Calculations of mass stopping power and range of protons in organic compounds (CH3OH, CH2O, and CO2) at energy range of 0.01–1,000 MeV
- Investigation of in vitro behavior of composite coating hydroxyapatite-nano silver on 316L stainless steel substrate by electrophoretic technic for biomedical tools
- A review: Enhancing tribological properties of journal bearings composite materials
- Improvements in the randomness and security of digital currency using the photon sponge hash function through Maiorana–McFarland S-box replacement
- Design a new scheme for image security using a deep learning technique of hierarchical parameters
- Special Issue: ICES 2023
- Comparative geotechnical analysis for ultimate bearing capacity of precast concrete piles using cone resistance measurements
- Visualizing sustainable rainwater harvesting: A case study of Karbala Province
- Geogrid reinforcement for improving bearing capacity and stability of square foundations
- Evaluation of the effluent concentrations of Karbala wastewater treatment plant using reliability analysis
- Adsorbent made with inexpensive, local resources
- Effect of drain pipes on seepage and slope stability through a zoned earth dam
- Sediment accumulation in an 8 inch sewer pipe for a sample of various particles obtained from the streets of Karbala city, Iraq
- Special Issue: IETAS 2024 - Part I
- Analyzing the impact of transfer learning on explanation accuracy in deep learning-based ECG recognition systems
- Effect of scale factor on the dynamic response of frame foundations
- Improving multi-object detection and tracking with deep learning, DeepSORT, and frame cancellation techniques
- The impact of using prestressed CFRP bars on the development of flexural strength
- Assessment of surface hardness and impact strength of denture base resins reinforced with silver–titanium dioxide and silver–zirconium dioxide nanoparticles: In vitro study
- A data augmentation approach to enhance breast cancer detection using generative adversarial and artificial neural networks
- Modification of the 5D Lorenz chaotic map with fuzzy numbers for video encryption in cloud computing
- Special Issue: 51st KKBN - Part I
- Evaluation of static bending caused damage of glass-fiber composite structure using terahertz inspection