Analyzing the impact of curved tracks on wheel flange thickness reduction in railway systems
-
Zainah Namayanja
 and
Behailu Mamo Zewdie
and
Behailu Mamo Zewdie

Abstract
Flanges are critical parts of railway wheels that guide the wheels on the track and prevent them from derailing. However, curved tracks have a great influence on wheel flange wear, which leads to increased maintenance costs, passenger discomfort, poor ride quality, and increased noise and vibrations. This research aims to analyze the effect of curved tracks on wheel flange thickness reduction using the multi-body simulation software SIMPACK. The wheel flange wear was calculated to determine how much material is lost in terms of the area of material loss for different curve radii of 50, 100, and 200 m. The obtained results show that at curved track sections of smaller radius, for example, 50 m, the occurrence of wheel flange thickness reduction is higher than that of curved track sections with larger radii. Also, high speeds such as 40 km/h, especially at the track curved sections with small radii, lead to an increase in wheel flange thickness reduction compared to track curved sections with large radii. The results of wear indices obtained using SIMPACK and VAMPIR closely matched with a small percentage error difference of 1.94%. The matching of these results validated the effectiveness of the methods used in this research to calculate wear. Therefore, these conclusions will assist maintenance personnel in developing countermeasures to minimize wheel flange thickness reduction, ensure proper re-profiling, and reduce maintenance costs.
1 Introduction
The railway field is among the greatest deployed means of transportation on land because of low energy consumption per passenger/km, low pollution to the environment, safe, comfortable, low traffic congestion, increased speeds, a high number of passengers and goods carried, decreased transport costs, and reduction in land use [1]. However, for the railway industry to remain competitive, passenger comfort, safety, service provision, and cost must be the top priorities [2]. Therefore, the quality and security of the transport system require an effective and proper maintenance system to prevent accidents and incidents. Similar to many other cities, the introduction of a railway system leads to a significant improvement in the transport system in terms of cheap fares, better ride comfort, safety, and faster means of transport for the increasing urban population.
Wheels are critical components of the running gear in railway transportation systems. The uniform motion and safety of rolling stocks largely depend on their performance; therefore, they must be regularly monitored [3]. Any damage to the wheels found just in time can help prevent severe damage to the train and also keep passengers safe. Hence, periodic inspection of the wheels can lead to efficient and effective operation, improving the reliability and availability of railway transport systems [4]. One of the safety concerns is wheel damage caused by wear on the wheel running surface and flanges.
Different types of wear are associated with the wheels. For example, tread wear (damage to the tread) and flange wear (wheel flange thickness deterioration/reduction) grooves are created on the surface of the wheel flange [5]. Gradual flange wear leads to material degradation, limits the lifespan of the wheels, and leads to rail vehicle instability [6], poor ride quality, passenger discomfort, increased maintenance costs, increased noise, and vibration, wear of other vehicle components, and increased damage to rolling stocks and tracks [7]. The wheel flange guides the wheels on the track and prevents the wheels from falling off while running on the rails. A deteriorated wheel flange can cause train derailment. However, wheel flange thickness reduction is inevitable and intensive, particularly on curved tracks [8].
Numerous studies have investigated the root causes of wheel flange wear and explored measures to mitigate this problem. The primary factors influencing the wheel flange wear originate from the dynamic forces acting on the wheelset.
Various factors that affect rail vehicle dynamics contribute to the generation of dynamic forces and moments on the wheelset. These factors include tractive force and torque, running resistance, running speed, track geometry, rail surface conditions, centrifugal forces, vehicle weight, and primary suspension forces and moments from the vehicle body and bogie. These elements generate axial, radial, and longitudinal forces as well as yaw and roll moments on the wheelset. The resulting forces on the wheelset create creep forces and creep moments at the interfaces of the wheel and rail, including the interface between the wheel tread and rail running surface, as well as the wheel flange and rail gauge interface. Additionally, they induce creep at other jointed parts of the rail vehicle, such as the interfaces between the wheel and wheelset axle [9], brake disk and brake pads, brake pads, and wheel treads.
Other factors influencing wheel flange wear processes include the adhesion coefficient, environmental conditions (such as water, humidity, dryness, dust, temperature, sands, etc.), material properties, lubrication, temperature, speed, and track and wheel geometry (curve radius, irregularities, switch and crossing sections, and wheel equivalent conicity). Equivalent conicity is a determinant parameter of how the wheel and rail geometric profiles match the proper wheel–rail interaction [10,11]. Concerning environmental conditions, the adhesion coefficient of the contacting surfaces behaves very differently, for example, under wet and dry conditions, as observed in experimental tests [12,13]. The material properties, such as the hardness ratio of the contacting parts, significantly influence the wear behavior [14]. Also, it is known that the temperature can change the material mechanical properties, such as the yield strength, which can influence fatigue and abrasive wear.
The wheel flange wear mechanisms partly consist of abrasive and fretting phenomena similar to those that occur in other rail vehicle mating parts. This includes fretting wear of mating parts of the rail vehicle axle and wheel, which is caused by the friction phenomenon in the push-fit joint [9]. Fretting wear formation mechanisms consist of material build-up due to adhesion, surface abrasion, and micro pits, shearing of micro-irregularities, plastic deformation of the mating sleeve part top layer, and micro-cracks on the sleeve top layer [9]. However, it is noted that the fretting wear phenomenon between the wheel flange and rail gauge does not usually involve the adhesive phenomenon. An experimental study of Kowalski [15] reported that CrN + a-C:H:W coatings effectively mitigated the fretting wear. The fretting wear between mating components subjected to sliding oscillatory motions exhibits characteristics similar to the wear mechanisms observed between the rail gauge and wheel flange of rail vehicles operating on straight tracks. Lubrication is commonly utilized to mitigate wear on both wheel flange and tread surfaces. Increasing the wheel conicity is often employed to further reduce wheel flange wear on the curves. However, an increase in wheel conicity can elevate hunting frequency and train instability on straight tracks. Consequently, wheel reprofiling and wheel profile optimization are conducted to achieve balance with the aim of minimizing wheel wear on curves while maintaining stability on straight tracks [16]. Research has demonstrated that longitudinal and lateral forces and spin moments contribute significantly to wheel flange wear when a rail vehicle negotiates curves, with these forces being highly dependent on the curve radius. On straight tracks, the impact of these forces is typically considered in the computation of wheel tread wear but is generally regarded as having minimal influence on wheel flange wear, assuming that hunting phenomena are not pronounced. This study focuses on examining wheel flange wear in relation to vehicle speed and track curve radii.
When the wheel flange consistently contacts the rail gauge corner on a curved track, substantial creep forces and creep moments develop between the wheel flange and rail gauge corner, initiating wheel flange wear mechanisms and processes. The forces and moments that initiate the wear are known as creep forces and creep moments, respectively (Figure 1). The resulting wear processes due to the creep forces and moments, combined with other mechanism factors, such as those mentioned earlier, ultimately lead to a reduction in the wheel flange thickness. The wear mechanisms in the wheel–rail interface occur in three regimes (mild, severe, and catastrophic), and the wear on the wheel flange and rail gauges is expected to occur in two regimes: severe and heavy wear regimes [17]. The heavy-wear regime is the transition regime between the severe and catastrophic regimes.

(a) Wheelset on the curved track section and (b) wheel/rail interface.
With regard to wheel flange wear, very limited studies have been conducted on the influence of curved tracks on wheel flange thickness reduction. Studies have been conducted on the influence of curved tracks on the wear of the rail and wheel but without establishing a rigorous, detailed influence of varying the curve radius on the wheel flange wear depth in response to various speeds. Also, optimized rail or wheel profiles have been designed with rail or wheel wear alleviation, among other objectives [18–24]. However, one question remains: how does flange wear and flange thickness reduction in an optimized wheel-rail profile respond to various radii of the curved track?
Thus, it is necessary to clearly understand how variations in the curve radius and speed lead to wheel flange thickness reduction on the curved track. This understanding will lead to measures to improve the ride quality and passenger comfort, reduce maintenance costs, increase the life span of the wheel, and prevent safety issues such as derailment. In the literature, several studies have mentioned the causes of wheel flange wear [11,25–31] but did not detail how each of them leads to wheel flange thickness reduction.
Previous studies have been devoted to developing wheel profiles to reduce the wheel flange thickness reduction, for example [32]. An improved wheel profile design predicted a reduction in flange wear of at least 25% compared to the existing standard wheel profile.
Several studies [33–39] have been conducted on the influence of curved tracks on rail wear. Optimized rail profiles have been developed, and sound remedies have been recommended to overcome this problem. Choi et al. [40] designed a new wheel profile to reduce the wheel flange wear and surface fatigue on a curved track. They utilized VAMPIRE software to perform railway dynamic analysis [41]. To optimize the new wheel profile, they used a fast, nondominated sorting genetic algorithm, NSGA-II [42]. The optimized wheel profile generated better performances with regard to lateral force and derailment and also decreased the wheel flange wear and/or surface fatigue compared to the initial wheel profile.
Despite extensive research on railway wheel wear, there is limited literature addressing the impact of the track curved section radius on wheel flange thickness reduction at varying speeds. Therefore, this study aims to analyze wheel flange wear under the influence of curve radius and rail vehicle speed at a curved track using numerical analysis and simulation.
2 Wheel–rail interaction
Good performance of the wheel–rail interface is the main focus of all successful railway transportation. The wheel–rail interaction includes the contact actions between the wheel and rail. Wheels and rails are crucial components of railway vehicles. The wheel–rail interaction performs functions, such as guidance, to ensure that the deviations of the vehicle running in curves are maintained within tight boundaries and to ensure that in a straight track, the lateral deviations of the vehicle are kept at a minimum. Also, the wheel–rail interaction performs a load-bearing function whereby it ensures that the load of the rail vehicle, as well as passengers and goods, is transmitted to the ground. Finally, the wheel–rail interaction system executes traction and braking functions [43].
Wheel–rail interaction can be classified as lateral/longitudinal interaction or vertical interaction. Lateral/longitudinal interaction involves forces that act in either the longitudinal or lateral direction as a result of flange forces or wheel–rail creep forces. Vertical interactions involve vertical forces between the wheel and the rail. These vertical forces are caused by the weight of the vehicle [44]. There are various parameters that influence the dynamic interaction between the wheel and rail, including track alignment, curves, axle load, train speed, mechanical properties of the track and rail vehicle, and the condition of the wheel–rail interface.
2.1 Wheel–rail contact
At points where the wheel contacts the rail, a contact patch develops. The shape and size of the contact patch between the two elastic bodies in static contact are based on Hertz's theory and can be calculated from the normal force, material properties, and geometry of the wheel and rail in the contact region. Since the wheel and rail materials differ in the chemical composition of steel, the shape of the contact patch formed between them is elliptical [45].
The size of the contact patch between the wheel and the rail is small, that is about 1 cm2 compared to the overall dimensions of the wheel and the rail. The shape of the contact patch depends on the wheel and rail geometry, the lateral position, and the angle of the wheel relative to the rail. The wheel and rail profiles, the degree of curvature of the track, and bogie design influence the exact position of the contact patch. In the curved track, contact occurs on the wheel flange and rail gauge corner, whereas in the straight track, contact occurs on the wheel tread and railhead.
Wheel/rail contact occurs in three main regions, as shown in Figure 2.
![Figure 2
Wheel–rail contact regions [46].](/document/doi/10.1515/eng-2024-0089/asset/graphic/j_eng-2024-0089_fig_002.jpg)
Wheel–rail contact regions [46].
Region A: Contact occurs between the wheel tread and railhead. This contact occurs when the vehicle runs on straight tracks and curves with large radii. This region produces the lowest contact stresses and lateral forces.
Region B: In this region, wheel flange and rail gauge corner contact occur. The contact patch is very small compared to region A. In this region, the wear and contact stresses were much higher.
Region C: Contact between the field sides of the wheel and rail occurs in this region. High contact stresses are induced when contact occurs in this region and may lead to undesirable wear features, causing incorrect steering of the wheelset.
2.2 Wheel–rail contact forces
The dynamic behavior of a rail vehicle on straight as well as curved lines is significantly affected by the interactive forces between the wheel and rail because such forces are extremely high. These forces depend on the adhesion, creep, and wear characteristics. The forces acting on the contact patch are known as tangential and normal forces. The wheel/rail contact forces are developed due to creepages arising from the contact patch. These creepages emanate as a result of traction, braking, and acceleration due to the relative motion of the wheel on the rail.
2.3 Mathematical formulation
The reduction in the wheel flange for a rail vehicle negotiating a curve can be computed using the lost friction energy or modified Archard wear model, which utilizes creep forces and creepages as the main dynamic quantities of wheel–rail interaction. Therefore, to accurately compute the variables contributing to the wear depth, it is crucial to analyze the wheelset dynamics on a curved track. This involves deriving and solving the equations of motion of the wheelset to obtain instantaneous displacements in five degrees of freedom: roll, lateral, yaw, longitudinal, and vertical, as well as their corresponding velocities. If the lift of the wheelset is absent, the roll and lateral displacements depend on each other. Therefore, only four degrees of freedom remain for the wheelset: lateral/roll, yaw, longitudinal, and vertical displacements.
Creepage is calculated based on the relative velocity between the rail and wheel at contact points compared to the nominal rolling velocity. Utilizing Kalker’s Linear Theory, creepages are used to determine creep forces. These forces are critical for understanding the wheel–rail wear mechanisms.
On curved track sections, the wheel flange wear depth can be determined whenever the lateral displacement equals or exceeds the clearance between the wheel flange and rail gauge. The analysis of wheelset dynamics is detailed in the study of Garg and Dukkipati [47], although they did not focus on the wheel flange, or wear depth. However, this general approach is applicable.
The free-body diagram of the wheelset moving on a curved track section, with all resultant forces acting on it, is illustrated in Figure 3, where
where, after considering small angles of roll and yaw motion,
![Figure 3
(a) Track centered reference and wheelset coordinate systems [47]. (b) Wheel set free body diagram [47].](/document/doi/10.1515/eng-2024-0089/asset/graphic/j_eng-2024-0089_fig_003.jpg)
The equations of motion for a single wheel set passing through a curved track can be derived using the following Newton’s law:
where
where
The contact point displacements and external moment vectors are given by
where
The wheelset acceleration kinematics of the wheelset is given by
where
Recalling that
where
and
where
Next, we substitute Equations (9a)–(9c) into Equation (8) and substitute the result along with Equation (4) in Equation (2). The results give us the force vector components in the reference coordinate system. These relations are given by Equations (12)–(14). Also, we substitute terms in Equation (11) after performing the differentiation in Equation (10), and substitute Equations (6) and (7a)–(7c) in Equation (5). After algebraic manipulation and comparing the results in Equation (10) and results in Equation (5), we obtain the resultant creep moment vector component equations written as per the reference coordinate by equations.
Longitudinal equation:
Lateral equation:
Vertical equation:
Roll equation:
Yaw equation:
Spin equation:
The normal force vectors can be eliminated in Equations (12)–(17) by substituting in the following equations:
where
Substituting Equations (19a)–(19d) into Equations (14) and (15),
2.4 Creepages
From Equations (12)–(17), the displacements and corresponding velocities can be solved after the creep forces and moments are eliminated. These displacements and velocities form the basis for calculating the creepages, which in turn are used to calculate the creep forces and wear in the form of creep energy loss.
2.4.1 Longitudinal creepage
The longitudinal creep exists when there is a difference in the rolling radii of the wheels on the wheelset. This was because the wheel profile was coned. Therefore, the longitudinal creepage is given by
where
Right wheel:
Left wheel:
2.4.2 Lateral creepage
It is defined as the incremental relative lateral velocity divided by forward speed. Lateral creepage has a significant effect on rail corrugations caused by lateral creep forces. Therefore, the lateral creepage is given by
where
Right wheel:
Left wheel:
2.4.3 Spin creepage
The spin creepage is due to the component of the relative angular motion between the wheel and rail normal to the contact patch. The angular velocity of the wheel relative to the rail consists of three components: one perpendicular to the contact plane and two tangential to the plane of contact. Pure rolling of the wheels is assumed for the spin or slide to not occur. Thus, the spin creepage is given by
where
Right wheel:
Left wheel:
2.5 Creep forces
The creep forces originate from lateral, longitudinal, and spin creepages. They can be determined for small creepages or mild regime wear by using Kalker’s linear theory as follows [49]:
Longitudinal creep force:
Lateral creep force:
Spin creep moment:
where in Equations (4)–(9a) to (9c)
where G is the material shear modulus of steel, a and b are semi-axes of the elliptical wheel/rail contact patch, and C 11, C 22, C 23, and C 33 are constant coefficients tabulated in the study of Kaiker [50].
By substituting Equations (29)–(34) into Equations (12)–(17) and recalling that the normal force variables are already eliminated, we consider that, in the absence of wheelset lift, the coordinate
Once these displacements are computed, the velocities can be determined, and subsequently, the creepages can be calculated. From these results, the creep forces and spin moments can be derived. With the creepages, creep forces, and moments computed, the final step was to calculate wear.
Equations (29)–(34) are valid for small creepages that lead to a mild wear evolution regime. Nonlinear models are utilized for large creepages such as those encountered in severe or catastrophic wear regimes. These models have been detailed in a review of numerical models for the computation of wheel and rail profile wear [51,52]. The transition between wear regimes has been investigated in the work of Lewisa and Dwyer-Joyce [53], and later in the work of Lewis et al. [54]. The mild regime to severe regime transition was found to be caused by a change from partial-slip to full-slip conditions at the wheel–rail interface. The transition from a severe regime to a catastrophic regime is driven by an elevated temperature, which decreases the yield strength of interfacing materials.
3 Wear of railway wheels
Wear is defined as the loss or displacement of material from the contact surfaces. The location of wear on the wheel profile depends on the contact position. Also, the highest wear occurring on the wheels is due to the type of railway network on which the rail vehicle is running. Wheel flange thickness reduction is mostly experienced in railway networks with sharp curves because of the large angle of attack of the wheelset [55]. Wheel flange wear occurs whenever the lateral displacement equals or exceeds the clearance between the wheel flange and rail gauge.
The life span of the wheel may be lengthened by reprofiling; however, reprofiling may alter the material properties of the wheel. In addition, railway wheels can only be re-profiled three or four times before the wheelset is replaced, which is very costly. The outrageous railway wheel wear means that the rails are also prone to premature deterioration [56]. However, in the case of this study, the main focus was only on wheel flange thickness reduction. The major causes of wheel wear are the contact forces (creep forces) and creepages. The high contact forces are a result of friction forces during the acceleration and braking of railway vehicles, track irregularities, and sharp curving [57].
3.1 Wear parameters of a railway wheel
Throughout the course of operation, steel railway wheels are subjected to wear, and numerous measures have been employed to describe the profile of worn wheels. The dynamic behavior and stability of rail vehicles are altered owing to the wear of the railway wheel. The wheel flange undergoes three commonly used measures to quantify the severity of the wheel profile wear: flange thickness (S
d), flange height (S
h), and flange gradient (QR). The other wear parameters are shown in Figure 3, where
Globally, the railway industry determines wheel wear based on planned and scheduled measurements of geometrical parameters like S
d, S
h, and
![Figure 4
Wear parameters of railway wheels [56].](/document/doi/10.1515/eng-2024-0089/asset/graphic/j_eng-2024-0089_fig_004.jpg)
Wear parameters of railway wheels [56].
Pombo et al. [56] analyzed the effect of vehicle characteristics, trainset service conditions, and track characteristics on wheel wear using Vampire software with an inbuilt wear module. In their analysis, they considered parameters such as the influence of primary suspensions, rail cant, traction/braking forces, and vehicle velocity on wheel wear. Using this computational tool, they concluded that rail vehicles assembled with softer primary suspensions yielded less wheel wear on both the wheel flange and the tread. Regarding the influence of the rail cant, the rail vehicle assembled with wheel profile S1002 running on the track with rail cant 1/40 has a higher wheel wear growth than a track with a rail cant of 1/20. Furthermore, the influence of the traction/braking forces results in more wear on the wheel tread than on the wheel flange. Finally, the influence of vehicle velocity, when the vehicle velocity is reduced to half of the vehicle service speed, produces an increment of more than 20% in the distance that the train is able to travel before requiring the re-profiling of its wheelset.
Laboratory simulated tests were conducted by Jin et al. [8] to predict the wear of the wheel flange and rail gauge corner on a curved track by employing a large twin-disc test machine with actual profiles of the wheel and rail. The major parameters considered in this experimental research included the effect of thrust load (lateral force), angle of attack, rail hardness, and the presence of water lubrication on the wear behaviors of the wheel flange and rail gauge corner. The experimental results showed that an increase in the angle of attack increased the wear rates for both the wheel flange and rail gauge corner. In addition, the increase in the initial rail hardness resulted in a decrease in the wear rate of the rail gauge corner but led to an increase in the wear rate of the wheel flange during the earlier wear process. However, during the late wear process, the wear rate of the wheel flange decreases as the initial rail hardness increases. Furthermore, the wear rates of both the wheel flange and rail gauge corner increased with an increase in the thrust force (lateral force). Finally, water lubrication reduced the wear rate of both the wheel flange and rail gauge corner.
3.2 Wear model
This section focuses on the phases involved in the wheel flange thickness reduction wear model, including the computation of the area of material loss and the assumptions considered. The wear model takes into account creep forces and creepages. In this work, the wear of the wheel flange thickness is studied by considering the effect of variation in the curve radius and variation in speed on a curved track. Plastic and fatigue wear were not considered in the wear model.
3.3 Local wheel/rail contact model
The purpose of the local contact model is to calculate the local contact variables, such as the normal and tangential stresses and local creeps. The inputs of the wear model are the global contact parameters approximated by the multibody vehicle model. The global contact parameters need to be post-processed from the post-processor interface of the Simpack Rail software to compute the local wear. This can be accomplished using the simplified Kalker’s theory implemented in the FASTSIM algorithm. This theory makes use of the global creepages (λ), normal and tangential global forces, material properties, and contact patch dimensions (a,b) to compute the local contact of the normal and tangential stresses and local creeps across the wheel–rail contact area. Details of the FASTSIM algorithm can be found in the study of Kalker [58].
3.4 Wear computation
The wear model assumes that the material loss is proportional to the friction energy dissipated in the wheel/rail contact patch (
where
Equations for the BRR wear function [41]
| Wear regime | Wear index (
|
Area of material loss on the profile (mm2) |
|---|---|---|
| Mild |
|
0.25
|
| Severe | 100 ≤
|
25/D |
| Catastrophic |
|
(1.19
|
Assumptions considered in the wear model computation:
Dry contact conditions
Maximum creep forces and creepages.
4 Methods of computing wear of the wheel flange using a multibody system simulation
This section details the method used to fulfill the main objectives of this study. A rail vehicle-track model was set up, and a dynamic analysis simulation of the model was performed by varying the curve radii and speed to analyze their effect on the wheel flange thickness at the curved track.
We used the multibody system simulation software SIMPACK to analyze the effect of variations in curve radius and speed. Figure 5 illustrates the information flow from setting up the multibody dynamic model to performing the computation. The multibody system simulation of a rail vehicle has been shown to be a powerful method for predicting wheel wear [60,61].
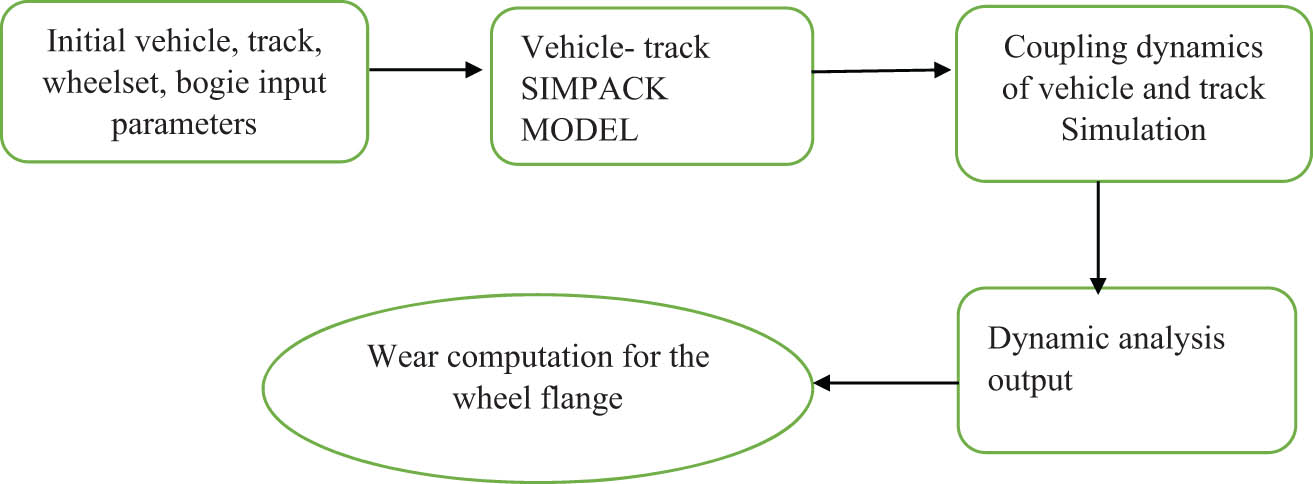
Schematic view of the overall methodology.
4.1 Procedure for modeling the rail vehicle in SIMPACK software
The first step was the realization of a multibody model of a complete railway vehicle and track combination. The input parameters for the multibody model of the rail vehicle system were the geometry, stiffness, damping, and inertial properties of the considered railway vehicle. Tables 2–4 list the rail vehicle system model parameters, which were drawn from the Addis Ababa Light Rail Transit systems and operation parameters. These include curve radii, track geometric dimensions, vehicle component dimensions, lamp parameter values, and operational speeds.
Main inertial properties of the vehicle model
| Parameter/body | Mass (kg) | Moment of inertia (I xx ) (kg/m2) | Moment of inertia (I yy ) (kg/m2) | Moment of inertia (I zz ) (kg/m2) |
|---|---|---|---|---|
| Wheelset | 880 | 176 | 76 | 176 |
| Bogie frame | 4,200 | 1,215 | 1,875 | 2,182 |
| Motor car A | 17,500 | 4,375 | 8,750 | 8,750 |
| Trailer car B | 12,325 | 3081.25 | 6162.5 | 6162.5 |
| Motor car C | 17,500 | 4,375 | 8,750 | 8,750 |
Main linear stiffness properties of the vehicle model
| Parameter | Value | Unit |
|---|---|---|
| Primary suspension | ||
| Stiffness coefficient Cx | 580,000 | kN/m |
| Stiffness coefficient Cy | 580,000 | kN/m |
| Stiffness coefficient Cz | 1,450,000 | kN/m |
| Damping coefficient dz | 125,000 | kNs/m |
| Secondary suspension | ||
| Stiffness coefficient Cx | 300,000 | kN/m |
| Stiffness coefficient Cy | 350,000 | kN/m |
| Stiffness coefficient Cz | 500,000 | kN/m |
| Damping coefficient dy | 200,000 | kNs/m |
| Damping coefficient dz | 400,000 | kNs/m |
Design parameters for rail vehicle and track used for validation
| Specification | Value |
|---|---|
| Mass of the car body | 42,100 kg |
| Height of the car body center of gravity from the rail level | 2,300 mm |
| Mass of the bogie frame | 3,820 kg |
| Height of the bogie frame center of gravity from the rail level | 450 mm |
| X-stiffness of the primary spring | 5,400 kN/m |
| Y-stiffness of the primary spring | 5,400 kN/m |
| Z-stiffness of the primary spring | 1,350 kN/m |
| Flange back distance | 1,354 mm |
| Rail gauge | 1,435 mm |
| Wheel profile | Conical type 1/20 profile |
| Wheel diameter | 860 mm |
| Rail profile | KS60 kg |
| Rail inclination | 1/40 |
| Wheel load | 68.6 kN |
| Axle load | 137.2 kN |
| Wheelset mass | 1,640 kg |
| Vehicle speed | 70 km/h |
| Track | 25 m straight track, 77 m of transition curve, 98 m of curved R350 track, 77 m of the transition curve, and 223 m straight track |
The vehicle was divided into bodies, joints, and force elements, which were defined in the modeling process. The major components of the vehicle model included wheelsets, bogie frames, and car bodies, as shown in Figure 6, and were all modeled as rigid bodies connected to each other by means of primary suspensions, dampers, secondary suspensions, and articulation components.

A solid representation of the vehicle-track model.
In the modeling, the reference axes were set in an appropriate wheel/rail perspective, with the Z-axis pointing downward. The track was created using a standard gauge of 1,435 mm. Wheelsets were then created by describing the mass, moment of inertia, and their respective positions. The standard selected for the wheel type was S1002, with a wheel flange thickness (S d) of 21.21 mm and a wheel flange angle of 70°. The standard selected for the rail type was UIC 60.
After creating the wheelsets, the bogie frames were created. The bogie frame firmly supports the car body with the help of secondary suspensions, and the wheelset is connected to the bogie frame through primary suspensions. Force elements, such as primary suspensions, dampers, and secondary suspensions, with their respective stiffnesses, were created. Finally, the car bodies were modeled, as illustrated in Figure 6.
The car bodies were connected through articulation components, which helped them run together on both straight and curved tracks.
Articulation components were categorized as lower fixed articulations, upper fixed articulations, flexible articulations, and fixed articulation dampers. These components were all modeled using CATIA V5 software.
4.2 Conditions for simulation
The conditions considered during the simulation of the rail vehicle-track model include the following:
The wheelset, bogie, and car body masses were considered rigid.
The coefficient of friction under dry conditions was considered to be 0.4 between wheel/rail contact and wheel–simulation.
The track was considered a standard gauge.
The wheel profiles, primary and secondary suspensions were considered identical.
Track irregularities were considered.
The axle box was assumed to be an integral part of the wheelset, and its weight was combined with the wheelset’s mass.
A bogie bolster was assumed as the integral part of the car body combined with its mass.
Figures 7 and 8 show the wheel–rail contact and wheelset contact geometry at the maximum load and minimum radius R50 at a maximum speed of 20 km/h at the curved track. After the simulation, both figures show the wheel-flange contact on the rail.

Wheel/rail contact.

Wheel contact geometry.
4.3 Validation of SIMPACK simulation results
In this section, the results obtained from our adopted simulation software are verified by comparing them with the results obtained in the study of Choi et al. [40], in which the Vampire software was used. Their simulation results were validated experimentally using a wheel/rail test rig [62]. In both studies, the Vampire software was used to simulate the wear of the components in contact; however, in the latter publication, the software was validated and proved to be sufficiently accurate. The latter study focused on the wear of the rail at the curved track, and the validation of the software indicated that it can also be used for the wheel flange. The speed, rail vehicle, and track parameters used in this validation were documented [40].
Similar procedures and conditions for simulations were used during the validation, as used in (the already validated) the study of Jin et al. [8]. The wear index is calculated similarly, as shown in Equation (39). It can be seen from Figure 9 that both simulations have similar results, and the wear indices attained have a slim percentage error of 1.94%.

Wear index of the wheel.
5 Results and discussion
5.1 Influence of the variation in the curve radius on the wheel flange thickness reduction at the curved track
The simulation is conducted for the sharpest curve radius of 50 m at a speed of 40 km/h. The horizontal axis represents the distance traveled by the rolling stock, and the vertical axis represents the area of material loss on the wheel flange (wheel flange thickness reduction), as shown in Figure 10.

Area of material loss against distance for curve radius of 50 m at a speed of 40 km/h.
As indicated in Figure 10, at a distance of 33.78 m, the rolling stock is in the transition curve, and the area of material loss increases progressively due to an increase of lateral forces. Around 50 m, the graph takes on a sawtooth-like shape, with the highest peak of the area of material loss, which is 2.9 mm2; at this point, rolling stock is running through the curved track. The sawtooth-like shape occurs because there is no perfectly smooth curve. Around 163 m, the rolling stock goes through another transition curve, leading to a decrease in the area of material loss as the distance increases to 194 m. This occurs because of the reduction in the lateral forces between the wheel flange and rail. Beyond 194 m, the rolling stock passes through a straight track, and the area of material loss on the wheel flange is almost constant because of low and constant lateral forces. As the rolling stock approaches another curved track, the area of material loss on the wheel flange increases with increasing travel distance in a sawtooth-like shape with a larger pitch and a maximum peak of 0.87 mm2.
Figure 11 shows the area of material loss against distance for curve radii of 50 and 100 m at a constant speed 20 km/h. The highest area of material loss on the wheel flange of about 2.89 mm2 at curve radius 50 m. This is because of the high lateral forces caused by an increase in the speed of the rolling stock on a sharp curve. In conclusion, curves with small radii lead to an increase in the area of material loss on the wheel flange compared with curves with large radii.

Area of material loss against distance for variation of curve radius at a constant speed of 20 km/h for curve radii of 100 and 50 m.
Figure 12 shows the area of material loss against the distance of curve radii of 100 and 50 m for a constant speed of 30 km/h (Figure 12(a)) and a constant speed of 40 km/h (Figure 12(b)). It can be observed from both figures (a) and (b) that the area of material loss on the wheel flange is very high when the curve radius is 50 m compared to when the curve radius is 100 m. At a curve radius of R50 m, the area of the material when the speed is 30 km/h is 2.9 mm2, and when the speed is 40 km/h, it is 2.93 mm2. This is because when the rolling stock runs through a curved track with a small radius, it experiences high lateral forces compared with when it passes through a curved track with large radii. Hence, the wheel flange thickness reduction is more pronounced on a curved track with small radii than on a curved track with large radii.

Area of material loss against distance for variation in the curve radius: (a) constant speed = 30 km/h for curve radii of 100 and 50 m; (b) constant speed = 40 km/h for curve radii 100 and 50 m.
5.2 Influence of variation in speed on the wheel flange thickness reduction at the curved track
The influence of speed on the wheel flange thickness reduction on a curved track is simulated by varying the speed from 10 to 40 km/h with four variations of speeds and a coefficient of friction of 0.4. The stability of the rolling stock was determined by the lateral displacement of the wheelset. From Figure 13, it is obvious that increasing the speed of the rolling stock causes the wheelset to approach the outer rail of the curved track, thus increasing the instability of the rail vehicle on the curved track. In the curved track, the wheelsets are displaced laterally toward the outer rail, as much as needed, so that the difference in rolling radii corresponds to the difference in the traveled length on the outer and inner rails. Because no sufficient difference in the rolling radii is achieved, the lateral displacement increases until it is limited by the flange contact on the outer wheel. In conclusion, the lateral displacement of wheelsets increases with increasing curving speed. Therefore, the higher the lateral displacement of the wheelsets, the more the wheel flange contacts the rail side, leading to a reduction in the wheel flange thickness. The area of material loss of the wheel flange against the distance at different speeds is shown in Figure 14.

Lateral displacement of the wheelset at different speeds.

Area of material loss against distance for the effect of variation in speed on the wheel flange thickness reduction at a curved track of 50 m.
Figure 14 shows the area of material loss on the wheel flange against distance for the influence of speed variation on the wheel flange thickness reduction on a curved track. It can be seen from Figure 14 that at a speed of 40 km/h, the area of material loss on the wheel flange is the highest, with a value of about 2.9 mm2, and at a speed of 10 km/h, the area of material loss on the wheel flange is lowest, with a value of 2.78 mm2. In conclusion, increasing the train speed leads to a reduction in wheel flange thickness on a sharply curved track.
According to Figure 15, the highest area of material loss on the wheel flange with a value of approximately 1.48 mm2 occurs at the lowest speed of 10 km/h, and the lowest area of material loss on the wheel flange with a value of about 1.11 mm2 occurs at a speed of 40 km/h. This is because the rolling stock takes a longer time to negotiate the curved track at the lowest speed than at the highest speed. In the long run, wheel-flange contact occurs on the rail. However, because of the excessive contact time between the wheel and rail, high lateral forces were generated. The high lateral forces between the wheel flange and rail cause a reduction in the wheel flange thickness on a curved track.

Area of material loss against distance for the effect of variation in speed on wheel flange thickness at a curved track of 100 m.
6 Conclusions
In this research, a detailed analysis of the effect of the curved track on the wheel flange thickness reduction is presented. This analysis is performed based on different parameters, such as the variation of curve radius, variation of train speed, and variation of trainload. The wear of the wheel flange thickness was also calculated in the form of the area of material loss using the BRR wear law.
Based on the results from the variation of the curve radius, it is evident that sharp curves such as 50 m lead to the occurrence of wheel flange thickness reduction compared to when the curve radius is large. This is because when the train negotiates curves with small radii, high lateral forces are generated, which in turn results in contact between the wheel flange and the rail, thus leading to a reduction in the wheel flange thickness.
The study on the influence of variation of train speed reveals that the higher the speed (50 m) of the train as it passes through the curved, the more pronounced the wheel flange thickness is, especially in sharp curves compared to curves with larger radii. In addition, a very low speed also leads to a reduction in the wheel flange thickness because of excessive wheel–rail contact.
In this research, a comparison between the wear index results obtained using VAMPIRE by Choi et al. [40] and SIMPACK was performed. The results are very closely similar with a percentage error in the wear index of 1.94%.
The obtained results are necessary for developing countermeasures to overcome the repercussions of wheel flange thickness reduction and for carrying out proper re-profiling.
To reduce the occurrence of wheel flange thickness reduction at a curved track, it is recommended that the speed when the train passes through the curved track must be less than 20 km/h to be precise at 15 km/h to prevent delay at sharp curves. In addition, the speed of the train to negotiate through a curve with large radii must be moderately high (30 km/h up to the maximum operating speed of the rolling stock at the curved track) in order to overcome the wheel flange thickness reduction.
However, because changes in the curve radius of the track are very expensive to implement, it is recommended that better lubrication systems be used and serious monitoring of the rolling stock speed be considered to reduce the catastrophic wheel flange thickness. It is a good practice to prevent wheel flange thickness reduction to reduce maintenance costs; however, there are very limited studies on wheel flange thinning due to track curved sections.
Based on the research conducted in this study, recommendations for future work can be suggested. They include, for example, research to deeply understand the effect of the material of both the wheel and rail in relation to flange thickness reduction, an investigation on the connection between motor cars and trailer cars in relation to wheel flange thickness, and studies on the influence of track alignment and track irregularities on wheel flange thickness reduction.
Acknowledgement
The authors acknowledge the management staff of the African Railway Center of Excellence for their invaluable support in the early stages of this project.
-
Funding information: This research was partially funded by the African Railway Center of Excellence at Addis Ababa University through its student research grants.
-
Author contributions: All authors have accepted responsibility for the entire content of this manuscript and consented to its submission to the journal, reviewed all the results and approved the final version of the manuscript. Conceptualization, formal analysis, and investigation: ZN, CN, and BMZ. Supervision: CN and BMZ. Data collection: ZN. Draft manuscript preparation: ZN and CN.
-
Conflict of interest: Authors state no conflict of interest.
-
Data availability statement: All data generated or analyzed during this study are available from the corresponding author upon request.
References
[1] Pombo J, Desprets H, Verardi R, Ambrósio J, Pereira M, Ariaudo C, et al. Wheel wear evolution and its influence on the dynamic behaviour of railway vehicles. 7th EUROMECH Solid Mechanics Conference; 2009. p. 22.Search in Google Scholar
[2] Ramalho A. Wear modelling in rail-wheel contact. Wear. 2015;330–331:524–32.10.1016/j.wear.2015.01.067Search in Google Scholar
[3] Mikaliūnas Š, Lingaitis LP, Subačius R. Analysis of locomotive wheel sets wearing. Transport. 2002;17(1):3–7.10.3846/16483480.2002.10414003Search in Google Scholar
[4] Brizuela J, Ibañez A, Nevado P, Fritsch C. Railway wheels flat detector using doppler effect. Phys Procedia. 2010;3(1):811–7.10.1016/j.phpro.2010.01.104Search in Google Scholar
[5] Iwnicki SD. Handbook of railway vehicle dynamics. (1st ed.). CRC Press; 2006.10.1201/9781420004892.ch1Search in Google Scholar
[6] Dirks B, Enblom R. Prediction model for wheel profile wear and rolling contact fatigue. Wear. 2011;271(1–2):210–7.10.1016/j.wear.2010.10.028Search in Google Scholar
[7] Hao C, Chen J, Sun X, Xu F, Xu J, Wang P. Effects of flange wear on dynamic vehicle-turnout interaction. Proc Inst Mech Eng F J Rail Rapid Transit. 2023 May;237(5):642–54.10.1177/09544097221127783Search in Google Scholar
[8] Jin Y, Ishida M, Namura A. Experimental simulation and prediction of wear of wheel flange and rail gauge corner. Wear. 2011;271(1–2):259–67.10.1016/j.wear.2010.10.032Search in Google Scholar
[9] Kowalski S. Fretting wear in selected elements of rail vehicles. Tehnicki Vjesn – Tech Gaz. 2018 Sep;25(Supplement 2):481–6.10.17559/TV-20160601144609Search in Google Scholar
[10] Li Y, Dai L, Guo Z, Chi M. Carbody abnormal lateral vibration failure of high–speed train induced by the coupling factor of the wheel re–profiling method and excessive rail wear. Eng Fail Anal. 2024 Jun;160:108170.10.1016/j.engfailanal.2024.108170Search in Google Scholar
[11] Pearce TG. Wheelset guidance – conicity, wheel wear and safety. Proc Inst Mech Eng F J Rail Rapid Transit. 1996 Jan;210(1):1–9.10.1243/PIME_PROC_1996_210_321_02Search in Google Scholar
[12] Chang C, Chen B, Cai Y, Wang J. Experimental investigation of high-speed wheel-rail adhesion characteristics under large creepage and water conditions. Wear. 2024 Mar;540–541:205254.10.1016/j.wear.2024.205254Search in Google Scholar
[13] White B, Lewis R, Fletcher D, Harrison T, Hubbard P, Ward C. Rail-wheel friction quantification and its variability under lab and field trial conditions. Proc Inst Mech Eng F J Rail Rapid Transit. 2024 May;238(5):569–79.10.1177/09544097231209483Search in Google Scholar
[14] Wang W, Huang J, Ding H, Wen Z, Cui X, Lewis R, et al. Initiation and evolution of wheel polygonal wear: Influence of wheel-rail hardness ratios. Wear. 2024 Mar;540–541:205255.10.1016/j.wear.2024.205255Search in Google Scholar
[15] Kowalski S. The influence of selected PVD coatings on fretting wear in a clamped joint based on the example of a rail vehicle wheel set. Eksploatacja i Niezawodność – Maint Reliab. 2018 Mar;20(1):1–8.10.17531/ein.2018.1.1Search in Google Scholar
[16] Muhamedsalih Y, Tucker G, Stow J. Optimisation of wheelset maintenance by using a reduced flange wear wheel profile. Proc Inst Mech Eng F J Rail Rapid Transit. 2023 Feb;237(2):253–65.10.1177/09544097221105959Search in Google Scholar
[17] Zakharov S, Komarovsky I, Zharov I. Wheel flange/rail head wear simulation. Wear. 1998 Mar;215(1–2):18–24.10.1016/S0043-1648(97)00293-7Search in Google Scholar
[18] Ye Y, Sun Y, Dongfang S, Shi D, Hecht M. Optimizing wheel profiles and suspensions for railway vehicles operating on specific lines to reduce wheel wear: a case study. Multibody Syst Dyn. 2021 Jan;51(1):91–122.10.1007/s11044-020-09722-4Search in Google Scholar
[19] Hou M, Qi Y, Chi C, Ao P, Liu H. Wheel profile optimization for intercity EMUs based on the Gaussian function correction method. Proc Inst Mech Eng F J Rail Rapid Transit. 2024;238(7):775–85.10.1177/09544097241229142Search in Google Scholar
[20] Wang M, Jia J, Liu P, Chen E, Su K. Multiobjective optimisation of rail profile at high speed. Veh Syst Dyn. 2024 Mar;62(3):673–94.10.1080/00423114.2023.2189127Search in Google Scholar
[21] Qi Y, Dai H, Gan F, Gao H. Optimisation of wheel profile of variable gauge high-speed trains. Veh Syst Dyn. 2024 Mar;62(3):651–72.10.1080/00423114.2023.2186250Search in Google Scholar
[22] Qi Y, Dai H, Wu P, Gan F, Ye Y. RSFT-RBF-PSO: a railway wheel profile optimisation procedure and its application to a metro vehicle. Veh Syst Dyn. 2022 Oct;60(10):3398–418.10.1080/00423114.2021.1955135Search in Google Scholar
[23] Ye Y, Vuitton J, Sun Y, Hecht M. Railway wheel profile fine-tuning system for profile recommendation. Railw Eng Sci. 2021 Mar;29(1):74–93.10.1007/s40534-021-00234-1Search in Google Scholar
[24] Li G, Li X, Li M, Na T, Wu S, Ding W. Multi-objective optimisation of high-speed rail profile with small radius curve based on NSGA-II Algorithm. Veh Syst Dyn. 2023 Dec;61(12):3111–35.10.1080/00423114.2022.2158878Search in Google Scholar
[25] Licciardello R, Malavasi G, Ricci S, Vitali P. Wear rates in urban rail systems. WIT Trans Built Environ. 2017;176(11):559–69.10.2495/UT170481Search in Google Scholar
[26] Fröhling RD. Analysis of asymmetric wheel profile wear and its consequences. Veh Syst Dyn. 2006 Jan;44(sup1):590–600.10.1080/00423110600879296Search in Google Scholar
[27] Dirks B. Simulation and measurement of wheel on rail fatigue and wear. Doctoral dissertation. Stockholm: KTH Royal Institute of Technology; 2015.Search in Google Scholar
[28] Iwnicki SD. The effect of profiles on wheel and rail damage. Int J Veh Struct Syst. 2009;1(4):99–104.10.4273/ijvss.1.4.07Search in Google Scholar
[29] Lingaitis LP, Mikaliūnas Š, Vaičiūnas G. The analysis of wear intensity of the locomotive wheel – sets. Transport. 2010;19(1):32–6.10.3846/16484142.2004.9637950Search in Google Scholar
[30] Ma WH, Luo SH, Song RR. A study of wheel flange partial wear problem of heavy haul locomotive. Adv Mat Res. 2011 Feb;204–210:241–4.10.4028/www.scientific.net/AMR.204-210.241Search in Google Scholar
[31] Magel EE. A survey of wheel/rail friction. No. DOT/FRA/ORD-17/21. United States. Federal Railroad Administration. Office of Research, Development, and Technology; 2017.Search in Google Scholar
[32] Magel E, Kalousek J, Caldwell R. A numerical simulation of wheel wear. Wear. 2005 Mar;258(7–8):1245–54.10.1016/j.wear.2004.03.033Search in Google Scholar
[33] Wang WJ, Guo J, Liu QY, Zhu MH, Zhou ZR. Study on relationship between oblique fatigue crack and rail wear in curve track and prevention. Wear. 2009 Jun;267(1–4):540–4.10.1016/j.wear.2008.12.100Search in Google Scholar
[34] Choi HY, Lee DH, Song CY, Lee J. Optimization of rail profile to reduce wear on curved track. Int J Precis Eng Manuf. 2013 Apr;14(4):619–25.Search in Google Scholar
[35] Wang J, Chen X, Li X, Wu Y. Influence of heavy haul railway curve parameters on rail wear. Eng Fail Anal. 2015 Nov;57:511–20.10.1016/j.engfailanal.2015.08.021Search in Google Scholar
[36] Zhai W, Gao J, Liu P, Wang K. Reducing rail side wear on heavy-haul railway curves based on wheel–rail dynamic interaction. Veh Syst Dyn. 2014 May;52(sup1):440–54.10.1080/00423114.2014.906633Search in Google Scholar
[37] Cui D, Zhang W, Tian G, Li L, Wen Z, Jin X. Designing the key parameters of EMU bogie to reduce side wear of rail. Wear. 2016 Nov;366–367:49–59.10.1016/j.wear.2016.07.002Search in Google Scholar
[38] Jin X, Xiao X, Wen Z, Guo J, Zhu M. An investigation into the effect of train curving on wear and contact stresses of wheel and rail. Tribol Int. 2009 Mar;42(3):475–90.10.1016/j.triboint.2008.08.004Search in Google Scholar
[39] Li X, Yang T, Zhang J, Cao Y, Wen Z, Jin X. Rail wear on the curve of a heavy haul line – Numerical simulations and comparison with field measurements. Wear. 2016 Nov;366–367:131–8.10.1016/j.wear.2016.06.024Search in Google Scholar
[40] Choi HY, Lee DH, Lee J. Optimization of a railway wheel profile to minimize flange wear and surface fatigue. Wear. 2013;300(1–2):225–33.10.1016/j.wear.2013.02.009Search in Google Scholar
[41] Pombo J, Ambrósio J, Pereira M, Lewis R, Dwyer-Joyce R, Ariaudo C, et al. Development of a wear prediction tool for steel railway wheels using three alternative wear functions. Wear. 2011;271(1–2):238–45.10.1016/j.wear.2010.10.072Search in Google Scholar
[42] Deb K. NSGA II paper by Kalyanmoy Deb. 182 IEEE Trans Evolut Computation. 2002;6(2):182–97.10.1109/4235.996017Search in Google Scholar
[43] Knothe K, Stichel S. Rail vehicle dynamics. Heidelberg, New York: Springer; 2017.10.1007/978-3-319-45376-7Search in Google Scholar
[44] Shebani AH, Iwnicki SD. Prediction of wheel and rail wear under different contact conditions using artificial neural networks. Wear. 2018;406:173–83.10.1016/j.wear.2018.01.007Search in Google Scholar
[45] Dukkipati RV, Garg VK. Dynamics of railway vehicle systems. Ontario, Canada: Academic Press; 1984. p. 245–7.Search in Google Scholar
[46] Lewis R, Olofsson U. Wheel-rail interface handbook. Cambridge, UK: Woodhead Publishing Limited; 2009.10.1533/9781845696788Search in Google Scholar
[47] Dukkipati RV, Garg VK. Dynamics of railway vehicle systems. Ontario, Canada: Academic Press; 1984.Search in Google Scholar
[48] Wickens AH. Fundamentals of rail vehicle dynamics. Guidance and Stability. London: CRC Press; 2003. p. 6–35.10.1201/9780203970997Search in Google Scholar
[49] Anyakwo A, Ball A. A new method for modelling and simulation of the dynamic behaviour of the wheel-rail contact. Int J Autom Comput. 2012;9(June):237–47.10.1007/s11633-012-0640-6Search in Google Scholar
[50] Kaiker JJ. Wail rail rolling contact theory. Wear. 1991;144:243–61.10.1016/0043-1648(91)90018-PSearch in Google Scholar
[51] Bosso N, Magelli M, Zampieri N. Simulation of wheel and rail profile wear: a review of numerical models. Railw Eng Sci. 2022 Dec;30(4):403–36.10.1007/s40534-022-00279-wSearch in Google Scholar
[52] Fang C, Jaafar SA, Zhou W, Yan H, Chen J, Meng X. Wheel-rail contact and friction models: A review of recent advances. Proc Inst Mech Eng F J Rail Rapid Transit. 2023 Nov;237(10):1245–59.10.1177/09544097231156730Search in Google Scholar
[53] Lewisa R, Dwyer-Joyce RS. Wear mechanisms and transitions in railway wheel steels. Proc Inst Mech Eng, Part J: J Eng Tribol. 2004 Jun;218(6):467–78.10.1243/1350650042794815Search in Google Scholar
[54] Lewis R, Dwyer-Joyce RS, Olofsson U, Pombo J, Ambrosio J, Pereira M, et al. Mapping railway wheel material wear mechanisms and transitions. Proc Inst Mech Eng F J Rail Rapid Transit. 2010;224(3):125–37.10.1243/09544097JRRT328Search in Google Scholar
[55] Dirks B. Simulation and measurement of wheel on rail fatigue and wear. PhD Dissertation. Stockholm: KTH Royal Institute of Technology, 2015. Search in Google Scholar
[56] Ariaudo C, Pereira M, Ambrósio J, Kuka N, Lewis R, Pombo J, et al. A study on wear evaluation of railway wheels based on multibody dynamics and wear computation. Multibody Syst Dyn. 2010;24(3):347–66.10.1007/s11044-010-9217-8Search in Google Scholar
[57] Pradhan S, Samantaray AK, Bhattacharyya R. Prediction of railway wheel wear and its influence on the vehicle dynamics in a specific operating sector of Indian railways network. Wear. 2018;406–407(February):92–104.10.1016/j.wear.2018.03.020Search in Google Scholar
[58] Kalker JJ. Vehicle system dynamics: International journal of vehicle mechanics and mobility a lateral semi-active damping system for trains. Veh Syst Dyn: Int J Veh Mech Mobil. 1982;11(1):1–13.10.1080/00423118208968684Search in Google Scholar
[59] Bevan A, Molyneux-Berry P, Eickhoff B, Burstow M. Development and validation of a wheel wear and rolling contact fatigue damage model. Wear. 2013;307(1–2):100–1.10.1016/j.wear.2013.08.004Search in Google Scholar
[60] Yoshioka A, Terumichi Y, Tsujie M, Matsui J. Study on modeling and numerical analysis for the prediction of wheel wear development. Mech Eng J. 2017;4(4):17-00126.10.1299/mej.17-00126Search in Google Scholar
[61] Ignesti M, Marini L, Meli E, Rindi A. Wear prediction in railway field: development of a model for the study of the wheel and rail profile. In: Eberhardsteiner J, et al. editor. European congress on computational methods in applied sciences and engineering (ECCOMAS). Vienna, Austria: 2012. p. 1–20.10.1016/j.wear.2012.01.020Search in Google Scholar
[62] Choi HY, Lee DH, Song CY, Lee J. Optimization of rail profile to reduce wear on curved track. Int J Precis Eng Manuf. 2013;14(4):619–25.10.1007/s12541-013-0083-1Search in Google Scholar
© 2024 the author(s), published by De Gruyter
This work is licensed under the Creative Commons Attribution 4.0 International License.
Articles in the same Issue
- Regular Articles
- Methodology of automated quality management
- Influence of vibratory conveyor design parameters on the trough motion and the self-synchronization of inertial vibrators
- Application of finite element method in industrial design, example of an electric motorcycle design project
- Correlative evaluation of the corrosion resilience and passivation properties of zinc and aluminum alloys in neutral chloride and acid-chloride solutions
- Will COVID “encourage” B2B and data exchange engineering in logistic firms?
- Influence of unsupported sleepers on flange climb derailment of two freight wagons
- A hybrid detection algorithm for 5G OTFS waveform for 64 and 256 QAM with Rayleigh and Rician channels
- Effect of short heat treatment on mechanical properties and shape memory properties of Cu–Al–Ni shape memory alloy
- Exploring the potential of ammonia and hydrogen as alternative fuels for transportation
- Impact of insulation on energy consumption and CO2 emissions in high-rise commercial buildings at various climate zones
- Advanced autopilot design with extremum-seeking control for aircraft control
- Adaptive multidimensional trust-based recommendation model for peer to peer applications
- Effects of CFRP sheets on the flexural behavior of high-strength concrete beam
- Enhancing urban sustainability through industrial synergy: A multidisciplinary framework for integrating sustainable industrial practices within urban settings – The case of Hamadan industrial city
- Advanced vibrant controller results of an energetic framework structure
- Application of the Taguchi method and RSM for process parameter optimization in AWSJ machining of CFRP composite-based orthopedic implants
- Improved correlation of soil modulus with SPT N values
- Technologies for high-temperature batch annealing of grain-oriented electrical steel: An overview
- Assessing the need for the adoption of digitalization in Indian small and medium enterprises
- A non-ideal hybridization issue for vertical TFET-based dielectric-modulated biosensor
- Optimizing data retrieval for enhanced data integrity verification in cloud environments
- Performance analysis of nonlinear crosstalk of WDM systems using modulation schemes criteria
- Nonlinear finite-element analysis of RC beams with various opening near supports
- Thermal analysis of Fe3O4–Cu/water over a cone: a fractional Maxwell model
- Radial–axial runner blade design using the coordinate slice technique
- Theoretical and experimental comparison between straight and curved continuous box girders
- Effect of the reinforcement ratio on the mechanical behaviour of textile-reinforced concrete composite: Experiment and numerical modeling
- Experimental and numerical investigation on composite beam–column joint connection behavior using different types of connection schemes
- Enhanced performance and robustness in anti-lock brake systems using barrier function-based integral sliding mode control
- Evaluation of the creep strength of samples produced by fused deposition modeling
- A combined feedforward-feedback controller design for nonlinear systems
- Effect of adjacent structures on footing settlement for different multi-building arrangements
- Analyzing the impact of curved tracks on wheel flange thickness reduction in railway systems
- Review Articles
- Mechanical and smart properties of cement nanocomposites containing nanomaterials: A brief review
- Applications of nanotechnology and nanoproduction techniques
- Relationship between indoor environmental quality and guests’ comfort and satisfaction at green hotels: A comprehensive review
- Communication
- Techniques to mitigate the admission of radon inside buildings
- Erratum
- Erratum to “Effect of short heat treatment on mechanical properties and shape memory properties of Cu–Al–Ni shape memory alloy”
- Special Issue: AESMT-3 - Part II
- Integrated fuzzy logic and multicriteria decision model methods for selecting suitable sites for wastewater treatment plant: A case study in the center of Basrah, Iraq
- Physical and mechanical response of porous metals composites with nano-natural additives
- Special Issue: AESMT-4 - Part II
- New recycling method of lubricant oil and the effect on the viscosity and viscous shear as an environmentally friendly
- Identify the effect of Fe2O3 nanoparticles on mechanical and microstructural characteristics of aluminum matrix composite produced by powder metallurgy technique
- Static behavior of piled raft foundation in clay
- Ultra-low-power CMOS ring oscillator with minimum power consumption of 2.9 pW using low-voltage biasing technique
- Using ANN for well type identifying and increasing production from Sa’di formation of Halfaya oil field – Iraq
- Optimizing the performance of concrete tiles using nano-papyrus and carbon fibers
- Special Issue: AESMT-5 - Part II
- Comparative the effect of distribution transformer coil shape on electromagnetic forces and their distribution using the FEM
- The complex of Weyl module in free characteristic in the event of a partition (7,5,3)
- Restrained captive domination number
- Experimental study of improving hot mix asphalt reinforced with carbon fibers
- Asphalt binder modified with recycled tyre rubber
- Thermal performance of radiant floor cooling with phase change material for energy-efficient buildings
- Surveying the prediction of risks in cryptocurrency investments using recurrent neural networks
- A deep reinforcement learning framework to modify LQR for an active vibration control applied to 2D building models
- Evaluation of mechanically stabilized earth retaining walls for different soil–structure interaction methods: A review
- Assessment of heat transfer in a triangular duct with different configurations of ribs using computational fluid dynamics
- Sulfate removal from wastewater by using waste material as an adsorbent
- Experimental investigation on strengthening lap joints subjected to bending in glulam timber beams using CFRP sheets
- A study of the vibrations of a rotor bearing suspended by a hybrid spring system of shape memory alloys
- Stability analysis of Hub dam under rapid drawdown
- Developing ANFIS-FMEA model for assessment and prioritization of potential trouble factors in Iraqi building projects
- Numerical and experimental comparison study of piled raft foundation
- Effect of asphalt modified with waste engine oil on the durability properties of hot asphalt mixtures with reclaimed asphalt pavement
- Hydraulic model for flood inundation in Diyala River Basin using HEC-RAS, PMP, and neural network
- Numerical study on discharge capacity of piano key side weir with various ratios of the crest length to the width
- The optimal allocation of thyristor-controlled series compensators for enhancement HVAC transmission lines Iraqi super grid by using seeker optimization algorithm
- Numerical and experimental study of the impact on aerodynamic characteristics of the NACA0012 airfoil
- Effect of nano-TiO2 on physical and rheological properties of asphalt cement
- Performance evolution of novel palm leaf powder used for enhancing hot mix asphalt
- Performance analysis, evaluation, and improvement of selected unsignalized intersection using SIDRA software – Case study
- Flexural behavior of RC beams externally reinforced with CFRP composites using various strategies
- Influence of fiber types on the properties of the artificial cold-bonded lightweight aggregates
- Experimental investigation of RC beams strengthened with externally bonded BFRP composites
- Generalized RKM methods for solving fifth-order quasi-linear fractional partial differential equation
- An experimental and numerical study investigating sediment transport position in the bed of sewer pipes in Karbala
- Role of individual component failure in the performance of a 1-out-of-3 cold standby system: A Markov model approach
- Implementation for the cases (5, 4) and (5, 4)/(2, 0)
- Center group actions and related concepts
- Experimental investigation of the effect of horizontal construction joints on the behavior of deep beams
- Deletion of a vertex in even sum domination
- Deep learning techniques in concrete powder mix designing
- Effect of loading type in concrete deep beam with strut reinforcement
- Studying the effect of using CFRP warping on strength of husk rice concrete columns
- Parametric analysis of the influence of climatic factors on the formation of traditional buildings in the city of Al Najaf
- Suitability location for landfill using a fuzzy-GIS model: A case study in Hillah, Iraq
- Hybrid approach for cost estimation of sustainable building projects using artificial neural networks
- Assessment of indirect tensile stress and tensile–strength ratio and creep compliance in HMA mixes with micro-silica and PMB
- Density functional theory to study stopping power of proton in water, lung, bladder, and intestine
- A review of single flow, flow boiling, and coating microchannel studies
- Effect of GFRP bar length on the flexural behavior of hybrid concrete beams strengthened with NSM bars
- Exploring the impact of parameters on flow boiling heat transfer in microchannels and coated microtubes: A comprehensive review
- Crumb rubber modification for enhanced rutting resistance in asphalt mixtures
- Special Issue: AESMT-6
- Design of a new sorting colors system based on PLC, TIA portal, and factory I/O programs
- Forecasting empirical formula for suspended sediment load prediction at upstream of Al-Kufa barrage, Kufa City, Iraq
- Optimization and characterization of sustainable geopolymer mortars based on palygorskite clay, water glass, and sodium hydroxide
- Sediment transport modelling upstream of Al Kufa Barrage
- Study of energy loss, range, and stopping time for proton in germanium and copper materials
- Effect of internal and external recycle ratios on the nutrient removal efficiency of anaerobic/anoxic/oxic (VIP) wastewater treatment plant
- Enhancing structural behaviour of polypropylene fibre concrete columns longitudinally reinforced with fibreglass bars
- Sustainable road paving: Enhancing concrete paver blocks with zeolite-enhanced cement
- Evaluation of the operational performance of Karbala waste water treatment plant under variable flow using GPS-X model
- Design and simulation of photonic crystal fiber for highly sensitive chemical sensing applications
- Optimization and design of a new column sequencing for crude oil distillation at Basrah refinery
- Inductive 3D numerical modelling of the tibia bone using MRI to examine von Mises stress and overall deformation
- An image encryption method based on modified elliptic curve Diffie-Hellman key exchange protocol and Hill Cipher
- Experimental investigation of generating superheated steam using a parabolic dish with a cylindrical cavity receiver: A case study
- Effect of surface roughness on the interface behavior of clayey soils
- Investigated of the optical properties for SiO2 by using Lorentz model
- Measurements of induced vibrations due to steel pipe pile driving in Al-Fao soil: Effect of partial end closure
- Experimental and numerical studies of ballistic resistance of hybrid sandwich composite body armor
- Evaluation of clay layer presence on shallow foundation settlement in dry sand under an earthquake
- Optimal design of mechanical performances of asphalt mixtures comprising nano-clay additives
- Advancing seismic performance: Isolators, TMDs, and multi-level strategies in reinforced concrete buildings
- Predicted evaporation in Basrah using artificial neural networks
- Energy management system for a small town to enhance quality of life
- Numerical study on entropy minimization in pipes with helical airfoil and CuO nanoparticle integration
- Equations and methodologies of inlet drainage system discharge coefficients: A review
- Thermal buckling analysis for hybrid and composite laminated plate by using new displacement function
- Investigation into the mechanical and thermal properties of lightweight mortar using commercial beads or recycled expanded polystyrene
- Experimental and theoretical analysis of single-jet column and concrete column using double-jet grouting technique applied at Al-Rashdia site
- The impact of incorporating waste materials on the mechanical and physical characteristics of tile adhesive materials
- Seismic resilience: Innovations in structural engineering for earthquake-prone areas
- Automatic human identification using fingerprint images based on Gabor filter and SIFT features fusion
- Performance of GRKM-method for solving classes of ordinary and partial differential equations of sixth-orders
- Visible light-boosted photodegradation activity of Ag–AgVO3/Zn0.5Mn0.5Fe2O4 supported heterojunctions for effective degradation of organic contaminates
- Production of sustainable concrete with treated cement kiln dust and iron slag waste aggregate
- Key effects on the structural behavior of fiber-reinforced lightweight concrete-ribbed slabs: A review
- A comparative analysis of the energy dissipation efficiency of various piano key weir types
- Special Issue: Transport 2022 - Part II
- Variability in road surface temperature in urban road network – A case study making use of mobile measurements
- Special Issue: BCEE5-2023
- Evaluation of reclaimed asphalt mixtures rejuvenated with waste engine oil to resist rutting deformation
- Assessment of potential resistance to moisture damage and fatigue cracks of asphalt mixture modified with ground granulated blast furnace slag
- Investigating seismic response in adjacent structures: A study on the impact of buildings’ orientation and distance considering soil–structure interaction
- Improvement of porosity of mortar using polyethylene glycol pre-polymer-impregnated mortar
- Three-dimensional analysis of steel beam-column bolted connections
- Assessment of agricultural drought in Iraq employing Landsat and MODIS imagery
- Performance evaluation of grouted porous asphalt concrete
- Optimization of local modified metakaolin-based geopolymer concrete by Taguchi method
- Effect of waste tire products on some characteristics of roller-compacted concrete
- Studying the lateral displacement of retaining wall supporting sandy soil under dynamic loads
- Seismic performance evaluation of concrete buttress dram (Dynamic linear analysis)
- Behavior of soil reinforced with micropiles
- Possibility of production high strength lightweight concrete containing organic waste aggregate and recycled steel fibers
- An investigation of self-sensing and mechanical properties of smart engineered cementitious composites reinforced with functional materials
- Forecasting changes in precipitation and temperatures of a regional watershed in Northern Iraq using LARS-WG model
- Experimental investigation of dynamic soil properties for modeling energy-absorbing layers
- Numerical investigation of the effect of longitudinal steel reinforcement ratio on the ductility of concrete beams
- An experimental study on the tensile properties of reinforced asphalt pavement
- Self-sensing behavior of hot asphalt mixture with steel fiber-based additive
- Behavior of ultra-high-performance concrete deep beams reinforced by basalt fibers
- Optimizing asphalt binder performance with various PET types
- Investigation of the hydraulic characteristics and homogeneity of the microstructure of the air voids in the sustainable rigid pavement
- Enhanced biogas production from municipal solid waste via digestion with cow manure: A case study
- Special Issue: AESMT-7 - Part I
- Preparation and investigation of cobalt nanoparticles by laser ablation: Structure, linear, and nonlinear optical properties
- Seismic analysis of RC building with plan irregularity in Baghdad/Iraq to obtain the optimal behavior
- The effect of urban environment on large-scale path loss model’s main parameters for mmWave 5G mobile network in Iraq
- Formatting a questionnaire for the quality control of river bank roads
- Vibration suppression of smart composite beam using model predictive controller
- Machine learning-based compressive strength estimation in nanomaterial-modified lightweight concrete
- In-depth analysis of critical factors affecting Iraqi construction projects performance
- Behavior of container berth structure under the influence of environmental and operational loads
- Energy absorption and impact response of ballistic resistance laminate
- Effect of water-absorbent polymer balls in internal curing on punching shear behavior of bubble slabs
- Effect of surface roughness on interface shear strength parameters of sandy soils
- Evaluating the interaction for embedded H-steel section in normal concrete under monotonic and repeated loads
- Estimation of the settlement of pile head using ANN and multivariate linear regression based on the results of load transfer method
- Enhancing communication: Deep learning for Arabic sign language translation
- A review of recent studies of both heat pipe and evaporative cooling in passive heat recovery
- Effect of nano-silica on the mechanical properties of LWC
- An experimental study of some mechanical properties and absorption for polymer-modified cement mortar modified with superplasticizer
- Digital beamforming enhancement with LSTM-based deep learning for millimeter wave transmission
- Developing an efficient planning process for heritage buildings maintenance in Iraq
- Design and optimization of two-stage controller for three-phase multi-converter/multi-machine electric vehicle
- Evaluation of microstructure and mechanical properties of Al1050/Al2O3/Gr composite processed by forming operation ECAP
- Calculations of mass stopping power and range of protons in organic compounds (CH3OH, CH2O, and CO2) at energy range of 0.01–1,000 MeV
- Investigation of in vitro behavior of composite coating hydroxyapatite-nano silver on 316L stainless steel substrate by electrophoretic technic for biomedical tools
- A review: Enhancing tribological properties of journal bearings composite materials
- Improvements in the randomness and security of digital currency using the photon sponge hash function through Maiorana–McFarland S-box replacement
- Design a new scheme for image security using a deep learning technique of hierarchical parameters
- Special Issue: ICES 2023
- Comparative geotechnical analysis for ultimate bearing capacity of precast concrete piles using cone resistance measurements
- Visualizing sustainable rainwater harvesting: A case study of Karbala Province
- Geogrid reinforcement for improving bearing capacity and stability of square foundations
- Evaluation of the effluent concentrations of Karbala wastewater treatment plant using reliability analysis
- Adsorbent made with inexpensive, local resources
- Effect of drain pipes on seepage and slope stability through a zoned earth dam
- Sediment accumulation in an 8 inch sewer pipe for a sample of various particles obtained from the streets of Karbala city, Iraq
- Special Issue: IETAS 2024 - Part I
- Analyzing the impact of transfer learning on explanation accuracy in deep learning-based ECG recognition systems
- Effect of scale factor on the dynamic response of frame foundations
- Improving multi-object detection and tracking with deep learning, DeepSORT, and frame cancellation techniques
- The impact of using prestressed CFRP bars on the development of flexural strength
- Assessment of surface hardness and impact strength of denture base resins reinforced with silver–titanium dioxide and silver–zirconium dioxide nanoparticles: In vitro study
- A data augmentation approach to enhance breast cancer detection using generative adversarial and artificial neural networks
- Modification of the 5D Lorenz chaotic map with fuzzy numbers for video encryption in cloud computing
- Special Issue: 51st KKBN - Part I
- Evaluation of static bending caused damage of glass-fiber composite structure using terahertz inspection