Numerical and experimental study of the impact on aerodynamic characteristics of the NACA0012 airfoil
-
 und
und

Abstract
Using computational models and low-speed wind tunnel tests, the aerodynamic characteristics of the NACA 0012 airfoil with low Re numbers of (8 ×
Symbols and acronyms
- Symbols
-
Description (SI Unit)
- L
-
lift force (N)
- D
-
drag force (N)
-
-
lift coefficient (–)
-
-
drag coefficient (–)
-
-
pressure coefficient (–)
- Re
-
Reynolds number (–)
- P
-
gage pressure (N/
-
-
lift-to-drag ratio (Airfoil’s performance coefficient)
- C
-
chord length of an airfoil (
-
-
height of colored water in manometer (
-
-
velocity compounds in the direction (x) (
-
-
velocity compounds in the direction (y ((
-
-
velocity compounds in the direction (z) (m/s)
-
-
external force acting on the fluid (N)
-
-
del operator (–)
- A
-
wing surface area (
-
-
free stream velocity (
-
-
velocity vector (
-
-
pressure difference (N/
Greek symbols
- Symbols
-
Description (SI Unit)
-
-
density of water and air (
- ω
-
turbulence energy dissipation frequency (
-
-
kinematic viscosity (kg/m s)
Abbreviation
- Symbols
-
Description (SI Unit)
- AOA, α
-
angle of attack (°)
- NACA
-
National Advisory Committee for Aeronautics (–)
- SST
-
shear stress transport (–)
- CFD
-
computational fluid dynamics (–)
1 Introduction
Aerodynamics is the branch of aeronautical mechanics concerned with the study of the forces exerted by air and other gases affecting object motion. In military and civil fields, structures and equipment such as gliders, wind turbines, small aerial vehicles, and unmanned aerial vehicles are subject to low Reynolds (Re) numbers. In aerodynamics, an airfoil is a cross-sectional structure with a rounded leading edge and a curved surface tapering in the flow direction. The airfoil generates a lifting force at an angle perpendicular to the fluid flow and a drag force along the fluid flow direction. These dynamic properties are important in flight and power generation; hence, the airfoil gains vital scientific importance in fluid dynamics. Examples of airfoils are cross-sections of wings, fan blades, windmill blades, compressors, turbine blades in jet engines, water cylinders, aircraft vertical stabilizers, submarine fins, rotary wings, and certain fixed wings. Thin and streamlined airfoils, owing to their low lift and drag, are generally preferred in high-velocity aircraft, while thick airfoils with high lift and drag are often used in aircraft for carrying heavy weights. Airfoils can be divided into symmetrical and asymmetrical types in terms of their surface shape. Symmetrical airfoils have an upper surface and a lower surface of similar camber, whereas asymmetric airfoils have an upper surface that differs from the lower surface. Lift and drag have been widely studied to obtain accurate results for various engineering applications.
Sadikin et al. [1] numerically studied the dynamic properties of a symmetric NACA0012 airfoil at angles of attack (AOAs) ranging between −10° and 15° and Re of 3 ×
Shabur et al. [2] numerically examined the turbulent kinetic energy (TKE) distribution of a symmetrical NACA0012 airfoil with a chord length of 1 m using different AOAs and Re numbers and compared the specimen with another symmetrical but thicker NACA0018 airfoil. They found a linear relationship between TKE distribution and AOA, indicating that higher speeds result in increased disturbance. The NACA 0018 airfoil was observed to generate more turbulence compared to the NACA 0012 airfoil due to increased friction with air particles resulting from its thicker design. In aircraft applications, minimizing turbulence is crucial, leading to the recommendation of using the NACA 0012 winglet. Conversely, the NACA 0018 winglet is recommended for wind turbines, where turbulence is not a significant concern.
Martínez-Aranda et al. [3] experimented on a closed wind tunnel device to examine the effect of AOA and Re numbers (3.33 ×
Singh [4] experimentally studied an open-circuit wind tunnel device with a symmetric NACA0012 airfoil composed of acrylic materials and 29 ports. The parameters included AOAs from −14° to +15° increased in 2° increments and air velocities of 6.94, 7.76, 8.5, and 9.82 m/s. The pressure outlets were connected to a pressure gauge that contained gasoline liquid whose density is less than that of water. As air was passed through the test chamber, the pressure on the airfoil surfaces varied, which led to different pressure gauge readings. The values were positive for the airfoil’s lower surface but negative for the upper surface, and the generated lifting force increased linearly with increasing AOA until the stall angle of 12° was reached. Furthermore, the lift coefficient presented inverse and direct relationships with increasing Re values at negative and positive AOA values, respectively.
Koshy and Jacob [5] numerically studied a symmetric NACA0012 airfoil and compared its pressure and velocity distributions and flow characteristics to those of an asymmetric NACA 2424 airfoil by varying the AOAs at 0°, 6°, and 9° with the Re number set to 3 ×
Raval et al. [6] numerically analyzed the flow characteristics of a symmetric NACA0012 airfoil with a chord length of 1 m and selected V = 51.45 m/s and AOAs ranging between 10° and 22° for the k-ε turbulence model. They concluded that as the AOA increases, the lift coefficient shows a linear increase until it reaches its maximum value at an angle of approximately 18.4°, which is known as the stall angle. Beyond the stall angle, the lift coefficient rapidly decreases. Additionally, it was observed that as the AOA increases, the drag coefficient gradually increases until reaching the stall angle, after which it increases even more rapidly. This behavior is attributed to the adverse pressure gradient that continuously increases, ultimately leading to flow separation and a loss of lift.
Kumar [7] investigated the flow behavior of a symmetric NACA0012 airfoil with a chord length of 1 m using a k–ω SST turbulence model set to an air velocity of 30 m/s and AOAs of 0°, 3°, 5°, 8°, 11°, 13°, 16°, and 18°. At an AOA of 0°, the pressure and velocity distribution around the airfoil were similar, resulting in no lift generation. As the AOA increased, both the lift and drag coefficients gradually increased until reaching the stall angle of 16°, which represents the optimal performance of the airfoil. However, further increasing the AOA caused the separation of the hydrodynamic boundary layer, creating a turbulence zone filled with vortices. This turbulence negatively impacted the performance of the airfoil, leading to decreased efficiency and potential suspension of its operation.
Mallela et al. [8] numerically analyzed the flow behavior of the NACA0012 airfoil in terms of lift, drag, and pressure and velocity distributions. The Mach number of the k–ω SST turbulence model was 0.44, and the AOAs varied from −6° to 10° in 2° increments. It was observed that at negative AOAs, the pressure increases and the velocity decreases on the upper surface of the airfoil. Conversely, at positive AOAs, the pressure decreases and the velocity increases on the upper surface of the airfoil. It was concluded that the lift coefficient initially has negative values for negative AOAs, but these values increase and become positive as the AOA increases. The lift coefficient reaches its optimal value at an angle of 10°. On the other hand, the drag coefficient decreases at negative AOAs but gradually increases as the AOA becomes positive.
Paper and Muramatsu [9] experimentally studied the effect of AOAs varying from 0° to 15° on the pressure distribution and bubble separation behavior of the NACA0012 airfoil at low Re numbers ranging from 1 ×
Kabir et al. [10] numerically studied the aerodynamic properties of a symmetric NACA0012 airfoil. The k–ω and turbulence models used parameters such as Mach number and AOAs ranging between −15° and 15° in 5° increments. The increasing AOA caused a pressure difference above and below the airfoil’s surface, and a vortex was observed at the trailing edge of the airfoil. Additionally, the drag coefficient decreased before the AOA reached 0°, but it gradually increased with increasing AOAs.
Shahariar [11] numerically studied and compared the flow behaviors of two symmetric airfoils, namely, NACA0012 and asymmetric NACA4412, with the same chord lengths of 1 m. In the k–ε turbulence model, the AOAs were varied from 0° to 25° in 5° increments at Re = 3 ×
Sahoo and Maity [12] numerically analyzed three airfoils with the same chord lengths of 1 m: one of them was symmetrical (NACA0012), whereas the other two were asymmetrical (NACA4412 and S809). Six turbulence models were used, the AOAs varied between 0° and 20°, and the air velocity was set to 51 m/s. They concluded that the (k–ω SST) turbulence model provides results that closely match experimental data and is particularly effective in capturing shear transport. Additionally, it was observed that the NACA 4412 airfoil, with its thin profile and camber height, generates a higher lift coefficient compared to the NACA 0012 and S809 airfoils.
Jha et al. [13] numerically investigated a symmetric NACA0012 airfoil at Re numbers of 2.21 ×
Yousefi and Razeghi [14] examined the varying effects of Re numbers and AOAs on the turbulent laminar transitions of three symmetric airfoils, namely, NACA0012, NACA0015, and NACA0018. They found that the location of laminar–turbulent transition on an airfoil is significantly influenced by the Reynolds number. As the Reynolds number decreases, the transition point moves closer to the downstream region of the airfoil. For the NACA 0012, 0015, and 0018 airfoils, the lower critical Reynolds numbers for flow were determined to be 1 ×
Eftekhari and Al-Obaidi [15] studied the effect of AOAs (0° and 90°) on the aerodynamic properties of an airfoil at low Re numbers (1 ×
The aerodynamics of airfoil surfaces, particularly the NACA0012 airfoil, have been the subject of numerous earlier investigations and studies. However, other important factors have not been fully examined, including pressure distribution, low Re numbers, and AOA. Many studies concentrated on examining the effects of certain factors, including low Reynolds number or AOA. These previously unconsidered factors are now given importance in the current study, which covers a wider range of low Re numbers (8 ×
2 Experimental study
Laboratory wind tunnels are frequently used for experimental investigations on aerodynamic qualities. Laboratory wind tunnels offer an efficient and practical alternative to airborne laboratory wind tunnel equipment that is limited in accessibility while producing reliable data. There are two different types of wind tunnels that are described: closed wind tunnels, where air circulates inside the tunnel, and open-circuit wind tunnels, where air enters and leaves the tunnel from the atmosphere.
The experimental study focuses on investigating the low-speed aerodynamic properties of a NACA0012 airfoil at Re numbers of 8 ×

Subsonic wind tunnel AF100.
2.1 Stages of the experimental work
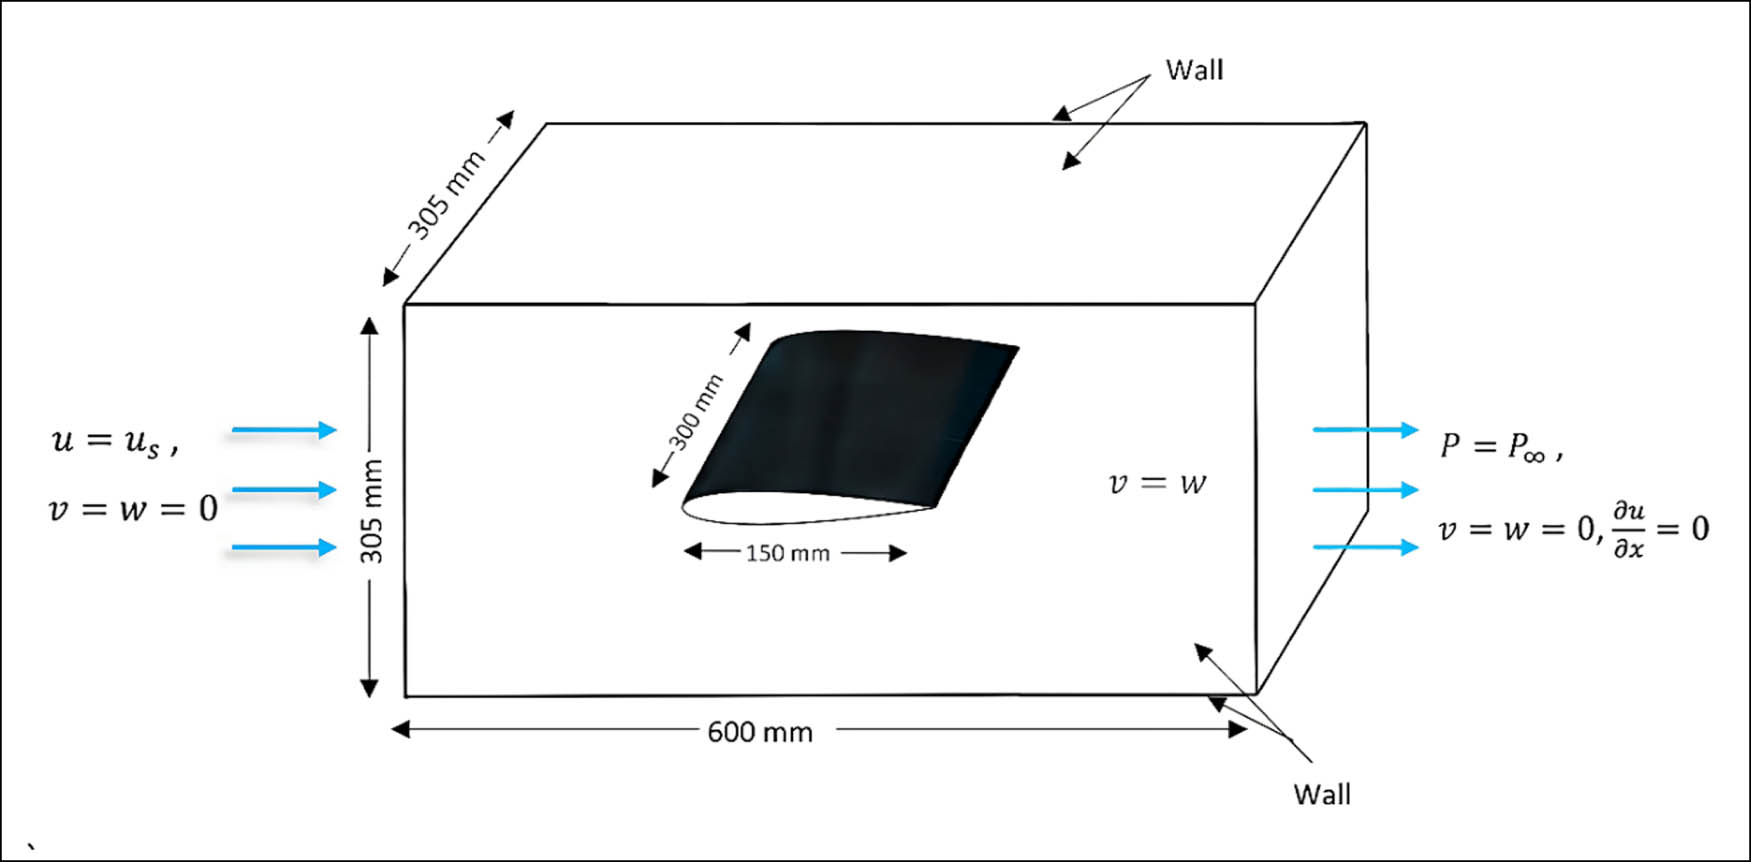
As shown in Figure 1, a separate control and instrumentation unit control the wind tunnel apparatus. The dynamic conical form of the structure causes the air to flow and accelerate linearly as it enters via the effuser. The air then goes to the work section, a square area with dimensions of 305, 305, 600 mm and was constructed of acrylic material. The sides of the work section are moveable, while the upper and lower portions are fixed. Pitot tubes attached to two manometers, which are used to detect static pressure, can be inserted through two holes in the upper portion. A special holder for installing the airfoil is located on one side, and a special holder for connecting the other portion of the airfoil to a device that measures angles so that the aileron angle may be adjusted is located on the other side. The air then travels via a grid to the axial fan (the grid safeguards the fan from harm), then it travels through the silencer unit before reaching the atmosphere.
The pressure display unit, which has 32 pressure ports, displays the pressure results for each point of the airfoil. A single-component lift and drag balance unit determines the lift and drag forces for each angle. Bernoulli’s equation (1) is used to compute the changing air velocity, which is tracked by a separate control and instrumentation unit, while equation (2) is used to determine the Re numbers [6]:
A symmetrical NACA0012 airfoil was used as the study’s model. The airfoil was 300 mm wide and 150 mm in chord. Twenty pressure tappings were installed along its chord as part of its equipment. The tiny diameter tubes that protruded from the airfoil’s end were attached to these tappings. The tubes might connect to a bigger diameter pipe by being further attached to labeled flexible pipes using adaptors. By adjusting the opposite end of the airfoil, the AOA of the airfoil may be changed.
3 Numerical study
The ANSYS FLUENT 2021 R2 software package was used for airfoil engineering and construction. Flux simulations were performed at Re = 8 ×
ω is also referred to as the turbulence measure, which is suitable for modeling thick boundary layers for flows with low Re numbers. The k–ω SST turbulence model is one of the most widely used models for determining the effect of turbulent flow conditions, and it is best used for near-wall processing. The k–ω SST turbulence model can also predict excessive and early separation, has a better convergence rate and behavior than other turbulence models for opposite pressure gradients, and requires low-memory computation.
For the four digits of the NACA0012 non-cambered airfoil, 00 indicates the non-cambered symmetric biplane airfoil and 12 indicates the airfoil thickness of 12% chord length.
3.1 Mathematical model
The first stage of the numerical study was the mathematical model, which included integral equations and boundary conditions. The 3D continuity equation and momentum equations are given by [16]:
Momentum equations:
In order to compare the results with the experimental test inside the wind tunnel, the same dimensions of the test tunnel and the available wing model in the laboratory were used. Table 1 shows the input parameters of the airfoil. For the modeling, the symmetric airfoil data of NACA0012 were imported from the website [17] into the ANSYS FLUENT platform. Figure 2 shows the boundary conditions. The boundary conditions are defined as follows:
Inlet section: the velocity of the inflow is set at 8.08, 20.21, 30.31, and 40.42 m/s.
Outlet section is the outlet pressure (P = 0).
The no slip wall condition is selected.
Input parameters for the NACA0012 airfoil
| Chord | 150 mm |
| Span | 300 mm |
| Area | 0.045 m2 |
Schematic diagram of the NACA0012 airfoil.
3.2 Mesh configuration
The mesh was built using the ANSYS FLUENT platform to simulate the NACA0012 airfoil. Figure 3 shows the construction and intensification of the mesh around the airfoil, allowing for the visualization of the flow separation while obtaining the most accurate results (Table 2).
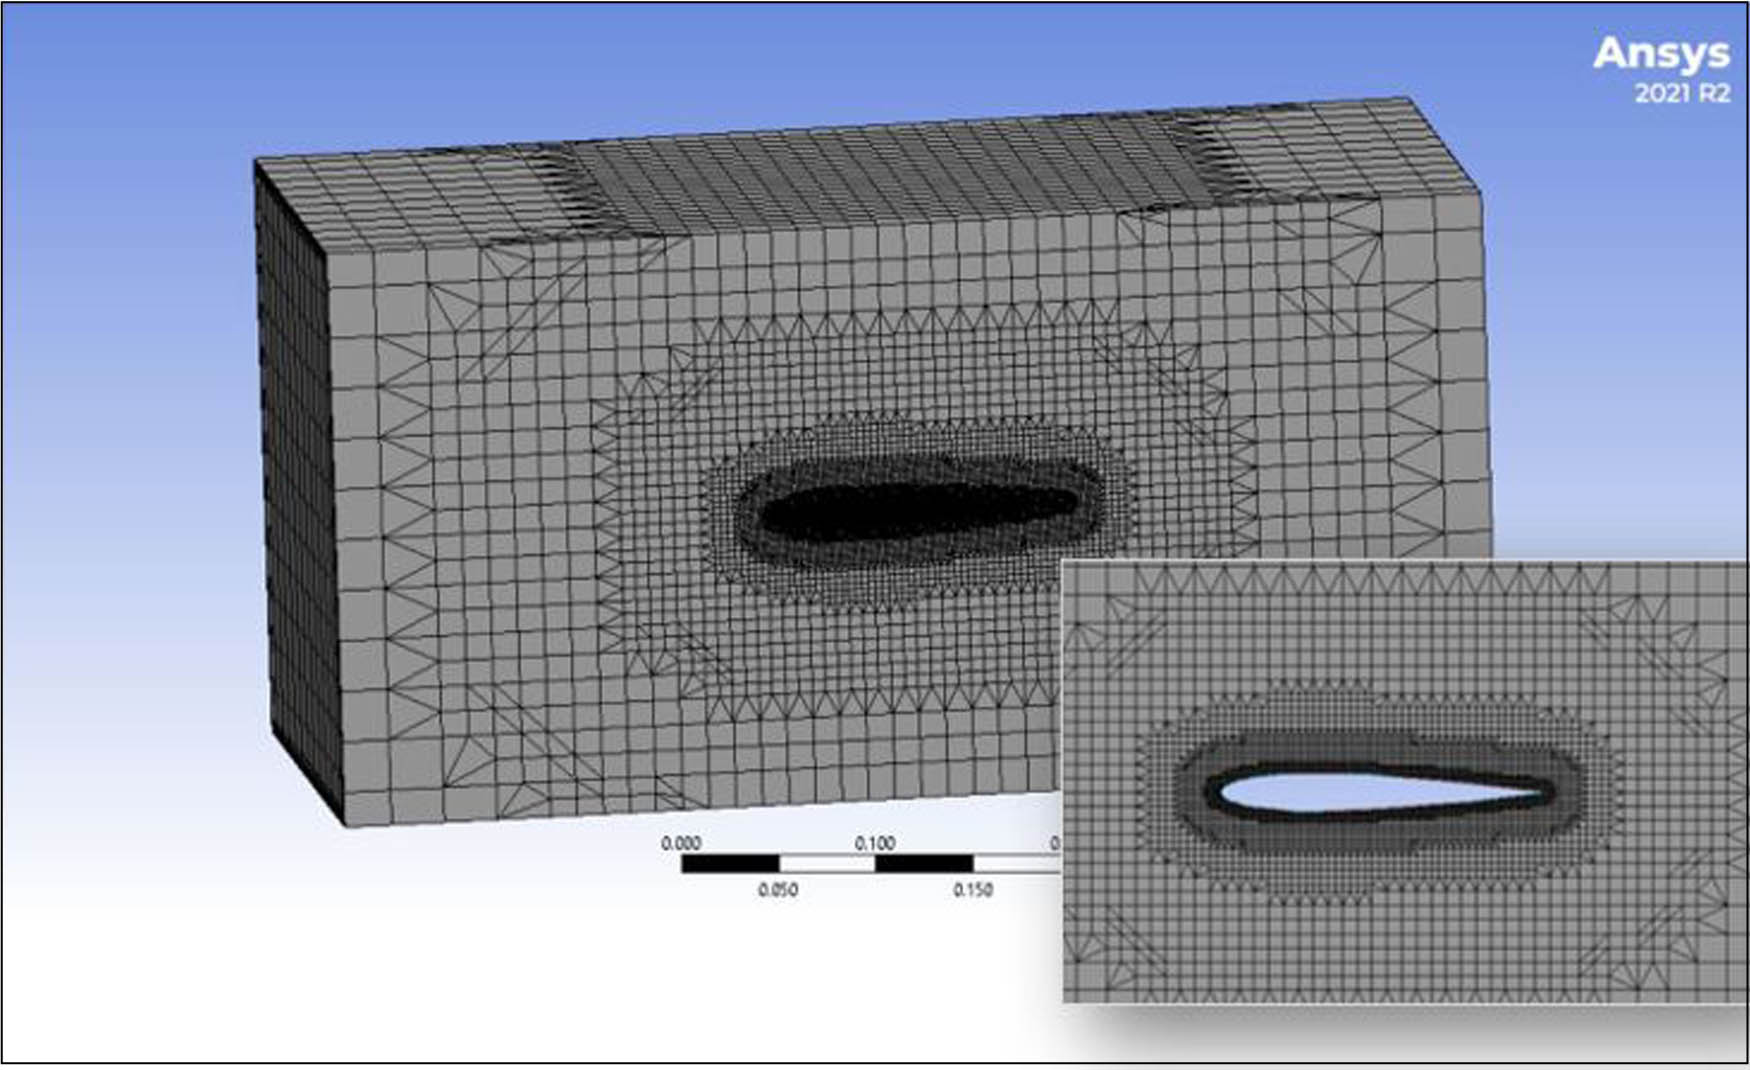
Mesh for the NACA0012 airfoil and the airfoil domain.
Mesh input parameters
| No. of nodes | 2,802,362 |
| No. of mesh elements | 2,675,103 |
| Maximum aspect ratio | 2.798 |
| Minimum orthogonal quality | 0.9533 |
3.3 Setting up FLUENT
The geometry and mesh data were imported into the ANSYS FLUENT platform for initialization and solver operations. Increasing the kinetic energy would affect the flow of low-viscosity fluids and form vortices of various sizes and thus can be regarded as unstable. Table 3 shows the simulation parameters. Here, “Coupled” was used as a method for pressure_velocity coupling, “Least squares cell based” was used for the spatial discretization section, and “First-order Upwind” and “Second-order upwind” were used to solve the momentum and obtain acceptable and good solutions for the turbulent dissipation rate and TKE. The program was initialized before calculation, and then, the calculation was run.
Input data for FLUENT simulation
| Viscous model | k-ω SST (two equations) |
| Operating temperature | 293 K |
| Operating pressure | 0.0 Pa |
| Density of fluid | 1.204
|
| Kinematic viscosity | 1.825 kg/m s |
| AOAs | 0°–18° steps by 2° |
4 Mesh independence
High-accuracy results of the numerical solution were obtained using several mesh elements, taking into account computer memory and time limitations. In general, large mesh elements require more computer memory and time. Here, the mesh size and its effect on the numerical simulation were verified by testing five mesh element sizes (1,034,566, 1,343,782, 2,246,431, 2,676,481, and 3,476,882) and subsequently obtaining the most accurate results within reasonable time and suitable computer memory. The mesh independence test was performed at Re = 8 ×
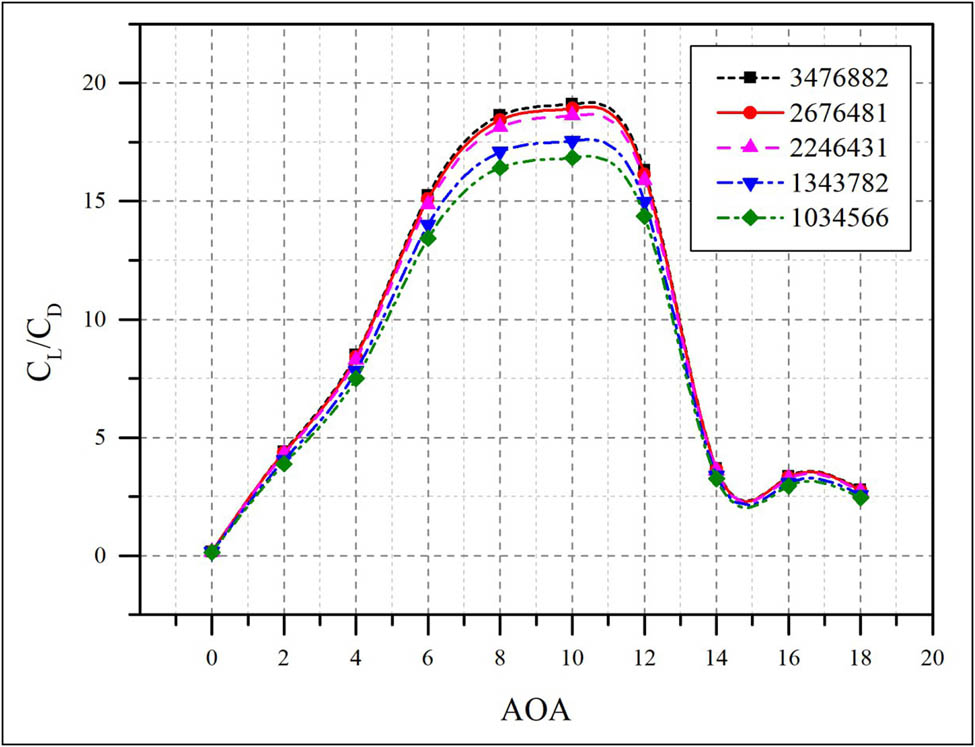
Mesh independence.
5 Validation
The numerical results of the published research of Patel and Thakor [7] were examined on the ANSYS FLUENT platform with the objective of ensuring the accuracy and reliability of the current research’s results. In particular, the test was conducted by comparing the results of the lift and drag coefficients on the symmetric NACA0012 airfoil with a chord length of 1 m at different AOAs (0°, 3°, 5°, 8°, 11°, 13°, 16°, and 18°) and u s = 30 m/s. The trends in Figures 5 and 6 indicate the high likelihood of adopting the code for the study. The results of the current research are highly compatible with those obtained by the previous work [7], indicating high reliability.
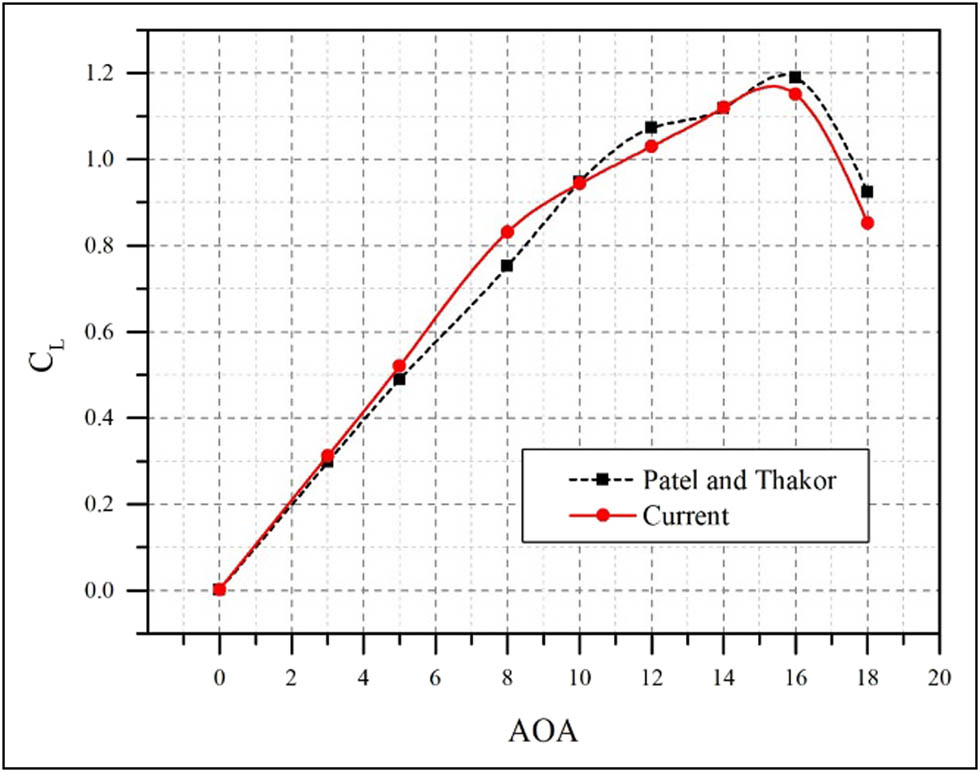
Effect of AOA on the lift coefficient at
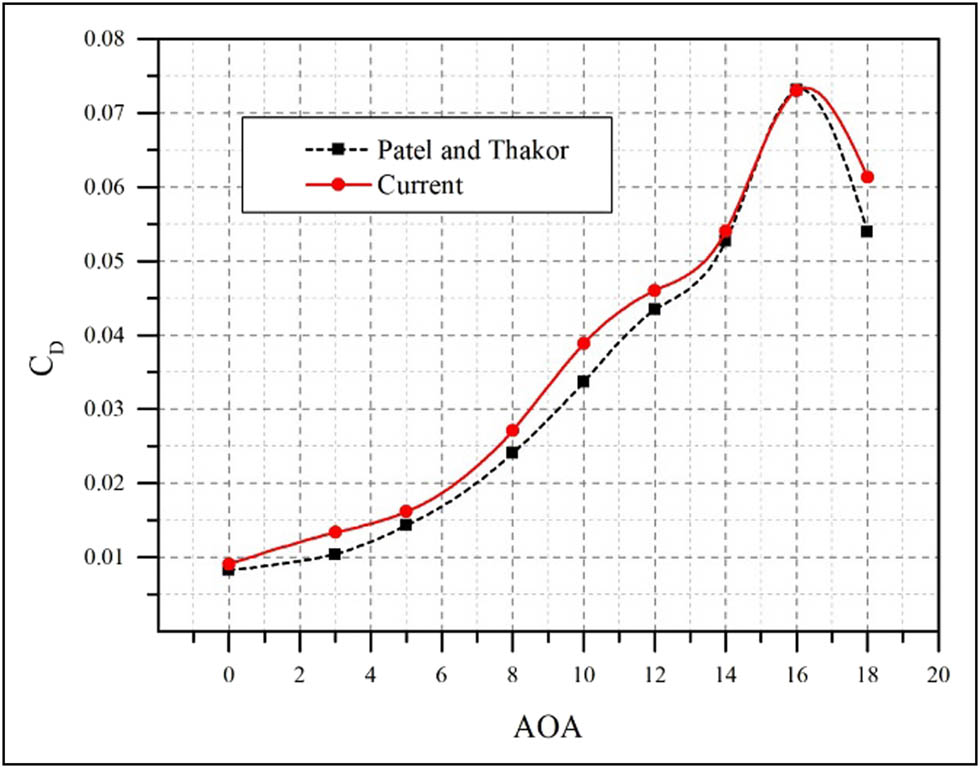
Effect of AOA on the drag coefficient at
6 Results and discussion
6.1 Effects of pressure, velocity, and TKE on the NACA0012 airfoil
The TKE behavior, pressure, and velocity distributions on the surfaces of the NACA0012 airfoil are affected by the changes in both AOAs and Re numbers. Figures 7–9 show the TKE behavior, pressure, and velocity distributions surrounding the upper and lower surfaces of the airfoil. At an AOA of 0°, the pressure and velocity are distributed similarly around the airfoil. When increasing AOA, the pressure increases more prominently at the lower surface than at the upper surface; this trend is inconsistent with the changing velocity distribution, which more prominently increases at the upper surface than at the lower surface. The finding is in line with Bernoulli’s principle, which states that fluid pressure rises as velocity decreases, and vice versa. The TKE starts to increase from the trailing edge until the stall angle is reached. However, further increasing the AOA causes the flow to separate and move toward the front edge of the airfoil, which can be explained by the changing pressure distribution. As the pressure increases at the upper surface and decreases at the lower surface, the velocity distribution changes (i.e., it increases at the lower surface and decreases at the upper surface), and the TKE increases along the upper surface of the airfoil. This situation results in the formation of vortices and the occurrence of chaos and turbulence, eventually causing airfoil failure; this phenomenon is called stalling. The pressure and velocity distributions and the TKE values are directly proportional to the increasing Re numbers.
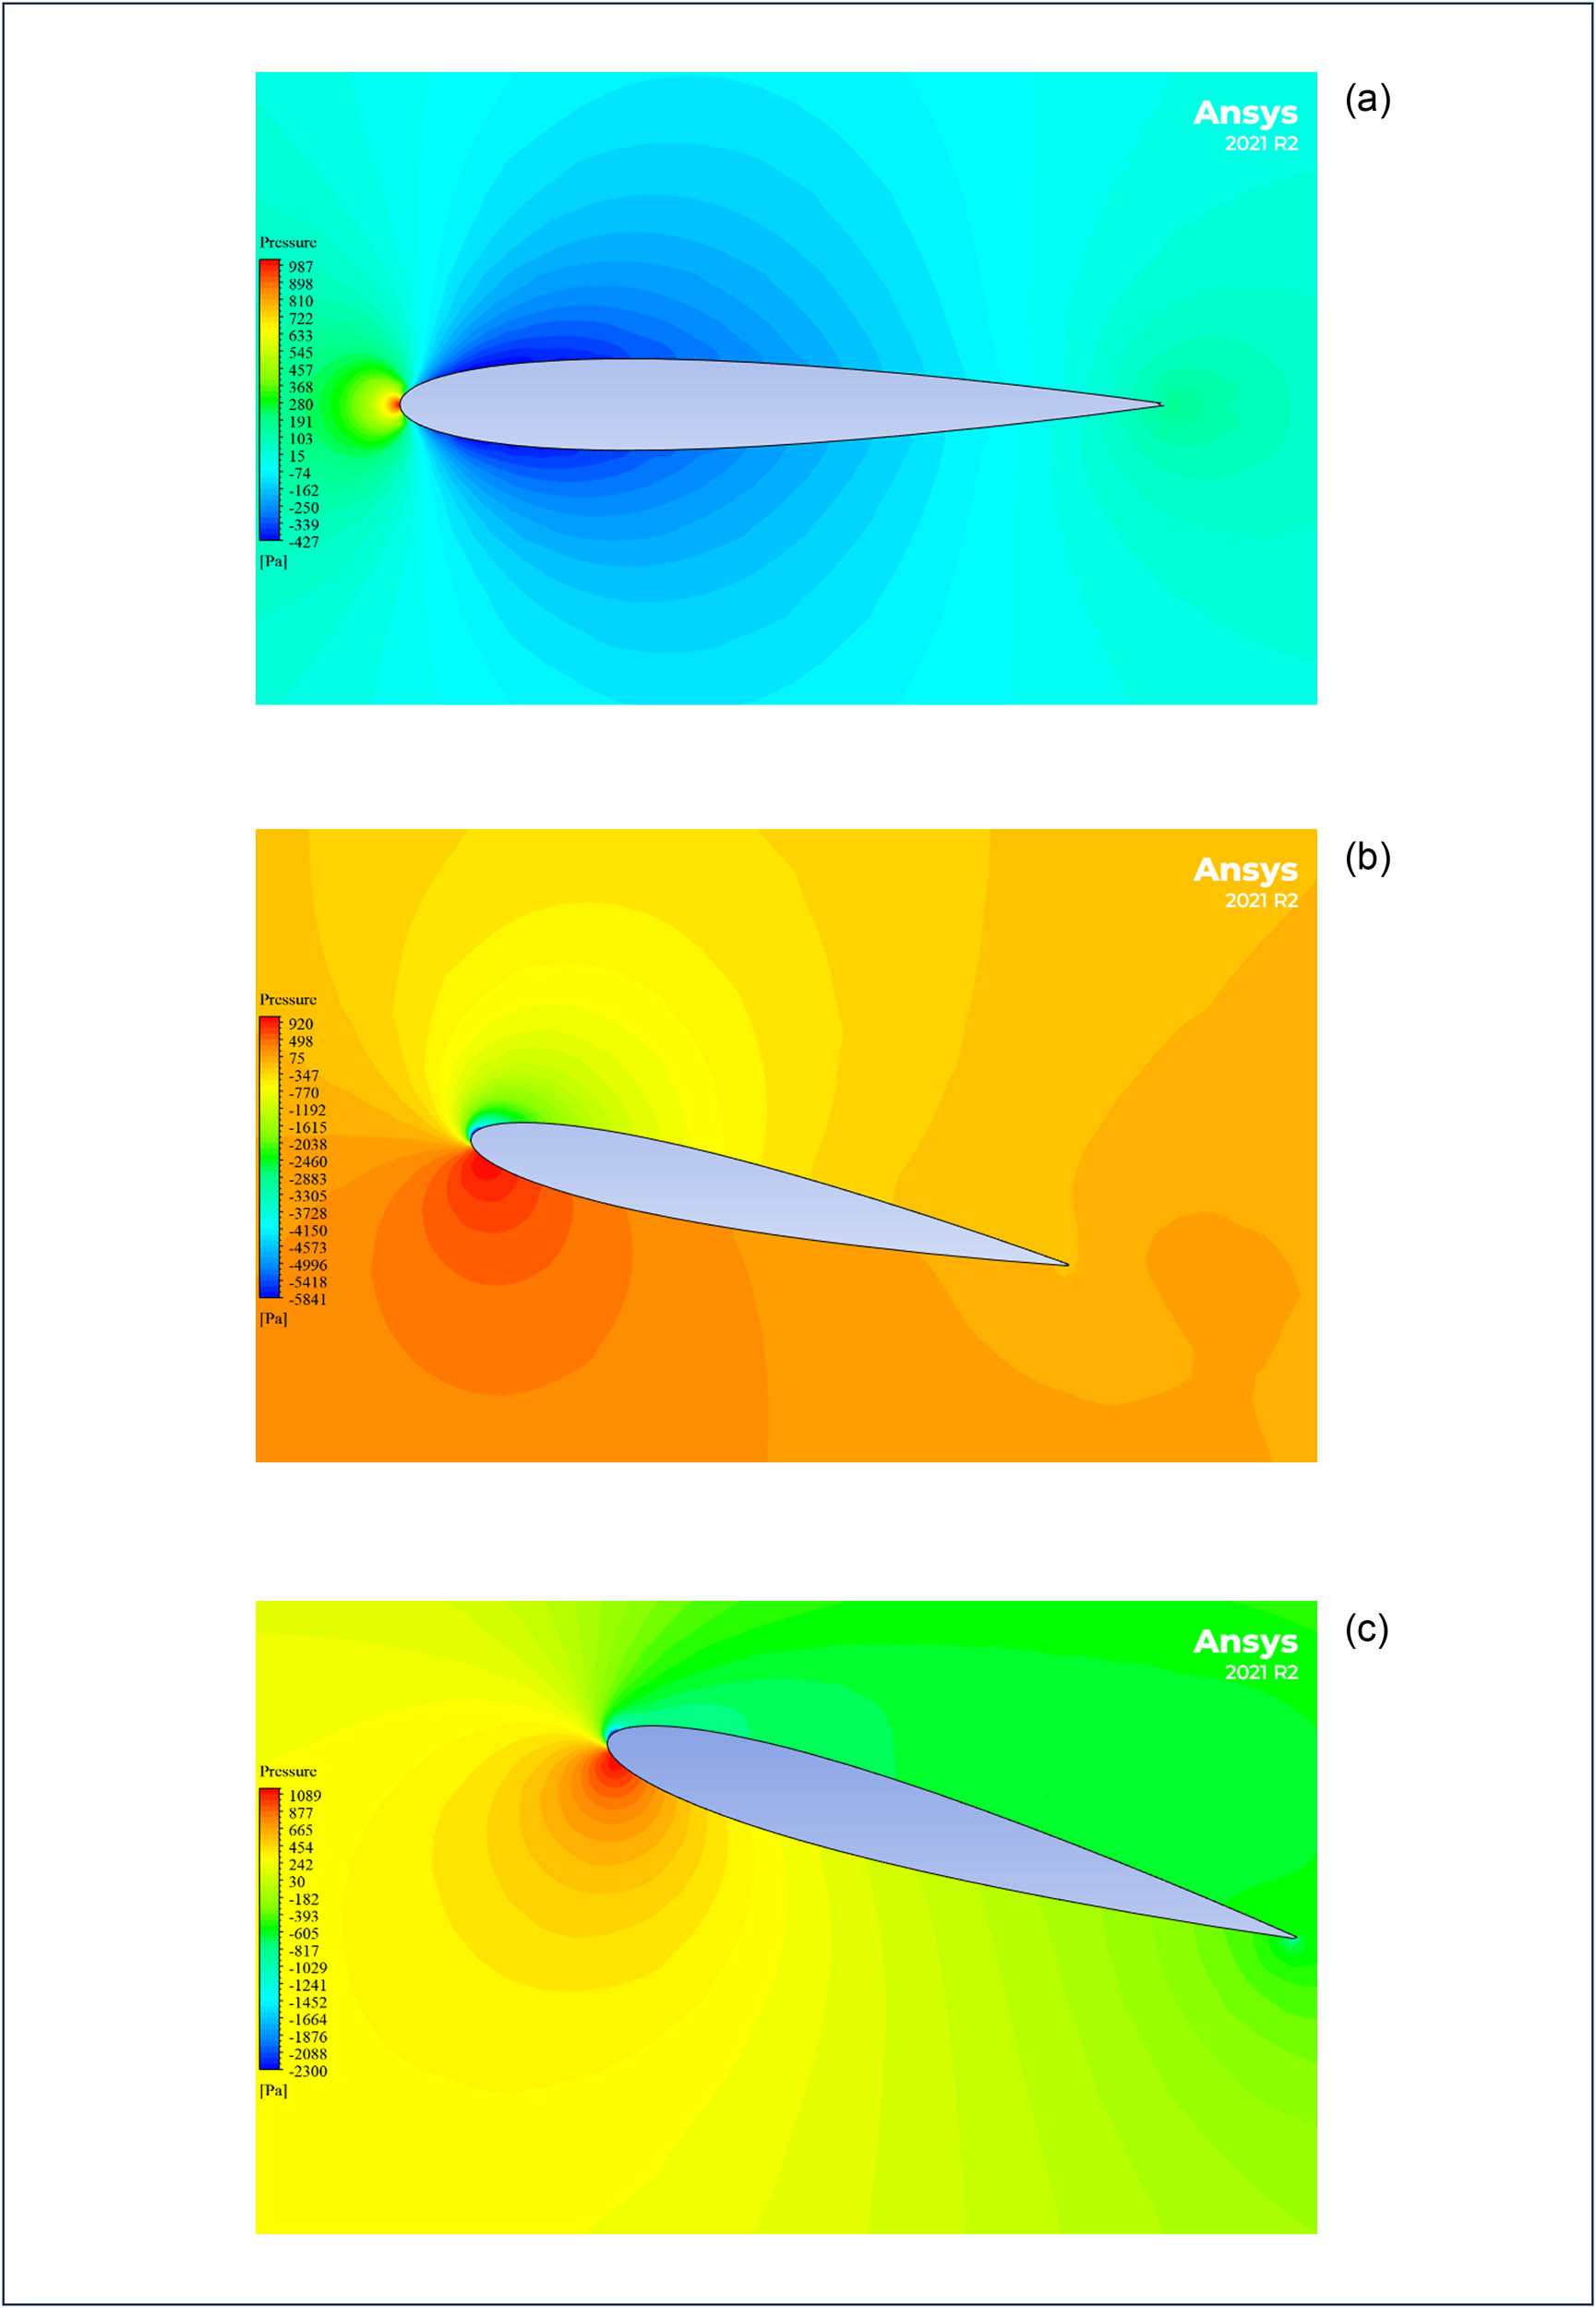
Pressure profiles of airfoil NACA0012 that Re = 4 ×
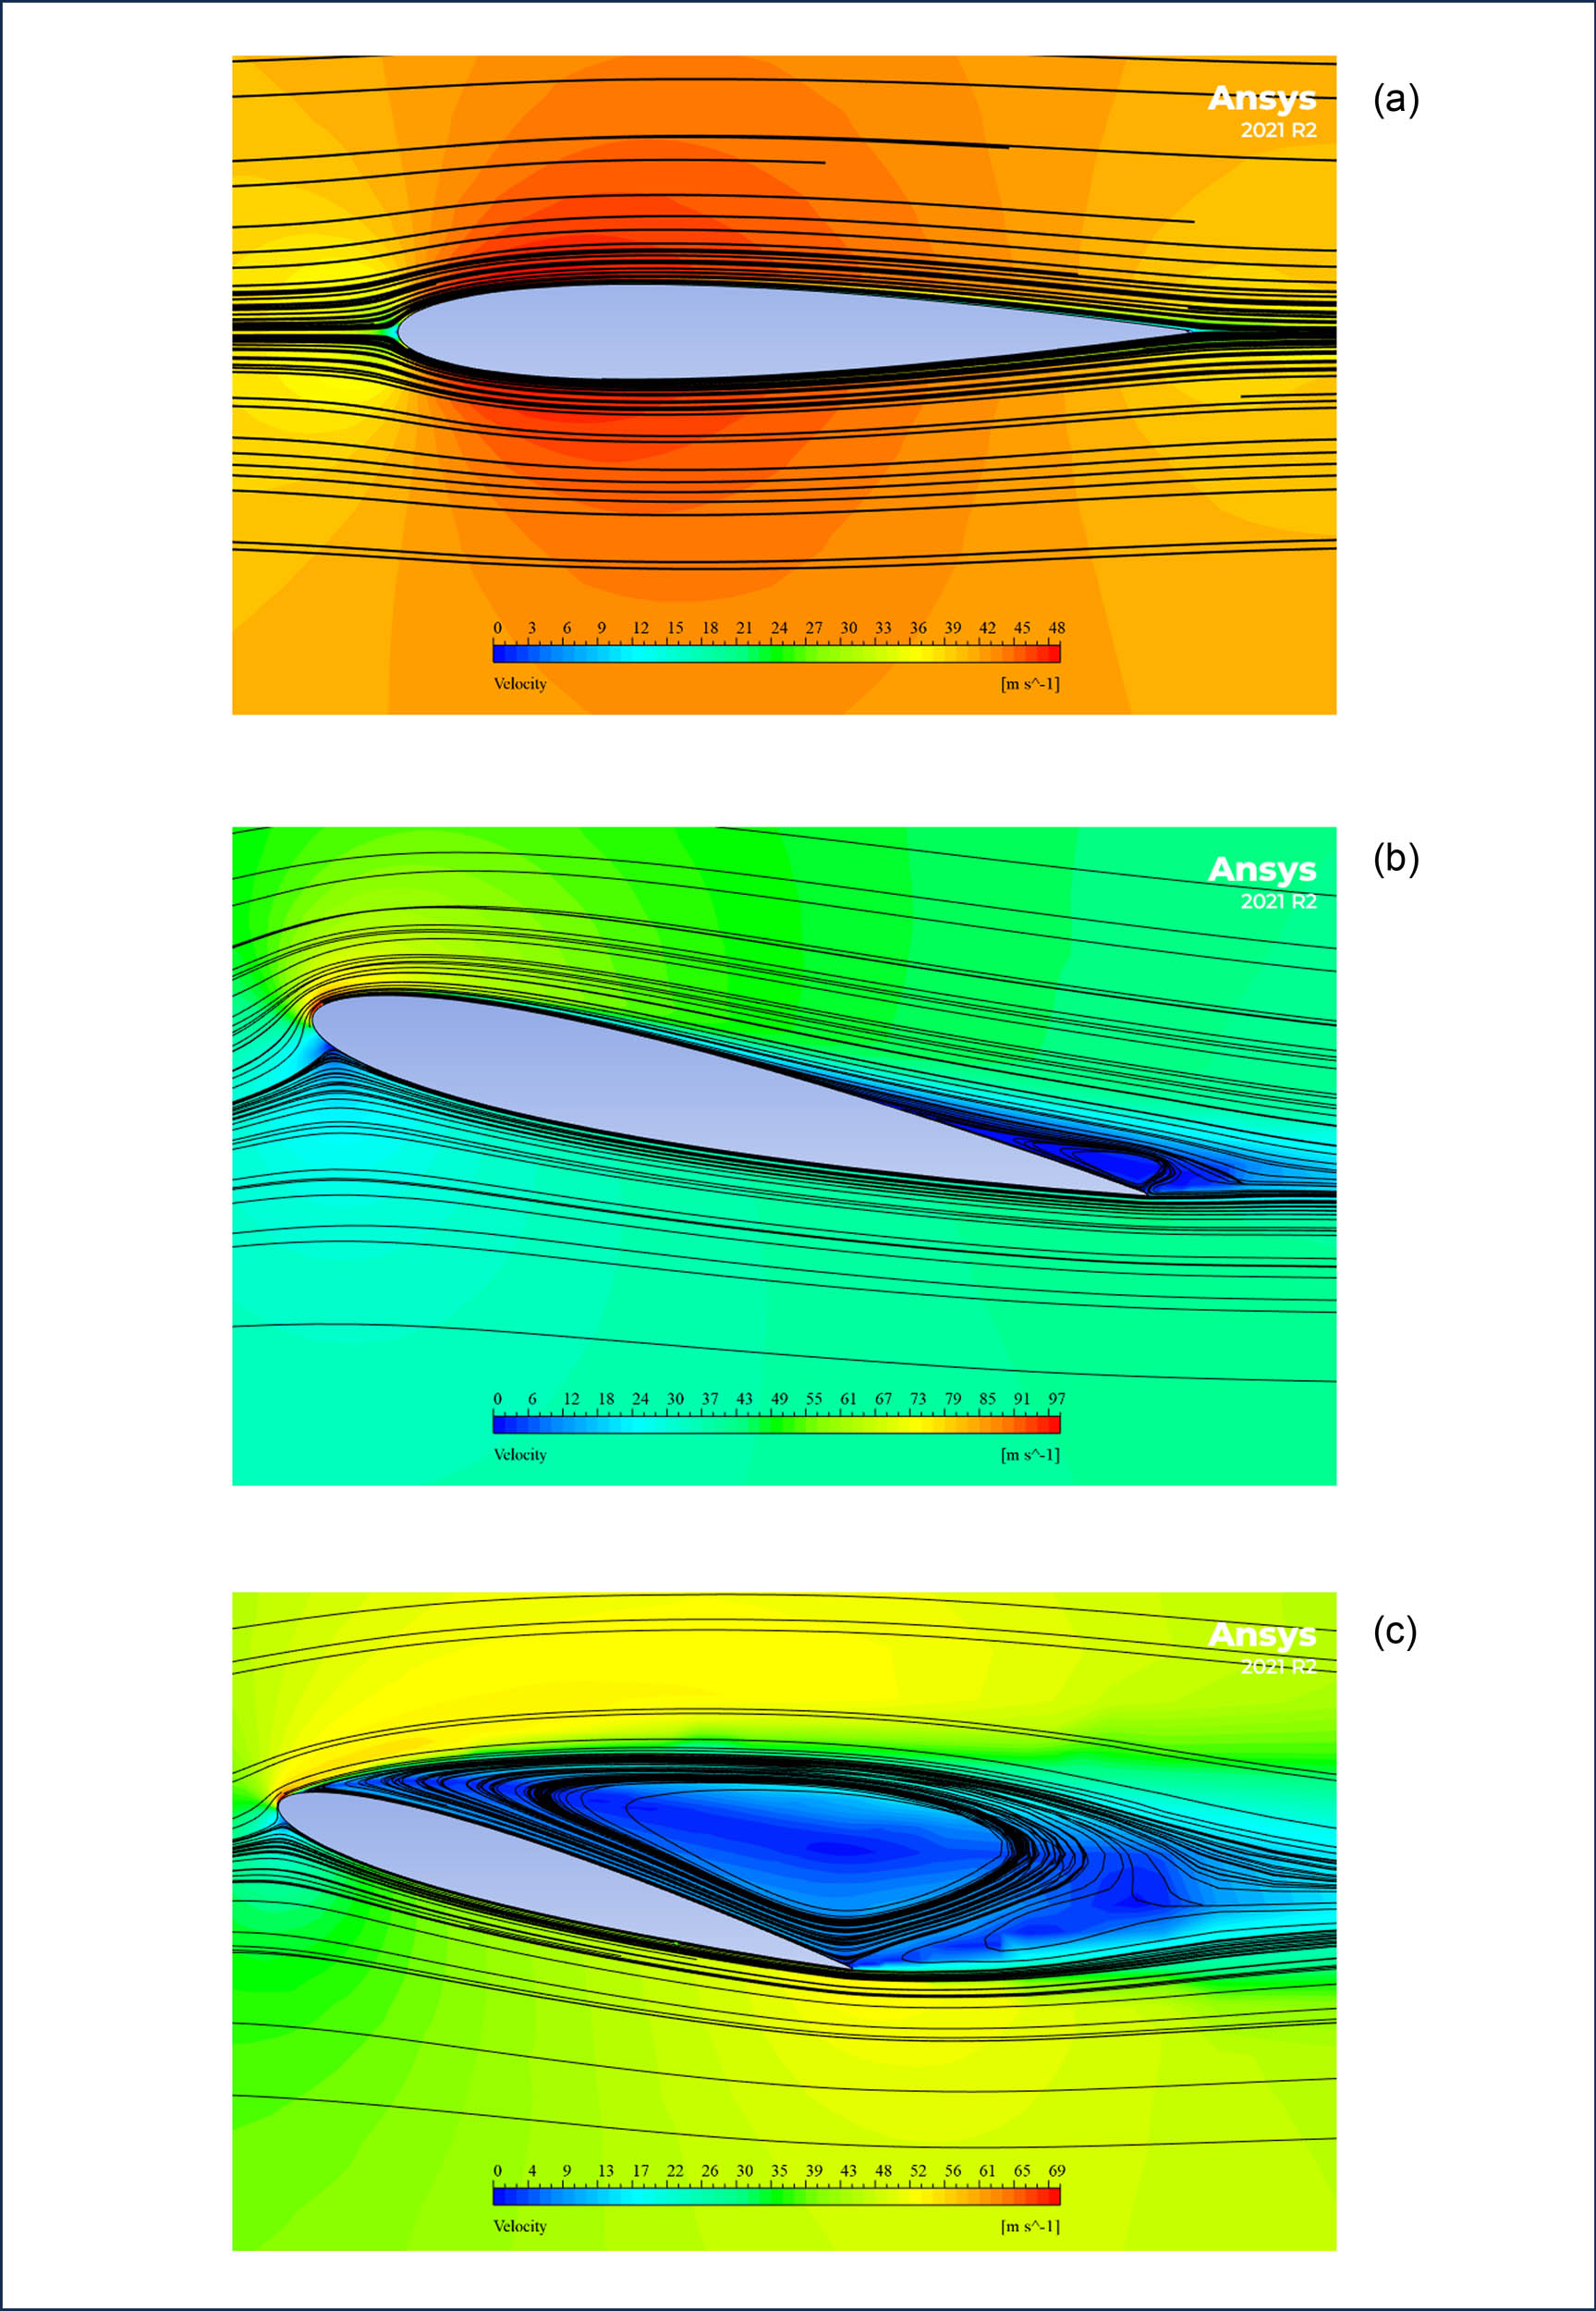
Velocity contours and streamlines of airfoil NACA0012 that Re = 4 ×
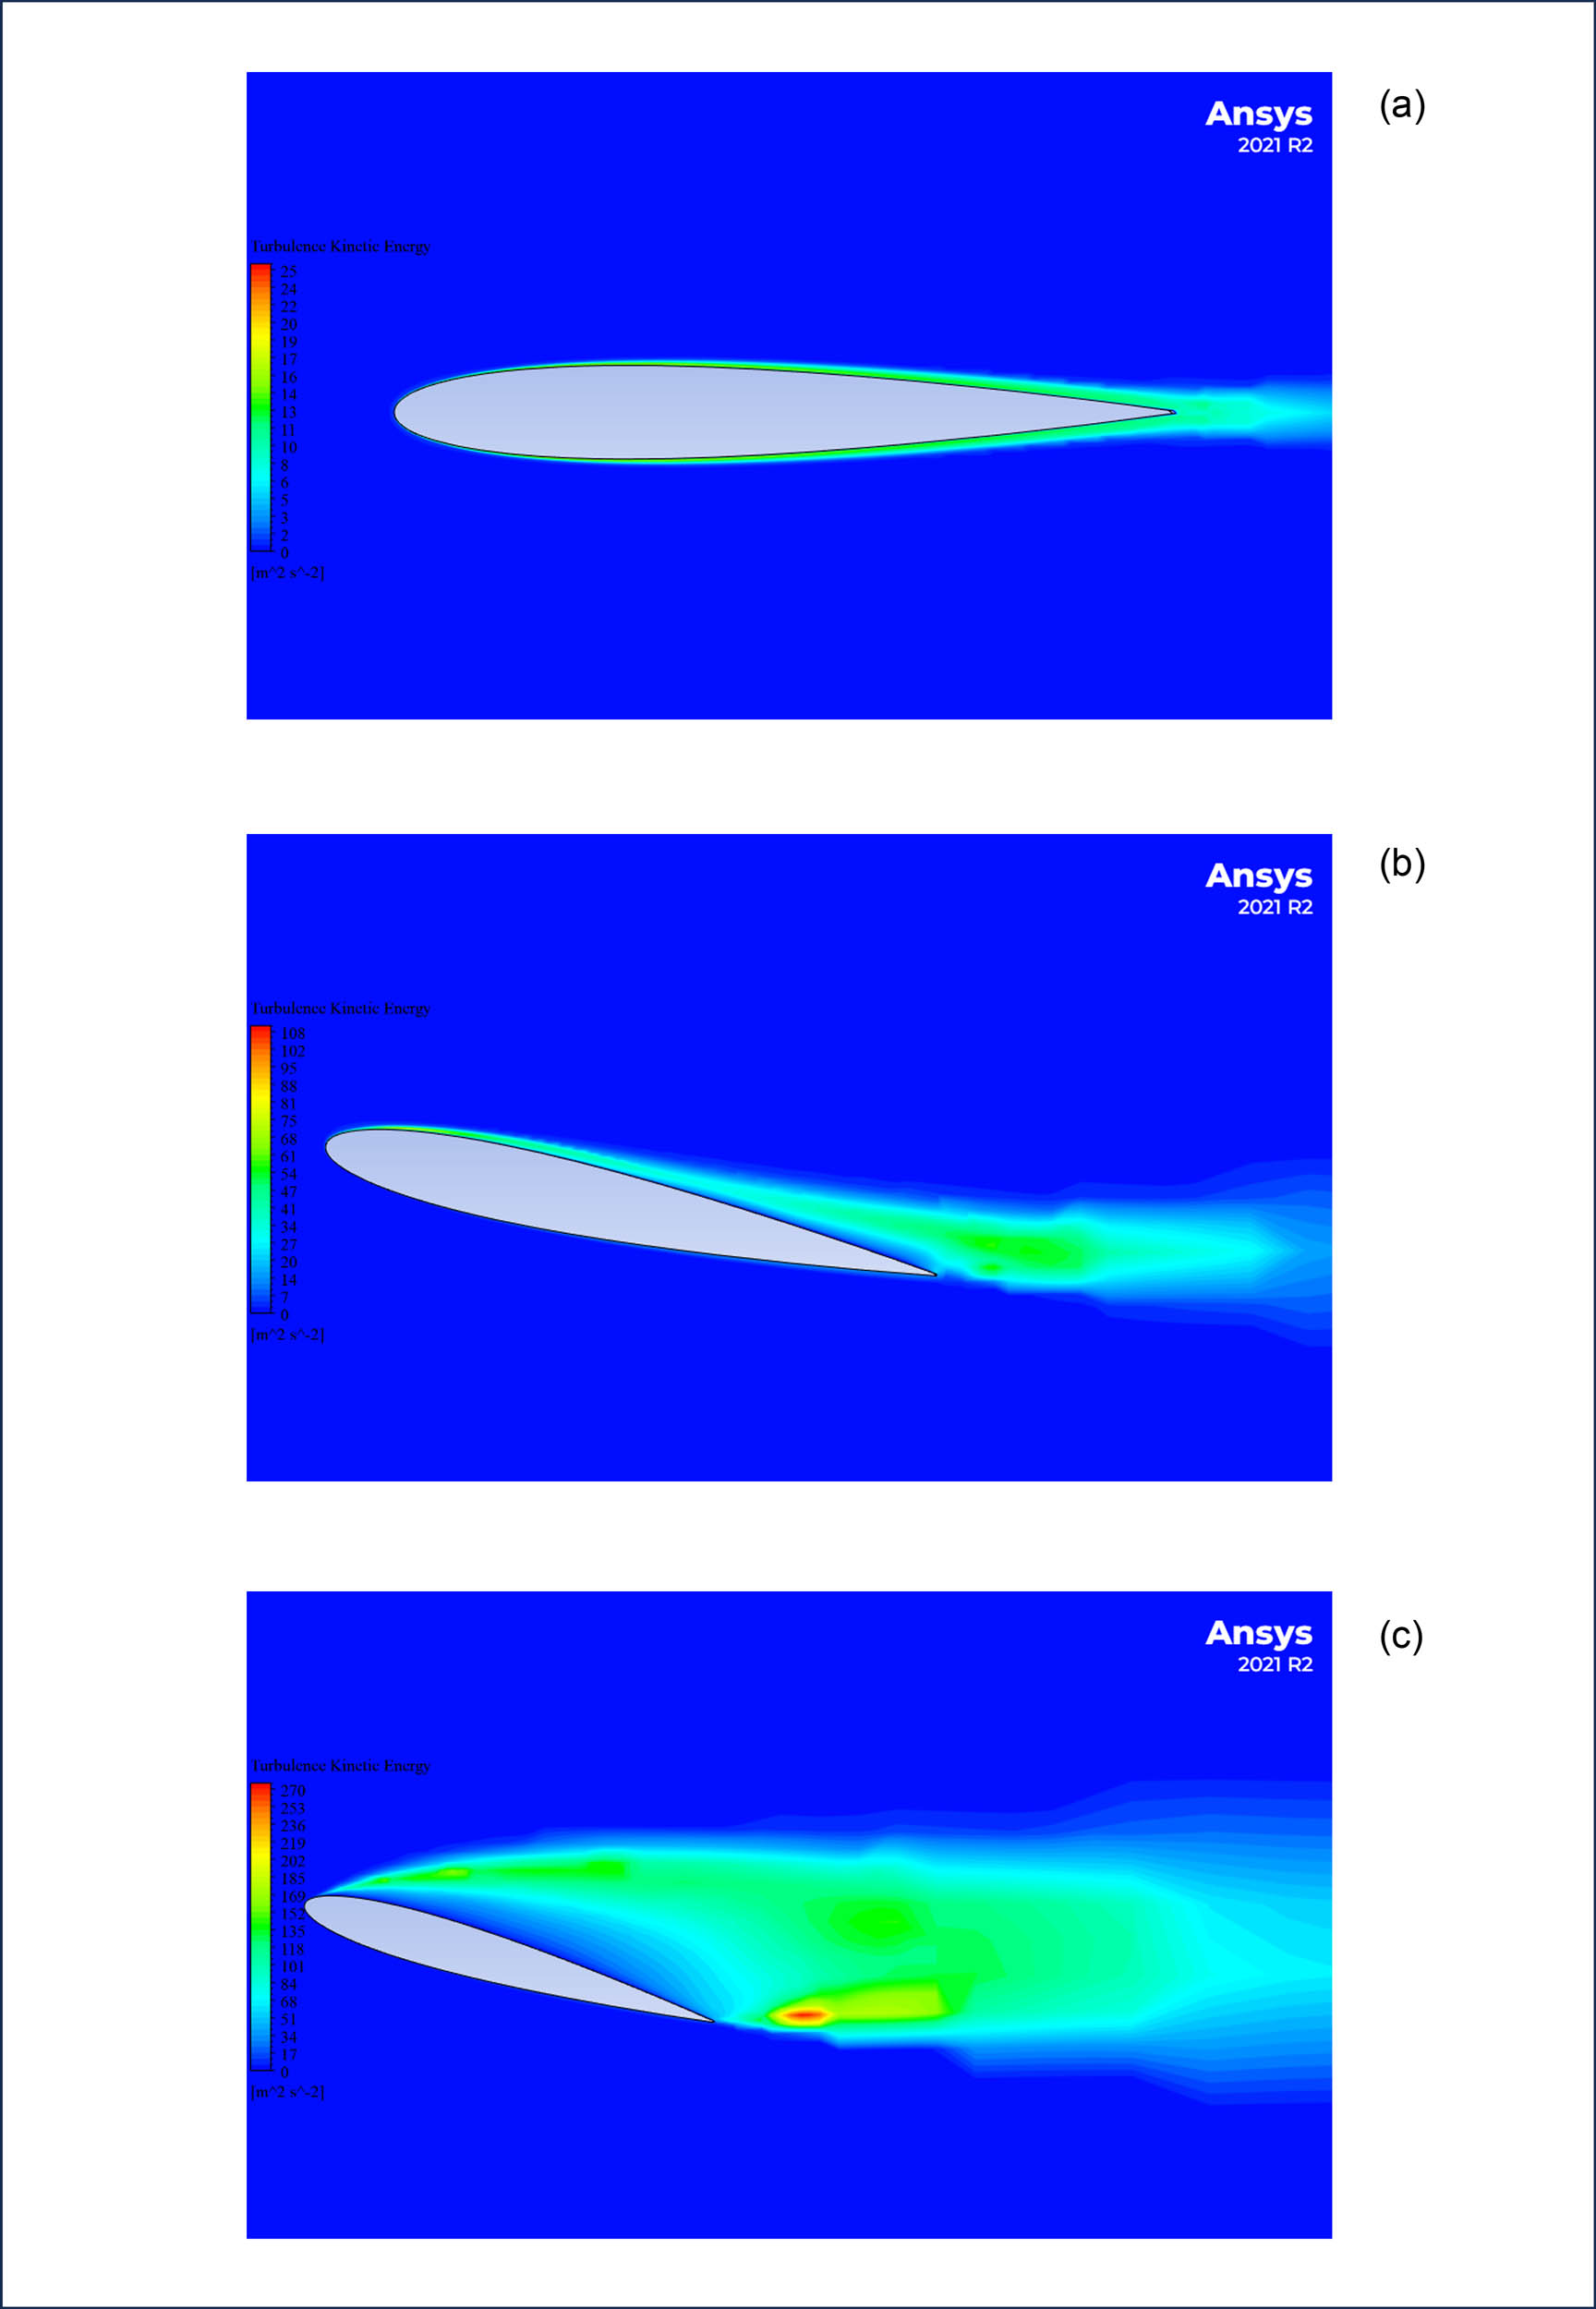
TKE contours of airfoil NACA0012 that Re = 4 ×
6.2 Effect of the AOA on C L and C D
The variations in AOA affect the rise and fall of the airfoil as well as its stopping state. Tables 4 and 5 show the numerical and experimental results for the Cl and Cd for AOAs ranging from 0° to 18°, with a 2° increase at various Re numbers. The NACA 0012 airfoil is surrounded on both of its surfaces by the same pressure and velocity distributions due to its non-cambered form, so the pressure difference is equal to zero. According to equation (7), which represents the calculation formula for the lift force with pressure differences, the airfoil does not produce lift at an AOA of 0°. With increasing AOA, the lift coefficient increases and is directly proportional to the AOA, as illustrated in Figure 10, while the drag coefficient gradually increases until the stall angle is reached (Figure 11). This finding can be explained by the difference in pressure and velocity distributions between the lower and upper surfaces. However, further increasing the AOA causes a sudden and rapid decrease of the lift coefficient, and the drag coefficient exhibits dramatic behavior. This finding can be explained by the formation of vortices that extend from the trailing edge to the leading edge of the airfoil, further increasing the turbulence intensity and causing complete flow separation. Then, the lift coefficient is decreased at high AOAs, whereas the drag coefficient is increased, finally causing airfoil failure:
The solution was validated by comparing the numerical results with the experimental results. Figures 12 and 13 show the behavior of
Numerical results for various AOAs at Reynolds number
| AOA | Re = 8 × 10⁴ | Re = 2 × 10⁵ | Re = 3 × 10⁵ | Re = 4 × 10⁵ | ||||||||
|---|---|---|---|---|---|---|---|---|---|---|---|---|
| C D | C L | C L/C D | C D | C L | C L/C D | C D | C L | C L/C D | C D | C L | C L/C D | |
| 0° | 0.024 | 0.004 | 0.162 | 0.020 | 0.010 | 0.503 | 0.018 | 0.014 | 0.775 | 0.017 | 0.013 | 0.792 |
| 2° | 0.025 | 0.108 | 4.363 | 0.020 | 0.118 | 5.871 | 0.018 | 0.123 | 6.674 | 0.017 | 0.131 | 7.882 |
| 4° | 0.025 | 0.212 | 8.422 | 0.021 | 0.227 | 11.054 | 0.018 | 0.232 | 12.600 | 0.017 | 0.236 | 13.735 |
| 6° | 0.028 | 0.425 | 15.097 | 0.023 | 0.458 | 19.921 | 0.021 | 0.470 | 22.670 | 0.019 | 0.476 | 24.558 |
| 8° | 0.033 | 0.603 | 18.438 | 0.026 | 0.640 | 24.271 | 0.024 | 0.655 | 27.491 | 0.022 | 0.666 | 29.847 |
| 10° | 0.041 | 0.783 | 18.929 | 0.033 | 0.840 | 25.458 | 0.030 | 0.873 | 29.043 | 0.028 | 0.891 | 31.552 |
| 12° | 0.056 | 0.896 | 16.143 | 0.043 | 0.979 | 22.899 | 0.039 | 1.019 | 26.327 | 0.036 | 1.040 | 28.697 |
| 14⁰ | 0.160 | 0.586 | 3.655 | 0.131 | 0.781 | 5.985 | 0.089 | 0.968 | 10.827 | 0.051 | 1.124 | 21.908 |
| 16° | 0.192 | 0.637 | 3.319 | 0.200 | 0.693 | 3.473 | 0.216 | 0.729 | 3.371 | 0.176 | 0.795 | 4.527 |
| 18° | 0.260 | 0.717 | 2.754 | 0.245 | 0.702 | 2.860 | 0.237 | 0.702 | 2.966 | 0.233 | 0.726 | 3.113 |
Experimental results for various AOAs at Reynolds number
| AOA | Re = 8 × 10⁴ | Re = 2 × 10⁵ | ||||
|---|---|---|---|---|---|---|
| C D | C L | C L/C D | C D | C L | C L/C D | |
| 0° | 0.023 | 0.004 | 0.512 | 0.019 | 0.010 | 0.161 |
| 2° | 0.024 | 0.105 | 6.045 | 0.019 | 0.116 | 4.401 |
| 4° | 0.024 | 0.199 | 11.070 | 0.020 | 0.216 | 8.220 |
| 6° | 0.027 | 0.417 | 20.851 | 0.021 | 0.445 | 15.514 |
| 8° | 0.031 | 0.590 | 25.556 | 0.025 | 0.627 | 19.086 |
| 10° | 0.037 | 0.735 | 26.829 | 0.030 | 0.799 | 19.869 |
| 12° | 0.050 | 0.882 | 24.142 | 0.040 | 0.965 | 17.605 |
| 14° | 0.135 | 0.543 | 6.514 | 0.113 | 0.735 | 4.016 |
| 16° | 0.188 | 0.593 | 3.868 | 0.167 | 0.645 | 3.150 |
| 18° | 0.230 | 0.644 | 2.972 | 0.221 | 0.657 | 2.800 |
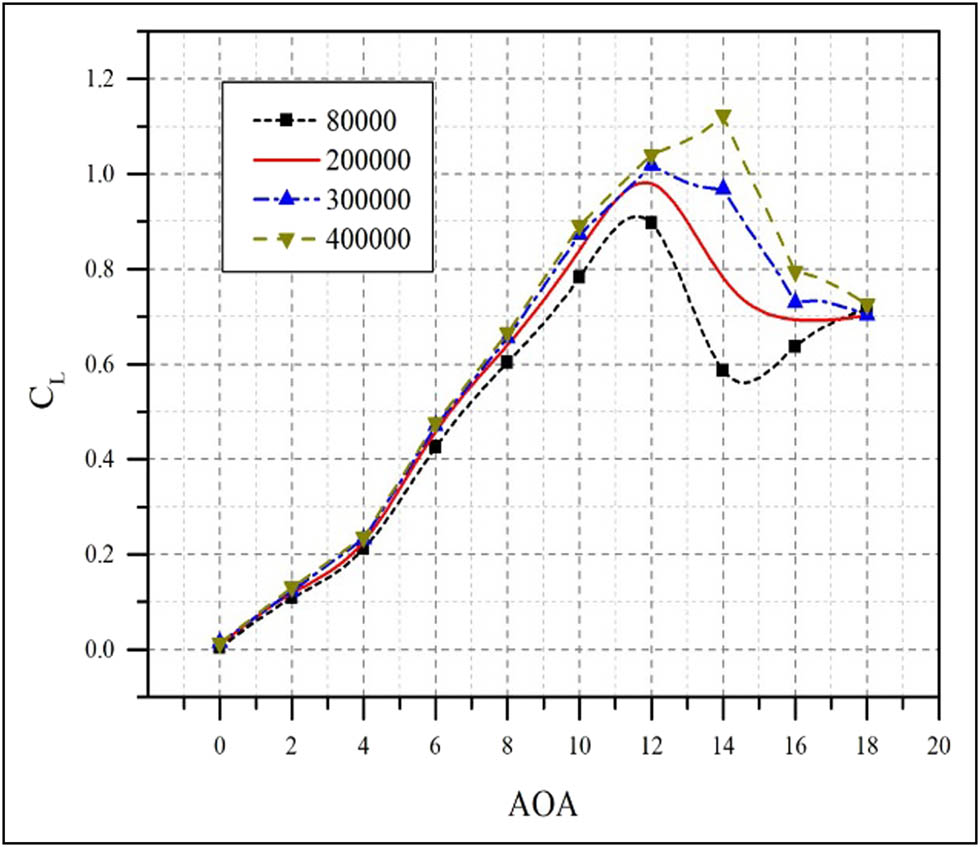
Lift coefficient versus AOA at different Re numbers.
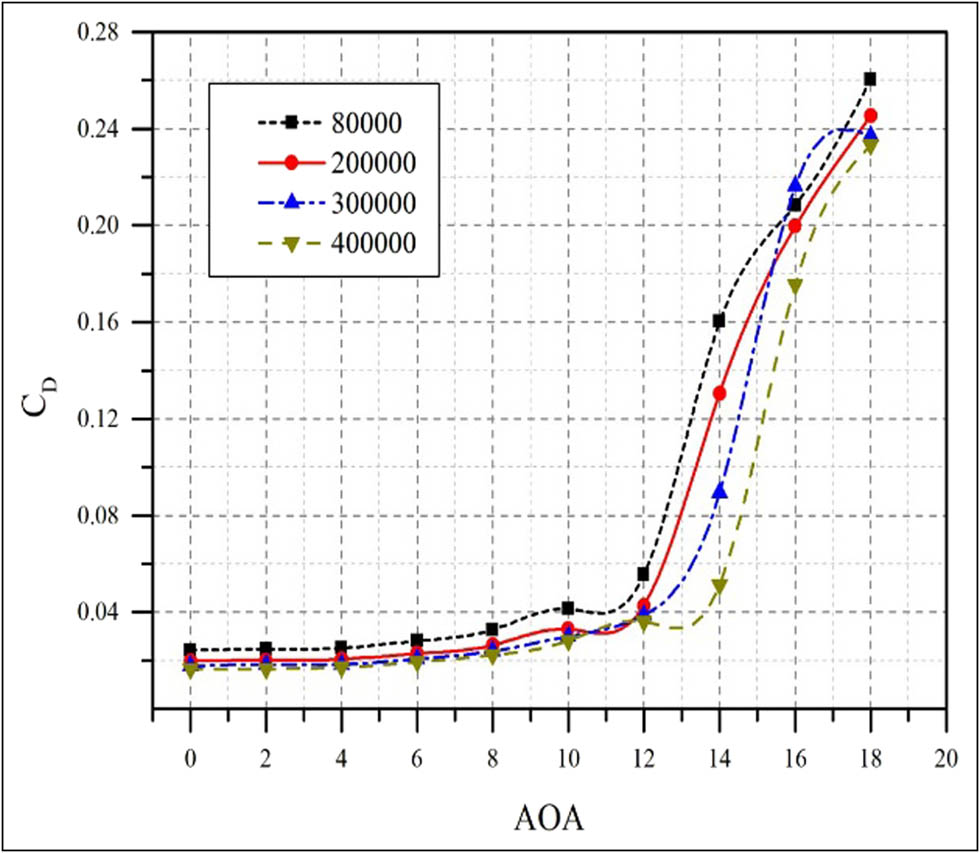
Drag coefficient against AOA at different Re numbers.
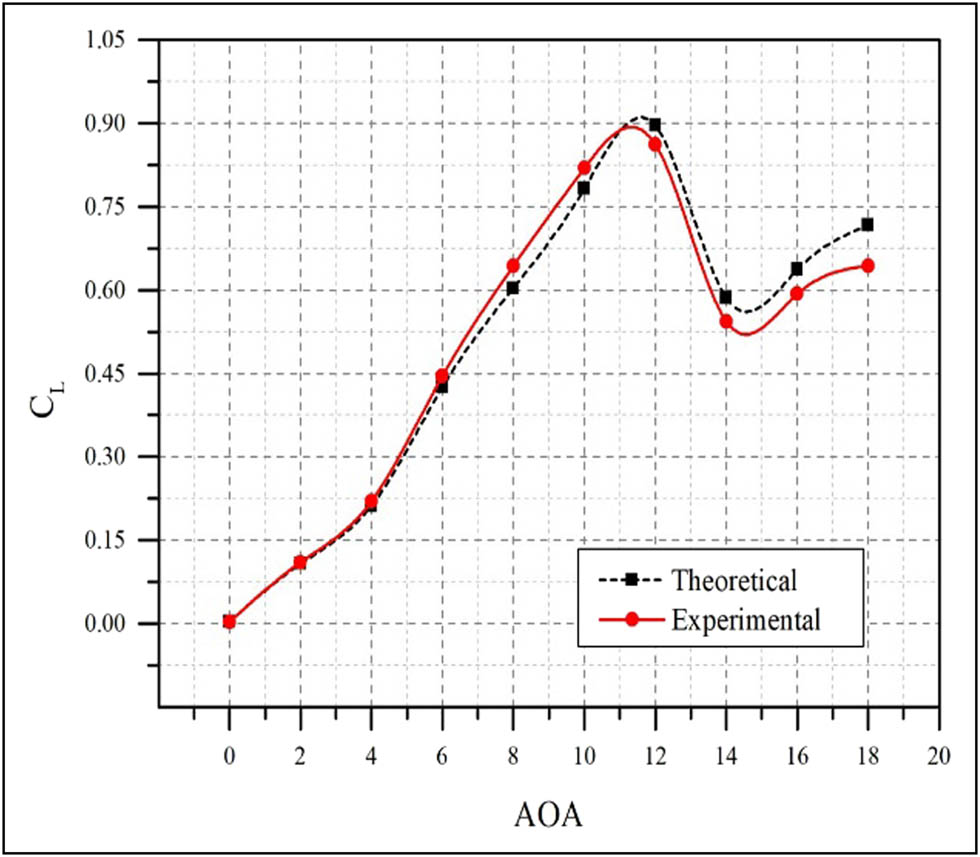
Lift coefficient comparison with AOA at Re = 8 ×
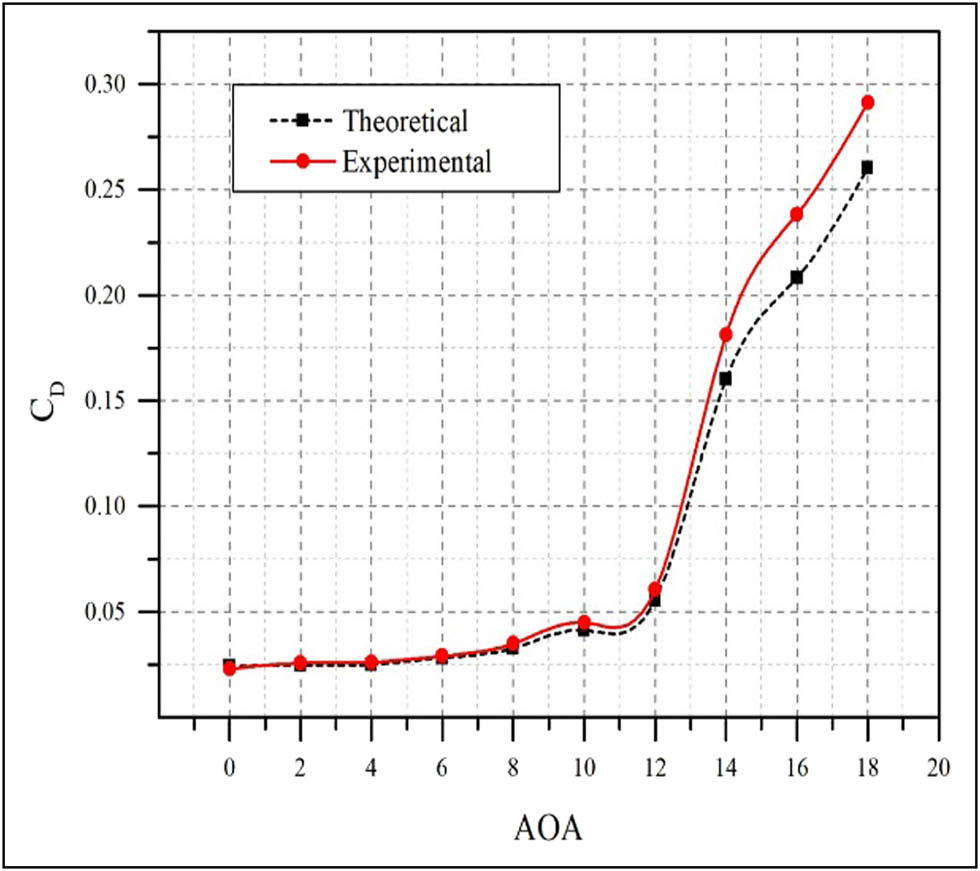
Drag coefficient comparison with AOA at Re = 8 × 10⁴.
6.3 Effect of Re on
C
L
and
C
D
The Re number, a nondimensional number with great importance in fluid mechanics applications, is defined as the ratio of the inertial force to the viscous force. Thus, the Re number can help to determine the relative importance of these forces under certain flow conditions. The effect of Re on the stall angle and the lift and drag coefficients is illustrated in Figures 14 and 15. In Figure 15, the lift coefficient reaches its maximum of 0.896, 0.979, and 1.0188 at the stall angle of 12° and Re numbers of 8 ×
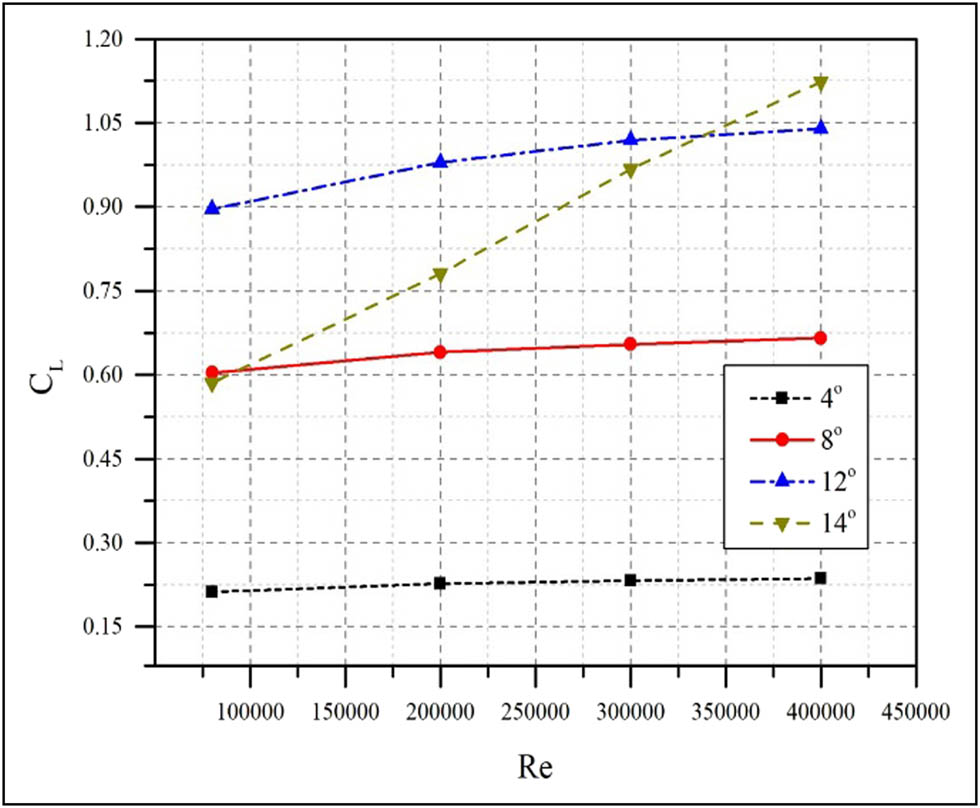
Effect of Re number on the lift coefficient at AOAs of 4°, 8°, 12°, and 14°.
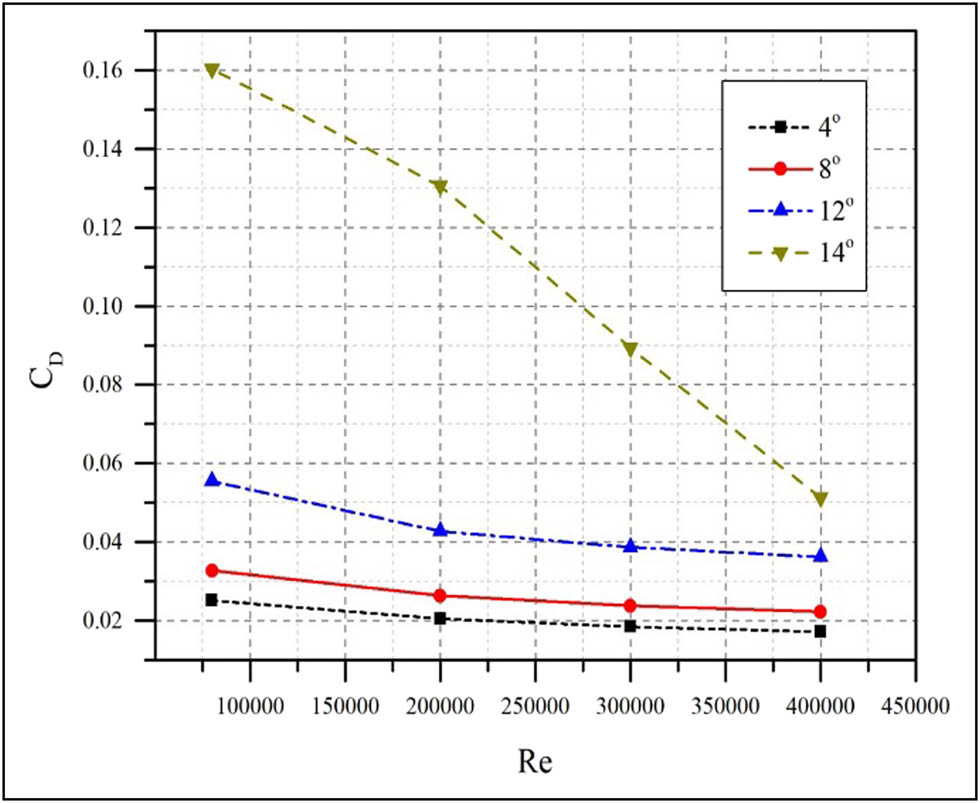
Effect of Re number on the drag coefficient at AOAs of 4°, 8°, 12°, and 14°.
6.4 Effect of AOA and Re on
C
L
/
C
D
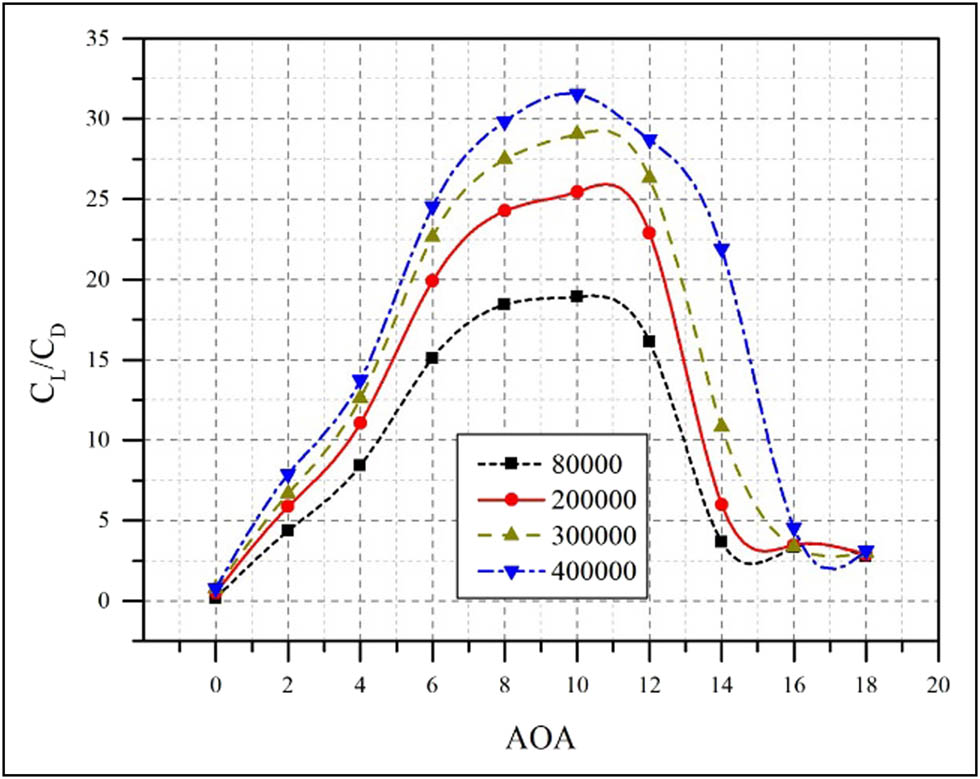
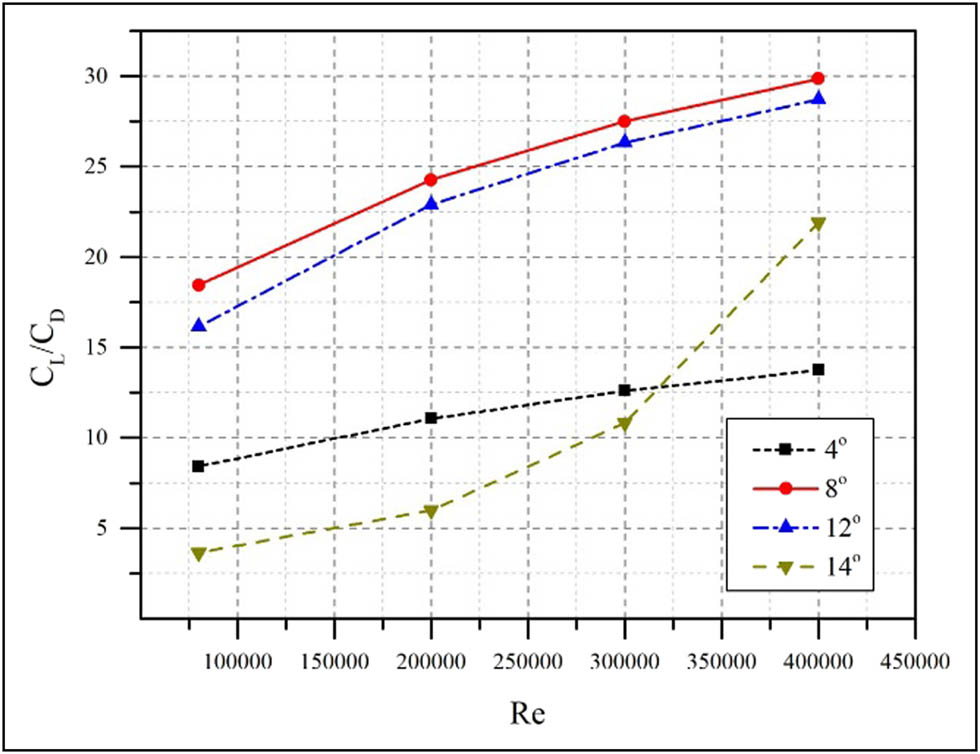
Simply relying on aircraft design is insufficient in generating lift, as a high
7 Conclusion
In the current research, experimental and numerical study was conducted for the symmetrical NACA 0012 airfoil at various AOAs and low Re numbers. The computational analysis was carried out on the ANSYS FLUENT R2 platform using the k–ω SST turbulence model, while the experimental investigation was carried out in a wind tunnel device with dimensions of 305 × 305 × 600 mm. The results of this study may be summed up as follows:
The NACA 0012 airfoil has a non-cambered airfoil shape, which prevents lift at an AOA equal to 0°. Also, between airfoil surfaces, there is no difference in pressure.
The lift coefficient rises linearly with the AOA increased until it reaches its maximum value (
The drag coefficient on the airfoil increases with the AOA increased, where this increase leads to transitioning the flow from laminar to turbulent. As turbulence intensifies, the flow separates from the airfoil surface due to eddies created by the turbulence. This leads to a decrease in the lift coefficient and an increase in resistance, leading to poor airfoil performance.
As the Reynolds number rises, the free current’s disturbance also rises, giving the boundary layer more TKE and causing it to stay connected to the surface for a longer period compared with lower Re numbers. The lift coefficient is somewhat lower at the lesser Reynolds number at higher AOAs due to the trailing edge flow separation. Additionally, increasing the Reynolds number results in an increase in the stall angle (
Based on the aforementioned findings, additional thorough investigation into the AOA or investigating the connection between asymmetric airfoils and the current study is required, clarifying their applicability. Enhancing airfoil performance with the inclusion of lifting devices, such as flaps and slats, is another area that merits investigation. Researchers in the discipline may want to consider these suggestions as potential future study topics.
Acknowledgements
The authors express gratitude to the Department of Aeronautical Engineering, Technical Al-Furat Al-Awsat Technical University (ATU)/Republic of Iraq, for providing wind tunnel and technical support that enabled successful study completion and the achievement of desired results. They express gratitude for their cooperation and distinction.
-
Conflict of interest: The authors declare that they have no conflict of interest.
-
Data availability statement: Most datasets generated and analyzed in this study are comprised in this submitted manuscript. The other datasets are available on reasonable request from the corresponding author with the attachedinformation.
References
[1] Sadikin A, Yunus NAM, Abd Hamid SA, Salleh SM, Rahman MNA, Mahzan S, et al. A comparative study of turbulence models on aerodynamics characteristics of a NACA0012 airfoil. Int J Integr Eng. Apr. 2018;10(1):134–7.10.30880/ijie.2018.10.01.019Suche in Google Scholar
[2] Shabur M, Khan AH, Rayhan S. Turbulent kinetic energy analysis of NACA0012 and NACA0018 airfoils at two reynolds number using CFD tool. Sci Open Prepr. 2022;0–16.10.14293/S2199-1006.1.SOR-.PPQGB0H.v1Suche in Google Scholar
[3] Martínez-Aranda S, García-González AL, Parras L, Velázquez-Navarro JF, Del Pino C. Comparison of the aerodynamic characteristics of the NACA0012 airfoil at low-to-moderate Reynolds numbers for any aspect ratio. Int J Aerosp Sci. 2016;4(1):1–8.Suche in Google Scholar
[4] Singh M. Fabrication and Analysis of NACA 0012 Airfoil in Wind Tunnel. Int Res J Eng Technol. May 2018;5(no. 5):4150–8.Suche in Google Scholar
[5] Kunjumon AP, Koshy FM, Jacob ST. Determination of Pressure Coefficient Around Naca Airfoil. Int J Appl Eng Res. 2019;14(14):81–7.Suche in Google Scholar
[6] Raval NP, Malay M, Jitesh L. CFD analysis of NACA0012 aerofoil and evaluation of stall condition. Int J Eng Technol Sci Res. Apr. 2017;4(4):57–60.Suche in Google Scholar
[7] Patel A, Thakor R. Numerical analysis of NACA0012 using CFD. Int J Anal Exp Modal Anal. Jun. 2020;XII(VI):1244–53.Suche in Google Scholar
[8] Mallela G, Paturu P, Komaleswarao M. Lift and drag performance of NACA0012 airfoil at various angle of attack using CFD. Int J Mech Prod Eng Res Dev. 2018;8(3):89–100. 10.24247/ijmperdjun201810.Suche in Google Scholar
[9] Yuta Y, Tomohisa O, Akinori M. Pressure distributions on NACA0012 AIRFOIL at low reynolds numbers. In 2013 The Proceedings of the International Conference on Jets Wakes and Separated Flows (ICJWSF).10.1299/jsmeicjwsf.2013.4._1201-1_Suche in Google Scholar
[10] Kabir A, Hasan M, Akib YM. Numerical analysis on NACA 0012 airfoil at different Mach numbers with varying angle of attacks using computational fluid dynamics. 5th Int. Conf. Eng. Res. Innov. Educ. (ICERIE), 2019 At Shahjalal Univ. Sci. Technol. (SUST), Sylhet, Bangladesh; 2019. p. 1–6.10.1109/IC4ME247184.2019.9036555Suche in Google Scholar
[11] Shahariar GH. Numerical analysis and comparison on aerodynamics characteristics on NACA-0012 & NACA-4412. International Conf. Mech. Ind. Energy Eng, 2014; 2014. p. 2. Available: https://www.academia.edu/10488400/Numerical_Analysis_and_Comparison_on_Aerodynamics_Characteristics_on_NACA-0012_and_NACA-4412.Suche in Google Scholar
[12] Sahoo S, Maity S. CFD analysis of responses of two-equation turbulence models for flow over NACA 0012, NACA 4412 and S809 aerofoils. In Advances in Mechanical Engineering: Select Proceedings of ICRIDME. Singapore: Springer; Jan. 2020. p. 31–40.10.1007/978-981-15-0124-1_4Suche in Google Scholar
[13] Jha S, Gautam U, Narayanan S, Dhas LK. Effect of reynolds number on the aerodynamic performance of naca0012 aerofoil. In IOP Conference Series: Materials Science and Engineering. Sikkim, India: IOP Publishing, vol. 377, Issue 1; December 2017. p. 1–10.10.1088/1757-899X/377/1/012129Suche in Google Scholar
[14] Yousefi K, Razeghi A. Determination of the critical Reynolds number for flow over symmetric NACA airfoils. In 2018 AIAA Aerospace Sciences Meeting; Jan 2018. p. 1–11.10.2514/6.2018-0818Suche in Google Scholar
[15] Eftekhari S, Al-Obaidi ASM. Investigation of a NACA0012 finite wing aerodynamics at low Reynold’s numbers and 0° to 90° angle of attack. J Aerosp Technol Manag. 2019;11:1–11. 10.5028/jatm.v11.1023.Suche in Google Scholar
[16] Çengel YA, Cimbala JM. Fluid mechanics: fundamentals and applications. Mc-Graw-Hill; 2006.Suche in Google Scholar
[17] Prasad KS, Krishna V, Kumar BBA. Aerofoil profile analysis and design optimisation. J Aerosp Eng Technol. 2013;3(2):1–10, Available: https://www.researchgate.net/publication/279186627.Suche in Google Scholar
© 2024 the author(s), published by De Gruyter
This work is licensed under the Creative Commons Attribution 4.0 International License.
Artikel in diesem Heft
- Regular Articles
- Methodology of automated quality management
- Influence of vibratory conveyor design parameters on the trough motion and the self-synchronization of inertial vibrators
- Application of finite element method in industrial design, example of an electric motorcycle design project
- Correlative evaluation of the corrosion resilience and passivation properties of zinc and aluminum alloys in neutral chloride and acid-chloride solutions
- Will COVID “encourage” B2B and data exchange engineering in logistic firms?
- Influence of unsupported sleepers on flange climb derailment of two freight wagons
- A hybrid detection algorithm for 5G OTFS waveform for 64 and 256 QAM with Rayleigh and Rician channels
- Effect of short heat treatment on mechanical properties and shape memory properties of Cu–Al–Ni shape memory alloy
- Exploring the potential of ammonia and hydrogen as alternative fuels for transportation
- Impact of insulation on energy consumption and CO2 emissions in high-rise commercial buildings at various climate zones
- Advanced autopilot design with extremum-seeking control for aircraft control
- Adaptive multidimensional trust-based recommendation model for peer to peer applications
- Effects of CFRP sheets on the flexural behavior of high-strength concrete beam
- Enhancing urban sustainability through industrial synergy: A multidisciplinary framework for integrating sustainable industrial practices within urban settings – The case of Hamadan industrial city
- Advanced vibrant controller results of an energetic framework structure
- Application of the Taguchi method and RSM for process parameter optimization in AWSJ machining of CFRP composite-based orthopedic implants
- Improved correlation of soil modulus with SPT N values
- Technologies for high-temperature batch annealing of grain-oriented electrical steel: An overview
- Assessing the need for the adoption of digitalization in Indian small and medium enterprises
- A non-ideal hybridization issue for vertical TFET-based dielectric-modulated biosensor
- Optimizing data retrieval for enhanced data integrity verification in cloud environments
- Performance analysis of nonlinear crosstalk of WDM systems using modulation schemes criteria
- Nonlinear finite-element analysis of RC beams with various opening near supports
- Thermal analysis of Fe3O4–Cu/water over a cone: a fractional Maxwell model
- Radial–axial runner blade design using the coordinate slice technique
- Theoretical and experimental comparison between straight and curved continuous box girders
- Effect of the reinforcement ratio on the mechanical behaviour of textile-reinforced concrete composite: Experiment and numerical modeling
- Experimental and numerical investigation on composite beam–column joint connection behavior using different types of connection schemes
- Enhanced performance and robustness in anti-lock brake systems using barrier function-based integral sliding mode control
- Evaluation of the creep strength of samples produced by fused deposition modeling
- A combined feedforward-feedback controller design for nonlinear systems
- Effect of adjacent structures on footing settlement for different multi-building arrangements
- Analyzing the impact of curved tracks on wheel flange thickness reduction in railway systems
- Review Articles
- Mechanical and smart properties of cement nanocomposites containing nanomaterials: A brief review
- Applications of nanotechnology and nanoproduction techniques
- Relationship between indoor environmental quality and guests’ comfort and satisfaction at green hotels: A comprehensive review
- Communication
- Techniques to mitigate the admission of radon inside buildings
- Erratum
- Erratum to “Effect of short heat treatment on mechanical properties and shape memory properties of Cu–Al–Ni shape memory alloy”
- Special Issue: AESMT-3 - Part II
- Integrated fuzzy logic and multicriteria decision model methods for selecting suitable sites for wastewater treatment plant: A case study in the center of Basrah, Iraq
- Physical and mechanical response of porous metals composites with nano-natural additives
- Special Issue: AESMT-4 - Part II
- New recycling method of lubricant oil and the effect on the viscosity and viscous shear as an environmentally friendly
- Identify the effect of Fe2O3 nanoparticles on mechanical and microstructural characteristics of aluminum matrix composite produced by powder metallurgy technique
- Static behavior of piled raft foundation in clay
- Ultra-low-power CMOS ring oscillator with minimum power consumption of 2.9 pW using low-voltage biasing technique
- Using ANN for well type identifying and increasing production from Sa’di formation of Halfaya oil field – Iraq
- Optimizing the performance of concrete tiles using nano-papyrus and carbon fibers
- Special Issue: AESMT-5 - Part II
- Comparative the effect of distribution transformer coil shape on electromagnetic forces and their distribution using the FEM
- The complex of Weyl module in free characteristic in the event of a partition (7,5,3)
- Restrained captive domination number
- Experimental study of improving hot mix asphalt reinforced with carbon fibers
- Asphalt binder modified with recycled tyre rubber
- Thermal performance of radiant floor cooling with phase change material for energy-efficient buildings
- Surveying the prediction of risks in cryptocurrency investments using recurrent neural networks
- A deep reinforcement learning framework to modify LQR for an active vibration control applied to 2D building models
- Evaluation of mechanically stabilized earth retaining walls for different soil–structure interaction methods: A review
- Assessment of heat transfer in a triangular duct with different configurations of ribs using computational fluid dynamics
- Sulfate removal from wastewater by using waste material as an adsorbent
- Experimental investigation on strengthening lap joints subjected to bending in glulam timber beams using CFRP sheets
- A study of the vibrations of a rotor bearing suspended by a hybrid spring system of shape memory alloys
- Stability analysis of Hub dam under rapid drawdown
- Developing ANFIS-FMEA model for assessment and prioritization of potential trouble factors in Iraqi building projects
- Numerical and experimental comparison study of piled raft foundation
- Effect of asphalt modified with waste engine oil on the durability properties of hot asphalt mixtures with reclaimed asphalt pavement
- Hydraulic model for flood inundation in Diyala River Basin using HEC-RAS, PMP, and neural network
- Numerical study on discharge capacity of piano key side weir with various ratios of the crest length to the width
- The optimal allocation of thyristor-controlled series compensators for enhancement HVAC transmission lines Iraqi super grid by using seeker optimization algorithm
- Numerical and experimental study of the impact on aerodynamic characteristics of the NACA0012 airfoil
- Effect of nano-TiO2 on physical and rheological properties of asphalt cement
- Performance evolution of novel palm leaf powder used for enhancing hot mix asphalt
- Performance analysis, evaluation, and improvement of selected unsignalized intersection using SIDRA software – Case study
- Flexural behavior of RC beams externally reinforced with CFRP composites using various strategies
- Influence of fiber types on the properties of the artificial cold-bonded lightweight aggregates
- Experimental investigation of RC beams strengthened with externally bonded BFRP composites
- Generalized RKM methods for solving fifth-order quasi-linear fractional partial differential equation
- An experimental and numerical study investigating sediment transport position in the bed of sewer pipes in Karbala
- Role of individual component failure in the performance of a 1-out-of-3 cold standby system: A Markov model approach
- Implementation for the cases (5, 4) and (5, 4)/(2, 0)
- Center group actions and related concepts
- Experimental investigation of the effect of horizontal construction joints on the behavior of deep beams
- Deletion of a vertex in even sum domination
- Deep learning techniques in concrete powder mix designing
- Effect of loading type in concrete deep beam with strut reinforcement
- Studying the effect of using CFRP warping on strength of husk rice concrete columns
- Parametric analysis of the influence of climatic factors on the formation of traditional buildings in the city of Al Najaf
- Suitability location for landfill using a fuzzy-GIS model: A case study in Hillah, Iraq
- Hybrid approach for cost estimation of sustainable building projects using artificial neural networks
- Assessment of indirect tensile stress and tensile–strength ratio and creep compliance in HMA mixes with micro-silica and PMB
- Density functional theory to study stopping power of proton in water, lung, bladder, and intestine
- A review of single flow, flow boiling, and coating microchannel studies
- Effect of GFRP bar length on the flexural behavior of hybrid concrete beams strengthened with NSM bars
- Exploring the impact of parameters on flow boiling heat transfer in microchannels and coated microtubes: A comprehensive review
- Crumb rubber modification for enhanced rutting resistance in asphalt mixtures
- Special Issue: AESMT-6
- Design of a new sorting colors system based on PLC, TIA portal, and factory I/O programs
- Forecasting empirical formula for suspended sediment load prediction at upstream of Al-Kufa barrage, Kufa City, Iraq
- Optimization and characterization of sustainable geopolymer mortars based on palygorskite clay, water glass, and sodium hydroxide
- Sediment transport modelling upstream of Al Kufa Barrage
- Study of energy loss, range, and stopping time for proton in germanium and copper materials
- Effect of internal and external recycle ratios on the nutrient removal efficiency of anaerobic/anoxic/oxic (VIP) wastewater treatment plant
- Enhancing structural behaviour of polypropylene fibre concrete columns longitudinally reinforced with fibreglass bars
- Sustainable road paving: Enhancing concrete paver blocks with zeolite-enhanced cement
- Evaluation of the operational performance of Karbala waste water treatment plant under variable flow using GPS-X model
- Design and simulation of photonic crystal fiber for highly sensitive chemical sensing applications
- Optimization and design of a new column sequencing for crude oil distillation at Basrah refinery
- Inductive 3D numerical modelling of the tibia bone using MRI to examine von Mises stress and overall deformation
- An image encryption method based on modified elliptic curve Diffie-Hellman key exchange protocol and Hill Cipher
- Experimental investigation of generating superheated steam using a parabolic dish with a cylindrical cavity receiver: A case study
- Effect of surface roughness on the interface behavior of clayey soils
- Investigated of the optical properties for SiO2 by using Lorentz model
- Measurements of induced vibrations due to steel pipe pile driving in Al-Fao soil: Effect of partial end closure
- Experimental and numerical studies of ballistic resistance of hybrid sandwich composite body armor
- Evaluation of clay layer presence on shallow foundation settlement in dry sand under an earthquake
- Optimal design of mechanical performances of asphalt mixtures comprising nano-clay additives
- Advancing seismic performance: Isolators, TMDs, and multi-level strategies in reinforced concrete buildings
- Predicted evaporation in Basrah using artificial neural networks
- Energy management system for a small town to enhance quality of life
- Numerical study on entropy minimization in pipes with helical airfoil and CuO nanoparticle integration
- Equations and methodologies of inlet drainage system discharge coefficients: A review
- Thermal buckling analysis for hybrid and composite laminated plate by using new displacement function
- Investigation into the mechanical and thermal properties of lightweight mortar using commercial beads or recycled expanded polystyrene
- Experimental and theoretical analysis of single-jet column and concrete column using double-jet grouting technique applied at Al-Rashdia site
- The impact of incorporating waste materials on the mechanical and physical characteristics of tile adhesive materials
- Seismic resilience: Innovations in structural engineering for earthquake-prone areas
- Automatic human identification using fingerprint images based on Gabor filter and SIFT features fusion
- Performance of GRKM-method for solving classes of ordinary and partial differential equations of sixth-orders
- Visible light-boosted photodegradation activity of Ag–AgVO3/Zn0.5Mn0.5Fe2O4 supported heterojunctions for effective degradation of organic contaminates
- Production of sustainable concrete with treated cement kiln dust and iron slag waste aggregate
- Key effects on the structural behavior of fiber-reinforced lightweight concrete-ribbed slabs: A review
- A comparative analysis of the energy dissipation efficiency of various piano key weir types
- Special Issue: Transport 2022 - Part II
- Variability in road surface temperature in urban road network – A case study making use of mobile measurements
- Special Issue: BCEE5-2023
- Evaluation of reclaimed asphalt mixtures rejuvenated with waste engine oil to resist rutting deformation
- Assessment of potential resistance to moisture damage and fatigue cracks of asphalt mixture modified with ground granulated blast furnace slag
- Investigating seismic response in adjacent structures: A study on the impact of buildings’ orientation and distance considering soil–structure interaction
- Improvement of porosity of mortar using polyethylene glycol pre-polymer-impregnated mortar
- Three-dimensional analysis of steel beam-column bolted connections
- Assessment of agricultural drought in Iraq employing Landsat and MODIS imagery
- Performance evaluation of grouted porous asphalt concrete
- Optimization of local modified metakaolin-based geopolymer concrete by Taguchi method
- Effect of waste tire products on some characteristics of roller-compacted concrete
- Studying the lateral displacement of retaining wall supporting sandy soil under dynamic loads
- Seismic performance evaluation of concrete buttress dram (Dynamic linear analysis)
- Behavior of soil reinforced with micropiles
- Possibility of production high strength lightweight concrete containing organic waste aggregate and recycled steel fibers
- An investigation of self-sensing and mechanical properties of smart engineered cementitious composites reinforced with functional materials
- Forecasting changes in precipitation and temperatures of a regional watershed in Northern Iraq using LARS-WG model
- Experimental investigation of dynamic soil properties for modeling energy-absorbing layers
- Numerical investigation of the effect of longitudinal steel reinforcement ratio on the ductility of concrete beams
- An experimental study on the tensile properties of reinforced asphalt pavement
- Self-sensing behavior of hot asphalt mixture with steel fiber-based additive
- Behavior of ultra-high-performance concrete deep beams reinforced by basalt fibers
- Optimizing asphalt binder performance with various PET types
- Investigation of the hydraulic characteristics and homogeneity of the microstructure of the air voids in the sustainable rigid pavement
- Enhanced biogas production from municipal solid waste via digestion with cow manure: A case study
- Special Issue: AESMT-7 - Part I
- Preparation and investigation of cobalt nanoparticles by laser ablation: Structure, linear, and nonlinear optical properties
- Seismic analysis of RC building with plan irregularity in Baghdad/Iraq to obtain the optimal behavior
- The effect of urban environment on large-scale path loss model’s main parameters for mmWave 5G mobile network in Iraq
- Formatting a questionnaire for the quality control of river bank roads
- Vibration suppression of smart composite beam using model predictive controller
- Machine learning-based compressive strength estimation in nanomaterial-modified lightweight concrete
- In-depth analysis of critical factors affecting Iraqi construction projects performance
- Behavior of container berth structure under the influence of environmental and operational loads
- Energy absorption and impact response of ballistic resistance laminate
- Effect of water-absorbent polymer balls in internal curing on punching shear behavior of bubble slabs
- Effect of surface roughness on interface shear strength parameters of sandy soils
- Evaluating the interaction for embedded H-steel section in normal concrete under monotonic and repeated loads
- Estimation of the settlement of pile head using ANN and multivariate linear regression based on the results of load transfer method
- Enhancing communication: Deep learning for Arabic sign language translation
- A review of recent studies of both heat pipe and evaporative cooling in passive heat recovery
- Effect of nano-silica on the mechanical properties of LWC
- An experimental study of some mechanical properties and absorption for polymer-modified cement mortar modified with superplasticizer
- Digital beamforming enhancement with LSTM-based deep learning for millimeter wave transmission
- Developing an efficient planning process for heritage buildings maintenance in Iraq
- Design and optimization of two-stage controller for three-phase multi-converter/multi-machine electric vehicle
- Evaluation of microstructure and mechanical properties of Al1050/Al2O3/Gr composite processed by forming operation ECAP
- Calculations of mass stopping power and range of protons in organic compounds (CH3OH, CH2O, and CO2) at energy range of 0.01–1,000 MeV
- Investigation of in vitro behavior of composite coating hydroxyapatite-nano silver on 316L stainless steel substrate by electrophoretic technic for biomedical tools
- A review: Enhancing tribological properties of journal bearings composite materials
- Improvements in the randomness and security of digital currency using the photon sponge hash function through Maiorana–McFarland S-box replacement
- Design a new scheme for image security using a deep learning technique of hierarchical parameters
- Special Issue: ICES 2023
- Comparative geotechnical analysis for ultimate bearing capacity of precast concrete piles using cone resistance measurements
- Visualizing sustainable rainwater harvesting: A case study of Karbala Province
- Geogrid reinforcement for improving bearing capacity and stability of square foundations
- Evaluation of the effluent concentrations of Karbala wastewater treatment plant using reliability analysis
- Adsorbent made with inexpensive, local resources
- Effect of drain pipes on seepage and slope stability through a zoned earth dam
- Sediment accumulation in an 8 inch sewer pipe for a sample of various particles obtained from the streets of Karbala city, Iraq
- Special Issue: IETAS 2024 - Part I
- Analyzing the impact of transfer learning on explanation accuracy in deep learning-based ECG recognition systems
- Effect of scale factor on the dynamic response of frame foundations
- Improving multi-object detection and tracking with deep learning, DeepSORT, and frame cancellation techniques
- The impact of using prestressed CFRP bars on the development of flexural strength
- Assessment of surface hardness and impact strength of denture base resins reinforced with silver–titanium dioxide and silver–zirconium dioxide nanoparticles: In vitro study
- A data augmentation approach to enhance breast cancer detection using generative adversarial and artificial neural networks
- Modification of the 5D Lorenz chaotic map with fuzzy numbers for video encryption in cloud computing
- Special Issue: 51st KKBN - Part I
- Evaluation of static bending caused damage of glass-fiber composite structure using terahertz inspection