The effect of urban environment on large-scale path loss model’s main parameters for mmWave 5G mobile network in Iraq
-
Mushtaq Talib Mezaal
 ,
Norazizah Binti Mohd Aripin
,
Norazizah Binti Mohd Aripin

Abstract
The high speeds resulting from the use of millimeter waves (mmWave) in 5G mobile networks are accompanied by high path loss. The issue of generating a reliable propagation model of radio waves is crucial to the development of cellular networks since it reveals essential information regarding the properties of the wireless channel. The received signal strength, the coverage area, and the outage probability in certain places may all be determined through theoretical or empirical radio frequency propagation models, which offer essential valuable information regarding signal path loss and fading. This work analyzes a comprehensive three-dimensional ray-tracing method at 28 GHz for Najaf city, Iraq. The optimum path loss model for the city of Najaf is evaluated using the close-in (CI) model. On average, the values of the main parameters of CI model
1 Introduction
Due to the vast development in data consumption, communication infrastructure, mobile subscriptions, and the increasing penetration of mobile and Internet of Thing (IoT) devices, the needs for cellular bandwidth have been severely stretched. To overcome the constraints of the existing technology, the next generation of communication technology will need to enhance its spectral efficiency, expand its bandwidth, and develop better technology for recycling spectrum. The ultra-low latency and massive network capacity relayed to 5G mmWave communication, along with higher performance and ameliorated efficiency, promise a wide range of potential user applications. These applications include smart cities, the IoT, industrial automation, and vehicular communication. There are two key issues with millimeter waves (mmWave) that make it less than ideal for 5G: high path loss and high penetration losses. It has been justified that mmWave operate in extremely power-limited regimes, restricting the flexibility with which spatial antenna structure and expanded bandwidth freedom may be utilized [1]. The most suitable way to describe the signal attenuation of a transmitting and receiving antenna, depending on the separating distance between them furthermore some other parameters, is the path loss model [2]. The signal losses passing through a radio frequency channel can be predicted by using a suitable path loss model [2]. Short wavelengths of mmWave occur due to reflection, scattering, line-of-sight (LOS) propagation, diffraction, and penetration of materials, which will cause a large size of attenuation. Over the past few years, numerous companies and research groups have presented a wide range of scenarios to simulate various measurements and models [3,4]. Checking channel parameters is the cornerstone of the design of any millimeter wave transmission and receiving system. To check those parameters for each millimeter channel, there are two main methods: measurements and modeling. Several factors make it challenging to perform physical measurements completely, such as the high cost and furthermore heavy weight of the measuring devices, in addition to the weather conditions specific to each place; therefore, path loss modeling is preferred over field measurement.
Ultimately, 5G aims to realize a highly adaptable radio access architecture capable of advocating extremely high volumes of machine-type communications. The critical loss, high path loss, and high absorption rate of 5G mmWave transmission through vegetation are all issues that have been identified. Chen [5] suggested working on a 5G diminutive cell mmWave technology operating at 28 GHz to address the limitations of 5G. Path loss modeling is essential for determining the best placement and coverage for mmWave network transmitter antennas. The problem of modeling path loss has been tackled from numerous angles, with several empirical, deterministic, and ANN-based models being produced. Network optimization engineers can benefit greatly from path loss prediction algorithms since they can utilize them to better place base stations, choose transmitting and receiving antennas, establish optimal operating frequencies, and do interference analyses. The presence of numerous criteria adopted in classifying the channel models has made it challenging to classify these models despite the great efforts made to do so [6]. The most common types of radio propagation models are empirical and deterministic. Diffraction principles [7], integral equations [8], ray tracing [9], and parabolic equations [10] form the theoretical foundation for deterministic models. Author in [11], the conventional propagation model [12], and the COST 231-Hata model [13] are all examples of empirical models that are based on driving test measurements of the target regions. These models require minutes in the way of computing resources, and they may be deployed quickly at minute cost. Their lack of adaptability to changing conditions means they are less reliable than other models. At 800 and 1,800 MHz, Cheerla et al. [14] utilized Newton’s approach to generate an optimized COST 231-Walfisch-Ikegami (CWI) model. Using this strategy, they were able to validate the path loss prediction in the field with better precision than using the empirical CWI model. As a result, before launching a pilot study and building the expensive mmWave infrastructure, it is crucial to investigate the surrounding area and run through simulations. As a result, the primary objective of this study is to run a high-resolution, three-dimensional (3D) ray-tracing simulation of Najaf city, Iraq, at 28 GHz. For 28 GHz, the path loss is characterized by the close-in (CI), alpha–beta–gamma (ABG), and floating intercept models, depending on the height difference between the transmitter and receiving antennas (30 vs 2 m). These models fall into one of three categories that Erunkulu [2] established based on the carrier frequencies. Although there are numerous types of path loss models, all path loss models do not exactly satisfy the Iraqi conditions as demonstrated in the study of Al-shuwaili [15]. Al-shuwaili [15] and Jamel [16] simulated 5G network for Baghdad city by studying the impact of the weather conditions furthermore the suitable mmWave band for Iraq, while neglecting at the same time the impact of the other essential elements like the urban distribution that distinguishes a city from another.
This article provides a detailed path loss study at 28 GHz utilizing the CI path loss model at a
This study provides contributions including utilizing intelligent ray-tracing simulation provided by FEKO-WinProp software to generate a novel deterministic path loss model at 28 GHz for the city of Najaf, Iraq. In addition, the parameters of the suggested path loss model, including the PLE, the shadow factor, and the random Gaussian standard deviation, have been fine-tuned to the target environment. Furthermore, the optimal model to reflect path loss in a 28 GHz environment has been determined by computing CI path loss model for a range of scenarios based on the special location of the transmitter. In conclusion, the results gained in this work may be utilized as a standard for future efforts in research on Najaf city and the other surrounding provinces which share the same environment.
2 Related works
The mmWave utilized in 5G networks is closely related to path losses and absorption losses. Conversely, the communication between the transmitter and receiver in the two environments (LoS and non-line-of-sight [NLoS]) can be established based on the phenomena of reflection and scattering. Several factors limit the free space accomplished by the mmWave spectrum, including the molecular size of raindrops, as well, due to the short length of mmWave [2]. Temperature and humidity moreover have a significant impact on the mmWave by absorbing part of the signal energy, causing it to be attenuated. mmWave at higher frequencies suffers from higher attenuation over distance. Absorption losses due to oxygen furthermore other environmental factors have been studied by Rappaport et al. [17]. Attenuation is an additional effect on the propagation channel that occurs due to excess path loss. Increasing the size of the transmitter or receiver antenna can exceed the mmWave path loss. The effective surface of each antenna is the primary determinant of each antenna gain, which in turn determines the permissible path limits. In the case of the LoS mmWave channel, the boresight alignment controls the occurrence of effective communication with the directional antenna, so the parameters associated with the antenna (such as the antenna position, location, and pattern) affect the quality of communication as they either mitigate or increase path losses [18]. To mitigate path losses, the transmitter must be physically directed toward the receiver in the case of antennas with fixed beam patterns. To accomplish effective communication in the case of NLoS communication channels, the antenna inside the single beam must be directed toward one or more reflections, provided that the reflection is dominant. One of the conditions for the NLoS channel to be the best is when a complicated beam pattern is available, which can divide the energy over multiple propagation paths. The antennas utilized with the NLoS channel must have some adaptation to accomplish the best NLoS channel. Several characteristics must be provided in future antennas utilized for mmWave such as antenna gain, beamwidth, and beam pointing technique to mitigate the effect of interference on communication quality [18].
The path loss prediction can be defined as the possibility of determining the effect of attenuation with an acceptable level of accuracy on the propagation of radio signals. Path loss prediction is considered one of the basics in any planning process for establishing a wireless communication network [19]. To determine propagation losses for a specific network, accurate data between the transmitting and receiving stations must be generated through wide-field campaigns to measure the received signal strength (RSS) [20–22]. A model for predicting path losses has been proposed by Al-samman et al. [23], which is devoted to finding path losses in 5G mmWave and future 6 GHz communications by inserting a frequency-dependent attenuation factor. To solve multi-task missions related to direct and multi-hop communication applications, Elizabeth et al. utilized an unmanned aerial vehicle (UAV) to discover which path is the fastest [24]. They concluded that the propagation signal strength could be enhanced prior to the deployment of network infrastructure by relying on multiple UAVs [24]. Authors in [25] justified the dependence of the path loss distribution on the general environmental characteristics of the target area. Three categorized propagation environments are urban, suburban, aquatic, tunnel, furthermore rural, on which the path loss value depends on which it is most closely relied for estimating PLE. For urban environments, the path loss can be estimated to be 30–50 dB, depending on the height and type of building materials. The path loss generated by ground terrain per 1 km can be estimated at 90 dB [26]. For aquatic environments, Sasidhar [27] estimated the path losses due to the surfaces of oceans and seas; Hrovat et al. [28] investigated the path losses in the tunnels utilized for metro and trains due to obstacles and traffic in the roads and railway tunnel, which leads to an increase in the propagation signal’s delay spread. Besides poor communication quality in the tunnel environment, additional path losses can be recorded due to objects moving inside the tunnels [28]. Cellular coverage can be practically predicted by relying on geometric mathematical models for ray tracing through computer simulations. Researchers resort to using a high computer to predict the coverage of any cellular system due to the high costs associated with the drive test furthermore to save time as well. For these reasons, numerous companies have adopted several 3D modeling software developed to meet a variety of work. Propagation simulation modeling using ray tracing and drive test measurement campaigns are the two main types of modeling for calculating path losses. The propagation characteristics are measured in drive test campaigns using advanced measuring software and tools.
Ray-tracing techniques have recently expanded to include path loss prediction models based on artificial intelligence techniques such as convolutional neural network (CNN) and artificial neural network (ANN), by integrating two-dimensional (2D) satellite images with 3D models to generate a general method for predicting path losses [29,30]. Several elements control the accuracy of 3D digital maps, such as terrain, foliage, and city buildings, in addition to other features such as the location of the transceivers, building edges, street features, and facades. 3D ray-tracing simulation models can flexibly alter some parameters that are impossible to adjust furthermore calibrate during field first-hand practice. High computational complexity combined with long simulation time is the only drawback of using 3D ray tracing. The CNN-based 2D satellite image was utilized by Ahmadien et al. [29] to overcome the high computational complexity required for 3D ray-tracing simulation. Ahmadien et al. [29] discussed the possibility of predicting the path losses for the transmitting and receiving antennas at various heights and various frequencies. Relying on CNNs, Ates et al. [31] presented a deep learning model with an accuracy of 88 and 76% for PLE and large-scale shadowing factor, respectively. The model was trained and tested by 3D ray tracing after extracting pertinent properties found in 2D satellite images. The deep neural network utilizes a 2D satellite image as input to begin the process of predicting channel parameters. For a successful and effective deep-learning model, huge data are required for the purpose of training and testing. To obtain these huge data, 3D ray-tracing simulation is utilized to generate it within the study area based on the propagation modeling software [32]. To model path losses, some researchers [32] have introduced 3D ray-tracing to accomplish their goal. To study the wave propagation between an LTE base station and a vehicle, Charitos et al. [33] relied on 3D ray tracing for the purpose of predicting the spatial and temporal multipath ray components in their article [33]. The authors compared the results obtained by simulation with realistic measurements taken with a drive test of the target area. The authors demonstrated the ability of the virtual drive test to produce results with higher accuracy and reliability than the measured value. Path loss models have been modeled by Thrane et al. by ray tracing using deep-learning techniques furthermore made use of satellite images and drive tests [34]. The authors demonstrate a significant improvement in path loss prediction for models developed with deep-learning techniques, scoring 1 dB for 811 MHz networks and 4.7 dB for 2630 MHz networks. An extensive review of path loss models based on the ray-tracing model has been presented by Thrane et al. [34]. The focus of the review was on the accuracy obtained for path losses based on 3D tracing techniques for outdoor propagation scenarios. The authors conclude that there is a certain level of uncertainty in ray-tracing models resulting from the utilization of numerical maps, although they insist that ray-tracing models remain the best predictors of path losses, neglecting at the same time the high computational requirements. A new dual regression model has been proposed by Han et al. utilizing Network Simulator Version 2 (NS-2) that provides the transmitter and receiver freedom of movement without sudden alters in the correlated space path loss [35]. The authors’ main objective is to break down the difficulties associated with the movement of both the transmitter and the receiver by constructing a spatially correlated path loss for a mobile-to-mobile simulation. The authors utilized drive test campaigns to validate the accuracy of the results obtained from the proposed model that advocates the maintenance of spatial correlation related to path losses for both indoor and outdoor scenarios. One of the most crucial factors limiting the performance of wireless communication networks that operate using mmWave is the losses that occur as a result of atmospheric absorption, in addition to the path losses [36]. In New York City, Maccartney et al. launched an extensive campaign measuring mmWave propagation at frequencies of 28 and 73 GHz [37]. The study demonstrated by comparison that novel large-scale path loss models are better in terms of adaptation and performance relative to 3rd generation partnership project and international telecommunication union (ITU) propagation models. Sun et al. [38] demonstrated, regarding the accuracy of prediction for 5G networks operating in mmWave, that the well-known ABG model predicted less than acceptable levels for regions near the transmitting antenna while it over-predicted for regions far from transmitter antenna. The results indicate that the CI and close-in free space models provide better computational simplicity. Rappaport et al. [17] justified through extensive measurement campaigns within the city of New York the relationship of the value of the PLE with the dense urban environment of the city furthermore its recording of higher values. It is possible to propose a new path loss model based on the measurements obtained through the extensive propagation measurement. This proposed model can predict path losses furthermore and relate them as a function between distance and transmitter frequency for the indoor and outdoor scenarios. Bhuvaneshwari et al. [39] combined ray-tracing with the Walfisch-Ikegami model to provide a hybrid model with a better ability to predict path losses. The hybrid model accomplished 69.9% less error. The results obtained from the hybrid model were verified by a field campaign of measurements for GSM networks with a frequency of 900 MHz in Hyderabad, India. The CI model was developed by Batalha et al. based on measurements obtained from campaigns in the indoor environment at mmWave frequencies, and measurements are normalized by the minimum mean square error (MMSE) technique [40]. In the published paper [41] for an indoor environment, specifically a diminutive office, an assessment of mmWave propagation was done utilizing a 3D ray-tracing model. Models like COST-WI allow for performance validation of the simulation model with real-world field measurement in an urban setting. Due to COST-WI considering realistic environmental factors like road width, building elevations, street alignments, and vegetation, it can only be utilized in certain contexts. Moreover, COST-231 [13] is another alternative. A comprehensive mmWave frequency indoor measuring campaign was carried out by the author in ref. [40]. The least mean square error (MMSE) technique was applied to field measurement data to generate a path loss adjusting model for a near-field path loss model under LoS and NLoS environments. The author proposes a 3D ray-tracing model to simulate the path loss at 28 GHz in an indoor setting (Tables 1 and 2).
Summary of recorded parameters of CI path loss model in various countries
| No. | Reference | Utilized frequency in GHz |
|
|
Model type | Country |
|---|---|---|---|---|---|---|
| 1 | [37] | 28 | 2.5–10.8 | 1.7–5.1 | Empirical | USA |
| 73 | 3.2–15.9 | 1.6–6.4 | ||||
| 2 | [38] | 38 | 5.3 | 2.9 | Empirical | USA |
| 73 | 8 | 3.2 | ||||
| 3 | [42] | 19 | — | 0.6 | Empirical | UK |
| 28 | — | 0.6 | ||||
| 38 | — | 1.3 | ||||
| 4 | [43] | 28 | 8.36 | 3.73 | Empirical | UK |
| 38 | 5.78 | 3.88 | ||||
| 5 | [20] | 3.5 | 6.54, 6.97 | 1.48, 1.95 | Empirical | Malaysia |
| 5.91, 7.44 | 1.32, 1.78 | |||||
| 6 | [44] | 3.5 | 6.98, 7.73, 4.99 | 1.98, 2.07, 1.94 | Empirical | Malaysia |
| 4.89, 5.91, 3.50 | 1.82, 1.99, 1.76 | |||||
| 7 | [45] | 28 | 4, 2.6 | 2 | Empirical | China |
| 38 | 2.3, 1.8 | 2 | ||||
| 8 | [46] | 40 | 4.7, 9 | 1.8, 2.9 | Empirical | USA |
| 9 | [47] | 60 | — | 1.56–1.78 | Empirical | South Korea |
| 3.87 | ||||||
| 10 | [41] | 28 | 3.6 | 2.1 | Empirical | Malaysia |
| 38 | 2.4–3.6 | 1.8, 1.9, 2 | ||||
| 78 | 4.2–5.2 | 2 | ||||
| 11 | [18] | 28 | 34.72, 52.21 | 1.46, 2.19 | Empirical | Nigeria |
| 52.32, 71.63, 71.52 | 2.2, 3, 3.01, 3.9 | |||||
| 12 | [15] | 28 | — | 2 | Empirical | Iraq |
| 13 | [16] | 28 | — | 2 | Empirical | Iraq |
| 73 | — | 2 |
Summary of related works on ray tracing model
| No. | Reference | Frequency in GHz | Environment | Antenna | Model | Model type |
|---|---|---|---|---|---|---|
| 1 | [48] | 28 | Open square – NLOS | — | Ray tracing | Deterministic |
| 2 | [40] | 3.5 | Indoor–LOS & NLOS | Omnidirectional | Ray tracing | Deterministic |
| 3 | [49] | 28 | Open square–LOS and NLOS | — | Ray tracing | Deterministic |
| 4 | [50] | 28 | Urban – LOS | Isotropic | Ray tracing | Deterministic |
| 5 | [51] | 28 | Indoor–LOS and NLOS | Omnidirectional | Ray tracing | Deterministic |
| 6 | [52] | 28 | Outdoor–LOS and NLOS | Omnidirectional | Ray tracing | Deterministic |
| 7 | [53] | 28 | Indoor–LOS and NLOS | Empirical horn 3D-directional | Empirical and ray tracing | Deterministic |
| 8 | [54] | 28 | Outdoor–LOS and NLOS | Ray tracing | Deterministic | |
| 10 | [55] | 5, 30, and 60 | Outdoor, Indoor–NLOS | Directive antenna | Dominate path model | Deterministic |
3 Experimental setup and data collection
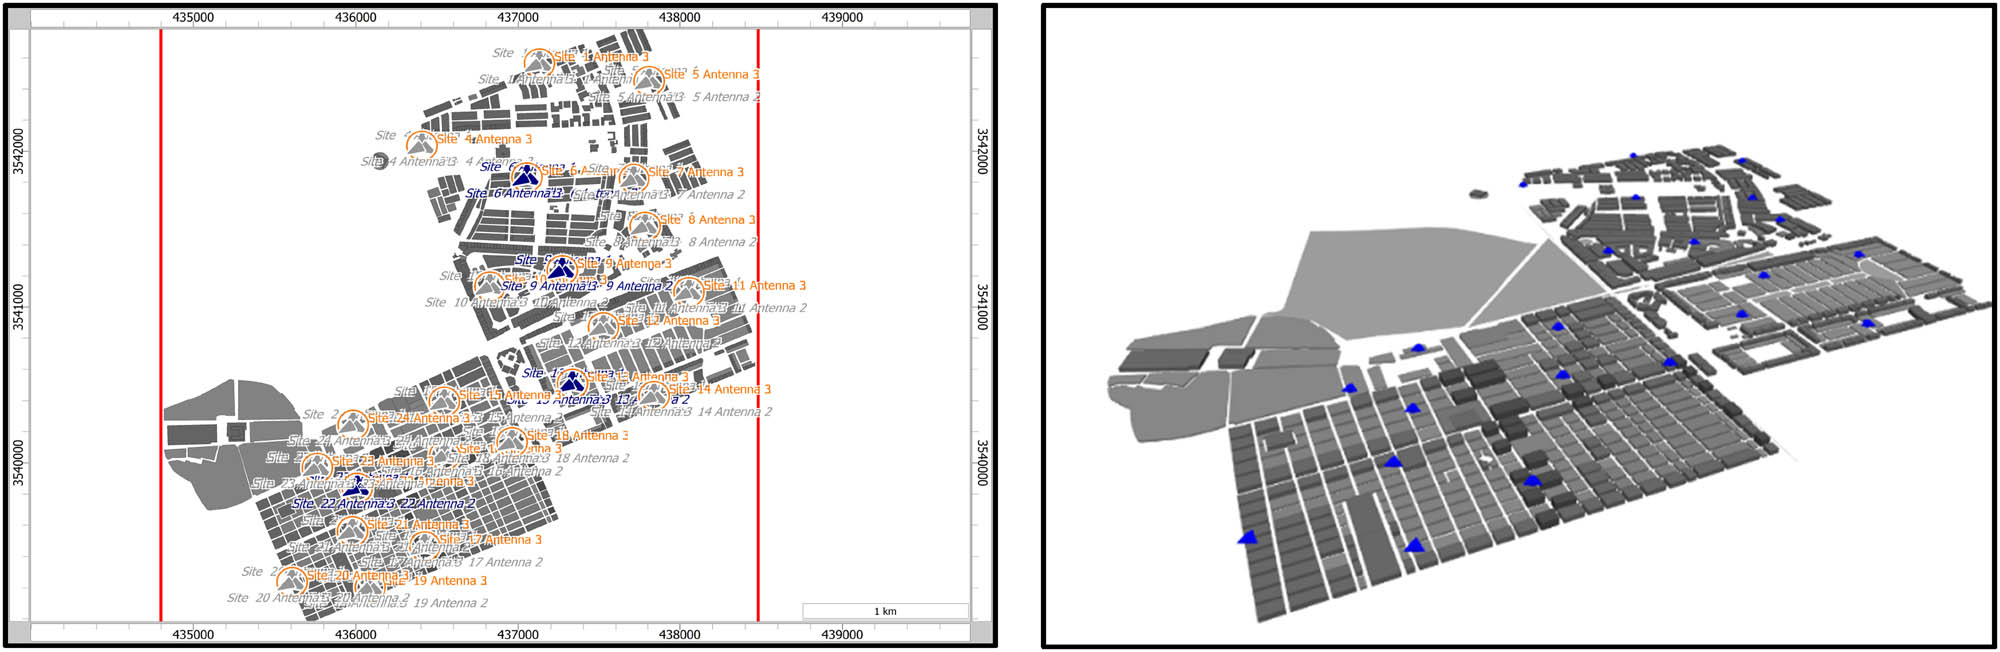
Using a 3D map of Najaf city, Iraq, we provide a large-scale path loss model at 28 GHz, with study area coordinates of 435,000, 3,542,000 to 438,000, 3,540,000. Since the 28 GHz carrier frequency offers a reasonable compromise between the detrimental effects of factors including path loss, rain fading, propagation loss, transmission via vegetation loss, and the atmospheric absorption effect, it was chosen as the optimal frequency. South Korea, Malaysia, the United Kingdom, the United States, China, and Japan have all tested and deployed this frequency range in the outdoors [56]. The carrier frequency of 28 GHz is optimal for tiny cells that operate over short distances, allowing for excellent data throughput [3]. In Figure 1, we see both a 3D map and a satellite image of the area under investigation. Our research region is labeled by the red polygon of 435,000, 3,542,000 to 438,000, 3,540,000. The block diagram of the simulation is illustrated in Figure 2. Obtaining the spatial maps of Najaf city is the initial part of our methodology. The spatial maps are obtained from the geographic information system (GIS) center of Najaf. Najaf databases include the spatial maps of each residential quarter beside any other buildings available in the targeted zone. The provided maps by the GIS center are in 2D, and for our work it needs to be converted in 3D to describe each building height in the tagged zone. Using WinProp WallMan software [57], the spatial maps are going to be simplified. Each building that appears in the targeted zone will obtain its real elevation above the ground to simulate the real urban environment of the city. For simulation, a single-layer dielectric of ITU concrete 28 GHz type was considered for construction appears in the map. Based on the provided data by the Communication and Media Commission, a government institution concerned with regulating media and communications in Iraq, the base stations for one of the well-known service providers in Iraq Zain Company will be utilized during the simulation as demonstrated in Figure 3. After deploying the towers, all parameters regarding each transmitter available in the base station and the receiver will be set as illustrated in Table 3.

The targeted area of the study is in both 2D and 3D views.

The study block diagram.
The available
Simulation parameters of each transmitter
| No. | Parameter | Value |
|---|---|---|
| 1 | Scenario | Urban Macrocell outdoor |
| 2 | Environment | NLOS |
| 3 |
|
30–180 m |
| 4 | Frequency | 28 GHz |
| 5 | Channel bandwidth | 5,000 kHz |
| 6 |
|
40 dBm |
| 7 | Bs antenna gain | 15 dBi |
| 8 | BS/MS height | 30–35/1.5 m |
| 9 | Antenna pattern | Directional sector |
| 10 | Antenna Azimuth | 0, 120, and 240 |
| 11 | Antenna Downtilt | 2 |
Since Iraq is like numerous other countries that have not upgraded yet to 5G furthermore still works with 4G. Therefore, it is impossible to obtain real measurements for 5G networks. A very interesting feature provided by WinProp software is executing virtual drive tests [58–60]. This feature is so useful to our work due to the lack of real measurements for 5G networks in Iraq. After executing the virtual drive test, the received power value for each

The intensity of the received power for one of the deployed

The drive test around the
The incorporation of 3D maps of Najaf city enables a detailed representation of the urban environment, including building heights, which is crucial for accurate path loss modeling in complex urban landscapes. The use of virtual drive test simulations using WinProp software fills the gap of real 5G network measurements in Iraq, providing valuable data for path loss modeling and network optimization. The development of a modified CI path loss model tailored to the specific characteristics of Najaf city at 28 GHz provides a more accurate representation of signal propagation, considering factors like shadow fading and building obstructions.
The performance of each site is demonstrated in Figure 6 since it describes the received power as a function of distance for every transmitter available in the targeted zone. Figure 6 demonstrates how RSS declines with distance, especially in shadowed sites where environmental elements like structures and other obstructions in addition to free space loss are present.

The received power in all sites.
In addition to outlining the experimental setup and data collection procedures, it is pertinent to discuss the computational complexity inherent in implementing the proposed model. The computational demands associated with each stage of the study play a crucial role in the feasibility and efficiency of the research endeavor.
The computational complexity of the model stems from several key components. First, the conversion of 2D maps into detailed 3D representations of the urban environment requires significant computational resources, especially for large study areas such as Najaf city with intricate building structures. This process involves sophisticated algorithms for data interpolation, elevation modeling, and geometric calculations. Furthermore, executing virtual drive test simulations using WinProp software entails intensive computational tasks. These simulations involve complex ray-tracing algorithms and electromagnetic propagation models to calculate received power values for each transmitter at multiple locations within the study area. The high level of detail and accuracy required in these simulations further contributes to the computational complexity. Additionally, the calibration and optimization of the path loss model necessitate extensive computational resources. This involves analyzing simulation results, fitting mathematical models to observed data, and iteratively adjusting model parameters to achieve accurate predictions.
Considering multiple scenarios with different transmitter configurations and antenna patterns adds another layer of computational complexity. Each scenario requires separate simulations and analysis, increasing the overall computational workload. While the exact computational complexity metrics, such as time complexity or resource requirements, may vary depending on specific factors, such as the size of the study area and the precision of simulations, it is evident that implementing the proposed model requires substantial computational resources and efficient algorithms to manage the workload effectively.
4 Radio propagation model
Measuring the behavior of electromagnetic waves has allowed us to characterize their propagation, and using statistical estimates on these measurements has allowed us to build a mathematical model of their behavior. Although mathematical formulations are fairly accurate for prediction, their behavior in authentic environments is not always the same as that given by the generic theoretical model. This is due to the expression does not considering the influences of the real world. To predict the behavior of electromagnetic waves and therefore utilize them as a medium of communication, generic models are utilized in wireless communications. Subsequently, to enhance the dependability of wireless communications, it is necessary to characterize the effects in the actual world.
Because it influences the connection quality, path loss is crucial in a wireless channel. It is a measurement of how much the strength of a signal weakens between its source and its destination. Using Friis’s free space equation, which is shown in 1, it is possible to make an approximation of the relationship between the transmitted and received power
where
Commonly, dB is utilized to quantify the path loss. A formula may be utilized to obtain the path loss value as follows, given equation (1):
where
5 PLE optimization
When transmitting electromagnetic waves across a wireless channel, the strength of those waves declines as the distance between the transmitter and receiver grows larger. This function calculates how much power is lost while a signal travels over a particular or several paths before reaching its destination. The rate of energy loss in both models is approximately proportional to the square of the distance traveled. The PLE factor controls the rate of decrease in this function. Equation (3) is utilized to obtain the average path loss.
where
To calculate the exact distance between each prediction point and
where
where
For the same set of transmitters and receivers, the log-normal distribution describes the shadowing effect as the amount of noise in the communication path varies [61]. If we rewrite equation (3) as follows, we can determine the PLE:
where
where
The values for path loss and standard deviation will fluctuate as a function of environmental variables.
6 Numerical results and discussion
A PLE value is utilized to describe the magnitude of the path loss as a function of the physical distance between the transmitter and receiving stations. The allowable PLE ranges from 2.7 to 3.5 dB in urban regions, 3 to 5 dB in shadowed sites, 2 dB in LoS locations, 4 to 6 dB in a blocked region with factories [18]. When the transmitter and receiver are in boresight alignment, the permissible PLE value for 28 GHz LoS mmWave is between 1.8 and 2.2 dB; conversely, it increases to 4 and 5 dB in non-NLoS scenarios. The accomplished PLE in this study varies from 3.0619 to 4.1253 dB. To calculate the PLE from all the scenarios proposed in this research, the environment of Najaf city was utilized, and the derived PLE is within the range of acceptable PLE. The simulation has measured the received power for 423 points around all the four studied sites. Najaf city is an urban environment with high-rise buildings that cause shadowing and propagation signal obstruction. In this work, each
where
Key path loss model parameters and the recorded average path loss
|
|
|
Average calculated PL (dB) |
|
|
|---|---|---|---|---|
|
|
69.757 | 128.430609 | 3.9202 | 3.4462 |
|
|
77.346 | 127.017059 | 5.6867 | 3.1751 |
|
|
99.65157 | 150.4943903 | 6.8265 | 4.1253 |
Site 6 contains three separated antennas with various azimuth angles (0, 120, and 240). Each

Calculated path loss for site 6 using the modified CI model. (a) Path loss for site 6 antenna 1, (b) path loss for site 6 antenna 2, and (c) path loss for site 6 antenna 3.
Based on the same procedures that are utilized on site 6, the equations of the modified CI path loss model related to site 9 will be generated. The coordinate of site 9 is X = 437271.31, Y = 3541234.63, Z = 30.
The obtained equations for site 13 (X = 437334.01, Y = 3540506.91, Z = 30) based on the averaging of CI path loss model’s parameters are denoted by equations (18)–(20).
The following equations have been utilized for calculating the value of path loss for site 22 (X = 436008.73, Y = 3539839.44, Z = 35) based on the new CI model.
Figures 7–10 show the correlation of the increase in the value of path losses at 28 GHz in conjunction with the increase in the separating distance between the transmitter and the receiver. When comparing the PLE obtained from this study, which ranges between 3.0619 and 4.1253, with the value of the FSPL exponent, which is equal to 2, we find that the difference between the two measurements occurred because of the obstacles between the transmitter and the receiver. The standard deviation values range between 2.4703 and 17.2331. This change in values is due to the different distribution and types of buildings within the transmission medium, which causes various shadowing effects for all scenarios (Tables 5–7).

Calculated path loss for antenna available in site 9. (a) Path loss for site 9 antenna 1, (b) path loss for site 9 antenna 2, and (c) path loss for site 9 antenna 3.

Calculated path loss for the antenna available in site 13. (a) Path loss for site 13 antenna 1, (b) path loss for site 13 antenna 2, and (c) path loss for site 13 antenna 3.

Calculated path loss for the antenna available in site 22. (a) Path loss for site 22 antenna 1, (b) path loss for site 22 antenna 2, and (c) path loss for site 22 antenna 3.
Key path loss model parameters and the recorded average path loss
|
|
|
Average calculated PL (dB) |
|
|
|---|---|---|---|---|
|
|
115.5865382 | 139.4032136 | 15.1046 | 3.0619 |
|
|
159.2926146 | 152.4995947 | 15.8019 | 3.4686 |
|
|
101.6089596 | 145.7665808 | 13.6100 | 3.5466 |
Key path loss model parameters and the recorded average path loss
|
|
|
Average calculated PL (dB) |
|
|
|---|---|---|---|---|
|
|
63.53119567 | 125.9326434 | 2.4703 | 3.4485 |
|
|
114.9022571 | 145.9929742 | 17.1208 | 3.3020 |
|
|
95.31542161 | 135.6185297 | 12.8121 | 3.1230 |
Key path loss model parameters and the recorded average path loss
|
|
|
Average calculated PL (dB) |
|
|
|---|---|---|---|---|
|
|
70.11916057 | 140.7263272 | 10.8265 | 3.7220 |
|
|
90.66635187 | 154.9456395 | 17.2331 | 3.9047 |
|
|
113.4382247 | 139.5246479 | 12.2623 | 3.2185 |
Comparing the accomplished path loss model in this study with some models accomplished by researchers [18,43,63,64,65], the accomplished model reflected its advantage. The PLE values recorded by this work are between 3.0619 and 4.1253. For the scenario of path loss with and without antenna pattern Hinga and Member [18], accomplished PLE values equal to 3.8 and 3.98 in
7 Conclusion
Calibration and tuning are required for the scenario of a field campaign in mmWave band large-scale path loss modeling. The authors of this study have utilized the WinProp intelligent ray tracing, Feko, to simulate a 5G communication testbed for the city of Najaf in Iraq, utilizing a deterministic 3D ray-tracing approach. No previous work of this kind has been done at 28 GHz in the study region; hence, the findings of this study will be of interest to researchers and 5G communication service providers planning to conduct pilot studies or actual implementations. Shadow fading has a significant impact on path loss models in densely populated metropolitan places like Najaf city; therefore, studying its effects is crucial. As compared to previous studies conducted at 28 GHz, the shadow factor reported in our model is an ameliorated model. This framework can serve as a reference for mmWave band researchers concentrating on Najaf City, and it can be adjusted for utilizing in other locations. A genuine LoS and NLoS field campaign at 28 GHz is anticipated for future research. Ongoing research and industry efforts are advancing path loss modeling for 5G networks, particularly in urban environments. Leveraging technologies such as AI, mmWave communications, and network slicing, researchers aim to improve coverage, capacity, and reliability. AI-driven approaches enable precise propagation modeling, while mmWave research focuses on beamforming and channel estimation. Additionally, green communication initiatives promote sustainability and efficiency in network design. Collaborative efforts between academia and industry are crucial for realizing the full potential of 5G connectivity. A similar investigation will be carried out in all of Iraq’s provinces for the purpose of generating an accurate path loss model.
-
Conflict of interest: Authors state no conflict of interest.
-
Data availability statement: Most datasets generated and analyzed in this study are in this submitted manuscript. The other datasets are available on reasonable request from the corresponding author with the attached information.
References
[1] Talib M, Aripin NBM, Othman NS, Sallomi AH. Comprehensive overview on millimeter wave communications for 5G networks concentrating on propagation models for different urban environments. J Phys Conf Ser. 2022;2322(1):1–23. 10.1088/1742-6596/2322/1/012095.Search in Google Scholar
[2] Erunkulu OO. Cellular communications coverage prediction techniques: a survey and comparison. IEEE Access. 2020;8:113052–77. 10.1109/ACCESS.2020.3003247.Search in Google Scholar
[3] Rappaport TS, Sun S, Mayzus R, Zhao H, Azar Y, Wang K, et al. Millimeter wave mobile communications for 5G cellular: It will work! IEEE Access. 2013;1:335–49. 10.1109/ACCESS.2013.2260813.Search in Google Scholar
[4] Koymen OH, Partyka A, Subramanian S, Li J, Sounder AC. Indoor mm-Wave Channel Measurements: Comparative Study of 2. 9 GHz and 29 GHz. 2015 IEEE Global Communications Conference (GLOBECOM); 2015. p. 7–12.10.1109/GLOCOM.2015.7417720Search in Google Scholar
[5] Chen WC. 5G mmWAVE technology design challenges and development trends. 2020 International Symposium on VLSI Design, Automation and Test (VLSI-DAT); 2020. p. 15–8.10.1109/VLSI-DAT49148.2020.9196316Search in Google Scholar
[6] Mao X, Jin J, Yang J. Wireless channel modeling methods: classification. Comp Appl. 2010;1669–73.10.1109/ICCSE.2010.5593620Search in Google Scholar
[7] Luebbers R. Propagation prediction for hilly terrain using GTD wedge diffraction. IEEE Trans Antennas Propag. 1984;9:951–5.10.1109/TAP.1984.1143449Search in Google Scholar
[8] Hufford GA. An integral equation approach to the problem of wave propagation over an irregular surface. Q Appl Math. 1952;2:391–404.10.1090/qam/44350Search in Google Scholar
[9] Shishegar VMAA. Modified wavefront decomposition method for fast and accurate ray-tracing simulation. IET Microwaves, Antennas Propag. October 2011;6:295. 10.1049/iet-map.2011.0264.Search in Google Scholar
[10] Zelley CA, Constantinou CC. A three-dimensional parabolic equation applied to VHF/UHF propagation over irregular terrain. IEEE Trans Antennas Propag. 1999;47(10):1586–96.10.1109/8.805904Search in Google Scholar
[11] Vehicular TON. Empirical formula for propagation loss in land mobile radio services. IEEE Trans Veh Technol. 1980;V(3):317–25.10.1109/T-VT.1980.23859Search in Google Scholar
[12] Popoola SI, Oseni OF. Performance evaluation of radio propagation models on GSM network in Urban Area of Lagos, Nigeria. Int J Sci Eng Res. 2014;5(6):1212–7.Search in Google Scholar
[13] Andreev RVAAV. COST 231 Hata adaptation model for urban conditions in LTE networks. 2016 17th International Conference of Young Specialists on Micro/Nanotechnologies and Electron Devices (EDM); 2016. p. 64–6.Search in Google Scholar
[14] Cheerla S, Ratnam DV, Dabbakuti JRKK. An Optimized path loss model for urban wireless channels, in microelectronics, electromagnetics and telecommunications. Lecture Notes in Electrical Engineering. Springer: Singapore; p. 293–301. 10.1007/978-981-15-3828-5.Search in Google Scholar
[15] Al-shuwaili A. 5G channel characterization at millimeter-wave for Baghdad City: An NYUSIM-based Approach, in 2021 18th International Multi-Conference on Systems. Signals & Devices; 2021. p. 468–73. 10.1109/SSD52085.2021.9429348.Search in Google Scholar
[16] Jamel TM. Optimum and Appropriate 5G Millimeter Wave Frequencies for Baghdad City. The 3rd Conference of Post Graduate Researches & Graduation Projects CPGR′2021; 2021.Search in Google Scholar
[17] Rappaport TS, MacCartney GR, Samimi MK, Sun S. Wideband millimeter-wave propagation measurements and channel models for future wireless communication system design. IEEE Trans Commun. 2020;63(9):3029–56. 10.1109/TCOMM.2015.2434384.Search in Google Scholar
[18] Hinga SK, Member GS. Deterministic 5G mmWave large-Scale 3D path loss model for Lagos Island, Nigeria. IEEE Access. 2021;9. 134270–88. 10.1109/ACCESS.2021.3114771.Search in Google Scholar
[19] Phillips C, Sicker D, Grunwald D. A Survey of wireless path loss prediction and coverage mapping methods. IEEE Commun Surv Tutor. 2013;15(1):255–70.10.1109/SURV.2012.022412.00172Search in Google Scholar
[20] Al-samman AM, Rahman TA, Hindia MHDN, Daho A. Path Loss model for outdoor parking environments at 28 GHz and 38 GHz for 5G wireless networks. Symmetry (Basel). 2018;10:672. 10.3390/sym10120672.Search in Google Scholar
[21] Popoola SI, Atayero AA, Popoola OA. Data in brief comparative assessment of data obtained using empirical models for path loss predictions in a university campus environment. Data Br. 2018;18:380–93. 10.1016/j.dib.2018.03.040.Search in Google Scholar PubMed PubMed Central
[22] Shehzad K, Khan NM, Ahmed J. Performance analysis of coverage-centric heterogeneous cellular networks using dual-slope path loss model. Comput Networks. October 2020;185:107672. 10.1016/j.comnet.2020.107672.Search in Google Scholar
[23] Al-samman AM, Rahman TA, Azmi MH, Hindia MN. International Journal of Electronics and Communications (AEÜ) Large-scale path loss models and time dispersion in an outdoor line-of-sight environment for 5G wireless communications. AEUE - Int J Electron Commun. 2016;70(11):1515–21. 10.1016/j.aeue.2016.09.009.Search in Google Scholar
[24] Elizabeth FQ, Grøtli EI, Johansen TA. Task assignment for cooperating UAVs under radio propagation path loss constraints. 2012 American Control Conference (ACC). IEEE; 2012. p. 3278–83.10.1109/ACC.2012.6315041Search in Google Scholar
[25] Anusha VS, Nithya GK, Rao SN. A comprehensive survey of electromagnetic propagation models. 2017 International Conference on Communication and Signal Processing (ICCSP); 2017. p. 1457–62.10.1109/ICCSP.2017.8286627Search in Google Scholar
[26] Sarkar TK, Abdallah MN, Salazar-palma M. Survey of available experimental data of radio wave propagation for wireless transmission. IEEE Trans Antennas Propag. 2018;66(12):6665–72.10.1109/TAP.2018.2878108Search in Google Scholar
[27] Sasidhar K. A survey based analysis of propagation models over the sea. 2015 International Conference on Advances in Computing, Communications and Informatics (ICACCI). Kochi, India: IEEE; 2015.Search in Google Scholar
[28] Hrovat A, Kandus G, Member S. A survey of radio propagation modeling for tunnels. 2014;16(2):658–69. 10.1109/SURV.2013.091213.00175.Search in Google Scholar
[29] Ahmadien O, Ates HF, Member S. Predicting path loss distribution of an area from satellite images using deep learning. IEEE Access. 2020;8:64982–91. 10.1109/ACCESS.2020.2985929.Search in Google Scholar
[30] Wu L, Member S, He D. Artificial neural network based path loss prediction for wireless communication network. IEEE Access. 2020;8:199523–38. 10.1109/ACCESS.2020.3035209.Search in Google Scholar
[31] Ates HF, Member S, Hashir SM. Path loss exponent and shadowing factor prediction from satellite images using deep learning. IEEE Access. 2019;7:101366–75.10.1109/ACCESS.2019.2931072Search in Google Scholar
[32] Seidel SY, Rappaport TS. A ray tracing technique to predict path loss and delay spread inside. GLOBECOM ’92 - Communications for Global Users. IEEE; 1992. p. 2–6.Search in Google Scholar
[33] Charitos M et al. LTE-A virtual drive testing for vehicular environments. 2017 IEEE 85th Vehicular Technology Conference (VTC Spring); 2017. p. 2–6.10.1109/VTCSpring.2017.8108512Search in Google Scholar
[34] Thrane J, Member S, Zibar D. Model-aided deep learning method for path loss prediction in mobile communication systems at 2. 6 GHz. IEEE Access. 2020;8:7925–36.10.1109/ACCESS.2020.2964103Search in Google Scholar
[35] Han SY, Abu-ghazaleh NB, Lee D. Efficient and consistent path loss model for mobile network simulation. IEEE/ACM Trans Netw. 2016;24(3):1774–86.10.1109/TNET.2015.2431852Search in Google Scholar
[36] Ju S, Kanhere O, Xing Y, Rappaport TS. A millimeter-wave channel simulator NYUSIM with spatial consistency and human blockage. 2019 IEEE Glob Commun Conf GLOBECOM 2019 - Proc; 2019. p. 1–6. 10.1109/GLOBECOM38437.2019.9013273.Search in Google Scholar
[37] Maccartney GR, Member S. Indoor office wideband millimeter-wave propagation measurements and channel models at 28 and 73 GHz for ultra-dense 5G wireless networks. IEEE Access. 2015;3. 2388–24. 10.1109/ACCESS.2015.2486778.Search in Google Scholar
[38] Sun S, Rappaport TS, Thomas TA, Ghosh A, Nguyen HC, Kovacs IZ, et al. Investigation of prediction accuracy, sensitivity, and parameter stability of large-scale propagation path loss models for 5G wireless communications. IEEE Trans Veh Technol. 2016;65(5):2843–60. 10.1109/TVT.2016.2543139.Search in Google Scholar
[39] Bhuvaneshwari A, Hemalatha R, Satyasavithri T. Semi deterministic hybrid model for path loss prediction improvement. Procedia – Procedia Comput Sci. 2016;92:336–44. 10.1016/j.procs.2016.07.388.Search in Google Scholar
[40] Al-samman AM, Azmi MH, Al-hadhrami T. Millimeter wave propagation measurements and characteristics for 5G system. Appl Sci. 2019;10:1–17.10.3390/app10010335Search in Google Scholar
[41] Al-samman AM, Rahman TA, Al-hadhrami T. Comparative study of indoor propagation model below and above 6 GHz for 5G wireless networks. Electronics. 2019;8:1–26. 10.3390/8010044.Search in Google Scholar
[42] Adegoke EI, Kampert E, Higgins MD. Empirical indoor path loss models at 3. 5GHz for 5G communications network planning; 2020. p. 1–4.10.1109/UCET51115.2020.9205413Search in Google Scholar
[43] Adegoke EI, Kampert E, Higgins MD, Member S. Channel modeling and over-the-air signal quality at 3. 5 GHz for 5G new radio. IEEE Access. 2021;9:11183–93. 10.1109/ACCESS.2021.3051487.Search in Google Scholar
[44] Al-samman AM, Rahman TA, Azmi MH, Sharaf A, Yamada Y, Alhammadi A. Path loss model in indoor environment at 40 GHz for 5G wireless network. 2018 IEEE 14th International Colloquium on Signal Processing & Its Applications (CSPA). Penang, Malaysia: IEEE; 2018. p. 9–10.10.1109/CSPA.2018.8368676Search in Google Scholar
[45] Li S, Liu Y, Lin L, Sun D, Yang S, Sun X. Simulation and modeling of millimeter-wave channel at 60 GHz in indoor environment for 5G wireless communication system. 2018 IEEE International Conference on Computational Electromagnetics (ICCEM). IEEE; 2018. p. 5–7.10.1109/COMPEM.2018.8496691Search in Google Scholar
[46] Jr GRM, Rappaport TS, Samimi MK, Sun S. Millimeter wave omnidirectional path loss data for small cell 5G channel modeling. IEEE Access. Vol. 3536, 2015. 10.1109/ACCESS.2015.2465848.Search in Google Scholar
[47] Lee J, Liang J, Kim M, Park J, Park B, Chung HK. Measurement-based propagation channel characteristics for millimeter-wave 5G giga communication systems. ETRI J. 2016;38(6):1031–41.10.4218/etrij.16.2716.0050Search in Google Scholar
[48] Kuno N, Yamada W, Sasaki M, Taratori Y. Convolutional neural network for prediction method of path loss characteristics considering diffraction and reflection in an open-square environment. 2019 URSI Asia-Pacific Radio Sci Conf AP-RASC 2019; 2019. p. 4–6. 10.23919/URSIAP-RASC.2019.8738299.Search in Google Scholar
[49] Chunyu Ge XJ, Zhang Y. Simulation and analysis of 28GHz millimeter-wave propagation characteristics in typical residential house environment. 11th UK-Europe-China Workshop on Millimeter Waves and Terahertz Technologies (UCMMT); 2018. p. 7–9.Search in Google Scholar
[50] Kitao K, Benjebbour A, Imai T, Kishiyama Y, Inomata M, Okumura Y. 5G system evaluation tool. in 2018 IEEE International workshop on electromagnetics: Applications and student innovation competition (iWEM). IEEE; 2018. p. 30–1.10.1109/iWEM.2018.8536617Search in Google Scholar
[51] Hossain F, Geok T, Rahman T, Hindia M, Dimyati K, Ahmed S, et al. An efficient 3-D ray tracing method: prediction of indoor radio propagation at 28 GHz in 5G network. Electron. 2019;8:286. 10.3390/electronics8030286.Search in Google Scholar
[52] Yang C, Ieee M, Wu B, Ko C. A ray-tracing method for modeling indoor wave propagation and penetration. IEEE Trans Antennas Propag. 1998;46(6):907–19.10.1109/8.686780Search in Google Scholar
[53] Modeling IP, Introduction I, Tooth B, Pilot P. Efficient implementation of deterministic 3-D ray tracing model to predict propagation losses in indoor environments. The 13th IEEE International Symposium on Personal, Indoor and Mobile Radio Communications; 2002.Search in Google Scholar
[54] Díaz VV. A path loss simulator for the 3GPP 5G channel models. 2018 IEEE XXV International Conference on Electronics, Electrical Engineering and Computing (INTERCON); 2018. p. 7–10.10.1109/INTERCON.2018.8526374Search in Google Scholar
[55] Dupleich D, Abbas Mir H, Schneider C, Del Galdo G, Thoma R. On the modelling of the NLOS first multi-path component in stochastic spatial channel models. 15th Eur Conf Antennas Propagation, EuCAP 2021; 2021. 10.23919/EuCAP51087.2021.9411142.Search in Google Scholar
[56] Major International 5G Trials and Pilots – 5G Observatory. https://5gobservatory.eu/5g-trial/major-international-5g-trials-and-pilots/(accessed Feb. 15, 2023).Search in Google Scholar
[57] Lubke M, Dimce S, Schettler M, Lurz F, Weigel R, Dressler F. Comparing mmWave channel simulators in vehicular environments. IEEE Veh Technol Conf; 2021-April. 10.1109/VTC2021-Spring51267.2021.9448732.Search in Google Scholar
[58] Krause A, Anwar W, Martinez AB, Stachorra D, Fettweis G, Franchi N. Network planning and coverage optimization for mobile campus networks. Proc – 2021 IEEE 4th 5G World Forum, 5GWF 2021; 2021. p. 305–10. 10.1109/5GWF52925.2021.00060.Search in Google Scholar
[59] Hoppe R, Wolfle G, Jakobus U. Wave propagation and radio network planning software WinProp added to the electromagnetic solver package FEKO. 2017 Int Appl Comput Electromagn Soc Symp – Italy, ACES 2017; 2017. p. 3–4. 10.23919/ROPACES.2017.7916282.Search in Google Scholar
[60] Ußler H, Setzefand C, Kanis D, Schwarzbach P, Michler O. Efficient coverage planning for full-area C-ITS communications based on radio propagation simulation and measurement tools. 27th ITS World Congress; 2021. p. 11–5.Search in Google Scholar
[61] Miranda J et al. Path loss exponent analysis in wireless sensor networks: Experimental evaluation. IEEE Int Conf Ind Informatics; 2013. p. 54–8 10.1109/INDIN.2013.6622857.Search in Google Scholar
[62] Nsaif BG, Sallomi AH. Path loss modeling for urban wirless networks in Baghdad. J Eng Sustain Dev. 2021;25:1–7. 10.31272/jeasd.conf.2.1.2.Search in Google Scholar
[63] Jr GRM, Zhang J, Nie S, Rappaport TS. Path loss models for 5G millimeter wave propagation channels in urban microcells. 2013 11th IEEE International Conference on Industrial Informatics (INDIN). IEEE; 2013. p. 3948–53.Search in Google Scholar
[64] Maccartney GR, Rappaport TS, Samimi MK, Sun SHU. Millimeter-wave omnidirectional path loss data for small cell 5G channel modeling. IEEE Access. 2015;3:1573–80. 10.1109/ACCESS.2015.2465848.Search in Google Scholar
[65] Environment O. Investigation of future 5G-IoT millimeter-wave network performance at 38 GHz for Urban microcell. Electron. 2019.Search in Google Scholar
© 2024 the author(s), published by De Gruyter
This work is licensed under the Creative Commons Attribution 4.0 International License.
Articles in the same Issue
- Regular Articles
- Methodology of automated quality management
- Influence of vibratory conveyor design parameters on the trough motion and the self-synchronization of inertial vibrators
- Application of finite element method in industrial design, example of an electric motorcycle design project
- Correlative evaluation of the corrosion resilience and passivation properties of zinc and aluminum alloys in neutral chloride and acid-chloride solutions
- Will COVID “encourage” B2B and data exchange engineering in logistic firms?
- Influence of unsupported sleepers on flange climb derailment of two freight wagons
- A hybrid detection algorithm for 5G OTFS waveform for 64 and 256 QAM with Rayleigh and Rician channels
- Effect of short heat treatment on mechanical properties and shape memory properties of Cu–Al–Ni shape memory alloy
- Exploring the potential of ammonia and hydrogen as alternative fuels for transportation
- Impact of insulation on energy consumption and CO2 emissions in high-rise commercial buildings at various climate zones
- Advanced autopilot design with extremum-seeking control for aircraft control
- Adaptive multidimensional trust-based recommendation model for peer to peer applications
- Effects of CFRP sheets on the flexural behavior of high-strength concrete beam
- Enhancing urban sustainability through industrial synergy: A multidisciplinary framework for integrating sustainable industrial practices within urban settings – The case of Hamadan industrial city
- Advanced vibrant controller results of an energetic framework structure
- Application of the Taguchi method and RSM for process parameter optimization in AWSJ machining of CFRP composite-based orthopedic implants
- Improved correlation of soil modulus with SPT N values
- Technologies for high-temperature batch annealing of grain-oriented electrical steel: An overview
- Assessing the need for the adoption of digitalization in Indian small and medium enterprises
- A non-ideal hybridization issue for vertical TFET-based dielectric-modulated biosensor
- Optimizing data retrieval for enhanced data integrity verification in cloud environments
- Performance analysis of nonlinear crosstalk of WDM systems using modulation schemes criteria
- Nonlinear finite-element analysis of RC beams with various opening near supports
- Thermal analysis of Fe3O4–Cu/water over a cone: a fractional Maxwell model
- Radial–axial runner blade design using the coordinate slice technique
- Theoretical and experimental comparison between straight and curved continuous box girders
- Effect of the reinforcement ratio on the mechanical behaviour of textile-reinforced concrete composite: Experiment and numerical modeling
- Experimental and numerical investigation on composite beam–column joint connection behavior using different types of connection schemes
- Enhanced performance and robustness in anti-lock brake systems using barrier function-based integral sliding mode control
- Evaluation of the creep strength of samples produced by fused deposition modeling
- A combined feedforward-feedback controller design for nonlinear systems
- Effect of adjacent structures on footing settlement for different multi-building arrangements
- Analyzing the impact of curved tracks on wheel flange thickness reduction in railway systems
- Review Articles
- Mechanical and smart properties of cement nanocomposites containing nanomaterials: A brief review
- Applications of nanotechnology and nanoproduction techniques
- Relationship between indoor environmental quality and guests’ comfort and satisfaction at green hotels: A comprehensive review
- Communication
- Techniques to mitigate the admission of radon inside buildings
- Erratum
- Erratum to “Effect of short heat treatment on mechanical properties and shape memory properties of Cu–Al–Ni shape memory alloy”
- Special Issue: AESMT-3 - Part II
- Integrated fuzzy logic and multicriteria decision model methods for selecting suitable sites for wastewater treatment plant: A case study in the center of Basrah, Iraq
- Physical and mechanical response of porous metals composites with nano-natural additives
- Special Issue: AESMT-4 - Part II
- New recycling method of lubricant oil and the effect on the viscosity and viscous shear as an environmentally friendly
- Identify the effect of Fe2O3 nanoparticles on mechanical and microstructural characteristics of aluminum matrix composite produced by powder metallurgy technique
- Static behavior of piled raft foundation in clay
- Ultra-low-power CMOS ring oscillator with minimum power consumption of 2.9 pW using low-voltage biasing technique
- Using ANN for well type identifying and increasing production from Sa’di formation of Halfaya oil field – Iraq
- Optimizing the performance of concrete tiles using nano-papyrus and carbon fibers
- Special Issue: AESMT-5 - Part II
- Comparative the effect of distribution transformer coil shape on electromagnetic forces and their distribution using the FEM
- The complex of Weyl module in free characteristic in the event of a partition (7,5,3)
- Restrained captive domination number
- Experimental study of improving hot mix asphalt reinforced with carbon fibers
- Asphalt binder modified with recycled tyre rubber
- Thermal performance of radiant floor cooling with phase change material for energy-efficient buildings
- Surveying the prediction of risks in cryptocurrency investments using recurrent neural networks
- A deep reinforcement learning framework to modify LQR for an active vibration control applied to 2D building models
- Evaluation of mechanically stabilized earth retaining walls for different soil–structure interaction methods: A review
- Assessment of heat transfer in a triangular duct with different configurations of ribs using computational fluid dynamics
- Sulfate removal from wastewater by using waste material as an adsorbent
- Experimental investigation on strengthening lap joints subjected to bending in glulam timber beams using CFRP sheets
- A study of the vibrations of a rotor bearing suspended by a hybrid spring system of shape memory alloys
- Stability analysis of Hub dam under rapid drawdown
- Developing ANFIS-FMEA model for assessment and prioritization of potential trouble factors in Iraqi building projects
- Numerical and experimental comparison study of piled raft foundation
- Effect of asphalt modified with waste engine oil on the durability properties of hot asphalt mixtures with reclaimed asphalt pavement
- Hydraulic model for flood inundation in Diyala River Basin using HEC-RAS, PMP, and neural network
- Numerical study on discharge capacity of piano key side weir with various ratios of the crest length to the width
- The optimal allocation of thyristor-controlled series compensators for enhancement HVAC transmission lines Iraqi super grid by using seeker optimization algorithm
- Numerical and experimental study of the impact on aerodynamic characteristics of the NACA0012 airfoil
- Effect of nano-TiO2 on physical and rheological properties of asphalt cement
- Performance evolution of novel palm leaf powder used for enhancing hot mix asphalt
- Performance analysis, evaluation, and improvement of selected unsignalized intersection using SIDRA software – Case study
- Flexural behavior of RC beams externally reinforced with CFRP composites using various strategies
- Influence of fiber types on the properties of the artificial cold-bonded lightweight aggregates
- Experimental investigation of RC beams strengthened with externally bonded BFRP composites
- Generalized RKM methods for solving fifth-order quasi-linear fractional partial differential equation
- An experimental and numerical study investigating sediment transport position in the bed of sewer pipes in Karbala
- Role of individual component failure in the performance of a 1-out-of-3 cold standby system: A Markov model approach
- Implementation for the cases (5, 4) and (5, 4)/(2, 0)
- Center group actions and related concepts
- Experimental investigation of the effect of horizontal construction joints on the behavior of deep beams
- Deletion of a vertex in even sum domination
- Deep learning techniques in concrete powder mix designing
- Effect of loading type in concrete deep beam with strut reinforcement
- Studying the effect of using CFRP warping on strength of husk rice concrete columns
- Parametric analysis of the influence of climatic factors on the formation of traditional buildings in the city of Al Najaf
- Suitability location for landfill using a fuzzy-GIS model: A case study in Hillah, Iraq
- Hybrid approach for cost estimation of sustainable building projects using artificial neural networks
- Assessment of indirect tensile stress and tensile–strength ratio and creep compliance in HMA mixes with micro-silica and PMB
- Density functional theory to study stopping power of proton in water, lung, bladder, and intestine
- A review of single flow, flow boiling, and coating microchannel studies
- Effect of GFRP bar length on the flexural behavior of hybrid concrete beams strengthened with NSM bars
- Exploring the impact of parameters on flow boiling heat transfer in microchannels and coated microtubes: A comprehensive review
- Crumb rubber modification for enhanced rutting resistance in asphalt mixtures
- Special Issue: AESMT-6
- Design of a new sorting colors system based on PLC, TIA portal, and factory I/O programs
- Forecasting empirical formula for suspended sediment load prediction at upstream of Al-Kufa barrage, Kufa City, Iraq
- Optimization and characterization of sustainable geopolymer mortars based on palygorskite clay, water glass, and sodium hydroxide
- Sediment transport modelling upstream of Al Kufa Barrage
- Study of energy loss, range, and stopping time for proton in germanium and copper materials
- Effect of internal and external recycle ratios on the nutrient removal efficiency of anaerobic/anoxic/oxic (VIP) wastewater treatment plant
- Enhancing structural behaviour of polypropylene fibre concrete columns longitudinally reinforced with fibreglass bars
- Sustainable road paving: Enhancing concrete paver blocks with zeolite-enhanced cement
- Evaluation of the operational performance of Karbala waste water treatment plant under variable flow using GPS-X model
- Design and simulation of photonic crystal fiber for highly sensitive chemical sensing applications
- Optimization and design of a new column sequencing for crude oil distillation at Basrah refinery
- Inductive 3D numerical modelling of the tibia bone using MRI to examine von Mises stress and overall deformation
- An image encryption method based on modified elliptic curve Diffie-Hellman key exchange protocol and Hill Cipher
- Experimental investigation of generating superheated steam using a parabolic dish with a cylindrical cavity receiver: A case study
- Effect of surface roughness on the interface behavior of clayey soils
- Investigated of the optical properties for SiO2 by using Lorentz model
- Measurements of induced vibrations due to steel pipe pile driving in Al-Fao soil: Effect of partial end closure
- Experimental and numerical studies of ballistic resistance of hybrid sandwich composite body armor
- Evaluation of clay layer presence on shallow foundation settlement in dry sand under an earthquake
- Optimal design of mechanical performances of asphalt mixtures comprising nano-clay additives
- Advancing seismic performance: Isolators, TMDs, and multi-level strategies in reinforced concrete buildings
- Predicted evaporation in Basrah using artificial neural networks
- Energy management system for a small town to enhance quality of life
- Numerical study on entropy minimization in pipes with helical airfoil and CuO nanoparticle integration
- Equations and methodologies of inlet drainage system discharge coefficients: A review
- Thermal buckling analysis for hybrid and composite laminated plate by using new displacement function
- Investigation into the mechanical and thermal properties of lightweight mortar using commercial beads or recycled expanded polystyrene
- Experimental and theoretical analysis of single-jet column and concrete column using double-jet grouting technique applied at Al-Rashdia site
- The impact of incorporating waste materials on the mechanical and physical characteristics of tile adhesive materials
- Seismic resilience: Innovations in structural engineering for earthquake-prone areas
- Automatic human identification using fingerprint images based on Gabor filter and SIFT features fusion
- Performance of GRKM-method for solving classes of ordinary and partial differential equations of sixth-orders
- Visible light-boosted photodegradation activity of Ag–AgVO3/Zn0.5Mn0.5Fe2O4 supported heterojunctions for effective degradation of organic contaminates
- Production of sustainable concrete with treated cement kiln dust and iron slag waste aggregate
- Key effects on the structural behavior of fiber-reinforced lightweight concrete-ribbed slabs: A review
- A comparative analysis of the energy dissipation efficiency of various piano key weir types
- Special Issue: Transport 2022 - Part II
- Variability in road surface temperature in urban road network – A case study making use of mobile measurements
- Special Issue: BCEE5-2023
- Evaluation of reclaimed asphalt mixtures rejuvenated with waste engine oil to resist rutting deformation
- Assessment of potential resistance to moisture damage and fatigue cracks of asphalt mixture modified with ground granulated blast furnace slag
- Investigating seismic response in adjacent structures: A study on the impact of buildings’ orientation and distance considering soil–structure interaction
- Improvement of porosity of mortar using polyethylene glycol pre-polymer-impregnated mortar
- Three-dimensional analysis of steel beam-column bolted connections
- Assessment of agricultural drought in Iraq employing Landsat and MODIS imagery
- Performance evaluation of grouted porous asphalt concrete
- Optimization of local modified metakaolin-based geopolymer concrete by Taguchi method
- Effect of waste tire products on some characteristics of roller-compacted concrete
- Studying the lateral displacement of retaining wall supporting sandy soil under dynamic loads
- Seismic performance evaluation of concrete buttress dram (Dynamic linear analysis)
- Behavior of soil reinforced with micropiles
- Possibility of production high strength lightweight concrete containing organic waste aggregate and recycled steel fibers
- An investigation of self-sensing and mechanical properties of smart engineered cementitious composites reinforced with functional materials
- Forecasting changes in precipitation and temperatures of a regional watershed in Northern Iraq using LARS-WG model
- Experimental investigation of dynamic soil properties for modeling energy-absorbing layers
- Numerical investigation of the effect of longitudinal steel reinforcement ratio on the ductility of concrete beams
- An experimental study on the tensile properties of reinforced asphalt pavement
- Self-sensing behavior of hot asphalt mixture with steel fiber-based additive
- Behavior of ultra-high-performance concrete deep beams reinforced by basalt fibers
- Optimizing asphalt binder performance with various PET types
- Investigation of the hydraulic characteristics and homogeneity of the microstructure of the air voids in the sustainable rigid pavement
- Enhanced biogas production from municipal solid waste via digestion with cow manure: A case study
- Special Issue: AESMT-7 - Part I
- Preparation and investigation of cobalt nanoparticles by laser ablation: Structure, linear, and nonlinear optical properties
- Seismic analysis of RC building with plan irregularity in Baghdad/Iraq to obtain the optimal behavior
- The effect of urban environment on large-scale path loss model’s main parameters for mmWave 5G mobile network in Iraq
- Formatting a questionnaire for the quality control of river bank roads
- Vibration suppression of smart composite beam using model predictive controller
- Machine learning-based compressive strength estimation in nanomaterial-modified lightweight concrete
- In-depth analysis of critical factors affecting Iraqi construction projects performance
- Behavior of container berth structure under the influence of environmental and operational loads
- Energy absorption and impact response of ballistic resistance laminate
- Effect of water-absorbent polymer balls in internal curing on punching shear behavior of bubble slabs
- Effect of surface roughness on interface shear strength parameters of sandy soils
- Evaluating the interaction for embedded H-steel section in normal concrete under monotonic and repeated loads
- Estimation of the settlement of pile head using ANN and multivariate linear regression based on the results of load transfer method
- Enhancing communication: Deep learning for Arabic sign language translation
- A review of recent studies of both heat pipe and evaporative cooling in passive heat recovery
- Effect of nano-silica on the mechanical properties of LWC
- An experimental study of some mechanical properties and absorption for polymer-modified cement mortar modified with superplasticizer
- Digital beamforming enhancement with LSTM-based deep learning for millimeter wave transmission
- Developing an efficient planning process for heritage buildings maintenance in Iraq
- Design and optimization of two-stage controller for three-phase multi-converter/multi-machine electric vehicle
- Evaluation of microstructure and mechanical properties of Al1050/Al2O3/Gr composite processed by forming operation ECAP
- Calculations of mass stopping power and range of protons in organic compounds (CH3OH, CH2O, and CO2) at energy range of 0.01–1,000 MeV
- Investigation of in vitro behavior of composite coating hydroxyapatite-nano silver on 316L stainless steel substrate by electrophoretic technic for biomedical tools
- A review: Enhancing tribological properties of journal bearings composite materials
- Improvements in the randomness and security of digital currency using the photon sponge hash function through Maiorana–McFarland S-box replacement
- Design a new scheme for image security using a deep learning technique of hierarchical parameters
- Special Issue: ICES 2023
- Comparative geotechnical analysis for ultimate bearing capacity of precast concrete piles using cone resistance measurements
- Visualizing sustainable rainwater harvesting: A case study of Karbala Province
- Geogrid reinforcement for improving bearing capacity and stability of square foundations
- Evaluation of the effluent concentrations of Karbala wastewater treatment plant using reliability analysis
- Adsorbent made with inexpensive, local resources
- Effect of drain pipes on seepage and slope stability through a zoned earth dam
- Sediment accumulation in an 8 inch sewer pipe for a sample of various particles obtained from the streets of Karbala city, Iraq
- Special Issue: IETAS 2024 - Part I
- Analyzing the impact of transfer learning on explanation accuracy in deep learning-based ECG recognition systems
- Effect of scale factor on the dynamic response of frame foundations
- Improving multi-object detection and tracking with deep learning, DeepSORT, and frame cancellation techniques
- The impact of using prestressed CFRP bars on the development of flexural strength
- Assessment of surface hardness and impact strength of denture base resins reinforced with silver–titanium dioxide and silver–zirconium dioxide nanoparticles: In vitro study
- A data augmentation approach to enhance breast cancer detection using generative adversarial and artificial neural networks
- Modification of the 5D Lorenz chaotic map with fuzzy numbers for video encryption in cloud computing
- Special Issue: 51st KKBN - Part I
- Evaluation of static bending caused damage of glass-fiber composite structure using terahertz inspection