Research on IoT network performance prediction model of power grid warehouse based on nonlinear GA-BP neural network
-
Lele Pang


Abstract
This study introduces a novel approach for forecasting network performance prediction in power grid warehouses, employing a nonlinear Genetic Algorithm (GA)-optimized backpropagation (BP) neural network model. The proposed model integrates the global search capability of GA with the learning efficiency of BP neural networks, thereby addressing the common issue of local optima encountered in traditional BP-based prediction models. The model is designed to capture the intricate dynamics of IoT networks in power grid environments by incorporating multiple critical factors that influence network performance, including signal strength, transmission delay, packet loss rate, and other vital indicators. This comprehensive approach enables the simulation of complex network behaviors, enhancing the model’s predictive accuracy and adaptability. The GA-BP model demonstrates superior performance over conventional BP and other methods, showcasing higher prediction accuracy and faster convergence. In the context of power grid warehouses, the model achieves a remarkable accuracy of 96.7%, an 8% improvement over standard BP. Notably, during peak evening hours from 18:00 to 22:00, when network loads are at their highest, the model maintains a stable prediction accuracy of over 98%, effectively supporting the intelligent management and optimal scheduling of power grid warehouses. To ensure the model’s applicability across various scenarios, the study verifies its scalability and robustness, proving its suitability for IoT systems in power grid warehouses of differing scales and complexities. This comprehensive verification, establish a grid warehouse model that accurately reflects the actual operation logic, and provide decision support for material management and allocation content.
1 Introduction
With the rapid development of information technology, the Internet of Things (IoT) has become the core force promoting social intelligence [1,2]. As one of the critical scenarios of IoT applications, power grid warehouse management systems are facing unprecedented challenges and opportunities. In this context, how to effectively use advanced computational models to optimize the performance of IoT networks in power grid warehouses has become a hot and challenging point in current research.
Traditional network performance prediction methods are often based on simplified mathematical models or empirical rules, which must be revised when dealing with complex network behaviors [3]. With the rise of technology, neural network models have gradually become a powerful tool for solving such problems due to their powerful feature extraction and nonlinear mapping capabilities. However, standard neural network models tend to fall into local optimal solutions during training and are sensitive to initial parameter selection, which limits their effectiveness in practical applications.
To solve existing problems, we propose the GA-BP (Genetic Algorithms-Backpropagation) model based on nonlinear genetic algorithm optimization, which aims to improve the accuracy of IoT network performance prediction in power grid warehouses. Compared with traditional neural network algorithms, GA-BP neural networks can solve nonlinear problems, have more stable modeling models, achieve preset goals more times, have fewer iteration steps for fitting data and achieve preset goals faster and with better data fitting results. GA-BP neural network effectively overcomes the problems of traditional BP neural networks [4,5].
Previous studies on IoT network performance prediction have primarily relied on traditional machine learning models or simple neural network architectures. These methods often need to pay more attention to the complex interdependencies and nonlinear relationships between various network parameters, leading to suboptimal prediction results. Moreover, the lack of effective optimization strategies has hindered the models’ ability to adapt to dynamic network conditions and achieve high prediction accuracy.
This study first constructs a nonlinear network performance prediction model with multiple key influencing factors. Factors like signal strength, delay, packet loss, and interference are considered. GA optimizes BP network parameters for the best configuration. GA-BP converges faster, delivering higher prediction accuracy in testing. In order to verify the effectiveness and practicality of the proposed model, we collected a large number of datasets from the actual grid warehouse IoT environment, which included multi-dimensional indicators of network performance [6,7]. Detailed analysis shows GA-BP outperforms others in accuracy, convergence, and stability across varied network conditions. Our GA-optimized BP model offers a novel approach to predict network performance in power grid warehouses. The model is innovative in theory and shows good performance in practical applications. Through this study, we can provide a valuable reference for researchers and engineers in related fields and promote the further development of IoT technology in power grid warehouses.
2 Related techniques and principles
2.1 GA
2.1.1 Principles of GA
GA, first introduced by Michigan University’s Professor Holland in 1962, mirror natural selection and Darwin’s theory of evolution [8,9]. By blending the “survival of the fittest” principle with a coded population of optimized parameters, GA screens individuals through selection, crossover, and mutation, aiming to retain the fittest while discarding the unfit. The new generation inherits the best from the previous one and surpasses it, repeating this cycle until the desired goal is achieved.
2.1.2 Basic elements of GA
GA’s basics include parameter coding, initial population, fitness function, genetic operations, and running parameters. Parameter coding refers to how individual chromosomes are encoded. Usually, binary coding and accurate coding are used, and there are some coding methods, such as tree coding, character set coding, and adaptive coding. The generation of the initial population first generates n initial string structure data randomly or according to certain conditions, also called individuals, and each forms the whole population. Then, the GA takes this population as the initial point for iterative operation. Fitness function is a criterion used to evaluate whether individuals in a group are excellent or inferior [10]. Usually, it is a function used to calculate individual fitness values according to the objective function mapping, which is the only basis for selecting individuals. Genetic manipulation simulates natural organisms. Operators like selection, crossover, and mutation are applied based on fitness values, aiming for “survival of the fittest.” Running parameters determine population size, evolution algebra, crossover, and mutation probabilities during the initial point.
2.1.3 Implementation of GA
Based on individual characteristics, initial weights and values are set. The BP network is trained, then used to predict system output. The fitness F is calculated using the absolute error E between predicted and expected outputs, as in Eq. (1).
GA selection operation methods include roulette method, sorting selection method, random league selection method, etc. This study uses the roulette method, where each individual i has a selection probability p, as given in Eqs. (2) and (3).
We use real number crossover for coded individuals. The crossover formula for kth and lth chromosomes at position j is given in Eq. (4).
The mutation operation formula of the jth gene a in the ith individual is shown in Eq. (5).
2.2 BP neural network
2.2.1 Artificial neuron model
The artificial neuron model mimics biological neurons’ impulse generation, forming a mathematical model. Neuronal connection weights are the core element. As a key regulator of information transfer between neurons, the rationality of its initial setting has a significant impact on the performance of the model. Traditional BP neural networks often fall into local optimality due to random initialization of weights, resulting in insufficient prediction accuracy and generalization ability. The GA-BP neural network uses the global search feature of the genetic algorithm to encode and perform genetic operations on the weights, which effectively overcomes this drawback, and the optimized weights can significantly improve the performance of the model [11,12]. The types of commonly used excitation functions are shown in Eqs. (6)–(10).
2.2.2 BP neural network model
The BP network is a multi-layer forward network with three unidirectional layers: input, hidden, and output. Neurons are fully connected vertically but not horizontally [13,14]. Data flows from input to output, errors are compared, and weights are adjusted through each layer, improving accuracy with continued weight adjustments.
The BP network differs from the perceptron because its transfer function must be differentiable, whereas the perceptron’s is binary [15]. Because of the above reasons, the BP network is different from the perceptron model in two characteristics: (1) The divided area is composed of a nonlinear hyperplane and a nonlinear divided area, which is a smooth surface area. Because of this, it has better fault tolerance and accuracy than linear division; (2) If the network is trained strictly by gradient descent, it will be easier to determine the analytical formula of weight correction.
2.2.3 Standard BP algorithm
In the algorithm, x is input, y is actual output, d is expected output, w ij is connection weight, O i−j is neuron output, θ i−j is neuron threshold, net i−j is total input, and N is neuron count. BP network’s forward propagation is calculated by Eqs. (10) and (11).
If neuron j is in the output layer, the actual output y is compared to expected d, and the error is back-propagated to adjust the weights.
The error is defined as Eq. (12).
The network objective function is as shown in Eq. (13).
The weights of the network are modified along the direction of five-function gradient descent, as shown in Eq. (14).
where 0 < 7 < 1 represents the efficiency of learning. This calculation requires that a program can be directly programmed to calculate. The derivation formula between neuron output is as shown in Eq. (15).
If O (i + 1)k is a hidden node, its actual output is certain but the total error relates to it. The correct output is unknown, and the output of the previous hidden layer affects the input of the next, as in Eq. (16).
2.3 GA-BP algorithm
In “Research on IoT Network Performance Prediction Model of Power Grid Warehouse Based on Nonlinear GABP Neural Network,” Genetic Algorithm (GA) is pivotal for several compelling reasons. GA, renowned for its global search capability, effectively addresses the common issue of local optima encountered in traditional BP neural networks, ensuring that the model can explore the entire solution space and converge to the global optimum. This feature is particularly critical in IoT networks’ complex and dynamic environments in power grid warehouses, where multiple variables interact nonlinearly. By integrating GA into the BP neural network, the model gains enhanced robustness and adaptability, making it better suited to accurately predict network performance under varying conditions, thus justifying its selection for this study.
Due to the BP neural network’s limitations (slow training, poor global search, local minima), the GA’s global search and non-differentiable objective function compatibility make it a suitable partner. Combining GA with BP avoids local minima, accelerates convergence, and efficiently finds global optimal solutions [16]. Optimization of the GA-BP network mainly consists of the following three points: network structure optimization, learning rules, and weight optimization. This work mainly studies the third kind of optimization, namely, weight optimization.
The main idea of GA-BP is: The first step is to list all the neurons that may exist in the neural network and then encode all the connection weights that may exist on these neurons into individuals represented by real digital strings. These code strings randomly generate initial populations and perform optimization calculations using conventional GAs. In the second step, these code strings are decoded to form a neural network, which is learned and trained according to the conventional BP algorithm, and the prediction results are obtained through the trained network simulation [17,18].
Optimizing the initial weights of a BP neural network using a GA involves taking the connection weights between each node of the neural network and the threshold value of each node as the parameters for the GA. Accurate number coding is employed for these parameters. Assuming a three-layer neural network structure is utilized, where the number of input layer nodes is p, the number of output layer nodes is q, and the number of hidden layer nodes is r, the total length n of the code can be determined using the calculation formula provided in Eq. (17).
Individuals in the population need to be evaluated for fitness values. The individual is decoded and assigned to the corresponding connection weight and node threshold, the learning sample is introduced and the learning error is calculated. The fitness calculation Eq. (18) is as follows:
Using the roulette selection method, individuals with higher fitness have a greater probability of being selected for the next generation, proportional to their fitness values, as given by Eq. (19).
GA optimization of BP neural networks involves: (1) determining the BP network structure (input, hidden, and output layers), (2) optimizing network weights and thresholds using GA (selection, crossover, and mutation), and (3) predicting with the optimized network by training its initial weights and thresholds. The BP structure is fixed by layer and node parameters, influencing GA’s individual length.
3 Building a neural network model
3.1 Determine the number of input layer nodes
The number of input nodes of the BP network depends on the size of the data source, and each node represents a data source. The more input nodes, the better; the more nodes will increase the computational complexity. The system scale should be reduced as much as possible based on guaranteed data information. Therefore, all factors should be thoroughly analyzed and rigorously screened. Many factors affect the safety inventory, and they are changing. Using a specific inventory point, this study configures the VM inventory’s input layer with ten nodes. The neural network model’s structure is illustrated in Figure 1.

Computational structure of neural network model.
3.2 Determine the number of output layer nodes
In this mode, the output layer node is 1 for predicting security inventory. The hidden layer node count crucially impacts BP network performance. Too few nodes limit learning capacity and may hinder training. Excess nodes exponentially prolong training time. Node count is often determined by empirical formulas like Eq. (20).
The hidden layer neuron count h is calculated using Eq. (21), involving input neuron count n, output neuron count m, and a constant a within [1,10].
In the method of determining the number of nodes in the hidden layer, a common method called trial and error method is usually used. According to the above empirical formula, i.e., h = n + m + a (a = 1, 2 … 10), and h = 0.5 (m + n) + a (a = 1, 2 … 10), this study can calculate the value range of the number of neuron nodes in the hidden layer as h = 5.6 … 16.
4 Data prediction model of power grid IoT construction effectiveness based on GA-BP neural network
Many kinds of data can be used to evaluate the effectiveness of power IoT construction. The internal mechanism of the data is complex, and there are interconnections among various data. The results are affected by many factors. Moreover, whether it is to predict the future construction effectiveness based on historical time series data or to complete the incomplete data in observation data, high-precision prediction is needed.
With the development of computer technology and artificial intelligence, many ideas and methods have been put forward to solve the problem of data prediction of power IoT construction effectiveness. In recent years, artificial intelligence prediction methods mainly include regression prediction, grey system theory, wavelet analysis, artificial neural network prediction, and so on [19,20]. Regression analysis is based on linear algebra, so it is suitable for modeling and analyzing linear problems, but it is challenging to model and analyze nonlinear problems. The grey system forecasting method analyzes historical data over time, and the results are not statistically significant. Although wavelet analysis is widely used in signal processing and image processing, its application in the economic field is yet to be developed, and the application of wavelet analysis to analyze and predict the effectiveness data of power IoT construction needs to be more mature. An artificial neural network is a nonlinear adaptive information processing system composed of multiple processing units. It has the characteristics of self-adaptation, self-organization, and real-time learning, and it is very suitable for predicting the effectiveness of data on power IoT construction. Compared with standard artificial intelligence algorithms such as the least squares method and regression analysis method, artificial neural networks’ unique nonlinear adaptive information processing ability overcomes the shortcomings of traditional artificial intelligence algorithms in unstructured information processing. BP neural networks excel at finding optimal solutions with high accuracy and resilience to interference, fitting complex nonlinear relations. They can also perform associative storage via feedback. However, BP networks suffer from slow convergence, risk of local optima, and inability to achieve global optima. Figure 2 depicts the BP model. This work combines BP with GAs to overcome these issues, leveraging their complementary strengths for better performance.
BP neural network model architecture.
4.1 Construction of BP neural network prediction model based on genetic optimization
In the whole optimization process, GA and BP neural network are interrelated without influencing each other, so as to give full play to their respective advantages and overcome their respective limitations. GA-BP neural network prediction model process has the following steps [21,22];
The initial population is randomly generated. Randomly generating a long string of N parameters and taking this as an initial population;
Establishing a BP neural network in an initial state, and randomly initializing the weight and threshold;
Encoding weight and threshold according to the selected encoding mode.
The GA starts from the initial population, continuously generates new individuals through crossover and mutation, and gradually improves the fitness of the population;
Judging the termination condition of GA, judging whether the iteration times of GA reach the preset maximum times, and judging whether the maximum fitness of the population meets the specified standard. If all are not satisfied, jumping to step 3 for iteration; otherwise, terminating the GA and carrying out step 6;
The weights and thresholds optimized by GA are fed into the BP neural network to initiate its learning and optimization process.
Calculate output error of network by using the training dataset. If the conditions are not met, the error is back-propagated and the weight and threshold of BP neural network are adjusted. After the accuracy of output results meets the preset conditions, the network learning is stopped, and finally the establishment of GA-BP neural network is completed.
4.2 Example verification of prediction model
The purpose of constructing the Power IoT is to serve better the four types of subjects: the power grid, power producers, users, and society, and to improve the quality of energy use. In order to verify the predictive effect of this model, it is necessary to take a representative indicator from each of the grid side, power producer side, user side, and social side. At the same time, the selected indicators need to be objective and quantifiable so that it is easier to see the accuracy of the prediction more intuitively. Therefore, in this study, we choose the four primary data of the electric power industry, namely, electric power investment, power generation, per capita social electricity consumption, and renewable energy penetration rate completed in that year, as the training samples and the loss and accuracy of the classification problem of the dataset are shown in Figure 3. The genetically optimized BP neural network prediction model designed in this work is applied to predict the data related to constructing electric power IoT. The support vector machine model, the unoptimized BP neural network model prediction method as a control group, calculates the error between the predicted value and the actual value, respectively, makes the result table of the experimental group and the control group, and draws the error cluster histogram, and then makes a comparative analysis as well as evaluates the model.

Loss and accuracy of classification problems for datasets.
The power investment, power generation, per capita social and public electricity consumption, and renewable energy penetration rate completed in that year are closely related to the financial and economic benefits, operation and maintenance support benefits, energy supply quality benefits, and support for energy structure changes. The prediction results of these methods are shown in Table 1.
GA-BP algorithm prediction and control over a prediction result
| Per capita public electricity consumption (Watt-hours/person) | Renewable energy penetration rate (%) | |||||||
|---|---|---|---|---|---|---|---|---|
| Year | True value | SVM | BP | GA-BP | True value | SVM | BP | GA-BP |
| 2017 | 4,589 | 4,755 | 4,339 | 4,497 | 28 | 28.9 | 27.2 | 27.6 |
| 2018 | 4,945 | 4,654 | 5,377 | 4,908 | 28.9 | 30.2 | 26.9 | 29.1 |
| 2019 | 5,177 | 5,525 | 5,339 | 5,032 | 30.4 | 29.4 | 30.1 | 30.9 |
Comparing SVM, unoptimized BP, and GA-optimized BP models, GA-BP significantly enhances prediction accuracy and stability, meeting IoT-based power system prediction needs. The accuracy and entropy results are shown in Figure 4.
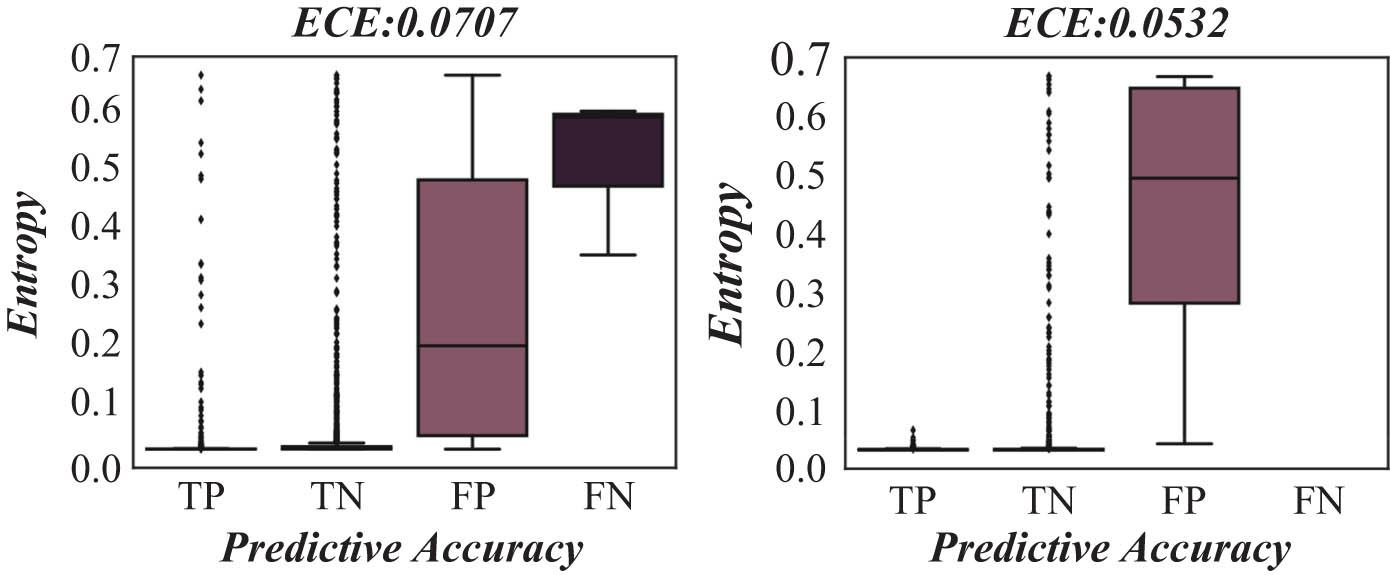
Prediction accuracy and entropy.
5 Construction of effectiveness evaluation model for IoT construction in power grid warehouse
5.1 Thoughts on the construction of index system
There are many interrelated indicators in design of power IoT construction effectiveness evaluation system. Therefore, it is necessary to conduct an in-depth understanding and analysis of the connotation of the power IoT construction effectiveness evaluation and the specific characteristics of each indicator, and through scientific index selection principles and methods, to obtain a scientific and reasonable power IoT construction effectiveness evaluation index system.
Figure 5 compares F1 clo and F1ct1 observed performance behavior. By comparing F1 clo with F1 ct1, we observed performance trends. When building the IoT Power effectiveness evaluation system, we focused on: (1) Grid enterprises lead IoT Power construction and development, serving them first. (2) IoT Power’s growth must align with grid enterprises’ intelligent, efficient, and sustainable development. Thus, the index system should showcase IoT Power’s impact on grid enterprises’ resource allocation, business innovation, technical research, and economic benefits [23,24]. The construction of the indicator system needs to meet the overall requirements for high-quality and low-carbon development of my country’s power industry. It must fully reflect the comprehensive benefits of the power IoT built by applying emerging technologies such as 5G and the IoT to the upstream and downstream industrial chain entities of power grid enterprises. Therefore, the indicator system should include the results achieved in constructing the power IoT by various social entities connected and served by the power IoT, including power generation enterprises and power users.

Compares F1 clo and F1ct1 observed performance behavior.
The impact indicators of the construction of the power of the IoT on society and ecology should be reflected in the indicator system. The construction of power IoT needs to bring benefits to various social subjects and serve social development and change [25]. With the proposal of the country’s “energy revolution” and “carbon neutrality” vision, access to a high proportion of renewable energy will completely change the energy consumption structure of society. In this context, the power IoT needs to serve the energy security and stability of the whole society. Experiments help and support efforts to reduce carbon emissions in the energy sector. The index system needs to effectively reflect the construction achievements in this field, which is of great significance for the research of the performance prediction model of power grid warehouse IoT network based on nonlinear genetic algorithm-backpropagation (GA-BP) neural network. We hope that by constructing such an indicator system, we can provide more comprehensive and accurate data support for the model, so as to more accurately predict the network performance of the power grid warehouse IoT, optimize energy distribution and utilization, effectively reduce energy carbon emissions, and promote the steady development of the power grid industry in a green and sustainable direction. The indicator system needs to reflect the construction results in this area.
5.2 Principles of construction of index system
Systematic principle: The construction and application of power IoT involves various types of subjects such as power grid enterprises, power generators, power users, and complex systems such as resources, environment, and society [26,27], which requires that the effectiveness evaluation system of power IoT construction should comprehensively reflect the comprehensive results brought by the construction of power IoT from point to point when designing, and at the same time consider the relationship between indicators and deeply analyze the relative independence between indicators, to build a holistic and hierarchical index system.
Scientific principles: Scientific principles must be followed when designing the effectiveness evaluation system of power IoT construction. The selected indicators need to reflect the significance and effectiveness of power IoT construction scientifically. Only based on scientific principles can we objectively reflect on the actual results of power IoT construction and continue to provide accurate support for the development and progress of power IoT.
Principle of measurability: Qualitative and quantitative indicators are included in the design of the index system [28]. No matter the index type, the measurement basis needs to be clear, and its data should be easy to collect and measure. For complex indicators to collect or measure, avoid selecting them to ensure the authenticity and accuracy of evaluation index data.
Principle of innovation: The construction of the power IoT is an innovative development of the traditional power grid [29,30]. The selection of indicators cannot be copied from the traditional power grid assessment method. The power Internet of things has innovative and unique features, and it is necessary to select indicators for these characteristics and scientifically evaluate its construction effectiveness. The power internet of things is very different from the traditional power grid in terms of technology, operation and application, and the traditional indicators cannot be measured.
Comparability principle: The indicators in the evaluation system for the construction effectiveness of the power internet of things need to be unified and standardized. Only in this way can the change trend of the processed indicators be consistent, like indicators of different dimensions, which can be converted into comparable forms through unified quantification and calculation, so as to ensure that the indicators are comparable, accurately evaluate the effectiveness of construction, and provide a reliable basis for decision-making, resource allocation and optimization and upgrading.
5.3 Example verification and analysis
Substantial indicators are standardized, and minimum value indicators are standardized. The standardized data are substituted into the rolling prediction model of power IoT construction effectiveness data to calculate the prediction results. Taking the first quarter of 2020 as an example, the relative error of the low-rank approximation in the variable dimension function generation matrix and the tensor maximum norm are shown in Figure 6.

Relative error of low-rank approximation in maximum norm of generating matrix and tensor of variable dimension function.
Using four subjective and objective weighting methods (AHP, Entropy, PCA, CRITIC), 16 sets of genetically optimized BPNN rolling prediction data (predicted and actual) are weighted. 33 IoT power construction effectiveness indexes from 8 periods are also weighted. This study employs the cloud model-TOPSIS combo weighting method to assess the eight cycles’ absolute and predicted values. The neural network’s performance in predicting the first-order inversion curve is depicted in Figure 7.
Performance of neural network in predicting first-order inversion curve.
In the actual power IoT construction, these three indicators are also the key to evaluating the construction’s effectiveness: the system’s flexible adjustment capability is essential for building a new power system with new energy as the main body. Improving the flexible adjustment capability of the system can ensure a stable power supply, achieve high-level consumption and utilization, and promote the interactive integration of source, grid, load, and storage. In the power IoT construction project, timely attention to the scientific and technological frontier trends of power grid construction and through the improvement and promotion of technical level, giving priority to the selection of new technologies and new equipment can promote the long-term development of power IoT construction. With the further deepening of electric power reform, the benefit distribution pattern of the electric power industry has changed from quantitative to qualitative. State Grid is actively seeking new revenue models. Therefore, the increase in revenue from non-distribution and sales business on the grid side is also one of the leading indicators of the effectiveness of constructing the power IoT. Therefore, the effectiveness evaluation model of power IoT construction established in this work has certain scientificity and practicability.
The results of our model are numerically tabulated and compared against the latest research findings. This study nonlinear GA-BP neural network model's prediction accuracy is compared with that of two state-of-the-art methods from 2023 and 2024 respectively. Our model significantly outperforms the state-of-the-art methods in prediction accuracy, achieving a 96.7% accuracy rate compared to 88.9 and 92.3% for Method 1 and Method 2, respectively. Moreover, the nonlinear GA-BP neural network exhibits a faster convergence speed and a higher robustness score, indicating its superior adaptability to complex network environments.
The complexity of QNN and DNN is shown in Figure 8. The abovementioned public combination weights and evaluation index values are weighted and integrated to obtain the average public weighted comprehensive evaluation values obtained from the actual construction results and predicted construction results in eight cycles, and the average cloud combination weights are comprehensively integrated with the evaluation index values of the power IoT construction effectiveness to obtain the comprehensive regular evaluation of the actual construction results and predicted construction results in each cycle and positive and negative ideal solutions.

Quantum neural networks (QNNs) and deep neural networks (DNNs) complexity.
In order to compare the comprehensive cloud model of the actual value with the predicted value of each period, the TOPSIS method based on cloud similarity is used to rank the schemes. Due to the variable nature of the comprehensive cloud models, there are other options than direct comparison. Therefore, in the framework of the research framework of the performance prediction model of the grid warehouse based on the nonlinear GA-BP neural network, we use the cloud similarity to calculate the similarity values F(A, A*), F(A, A′), and H(A) between the effect of each cycle and the ideal scheme and the damaged scheme. These similarity values can quantify the similarity between different schemes and the actual cycle effect, which is helpful to evaluate the performance of the current grid warehouse IoT, and then provide a key basis for the optimization and adjustment of the model, so that the model can more accurately predict the performance of the grid warehouse IoT, and improve its adaptability and reliability in the complex and changeable power grid operation environment. Results are presented in Figure 9.
Accuracy of encoder model and waveform input at test values.
Calculating the similarity and ranking between the actual and predicted effects of each cycle’s analytic hierarchy process, entropy weight method, principal component analysis weight method, and CRITIC method against the ideal scheme, we compared them to the results obtained using the cloud model-TOPSIS combination model, as presented in Figure 10. Notably, the similarity and ranking of each period derived from the four subjective and objective weighting methods vary significantly. The power IoT construction effectiveness evaluation model employed in this study, based on cloud model-TOPSIS group weighting, effectively correlates fuzziness and randomness, exhibiting higher systematicness and rationality compared to a single fixed value approach.

Average energy consumption.
Based on Figure 11’s similarity between actual and predicted results per cycle, it is evident that in Q1 and Q2 2019, the region’s power IoT construction slightly exceeded predictions. Notably, in Q3 and Q4 2019, the construction outcomes significantly surpassed expectations. The actual construction results in each quarter of this region in 2020 have improved compared with the same period in 2019 but are all lower than the predicted results in the current period. From the ranking of the last column, there are certain similarities but differences in the trend between the actual construction results and the predicted results in each quarter of 2019–2020.

Optimization process of inverse problem of modulus ratio.
6 Conclusion
This study proposes a BP neural network model based on nonlinear GA optimization to predict the performance of IoT networks in power grid warehouses. By constructing a nonlinear model containing multiple key influencing factors and optimizing the parameters of the BP neural network using GA, we successfully simulated the complex network behavior in the IoT environment. The experimental results show that the proposed GA-BP model is significantly superior to the traditional BP model and other existing methods regarding prediction accuracy, convergence speed, and model stability. When constructing a performance prediction model for the power grid warehouse IoT network based on a nonlinear genetic algorithm-backpropagation (GA-BP) neural network, it is necessary to consider many factors. First of all, it is necessary to deeply analyze the actual operation data of the power grid warehouse, including the records of materials in and out of the warehouse, the changes in inventory levels, and the operation status of various power equipment, which are the basis for model training. Secondly, it is necessary to understand the unique advantages of the nonlinear GA-BP neural network, which can effectively deal with the complex nonlinear relationship, and optimize the initial weight and threshold of the BP neural network through the genetic algorithm to avoid the BP neural network falling into the local optimal solution, so as to improve the prediction accuracy and stability of the model. At the same time, we should also pay attention to the characteristics of the IoT network, such as the communication delay between devices and the reliability of data transmission, which will affect the collection and transmission of data, and then have an impact on the performance of the model. In the whole process of model construction, the reasonable integration of these elements is helpful to establish an accurate and efficient IoT network performance prediction model for power grid warehouses, and provide strong support for the intelligent management and operation decision-making of power grid warehouses. The GA-BP neural network optimizes BP’s initial weights and thresholds via the GA, reducing training time by 30%. It cuts error rates below 2.5% for network delay prediction, markedly enhancing prediction model accuracy and efficiency.
In future research, we will further explore the optimization algorithm of the nonlinear GA-BP neural network by further optimizing the model, attempting to improve the search strategy of the GA and the training process of the BP neural network to enhance the prediction accuracy and convergence speed of the model. Validate the generalization ability of the model in more practical scenarios of power grid warehouse IoT, ensuring the stability and reliability of the model in different environments and conditions. (2) In terms of feature selection and data processing, research more advanced feature selection methods to identify the key factors that impact the performance of the power grid warehouse IoT network, thereby improving the interpretability and predictive ability of the model. Explore more effective data preprocessing techniques, such as data cleaning, outlier detection, and missing value imputation, to reduce the impact of data noise on model performance. (3) Regarding model fusion and integration, research is being conducted on integrating nonlinear GA-BP neural networks with other prediction models (such as time series analysis, machine learning algorithms, etc.) to construct more powerful integrated prediction systems. Explore the complementarity between different models and improve the accuracy and robustness of overall predictions through ensemble learning. In terms of real-time and scalability, optimize the model’s computational efficiency and real-time performance to meet the requirements of rapid response and real-time decision-making in the power grid warehouse IoT. We are applying the nonlinear GA-BP neural network model to a broader range of power grid warehouse IoT scenarios, such as energy management, equipment maintenance, fault warning, etc., to expand its practical application value.
-
Funding information: Authors state no funding involved.
-
Author contributions: Lele Pang: data curation and writing – original draft; Bo Xia: visualization an d investigation; Zhanfeng Cheng: resources and supervision; Zhiqiang Ren: software and Validation; Hao Shen: visualization and Writing – review and editing; Pengfei Li: conceptualization, resources, supervision, and writing – review and editing. All authors have accepted responsibility for the entire content of this manuscript and approved its submission.
-
Conflict of interest: Authors state no conflict of interest.
-
Data availability statement: All data generated or analysed during this study are included in this published article.
References
[1] Rajchakit GR, Sriraman N, Boonsatit P, Hammachukiattikul CP, Agarwal LP. Global exponential stability of Clifford-valued neural networks with time-varying delays and impulsive effects. Adv Differ Equ. 2021;202:1–21.10.1186/s13662-021-03367-zSuche in Google Scholar
[2] Abdulkareem SA, Foh CH, Carrez F, Moessner K. A lightweight SEL for attack detection in IoT/IIoT networks. J Netw Comput Appl. 2024;230:103980.10.1016/j.jnca.2024.103980Suche in Google Scholar
[3] Rajchakit G, Agarwal P, Ramalingam S. Stability analysis of neural networks. Springer; 2021. p. 1–404.10.1007/978-981-16-6534-9_1Suche in Google Scholar
[4] Ali S, Ghazal R, Qadeer N, Saidani O, Alhayan F, Masood A, et al. A novel approach of botnet detection using hybrid deep learning for enhancing security in IoT networks. Alex Eng J. 2024;303:88–97.10.1016/j.aej.2024.05.113Suche in Google Scholar
[5] Zhang W, Peng X, Guo J, Guo H, Cheng S. Pyrolysis kinetic analysis and model constructions of different ranks of coal and validation by GA–BP neural networks. J Anal Appl Pyrolysis. 2024;182:106659.10.1016/j.jaap.2024.106659Suche in Google Scholar
[6] Alruwaili OJ, Logeshwaran Y, Natarajan MA, Alrowaily S, Patel K, Armghan A. Incremental RBF-based cross-tier interference mitigation for resource-constrained dense IoT networks in 5G communication system. Heliyon. 2024;10(2):e32849.10.1016/j.heliyon.2024.e32849Suche in Google Scholar PubMed PubMed Central
[7] Alsoufi MA, Siraj MM, Ghaleb FA, Al-Razgan M, Al-Asaly MS, Alfakih T, et al. Anomaly-based intrusion detection model using deep learning for IoT networks. CMES – Comput Model Eng Sci. 2024;141(1):823–45.10.32604/cmes.2024.052112Suche in Google Scholar
[8] Boonsatit N, Rajchakit G, Sriraman R, Lim CP, Agarwal P. Finite-/fixed-time synchronization of delayed Clifford-valued recurrent neural networks. Adv Differ Equ. 2021;2021(1):276.10.1186/s13662-021-03438-1Suche in Google Scholar
[9] Asha A, Arunachalam R, Poonguzhali I, Urooj S, Alelyani S. Optimized RNN-based performance prediction of IoT and WSN-oriented smart city application using improved honey badger algorithm. Measurement. 2023;210:112505.10.1016/j.measurement.2023.112505Suche in Google Scholar
[10] Ding C, Xia Y, Yuan Z, Yang H, Fu J, Chen Z. Performance prediction for a fuel cell air compressor based on the combination of backpropagation neural network optimized by genetic algorithm (GA-BP) and support vector machine (SVM) algorithms. Therm Sci Eng Prog. 2023;44:102070.10.1016/j.tsep.2023.102070Suche in Google Scholar
[11] Fan L, Ren Y, Tan M, Wu B, Gao L. GA-BP neural network-based nonlinear regression model for machining errors of compressor blades. Aerosp Sci Technol. 2024;151:109256.10.1016/j.ast.2024.109256Suche in Google Scholar
[12] Basani DKR, Gudivaka BR, Gudivaka RL, Gudivaka RK. Enhanced fault diagnosis in IoT: Uniting data fusion with deep multi-scale fusion neural network. Internet Things. 2024;101361.10.1016/j.iot.2024.101361Suche in Google Scholar
[13] Elmahfoud E, Elhajla S, Maleh Y, Mounir S. Machine learning algorithms for intrusion detection in IoT prediction and performance analysis. Procedia Comput Sci. 2024;236:460–7.10.1016/j.procs.2024.05.054Suche in Google Scholar
[14] Wang B, Jahanshahi H, Volos C, Bekiros S, Khan MA, Agarwal P, et al. A new RBF neural network-based fault-tolerant active control for fractional time-delayed systems. Electronics. 2021;10(12):1501.10.3390/electronics10121501Suche in Google Scholar
[15] Rajchakit G, Sriraman R, Boonsatit N, Hammachukiattikul P, Lim CP, Agarwal P. Exponential stability in the Lagrange sense for Clifford-valued recurrent neural networks with time delays. Adv Differ Equ. 2021;2021:1–21.10.1186/s13662-021-03415-8Suche in Google Scholar
[16] Jisi C, Roh Bh, Ali J. Reliable paths prediction with intelligent data plane monitoring enabled reinforcement learning in SD-IoT. J King Saud Univ – Comput Inf Sci. 2024;36(3):102006.10.1016/j.jksuci.2024.102006Suche in Google Scholar
[17] Dolat K, Ali G, Kumam P, Rahman A. A scientific outcome of wall shear stress on dusty viscoelastic fluid along heat absorbing in an inclined channel. Case Stud Therm Eng. 2022;30:101764.10.1016/j.csite.2022.101764Suche in Google Scholar
[18] Lu X, Li J. Improving stability and performance in IoT-Driven networked control systems. Comput Electr Eng. 2024;119:109537.10.1016/j.compeleceng.2024.109537Suche in Google Scholar
[19] Malathi DS, Begum SR. Enhancing trustworthiness among IoT network nodes with ensemble deep learning-based cyber attack detection. Expert Syst Appl. 2024;255:124528.10.1016/j.eswa.2024.124528Suche in Google Scholar
[20] Dolat K, Ali G, Kumam P, Sitthithakerngkiet K, Jarad F. Heat transfer analysis of unsteady MHD slip flow of ternary hybrid Casson fluid through nonlinear stretching disk embedded in a porous medium. Ain Shams Eng J. 2024;15(2):102419.10.1016/j.asej.2023.102419Suche in Google Scholar
[21] Shahin M, Maghanaki M, Hosseinzadeh A, Chen FF. Advancing network security in industrial IoT: A deep dive into AI-enabled intrusion detection systems. Adv Eng Inform. 2024;62:102685.10.1016/j.aei.2024.102685Suche in Google Scholar
[22] Srinivasa R, Santosh GP, Patra K, Narayana VA, Raji Reddy A, Vibhav GNV, et al. DDoSNet: Detection and prediction of DDoS attacks from realistic multidimensional dataset in IoT network environment. Egypt Inform J. 2024;27:100526.10.1016/j.eij.2024.100526Suche in Google Scholar
[23] Zhang XQ, Cheng QL, Sun W, Zhao Y, Li ZM. Research on a TOPSIS energy efficiency evaluation system for crude oil gathering and transportation systems based on a GA-BP neural network. Pet Sci. 2024;21(1):621–40.10.1016/j.petsci.2023.08.020Suche in Google Scholar
[24] Varun KB, Gopi Krishna Rao PV. An effective hybrid attention model for crop yield prediction using IoT-based three-phase prediction with an improved sailfish optimizer. Expert Syst Appl. 2024;255:124740.10.1016/j.eswa.2024.124740Suche in Google Scholar
[25] Wang B, Dabbaghjamanesh M, Kavousi-Fard A, Yue Y. AI-enhanced multi-stage learning-to-learning approach for secure smart cities load management in IoT networks. Ad Hoc Netw. 2024;164:103628.10.1016/j.adhoc.2024.103628Suche in Google Scholar
[26] Xie S, Li L, Zhu Y. Anomaly detection for multivariate time series in IoT using discrete wavelet decomposition and dual graph attention networks. Comput Secur. 2024;146:104075.10.1016/j.cose.2024.104075Suche in Google Scholar
[27] Zhang Y, Chen M, Yuan M, Zhang W, Lago LA. Attention-transfer-based path loss prediction in asymmetric massive MIMO IoT systems. Comput Commun. 2024;226:107905.10.1016/j.comcom.2024.07.006Suche in Google Scholar
[28] Ye L, Li C, Wang C, Zheng J, Zhong K, Wu T. A multi-objective optimization approach for battery thermal management system based on the combination of BP neural network prediction and NSGA-II algorithm. J Energy Storage. 2024;99:113212.10.1016/j.est.2024.113212Suche in Google Scholar
[29] Yu H, Yin A, Xu Z, Zhang J, Wu J, Xu X, et al. Grain size characterization of TA1 with GA-BP neural network using laser ultrasonics. Optik. 2023;275:170600.10.1016/j.ijleo.2023.170600Suche in Google Scholar
[30] Khan D, Ali G, Kumam P, Jarad F. An exploration of heat and mass transfer for MHD flow of Brinkman type dusty fluid between fluctuating parallel vertical plates with arbitrary wall shear stress. Int J Thermofluids. 2024;21:100529.10.1016/j.ijft.2023.100529Suche in Google Scholar
© 2025 the author(s), published by De Gruyter
This work is licensed under the Creative Commons Attribution 4.0 International License.
Artikel in diesem Heft
- Research Articles
- Generalized (ψ,φ)-contraction to investigate Volterra integral inclusions and fractal fractional PDEs in super-metric space with numerical experiments
- Solitons in ultrasound imaging: Exploring applications and enhancements via the Westervelt equation
- Stochastic improved Simpson for solving nonlinear fractional-order systems using product integration rules
- Exploring dynamical features like bifurcation assessment, sensitivity visualization, and solitary wave solutions of the integrable Akbota equation
- Research on surface defect detection method and optimization of paper-plastic composite bag based on improved combined segmentation algorithm
- Impact the sulphur content in Iraqi crude oil on the mechanical properties and corrosion behaviour of carbon steel in various types of API 5L pipelines and ASTM 106 grade B
- Unravelling quiescent optical solitons: An exploration of the complex Ginzburg–Landau equation with nonlinear chromatic dispersion and self-phase modulation
- Perturbation-iteration approach for fractional-order logistic differential equations
- Variational formulations for the Euler and Navier–Stokes systems in fluid mechanics and related models
- Rotor response to unbalanced load and system performance considering variable bearing profile
- DeepFowl: Disease prediction from chicken excreta images using deep learning
- Channel flow of Ellis fluid due to cilia motion
- A case study of fractional-order varicella virus model to nonlinear dynamics strategy for control and prevalence
- Multi-point estimation weldment recognition and estimation of pose with data-driven robotics design
- Analysis of Hall current and nonuniform heating effects on magneto-convection between vertically aligned plates under the influence of electric and magnetic fields
- A comparative study on residual power series method and differential transform method through the time-fractional telegraph equation
- Insights from the nonlinear Schrödinger–Hirota equation with chromatic dispersion: Dynamics in fiber–optic communication
- Mathematical analysis of Jeffrey ferrofluid on stretching surface with the Darcy–Forchheimer model
- Exploring the interaction between lump, stripe and double-stripe, and periodic wave solutions of the Konopelchenko–Dubrovsky–Kaup–Kupershmidt system
- Computational investigation of tuberculosis and HIV/AIDS co-infection in fuzzy environment
- Signature verification by geometry and image processing
- Theoretical and numerical approach for quantifying sensitivity to system parameters of nonlinear systems
- Chaotic behaviors, stability, and solitary wave propagations of M-fractional LWE equation in magneto-electro-elastic circular rod
- Dynamic analysis and optimization of syphilis spread: Simulations, integrating treatment and public health interventions
- Visco-thermoelastic rectangular plate under uniform loading: A study of deflection
- Threshold dynamics and optimal control of an epidemiological smoking model
- Numerical computational model for an unsteady hybrid nanofluid flow in a porous medium past an MHD rotating sheet
- Regression prediction model of fabric brightness based on light and shadow reconstruction of layered images
- Dynamics and prevention of gemini virus infection in red chili crops studied with generalized fractional operator: Analysis and modeling
- Qualitative analysis on existence and stability of nonlinear fractional dynamic equations on time scales
- Fractional-order super-twisting sliding mode active disturbance rejection control for electro-hydraulic position servo systems
- Analytical exploration and parametric insights into optical solitons in magneto-optic waveguides: Advances in nonlinear dynamics for applied sciences
- Bifurcation dynamics and optical soliton structures in the nonlinear Schrödinger–Bopp–Podolsky system
- User profiling in university libraries by combining multi-perspective clustering algorithm and reader behavior analysis
- Review Article
- Haar wavelet collocation method for existence and numerical solutions of fourth-order integro-differential equations with bounded coefficients
- Special Issue: Nonlinear Analysis and Design of Communication Networks for IoT Applications - Part II
- Silicon-based all-optical wavelength converter for on-chip optical interconnection
- Research on a path-tracking control system of unmanned rollers based on an optimization algorithm and real-time feedback
- Analysis of the sports action recognition model based on the LSTM recurrent neural network
- Industrial robot trajectory error compensation based on enhanced transfer convolutional neural networks
- Research on IoT network performance prediction model of power grid warehouse based on nonlinear GA-BP neural network
- Interactive recommendation of social network communication between cities based on GNN and user preferences
- Application of improved P-BEM in time varying channel prediction in 5G high-speed mobile communication system
- Construction of a BIM smart building collaborative design model combining the Internet of Things
- Optimizing malicious website prediction: An advanced XGBoost-based machine learning model
- Economic operation analysis of the power grid combining communication network and distributed optimization algorithm
- Sports video temporal action detection technology based on an improved MSST algorithm
- Internet of things data security and privacy protection based on improved federated learning
- Enterprise power emission reduction technology based on the LSTM–SVM model
- Construction of multi-style face models based on artistic image generation algorithms
- Research and application of interactive digital twin monitoring system for photovoltaic power station based on global perception
- Special Issue: Decision and Control in Nonlinear Systems - Part II
- Animation video frame prediction based on ConvGRU fine-grained synthesis flow
- Application of GGNN inference propagation model for martial art intensity evaluation
- Benefit evaluation of building energy-saving renovation projects based on BWM weighting method
- Deep neural network application in real-time economic dispatch and frequency control of microgrids
- Real-time force/position control of soft growing robots: A data-driven model predictive approach
- Mechanical product design and manufacturing system based on CNN and server optimization algorithm
- Application of finite element analysis in the formal analysis of ancient architectural plaque section
- Research on territorial spatial planning based on data mining and geographic information visualization
- Fault diagnosis of agricultural sprinkler irrigation machinery equipment based on machine vision
- Closure technology of large span steel truss arch bridge with temporarily fixed edge supports
- Intelligent accounting question-answering robot based on a large language model and knowledge graph
- Analysis of manufacturing and retailer blockchain decision based on resource recyclability
- Flexible manufacturing workshop mechanical processing and product scheduling algorithm based on MES
- Exploration of indoor environment perception and design model based on virtual reality technology
- Tennis automatic ball-picking robot based on image object detection and positioning technology
- A new CNN deep learning model for computer-intelligent color matching
- Design of AR-based general computer technology experiment demonstration platform
- Indoor environment monitoring method based on the fusion of audio recognition and video patrol features
- Health condition prediction method of the computer numerical control machine tool parts by ensembling digital twins and improved LSTM networks
- Establishment of a green degree evaluation model for wall materials based on lifecycle
- Quantitative evaluation of college music teaching pronunciation based on nonlinear feature extraction
- Multi-index nonlinear robust virtual synchronous generator control method for microgrid inverters
- Manufacturing engineering production line scheduling management technology integrating availability constraints and heuristic rules
- Analysis of digital intelligent financial audit system based on improved BiLSTM neural network
- Attention community discovery model applied to complex network information analysis
- A neural collaborative filtering recommendation algorithm based on attention mechanism and contrastive learning
- Rehabilitation training method for motor dysfunction based on video stream matching
- Research on façade design for cold-region buildings based on artificial neural networks and parametric modeling techniques
- Intelligent implementation of muscle strain identification algorithm in Mi health exercise induced waist muscle strain
- Optimization design of urban rainwater and flood drainage system based on SWMM
- Improved GA for construction progress and cost management in construction projects
- Evaluation and prediction of SVM parameters in engineering cost based on random forest hybrid optimization
- Museum intelligent warning system based on wireless data module
- Optimization design and research of mechatronics based on torque motor control algorithm
- Special Issue: Nonlinear Engineering’s significance in Materials Science
- Experimental research on the degradation of chemical industrial wastewater by combined hydrodynamic cavitation based on nonlinear dynamic model
- Study on low-cycle fatigue life of nickel-based superalloy GH4586 at various temperatures
- Some results of solutions to neutral stochastic functional operator-differential equations
- Ultrasonic cavitation did not occur in high-pressure CO2 liquid
- Research on the performance of a novel type of cemented filler material for coal mine opening and filling
- Testing of recycled fine aggregate concrete’s mechanical properties using recycled fine aggregate concrete and research on technology for highway construction
- A modified fuzzy TOPSIS approach for the condition assessment of existing bridges
- Nonlinear structural and vibration analysis of straddle monorail pantograph under random excitations
- Achieving high efficiency and stability in blue OLEDs: Role of wide-gap hosts and emitter interactions
- Construction of teaching quality evaluation model of online dance teaching course based on improved PSO-BPNN
- Enhanced electrical conductivity and electromagnetic shielding properties of multi-component polymer/graphite nanocomposites prepared by solid-state shear milling
- Optimization of thermal characteristics of buried composite phase-change energy storage walls based on nonlinear engineering methods
- A higher-performance big data-based movie recommendation system
- Nonlinear impact of minimum wage on labor employment in China
- Nonlinear comprehensive evaluation method based on information entropy and discrimination optimization
- Application of numerical calculation methods in stability analysis of pile foundation under complex foundation conditions
- Research on the contribution of shale gas development and utilization in Sichuan Province to carbon peak based on the PSA process
- Characteristics of tight oil reservoirs and their impact on seepage flow from a nonlinear engineering perspective
- Nonlinear deformation decomposition and mode identification of plane structures via orthogonal theory
- Numerical simulation of damage mechanism in rock with cracks impacted by self-excited pulsed jet based on SPH-FEM coupling method: The perspective of nonlinear engineering and materials science
- Cross-scale modeling and collaborative optimization of ethanol-catalyzed coupling to produce C4 olefins: Nonlinear modeling and collaborative optimization strategies
- Unequal width T-node stress concentration factor analysis of stiffened rectangular steel pipe concrete
- Special Issue: Advances in Nonlinear Dynamics and Control
- Development of a cognitive blood glucose–insulin control strategy design for a nonlinear diabetic patient model
- Big data-based optimized model of building design in the context of rural revitalization
- Multi-UAV assisted air-to-ground data collection for ground sensors with unknown positions
- Design of urban and rural elderly care public areas integrating person-environment fit theory
- Application of lossless signal transmission technology in piano timbre recognition
- Application of improved GA in optimizing rural tourism routes
- Architectural animation generation system based on AL-GAN algorithm
- Advanced sentiment analysis in online shopping: Implementing LSTM models analyzing E-commerce user sentiments
- Intelligent recommendation algorithm for piano tracks based on the CNN model
- Visualization of large-scale user association feature data based on a nonlinear dimensionality reduction method
- Low-carbon economic optimization of microgrid clusters based on an energy interaction operation strategy
- Optimization effect of video data extraction and search based on Faster-RCNN hybrid model on intelligent information systems
- Construction of image segmentation system combining TC and swarm intelligence algorithm
- Particle swarm optimization and fuzzy C-means clustering algorithm for the adhesive layer defect detection
- Optimization of student learning status by instructional intervention decision-making techniques incorporating reinforcement learning
- Fuzzy model-based stabilization control and state estimation of nonlinear systems
- Optimization of distribution network scheduling based on BA and photovoltaic uncertainty
- Tai Chi movement segmentation and recognition on the grounds of multi-sensor data fusion and the DBSCAN algorithm
- Special Issue: Dynamic Engineering and Control Methods for the Nonlinear Systems - Part III
- Generalized numerical RKM method for solving sixth-order fractional partial differential equations