Effect of scale factor on the dynamic response of frame foundations
-
Ameer A. Ahmed
 ,
Mohammed Y. Fattah
,
Mohammed Y. Fattah

Abstract
In geotechnical engineering, a scale factor “n” is a numerical ratio that relates the physical properties of a physical model to those of a prototype. The effect of scale factor on the dynamic response of a frame foundation used for high-speed turbo machines is examined through numerical analyses to clarify the influence of scaling dimensions, frequency, static and dynamic loads, and scaled models’ material on the dynamic responses of the frame foundation. The static and dynamic analyses were conducted using Ansys Workbench software. The total number of analyses used to investigate the scale factor effect was 28. Both modal and harmonic analyses were performed to calculate the natural frequencies and displacement responses of the scaled and prototype models under the scaled dynamic loading. Five scale factors were used in this study for concrete models (1, 20, 25, 32, and 40), and two additional analyses on steel models of scale (1 and 20) were used to study the material scaling. The prototype results were first verified, and then the models were investigated after scaling the dynamic loads and dimensions. The results of this study revealed the importance of scaling the frequency when studying the high-speed turbo machine foundation models to reflect the correct responses of the prototype foundation.
1 Introduction
In geotechnical engineering, physical modeling is an important tool used to study the behavior of prototype foundation structures under controlled conditions. Most physical models are constructed at smaller scales than the prototype, which allows for closer control over model details and more rapid parametric studies. However, When the model is not built to its full scale, it is necessary to extrapolate the observations made at the model scale to the prototype scale. This requires a rigorous understanding of scaling laws and the implications for physical geotechnical modeling. The dynamic response results are another important aspect to consider when extrapolating physical model results to the prototype scale. In geotechnical engineering, it is often necessary to study the dynamic response of structures and soil under various types of dynamic loading, such as earthquakes, machine vibrations, or wind loads.
When conducting physical models, the dynamic response results can be obtained by subjecting the model to dynamic loading at a scaled frequency, amplitude, and duration. The scaling factors used in dynamic models depend on the type of dynamic loading and the relevant properties of the prototype, such as the soil properties, the size and weight of the structure, and the expected frequency and amplitude of the dynamic loading.
To extrapolate the dynamic response results obtained from physical models to the prototype scale, the scaling factors must be carefully chosen to account for the differences between the model and prototype, such as the size and stiffness of the structure and the dynamic properties of the soil. For example, in seismic studies, the scaling factors for the duration, amplitude, and frequency of the seismic motion must be chosen to accurately reproduce the seismic response of the prototype.
In summary, when conducting physical models to study a dynamic response, careful consideration must be given to the scaling factors used in the model and the choice of appropriate scaling laws to extrapolate the results to the prototype scale. By doing so, physical models can provide valuable insights into the dynamic behavior of geotechnical systems and inform the design of structures and foundations subjected to dynamic loading.
Table 1 shows scaling factors for single gravity modeling and centrifuge models, with a linear scale of 1/n. It is presumed that the prototype and model use the same soil material, resulting in a density scale factor of 1. There may be debates on the essential set of scaling elements to utilize, and some of the presented factors might be considered as separate factors, while the soil will often assert its influence over perceived independence. Overall, physical modeling plays a crucial role in geotechnical engineering by providing valuable insights into the behavior of prototypes and informing the design process [1].
Scale factors from the study by David Muir [1]
| Quantity | General | 1 g (laboratory) | n g (centrifuge) |
|---|---|---|---|
| Length |
|
1/
|
1/
|
| Mass density |
|
1 | 1 |
| Acceleration |
|
1 |
|
| Stiffness |
|
1/
|
1 |
| Stress |
|
1/
|
1 |
| Force |
|
1/
|
1/
|
| Force/unit length |
|
1/
|
1/
|
| Strain |
|
1/
|
1 |
| Displacement |
|
1/
|
1/
|
| Pore fluid viscosity |
|
1 or
|
1 or
|
| Pore fluid density |
|
1 | 1 |
| Permeability (Darcy’s Law) |
|
1 or 1/
|
|
| Hydraulic gradient |
|
1 | 1 |
| Time (diffusion) |
|
1/
|
1/
|
| Time (creep) | 1 | 1 | 1 |
| Time (dynamic) |
|
1/
|
1/
|
| Velocity |
|
1/
|
1 |
| Frequency | [
|
|
|
| Shear wave velocity | [
|
1/
|
1 |
To ensure that physical models accurately represent the behavior of the corresponding prototype, geotechnical engineers use several scaling factors. The different types of scaling factors used in geotechnical engineering include:
Linear scaling factors: These factors are used to scale the dimensions of the model down from the prototype. The scaling factor is often denoted by the symbol n and is typically expressed as a ratio of the dimensions of the model to those of the prototype.
Dynamic scaling factors: These factors are used to account for the difference in dynamic response between the prototype and the model due to differences in size, stiffness, and other factors. The scaling factor is often denoted by the symbol λ and is typically expressed as a ratio of the dynamic response of the model to that of the prototype.
Material scaling factors: These factors are used to adjust the physical properties of the soil or material used in the model to match those of the prototype. This can be done by adjusting the density, stiffness, and strength of the soil or material in the model to match those of the prototype.
Time scaling factors: These factors are used to adjust the time scale of the model to match that of the prototype. The scaling factor is often denoted by the symbol t and is typically expressed as a ratio of the time scale of the model to that of the prototype.
By using these different types of scaling factors, geotechnical engineers can ensure that physical models accurately represent the behavior of the corresponding prototype, allowing for more efficient and accurate testing and analysis of structures and soil behavior.
Kutter [2] explained and described the disadvantages and advantages of centrifuge modeling and the basic principles of dynamic centrifuge model testing. They study the Prieta earthquake effect on the performance of transportation structures through two centrifuge model tests to understand the failure mechanism of the bridge and the development of the sand boil liquefaction mechanism. The dynamic analysis of the lateral behavior of piles has been presented as a new procedure and calibrated using centrifuge test data. They concluded that, from the presented centrifuge model test examples, the following points are useful:
On the basis of observed behavior in centrifuge tests, analytical models can be developed.
By comparing predictions and measurements, numerical procedures can be calibrated.
Local surface heave observed in the liquefaction tests can be discovered.
Iai et al. [3] proposed a novel method for simulating a large-scale prototype subjected to earthquake vibrations. The method relies on a two-stage scaling concept. The approach consists of two stages. In the first stage, using scaling relations in a 1 g field, the prototype is reduced in size to an intermediate virtual model with a scaling factor of μ (prototype/virtual model). The second stage involves transforming the model into a physical representation using typical scaling relations in a centrifugal field, with a scaling factor of η (virtual model/physical model). The advantage of this approach is that a high scaling factor, represented by λ = μ × η (prototype/physical model), may be divided into two smaller scaling factors, μ and η. By doing so, the centrifuge model tests can be conducted using the lower scaling factor η. The scaling factor for the existing centrifuge facilities can be increased by a factor of μ. The suggested method is validated by algebraic derivations that rely on the mechanics of model tests. It is presumed that the prototype and model use the same soil material, resulting in a density scale factor of one. There may be debates on the most essential set of scaling elements to utilize, and some of the factors introduced may be considered separate factors, while the soil will often assert its influence over perceived independence.
In their study, Al-Wakel et al. [4] conducted experiments to investigate the dynamic behavior of individual piles and groups of piles in a dry sand environment. The analysis includes an investigation of the displacement response when subjected to harmonic excitation. Furthermore, a numerical simulation is conducted using a three-dimensional formulation with a finite element approach to replicate the experimental model. The numerical model results showed that a good agreement was achieved between the measured experimental model and the results of the dynamic response predicted by the numerical program.
In their study, Al-Wakel et al. [5] examined the dynamic response of a machine foundation on saturated soil when subjected to harmonic vertical vibrations by conducting a systematic experiment. The machine is simulated using the rotating mass-type oscillator principle. Furthermore, a mechanical assembly is attached to the oscillator and linked to a tachometer to quantify the dynamic force frequency. Additionally, a vibration meter is utilized to measure the response of displacement. A three-dimensional finite element method mimics the experimental model on a prototype scale through numerical modeling. The results demonstrate a strong correlation between the outcomes of the numerical model and the experimental model results. It can be concluded, based on the small-scale model, that for machine foundations on wet soil, the highest displacement response occurs in the middle of the foundation. In addition, as the number of piles increases, the displacement response of the pile foundation decreases due to the increase in the mass of the foundation.
The response and behavior of machine foundations resting on dry and saturated sand were investigated experimentally by Fattah et al. [6]. A physical model was developed to simulate steady-state dynamic loading on soil and footing. The model evaluated the soil and footing responses at different operating frequencies. The study showed that the foundation’s maximum displacement amplitude response is higher in dry sand models compared to saturated sand models, with an increase of approximately 5.0–10%. When the footing size is doubled, both in saturated and dry sand conditions, the maximum displacement amplitude of the footing is reduced by half. The final settlement of the foundation (St) increases as the value of the operating frequency, dynamic force, and degree of saturation increase. Meanwhile, a decrease occurs as the relative density of sand, modulus of elasticity, and embedding into soils increase. The pore water pressure increases as the amplitude of dynamic loading, the operating frequency, and the relative density of the sand, increase.
Borghei and Ghayoomi [7] conducted an experimental assessment of the effectiveness of the “two-stage scaling” technique on two geotechnical centrifuge models that replicated the identical prototype structure. The purpose was to investigate soil-structure interaction (SSI) problems. The first model was developed using traditional scaling parameters for centrifuges. The second model employed a two-stage process to establish new scaling factors between a prototype and a physical model. This approach allows for conducting dynamic tests with high scaling factors in lower acceleration fields. The researchers determined that the reaction to the application of force on the models in the prototype size was roughly comparable. The “two-stage scaling” method proved more effective in capturing the inertial interaction effects compared to the kinematic interaction effects.
Wang and Li [8] conducted a parametric study using several centrifuge tests to determine the most effective hybrid foundation design. The analysis took into account the diameter and thickness of the wheel, as well as the length of the pile. The lateral capacity of the hybrid monopile foundation is directly proportional to the diameter of the wheel and tends to expand rapidly. It also increases with the wheel thickness and pile length linearly. In comparison to the other parameters, the impact of the wheel diameter is more significant. The hybrid monopile has superior performance in comparison to both the monopile and the single-wheel. The enhancement is particularly pronounced when the pile lengths are modest. The hybrid monopile demonstrates its efficacy in minimizing the length of the pile. It offers significant promise for decreasing capital costs.
Qaftan et al. [9] discussed scaling and designing a multi-story concrete wall building with a 1:50 scale factor. They chose a specific type of uniformly round particles dry sand and a specific grain size distribution. They designed and manufactured a soil container with adaptable properties to accurately simulate the behavior of soil boundaries under seismic excitations time history. The experimental investigations were conducted in three distinct phases: a fixed base structure without soil interaction, a soil container without any structure, and a structure in the soil container with raft and pile foundations. Eventually, the identical experimental phases were simulated computationally using a 3D finite element program. The results suggested that the simulations of finite elements yielded an encouraging response in comparison to the experimental data. In dynamic studies, these numerical models are appropriate for further utilization.
Abdulrasool et al. [10] conducted experiments on machine foundations, both circular and rectangular, placed on clay soil with varying degrees of saturation (100 and 60%). The objective was to determine the displacement amplitude response of the foundation at different operating frequencies. Furthermore, the study discusses the vertical stress and displacements inside the soil, which are distributed at three specific locations under the foundation. These locations are located at distances of 0.5B, B, and 2B. The experimental results showed that increasing the degree of saturation reduced the foundation’s amplitude displacement by approximately 61%. The soil’s degree of saturation increased, resulting in a reduction of around 77% in vertical stress. Changes in saturation levels have a significant impact on soil displacement. The impacts are dependent on the proximity of the point to the foundation. According to the experimental model’s findings, they concluded that the center of the foundation experiences the highest amplitude of displacement. Furthermore, as the number of piles grows, the displacement response of the pile foundation decreases due to increasing foundation mass.
Shah et al. [11] conducted a study to demonstrate the application of using an advanced Hardening Soil Model for calculating the settlement of foundations in coastal regions and a numerical simulation was conducted using the Finite Element Program PLAXIS 2D. Initially, the Mohr–Coulomb (MC) Model was employed to calculate the settlement of a ten-story building in the soil near the coast. Furthermore, parametric analyses were conducted to examine the impacts of the modulus of elasticity, permeability, and dilatancy angle. The findings primarily indicate that the settlement of the building, which was erected on a piled raft foundation, was 40% more when anticipated using the MC model compared to the hardening soil HS model. The findings indicate that the HS model is preferable to the MC model for predicting the settlement of the piled raft foundation.
It is worth mentioning the difficulty in the present work regarding the leak of information regarding the scaling factors in geotechnical engineering and the absence of clear examples clarifying this subject. Another source of complexity is that the analysis of flexible frame foundations is more sophisticated than that of conventional rigid mat foundations, requiring a combination of structural and geotechnical engineering understanding, along with the difficulties in modeling the soil-structure interaction (SSI) in their analysis assessment.
The main goal of this research is to study the effect of adopting different scale factors for laboratory models and compare the calculated results of these models’ dynamic responses, which are conducted using numerical analyses, with the original prototype results of the frame foundation. The choice of the best model scale factor will affect the foundation size and the speed of the model rotor machine required to represent the effect of the prototype turbo generator speed, this is a cornerstone in studying high-speed turbo machines in geotechnical engineering to replicate the model’s true dynamic response and to extrapolate these results to the prototype model. In addition to that, the effect of using other materials is investigated to speed up the time required to get the system responses. These reflect the novelty of the present study.
2 Verification of ANSYS Workbench program
Before studying the impact of the scale factor “n” on the dynamic responses of frame foundations, a specific case study was selected from the well-known book entitled “Foundations for Industrial Machines: Handbook for Practicing Engineers” by Bhatia [12] to validate the Ansys Workbench software. The case study involves a concrete frame foundation built for a high-speed rotating machine as shown in Figure 1, after specifying the concrete properties, as shown in Table 2, and boundary conditions for the problem as stated by the sourcebook.
![Figure 1
Details of frame foundation from Bhatia’s work [12].](/document/doi/10.1515/eng-2024-0065/asset/graphic/j_eng-2024-0065_fig_001.jpg)
Details of frame foundation from Bhatia’s work [12].
Physical properties of concrete and steel material
| Material properties | Concrete used by Bhatia [12] | Steel |
|---|---|---|
| Mass density of concrete ρ (kg/m3) | 2,500 | 7,850 |
| Young’s modulus E (GN/m2) | 30 | 200 |
| Poisson’s ratio μ | 0.15 | 0.3 |
| Shear modulus G (GN/m2) | 13.043 | 76.923 |
Modal analyses were conducted to determine the prototype source frame’s natural frequencies. The frequencies of these foundations are important to compare with the operating frequencies of the rotating machine to prevent resonance and damage to the expensive rotating machine.
Table 3 tabulates the finite element modal analysis results using ANSYS21 software for the machine mass case, focusing on the first 20 modes. The results of the finite element show good agreement with the static and dynamic results conducted by Bhatia [12], indicating the accuracy of the model in the study using the ANSYS program. A separate publication [13] outlines the findings of the modal analysis verification, both with and without consideration of machine mass. It was concluded that the calculated natural frequencies when excluding machine mass are close to those presented by Bhatia [12], but the second mode shape was different, while the mode shapes were identical when the machine mass was included, but the calculated natural frequencies are less accurate than the first case when machine mass was excluded. In both cases, the accuracy of the calculated natural frequencies was above 90%, but the mode shape of the second case is more representative according to regular standard code recommendations by including the machine mass during the calculation of the natural frequencies.
Modal analysis results using ANSYS21 vs Bhatia work [12]
| Mode no. | Freq. (Hz) Bhatia | Freq. (Hz) Ansys | Mode no. | Freq. (Hz) Bhatia | Freq. (Hz) Ansys | Mode no. | Freq. (Hz) Bhatia | Freq. (Hz) Ansys | Mode no. | Freq. (Hz) Bhatia | Freq. (Hz) Ansys |
|---|---|---|---|---|---|---|---|---|---|---|---|
| 1 | 2.95 | 2.9755 | 6 | 33.2 | 32.113 | 11 | 36.75 | 36.362 | 16 | 39.43 | 38.764 |
| 2 | 3.02 | 3.0458 | 7 | 35.57 | 32.304 | 12 | 36.78 | 36.849 | 17 | 39.83 | 39.518 |
| 3 | 3.67 | 4.0814 | 8 | 36.4 | 33.188 | 13 | 36.8 | 36.974 | 18 | 42.67 | 40.067 |
| 4 | 26.48 | 23.859 | 9 | 36.45 | 35.184 | 14 | 37.05 | 37.19 | 19 | 45.81 | 41.799 |
| 5 | 32.36 | 30.057 | 10 | 36.62 | 36.169 | 15 | 38.7 | 38.299 | 20 | 58.88 | 42.918 |
These prototype results will be the reference for the results that will be calculated for the scaled models. The results of the harmonic analysis will also serve as a reference for the dynamic responses of the selected models.
3 Problem description
The effect of scale factor “n” is usually conducted by adopting a general scale factor for the prototype dimensions, this procedure may be satisfied in static analysis assuming that the same density is adopted for the prototype and 1-g laboratory or n-g models. In dynamic analysis, especially when dealing with high-speed turbo machines, the effect of time must be accounted, which will mainly affect the angular velocity of the rotating machine’s model as described in Table 1, so as to simulate the prototype motor speed of high-speed turbo machines, usually in the order of 3,000–3,600 rpm corresponding to 50–60 Hz frequency, the model frequency required to simulate the prototype behavior is in the order of 50 × n to 60 × n, if we neglect the effect of soil. But unfortunately this effect is not included in most research works, which claimed studying of high-speed turbo machines while the models’ rotating speeds were in the order of 3,500–5,000 rpm. This implies that these studies are far from the category of high-speed machines and it belongs to low-speed machines category.
The structure of the prototype frame is composed of two columns of 1.1 × 1.0 m and four columns of 1.0 × 1.0 m; the tabletop has a thickness of 1.8 m and dimensions of 8.0 × 13.8 m, which contains two bearing locations as shown in Figure 2; and finally, the measures of the raft foundation are 8.0 × 13.5 × 2.0 m.
![Figure 2
Bearing locations and tabletop dimensions of frame foundation from the study by Bhatia [12].](/document/doi/10.1515/eng-2024-0065/asset/graphic/j_eng-2024-0065_fig_002.jpg)
Bearing locations and tabletop dimensions of frame foundation from the study by Bhatia [12].
To study the effect of the scaling factor, the prototype frame dimensions and specification and results are adopted as a reference line for the model results. Four scaling factors were selected (20, 25, 32, and 40), since most prototype-to-model dimensions ratios are around these numbers to have a reasonable model size that is easy to handle when dealing with it in the laboratory.
Dimensions for each model are modified based on the selected scale factor and a finite element model is constructed. forces are applied at specified locations after modifying these force values in accordance with Table 1 for the four models, to account for the scaling effect. The material properties are the same for all concrete models. Before the meshing process, all elements’ sizes are modified by scaling them to achieve the same meshing intensity as in the prototype meshing layout. The element length of 500/n mm is used for all meshed models.
Figure 2 shows the particular locations where the rotating machinery, such as the generator and turbine, bear the load (points 1, 2, 3, and 4). Table 4 shows the exact values of both the static and dynamic loads resulting from the rotating masses on the assigned bearing points located on the frame foundation tabletop.
Machine loads and unbalance forces at top deck from the study by Bhatia [12]
| Bearing points | 1 | 2 | 3 | 4 | Total |
|---|---|---|---|---|---|
| Total machine weight (kN) | 400 | 360 | 200 | 200 | 1,160 |
| Rotor weight (kN) | 25 | 35 | 70 | 70 | 200 |
| Unbalance force | |||||
| Lateral/vertical (kN) | 5 | 7 | 15 | 15 | 42 |
| Longitudinal (kN) | 2 | 3 | 6 | 6 | 17 |
| Blade loss force (kN) | 3 | 11 | — | — | 14 |
3.1 Program data
The frame foundation was first created using Ansys Space Claim, with precise dimensions established for each scaled model. The ANSYS 21 Workbench is utilized to perform a three-dimensional dynamic analysis of the given problem. The frame structure is represented by eight bodies, which include the tabletop, six columns, and a raft.
Once the material properties for concrete or steel have been assigned, the three-dimensional structure has been meshed using SOLID186 elements with an element size of 500/n mm. This guarantees a precise result with a uniform shape for all raft and column body elements. However, the tabletop, which has a non-uniform shape, is meshed using SOLID187 tetrahedral elements suitable for irregular bodies. For the prototype frame foundation, the meshed structure includes 31,873 nodes and 14,445 elements, as shown in Figure 3.

Finite elements mesh for prototype concrete frame foundation.
The masses of the turbo machine were applied based on Table 3 using remote point masses with rigid behavior to represent the action of the rigid machine in comparison with the softer frame material. Compared to previous modeling approaches in other studies [11,12,14,15], this new technique is more accurate and requires less effort. They used rigid links or embedded the masses within the elements [16] to apply the machine mass on the frame structure at the rotor machine’s rotation axis. The total modified masses were applied to the frame by utilizing four remote points located at the appropriate bearing locations listed in Table 3.
The structure is analyzed under static loading, considering the specified adjusted scaled loads and boundary conditions for each model. All forces are modified by dividing the prototype loads by n 3. Thus, for the prototype dynamic load of 5,000 N, when applied to the scaled model with n = 40, the corresponding load is 0.078125 N. A fixed rigid boundary constraint was imposed on the bottom part of the raft structure, restricting both rotations and displacement in all three dimensions to zero (ROTX = ROTY = ROTZ = Ux = UY = Uz = 0). The six-column bodies are considered contact bodies while the upper and lower slabs are idealized as target bodies with a bounded type of contact between the contact surfaces.
Modal analysis, which is the fundamental and the basis of other dynamic analyses such as harmonic analysis, was performed for each model to calculate the mode shapes and natural frequencies of the frame foundation structure models, The modal analysis achieved the maximum number of 600 modes to be extracted for the prototype model. This was done within the frequency range of 0–1,000 Hz, while the range for n = 40 was 0–200,000) Hz. Unfortunately, the ratio of effective mass to total mass achieved for the six degrees of freedom was below the minimum recommended ratio of 90% which is recommended by different codes to confirm that enough modes have been extracted for further analysis. This may be due to fixing the lower part of the 3D raft elements, thereby preventing these constrained elements masses from participating in each mode, hence any further increase in the number of modes to be extracted will not increase the ratio to 90% since these higher frequencies participating factors are negligible. This does not mean that the results of the natural frequencies are wrong but we need to adopt another way to calculate the response of the system, so we can compare the results with confidence with those obtained by the modal analysis by codes recommendations.
The harmonic forced vibration analysis is performed with two methods. The first method is the mode superposition method. This is the fastest method, which depends on the prestressed modal analysis mode shapes and natural frequencies. The displacement, velocity, and acceleration amplitude responses for the prototype frame are calculated in the range of 0–80 Hz, the recommended minimum frequency to be accounted for is usually in the order of 1.2× operating frequency, which means a minimum frequency of 60 Hz will be enough to capture the harmonic forced vibration responses of the system, but 80 Hz was adopted in this analysis with a solution interval of 300. The scaled models’ frequencies to account for each model will be (0–80 × n) Hz with a time interval of 300. Hence, for a scale factor of 20, the range of frequencies is 0–1,600 Hz with 300 solution intervals.
The second method to calculate the harmonic forced vibration responses is the full method. This method solves system matrices directly to calculate harmonic responses and does not depend on the modal analysis results. The method is computationally expensive and time-consuming but shall give more accurate results compared to that obtained by the fast superposition method. No consideration was made to the transient phase since this is a harmonic analysis and all dynamic forces generated from the transient phase diminish after a few cycles of rotation and the steady state is reached. A small amount of damping of 5% was given to ensure that the structure response would not go to infinity at resonance frequency during the solution. Again, the range of studied frequencies for the prototype and models ranges between (0 and 80 × n) Hz with 300 solution intervals for each model, noting that the scale factor for the prototype is unity.
3.2 Comparison of analysis methods
Figure 4 shows the result of the displacement amplitude vs frequency in the vertical direction for the two methods. Both methods gave a similar result when the studied frequencies were away from the resonance frequency, but when the load frequency approached the resonance, the full method gave a higher response than the mode superposition method, and the results did not coincide. Therefore, it is convenient to declare that although the mass participating ratio for the mode superposition method is below the code’s recommended ratio of 90% when the load frequency is out of the range of ±20% of the resonance frequency area, there is no remarkable difference between the full and mode superposition methods.

Displacement response for full vs mode superposition method results.
The study of the effect of scale factor on the response of concrete frame foundations is carried out by using Modal analysis to find the system’s natural frequencies. The natural frequencies play a crucial role in the construction of frame foundations. They are compared to the working frequency of the turbomachine to prevent the occurrence of resonance. No loads were assigned to the frame structure during the modal solution.
The second type of analysis is steady-state harmonic forced vibration. The same concrete structure with the same meshing elements was analyzed after assigning all dynamic forces, as mentioned in Table 3, at specified bearing locations in vertical and horizontal directions in the plane of rotation and along the longitudinal axis of rotation. To simulate the real case of loading, the vertical and horizontal in-plane dynamic forces were applied at the specified location with a phase angle of 90° between the two dynamic forces.
The second part of this study contains the possibility of using scaled steel models in place of concrete models, as steel material is more appropriate than concrete models in terms of manufacturing time, handling, and not being subjected to cracking during tests. The same structure with the same meshing is replaced by the steel material properties as tabulated in Table 3, and then the same procedure adopted for concrete models is carried out on two steel models: a full-dimension prototype steel model and a steel model with a scale factor of 20. The results for this model are investigated to show the possibility of replacing concrete structures with steel models and the degree of accuracy of the results in both cases.
Before demonstrating the results of dynamic analyses on concrete and steel models, which are different from those carried out on concrete models, it is crucial to find a relationship between the two similar models but with different materials. To find this relation, it is essential to use Table 1 to scale the effect of changing material properties on the pre-defined scaling factors, thus using the general relationship to rewrite all affected factors with new factors that will include the effect of the material. The length factor “
Scale factors for concrete and steel models
| Quantity | General | 1 g (concrete to concrete) | 1 g (steel to concrete) |
|---|---|---|---|
| Length |
|
1/
|
1/
|
| Mass density |
|
1 | 3.14 |
| Acceleration |
|
1 | 1 |
| Stiffness |
|
1/
|
6.667/
|
| Stress |
|
1/
|
3.14/
|
| Force |
|
1/
|
3.14/
|
| Force/unit length |
|
1/
|
3.14/
|
| Strain |
|
1/
|
0.471/
|
| Displacement |
|
1/
|
0.471/
|
| Time (dynamic) |
|
1/
|
1/[1.4571 ×
|
| Frequency | [
|
|
1.4571 ×
|
4 Results and discussion
The study results will include two model types. The first type is the result of using concrete models with five different scaling factors. The second type is the result of using a steel model with two scale factors for comparison with the concrete prototype model.
4.1 Concrete models
The static analysis of the frame foundation is carried out to check the static results with Bhatia’s results in his previous book. The modal analysis used the static structure as a prestress model to calculate the natural frequencies without any consideration of any loading type except applying the fixed boundary condition to the lower part area of the raft foundation. The same meshed frame structure was analyzed for harmonic analysis after applying all modified dynamic loads and masses to the different cases of the turbine-generator machine frame. During harmonic analysis, all dynamic loads were applied in one run in all directions, with the actual phase being different between vertical and lateral loading. This procedure simulates the real case.
Figure 5 shows the results of modal analysis for different frame dimensions. The general behavior is the same for all modes, and the first two modes are translational, the third mode is characterized by torsional mode, and the fourth mode is vertical.

Natural frequencies for different scale factors.
From Figure 5, it can be stated that within the studied cases, the scale factor for the different cases produces similar behavior but with different natural frequencies for each mode number of the frame structure. The smaller the model, the higher the natural frequency required to cause resonance in that mode. To normalize the different frequencies of each mode and case, the frequency of each case is divided by the scale factor “n” as presented in Figure 6. All curves are transformed into one curve that can be used as a general figure.

Normalized natural frequencies for different scale factors.
Figures 7–9 show the results of the horizontal and vertical displacement responses for the steady-state harmonic analyses in X-, Y-, and Z-directions, respectively, for different models with different scale factors. All results show a similar behavior for all models in all directions: the frequency at which resonance is activated increases as the scale factor increases; the smaller the model in dimensions, the higher the frequency required to cause resonance in that direction. The increase in scale factor decreases the displacement response and increases the resonant frequencies required to produce the maximum response in that direction. The maximum response value for any scale factor was in the horizontal x-direction, then the z-direction, and finally the vertical y-direction, which produced the minimal response.

Amplitude of displacement along X-direction for different scale factor models.

Amplitude of displacement along Y-direction for different scale factor models.

Amplitude of displacement along Z-direction for different scale factor models.
The maximum horizontal displacement in the X-direction is 6.325 µm for the 20-scale factor, which corresponds to a frequency of 62 Hz, and the minimal maximum response of 1.5864 µm, corresponding to the 124 Hz frequency for the 40-scale factor.
The maximum vertical displacement in the Y-direction is 0.099505 µm for the 20-scale factor, corresponding to a frequency of 478 Hz, and the minimal maximum response for the 40-scale factor was 0.024853 µm, corresponding to a frequency of 956 Hz.
The maximum horizontal displacement in the Z-direction is 2.6701 µm for the 20-scale factor, corresponding to a frequency of 61 Hz, and the minimal maximum response for the 40-scale factor was 0.66419 µm, corresponding to 120 Hz. The general behavior is that the smaller the scale factor, the higher the vertical response to be expected.
Figures 10–12 show the more generalized behavior for the studied foundation responses in any direction by dividing the loading frequencies by the scale factor and multiplying the Y-axis by n 2. This figure represents the total response of the frame foundation in each direction under the action of the mentioned dynamic forces and masses applied at the bearing locations. All models are now a single curve. Hence, the harmonic responses for models can be extrapolated to get the prototype responses with high confidence in any direction.

Normalized amplitude of displacement for different models along X-direction.

Normalized amplitude of displacement for different models along Y-direction.

Normalized amplitude of displacement for different models along Z-direction.
To get the three directional responses, the natural frequencies for the frame foundation in X-, Y-, and Z-directions are calculated for the prototype, and the scaled models are tabulated in Table 6. The first mode is translational in the Z-direction; the second mode is translational in the X-direction; and finally, the fourth mode is the Y-direction vertical mode.
Natural frequencies for different concrete scaled models
| Mode no. | Mode direction | Scale factor | ||||
|---|---|---|---|---|---|---|
| 1 | 20 | 25 | 32 | 40 | ||
| Natural frequency for frame (Hz) | ||||||
| 1 | Z | 3.0856 | 61.722 | 77.212 | 98.744 | 123.4 |
| 2 | X | 3.0128 | 60.264 | 75.368 | 96.437 | 120.51 |
| 4 | Y | 23.923 | 478.49 | 598.27 | 765.52 | 956.96 |
Figure 13 represents a more generalized behavior for the studied concrete frame foundation by dividing the loading frequencies by the natural frequency for each direction. The displacement responses for each direction were also normalized by dividing them by the static response of each direction, i.e., the response when the frequency is zero. This figure represents the total horizontal and vertical responses of the frame foundation under the action of the mentioned dynamic forces and masses applied at the bearing locations. All curves for the prototype and scaled models are turned into a single curve representing the total response for the flexible frame foundation when the damping ratio is 5%. This curve is similar to the curve representing the response for rigid raft foundations presented in many textbooks, but the responses for frame foundations at resonance are approximately double the responses of rigid foundations.
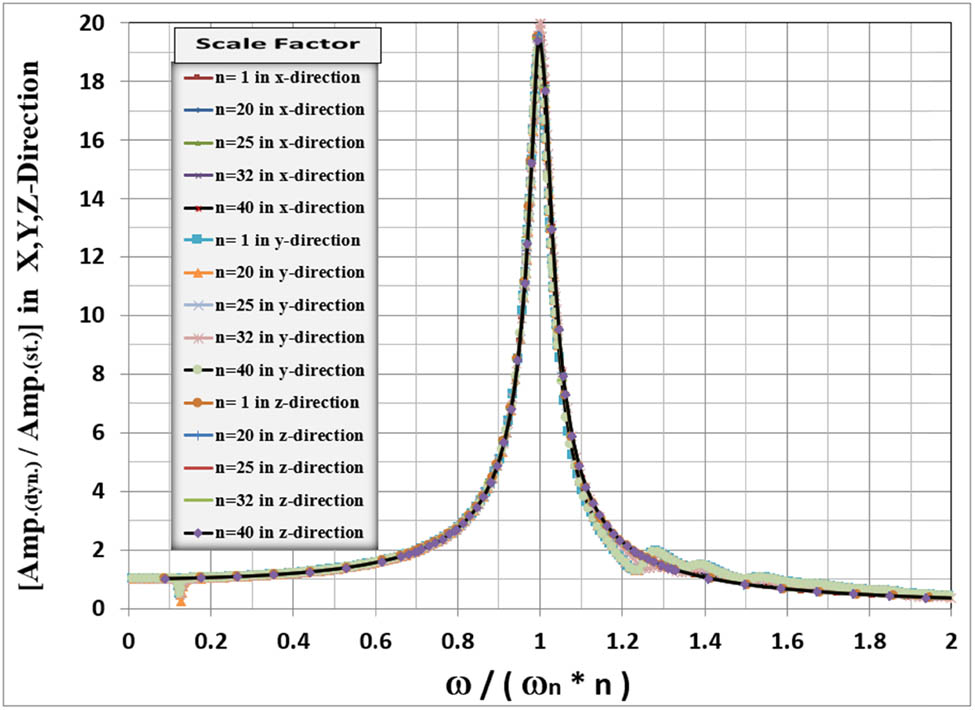
Normalized amplitude vs frequencies of vertical and horizontal response for different models.
4.2 Steel models
Figure 14 shows the results of modal analysis for different steel frame dimensions. The general behavior is the same for all modes, and the first two modes are translational; the third mode is torsional mode; and the fourth mode is vertical.

Natural frequencies for different materials and scale factors.
From Figure 14, it can be stated that there is a different response of the structure to vibrate with different frame materials and scales. The smaller the model size and the stronger the material, the higher the natural frequency required to cause resonance in that mode.
To take into account the change in material and scale factor, the natural frequency of the concrete and steel foundation is divided by the corresponding scale factor of Table 5 for concrete and steel material, while the X-axis is kept unchanged. The results are shown in Figure 15. All three curves are transformed into one curve that can be used as a general figure for the dynamic results of free vibration for a prototype concrete frame foundation based on a steel or concrete scaled model.

Normalized natural frequencies for different materials models.
Figures 16–18 show the results of the horizontal and vertical displacement responses for the steady-state harmonic analyses in X-, Y-, and Z-directions for different models with different materials. The steel model exhibits a lower response than the concrete frame but with a higher frequency required to cause resonance in that direction. The maximum response value for any direction was in the horizontal X-direction, then the Z-direction, and finally the vertical Y-direction, which produced the minimal response.

Amplitude of displacement along the X-direction for different materials models.

Amplitude of displacement along the Y-direction for different materials models.

Amplitude of displacement along the Z-direction for different materials models.
The maximum horizontal displacement in the X-direction is 2579.9 µm for the concrete with a corresponding frequency of 3.09 Hz, and the maximum response for the steel model was 1188.2 µm, corresponding to a 4.5 Hz frequency. The maximum horizontal displacement in the Y-direction is 39.859 µm for the concrete with a corresponding frequency of 23.92 Hz, and the maximum response for the steel model was 18.304 µm, corresponding to a frequency of 35.15 Hz. The maximum horizontal displacement in the Z-direction is 1083.2 µm for the concrete with a frequency of 3.01 Hz, and the maximum response for the steel model was 506.05 µm, corresponding to a 4.4 Hz frequency.
To get the three directional responses, the natural frequencies for the frame foundation in X-, Y- and Z-directions are calculated for the concrete and steel prototype and the scaled steel model, as shown in Table 7. The first mode is the translational mode in the Z-direction; the second mode is the translational mode in the X-direction; and the fourth mode is the Y-direction vertical mode.
Natural frequencies for different model materials and scale factors
| Mode no. | Mode direction | Material of model | ||
|---|---|---|---|---|
| Concrete, n = 1 | Steel, n = 1 | Steel, n = 20 | ||
| Natural frequency for frame (Hz) | ||||
| 1 | Z | 3.0856 | 4.5157 | 90.397 |
| 2 | X | 3.0128 | 4.4108 | 88.297 |
| 4 | Y | 23.923 | 35.166 | 703.36 |
Figure 19 shows the normalized chart for the studied frame foundation responses in the X-, Y-, and Z-directions. The figure is normalized by dividing the loading frequencies by the natural frequency of that direction, as tabulated in Table 6, and dividing the Y-axis by the static response. This figure represents the total response of the frame foundation, combining the change in material and scale factor in every direction under the action of the mentioned dynamic forces and masses applied at the bearing locations. all models are now a single curve. Hence the modal and harmonic responses for prototype concrete models can be extrapolated from scaled steel models to get the prototype responses with high confidence for any direction by using scaled models but with different materials.

Normalized amplitude vs frequencies of vertical and horizontal response for different material and scaled models.
5 Conclusion
Based on the outcomes of the numerical analysis conducted on the designated frame foundation, considering the material qualities and boundary circumstances, the next conclusions are limited to these specific situations.
The study of models with a proper scale factor can capture and represent the prototype performance, and thus a detailed examination can be carried out on small models before constructing the structure.
Changing structure material can be used to obtain similar responses from prototype structures, but with the appropriate scaling factors for the results.
Decreasing the scale factor “n,” i.e., using larger models, will result in increasing the vertical response and decreasing the natural frequency required to cause resonance.
The effect of scaling frequencies is essential in studying the high-speed turbomachines’ foundational responses.
Both the full method and the mode superposition method give the same vertical displacement response when the load frequencies do not match or are within ±20% of the natural frequencies of the system.
Even when the ratio of effective mass to total mass for the studied principal direction is less than 90%, as recommended by different codes, you can rely on the results of the superposition method when the load frequency is far from the resonance frequency.
-
Funding information: Authors state no funding involved.
-
Author contributions: All authors have accepted responsibility for the entire content of this manuscript and consented to its submission to the journal, reviewed all the results, and approved the final version of the manuscript. MYF and MKM designed the experiments and AAA carried them out. AAA developed the model code and performed the simulations. MYF prepared the manuscript with contributions from all co-authors.
-
Conflict of interest: The authors state no conflict of interest.
-
Data availability statement: Most datasets generated and analyzed in this study are comprised in this submitted manuscript. The other datasets are available on reasonable request from the corresponding author with the attached information.
References
[1] Wood DM. Geotechnical modelling. Oxfordshire: Taylor & Francis; 2004.10.4324/9780203477977Search in Google Scholar
[2] Kutter BL. Dynamic centrifuge modeling of geotechnical structures. Transp Res Rec. 1992;2(1336):1081–6.Search in Google Scholar
[3] Iai S, Tobita T, Nakahara T. Generalised scaling relations for dynamic centrifuge tests. Geotechnique. 2005;55(5):355–62.10.1680/geot.55.5.355.66019Search in Google Scholar
[4] Al-Wakel SFA, Mahmoud MR, Abdulrasool AS. Experimental studies and finite element modeling of piles and pile groups in dry sand under harmonic excitation. J Eng. 2014;20(7):48–61.10.31026/j.eng.2014.07.04Search in Google Scholar
[5] Al-Wakel SFA, Fattah MY, Karim HH, Chan AHC. Experimental and numerical modeling of machine foundations on a saturated soil. Numer Methods Geotech Eng. 2015;(1336):24–30.Search in Google Scholar
[6] Fattah MY, Al-Mosawi MJ, Al-Ameri AFI. Dynamic response of saturated soil-foundation system acted upon by vibration. J Earthq Eng. 2017;21(7):1158–88.10.1080/13632469.2016.1210060Search in Google Scholar
[7] Borghei A, Ghayoomi M. Experimental evaluation of two-stage scaling in physical modeling of soil-foundation-structure systems. In Proc, 9th Int Conf on Physical Modelling in Geotechnics (ICPMG); 2018. p. 349–54.10.1201/9780429438660-47Search in Google Scholar
[8] Wang X, Li J. Parametric study of hybrid monopile foundation for offshore wind turbines in cohesionless soil. Ocean Eng. 2020;218:108172.10.1016/j.oceaneng.2020.108172Search in Google Scholar
[9] Qaftan OS, Toma-Sabbagh T, Weekes L, Augusthus-Nelson L. Validation of a finite element modelling approach on soil-foundation-structure interaction of a multi-storey wall-frame structure under dynamic loadings. Soil Dyn Earthq Eng. 2020;131:106041.10.1016/j.soildyn.2020.106041Search in Google Scholar
[10] Abdulrasool AS, Fattah MY, Salim NM. Displacements and stresses induced by vibrations of machine foundation on clay soil of different degrees of saturation. Case Stud Constr Mater. 2022;17:e01327.10.1016/j.cscm.2022.e01327Search in Google Scholar
[11] Shah SRA, Kumar A, Zardari MA, Ali TH, Bhanbhro R. Numerical analysis of settlement of a Piled Raft foundation on coastal soil. Civ Eng J. 2023;9(2):319–33.10.28991/CEJ-2023-09-02-05Search in Google Scholar
[12] Bhatia KG. Foundations for industrial machines and earthquake effects. ISET J Earthq Technol Pap. 2008;45(495):1–2.Search in Google Scholar
[13] Ahmed AA, Fattah MY, Mohsen MK. A static and dynamic analysis of a high-speed turbo machine foundation. Eng Technol J. 2023 Nov [cited 2023 Nov 14];41(11):1390–402. https://etj.uotechnology.edu.iq/article_181024.html.10.30684/etj.2023.142820.1547Search in Google Scholar
[14] Tripathy S, Desai AK. Parametric study of turbo generator foundation considering different types of beam column joint. Mater Today Proc. 2017;4(9):9763–7.10.1016/j.matpr.2017.06.263Search in Google Scholar
[15] Giorgetti S, Giorgetti A, Tavafoghi Jahromi R, Arcidiacono G. Machinery foundations dynamical analysis: a case study on reciprocating compressor foundation. Machines. 2021;9(10):228.10.3390/machines9100228Search in Google Scholar
[16] Bhattacharya S. Analysis and design of tabletop foundation for turbine generators. In Recent advances in structural engineering. Vol. 1, Springer Nature Singapore Pvt Ltd.: Springer; 2019. p. 3–17.10.1007/978-981-13-0362-3_1Search in Google Scholar
© 2024 the author(s), published by De Gruyter
This work is licensed under the Creative Commons Attribution 4.0 International License.
Articles in the same Issue
- Regular Articles
- Methodology of automated quality management
- Influence of vibratory conveyor design parameters on the trough motion and the self-synchronization of inertial vibrators
- Application of finite element method in industrial design, example of an electric motorcycle design project
- Correlative evaluation of the corrosion resilience and passivation properties of zinc and aluminum alloys in neutral chloride and acid-chloride solutions
- Will COVID “encourage” B2B and data exchange engineering in logistic firms?
- Influence of unsupported sleepers on flange climb derailment of two freight wagons
- A hybrid detection algorithm for 5G OTFS waveform for 64 and 256 QAM with Rayleigh and Rician channels
- Effect of short heat treatment on mechanical properties and shape memory properties of Cu–Al–Ni shape memory alloy
- Exploring the potential of ammonia and hydrogen as alternative fuels for transportation
- Impact of insulation on energy consumption and CO2 emissions in high-rise commercial buildings at various climate zones
- Advanced autopilot design with extremum-seeking control for aircraft control
- Adaptive multidimensional trust-based recommendation model for peer to peer applications
- Effects of CFRP sheets on the flexural behavior of high-strength concrete beam
- Enhancing urban sustainability through industrial synergy: A multidisciplinary framework for integrating sustainable industrial practices within urban settings – The case of Hamadan industrial city
- Advanced vibrant controller results of an energetic framework structure
- Application of the Taguchi method and RSM for process parameter optimization in AWSJ machining of CFRP composite-based orthopedic implants
- Improved correlation of soil modulus with SPT N values
- Technologies for high-temperature batch annealing of grain-oriented electrical steel: An overview
- Assessing the need for the adoption of digitalization in Indian small and medium enterprises
- A non-ideal hybridization issue for vertical TFET-based dielectric-modulated biosensor
- Optimizing data retrieval for enhanced data integrity verification in cloud environments
- Performance analysis of nonlinear crosstalk of WDM systems using modulation schemes criteria
- Nonlinear finite-element analysis of RC beams with various opening near supports
- Thermal analysis of Fe3O4–Cu/water over a cone: a fractional Maxwell model
- Radial–axial runner blade design using the coordinate slice technique
- Theoretical and experimental comparison between straight and curved continuous box girders
- Effect of the reinforcement ratio on the mechanical behaviour of textile-reinforced concrete composite: Experiment and numerical modeling
- Experimental and numerical investigation on composite beam–column joint connection behavior using different types of connection schemes
- Enhanced performance and robustness in anti-lock brake systems using barrier function-based integral sliding mode control
- Evaluation of the creep strength of samples produced by fused deposition modeling
- A combined feedforward-feedback controller design for nonlinear systems
- Effect of adjacent structures on footing settlement for different multi-building arrangements
- Analyzing the impact of curved tracks on wheel flange thickness reduction in railway systems
- Review Articles
- Mechanical and smart properties of cement nanocomposites containing nanomaterials: A brief review
- Applications of nanotechnology and nanoproduction techniques
- Relationship between indoor environmental quality and guests’ comfort and satisfaction at green hotels: A comprehensive review
- Communication
- Techniques to mitigate the admission of radon inside buildings
- Erratum
- Erratum to “Effect of short heat treatment on mechanical properties and shape memory properties of Cu–Al–Ni shape memory alloy”
- Special Issue: AESMT-3 - Part II
- Integrated fuzzy logic and multicriteria decision model methods for selecting suitable sites for wastewater treatment plant: A case study in the center of Basrah, Iraq
- Physical and mechanical response of porous metals composites with nano-natural additives
- Special Issue: AESMT-4 - Part II
- New recycling method of lubricant oil and the effect on the viscosity and viscous shear as an environmentally friendly
- Identify the effect of Fe2O3 nanoparticles on mechanical and microstructural characteristics of aluminum matrix composite produced by powder metallurgy technique
- Static behavior of piled raft foundation in clay
- Ultra-low-power CMOS ring oscillator with minimum power consumption of 2.9 pW using low-voltage biasing technique
- Using ANN for well type identifying and increasing production from Sa’di formation of Halfaya oil field – Iraq
- Optimizing the performance of concrete tiles using nano-papyrus and carbon fibers
- Special Issue: AESMT-5 - Part II
- Comparative the effect of distribution transformer coil shape on electromagnetic forces and their distribution using the FEM
- The complex of Weyl module in free characteristic in the event of a partition (7,5,3)
- Restrained captive domination number
- Experimental study of improving hot mix asphalt reinforced with carbon fibers
- Asphalt binder modified with recycled tyre rubber
- Thermal performance of radiant floor cooling with phase change material for energy-efficient buildings
- Surveying the prediction of risks in cryptocurrency investments using recurrent neural networks
- A deep reinforcement learning framework to modify LQR for an active vibration control applied to 2D building models
- Evaluation of mechanically stabilized earth retaining walls for different soil–structure interaction methods: A review
- Assessment of heat transfer in a triangular duct with different configurations of ribs using computational fluid dynamics
- Sulfate removal from wastewater by using waste material as an adsorbent
- Experimental investigation on strengthening lap joints subjected to bending in glulam timber beams using CFRP sheets
- A study of the vibrations of a rotor bearing suspended by a hybrid spring system of shape memory alloys
- Stability analysis of Hub dam under rapid drawdown
- Developing ANFIS-FMEA model for assessment and prioritization of potential trouble factors in Iraqi building projects
- Numerical and experimental comparison study of piled raft foundation
- Effect of asphalt modified with waste engine oil on the durability properties of hot asphalt mixtures with reclaimed asphalt pavement
- Hydraulic model for flood inundation in Diyala River Basin using HEC-RAS, PMP, and neural network
- Numerical study on discharge capacity of piano key side weir with various ratios of the crest length to the width
- The optimal allocation of thyristor-controlled series compensators for enhancement HVAC transmission lines Iraqi super grid by using seeker optimization algorithm
- Numerical and experimental study of the impact on aerodynamic characteristics of the NACA0012 airfoil
- Effect of nano-TiO2 on physical and rheological properties of asphalt cement
- Performance evolution of novel palm leaf powder used for enhancing hot mix asphalt
- Performance analysis, evaluation, and improvement of selected unsignalized intersection using SIDRA software – Case study
- Flexural behavior of RC beams externally reinforced with CFRP composites using various strategies
- Influence of fiber types on the properties of the artificial cold-bonded lightweight aggregates
- Experimental investigation of RC beams strengthened with externally bonded BFRP composites
- Generalized RKM methods for solving fifth-order quasi-linear fractional partial differential equation
- An experimental and numerical study investigating sediment transport position in the bed of sewer pipes in Karbala
- Role of individual component failure in the performance of a 1-out-of-3 cold standby system: A Markov model approach
- Implementation for the cases (5, 4) and (5, 4)/(2, 0)
- Center group actions and related concepts
- Experimental investigation of the effect of horizontal construction joints on the behavior of deep beams
- Deletion of a vertex in even sum domination
- Deep learning techniques in concrete powder mix designing
- Effect of loading type in concrete deep beam with strut reinforcement
- Studying the effect of using CFRP warping on strength of husk rice concrete columns
- Parametric analysis of the influence of climatic factors on the formation of traditional buildings in the city of Al Najaf
- Suitability location for landfill using a fuzzy-GIS model: A case study in Hillah, Iraq
- Hybrid approach for cost estimation of sustainable building projects using artificial neural networks
- Assessment of indirect tensile stress and tensile–strength ratio and creep compliance in HMA mixes with micro-silica and PMB
- Density functional theory to study stopping power of proton in water, lung, bladder, and intestine
- A review of single flow, flow boiling, and coating microchannel studies
- Effect of GFRP bar length on the flexural behavior of hybrid concrete beams strengthened with NSM bars
- Exploring the impact of parameters on flow boiling heat transfer in microchannels and coated microtubes: A comprehensive review
- Crumb rubber modification for enhanced rutting resistance in asphalt mixtures
- Special Issue: AESMT-6
- Design of a new sorting colors system based on PLC, TIA portal, and factory I/O programs
- Forecasting empirical formula for suspended sediment load prediction at upstream of Al-Kufa barrage, Kufa City, Iraq
- Optimization and characterization of sustainable geopolymer mortars based on palygorskite clay, water glass, and sodium hydroxide
- Sediment transport modelling upstream of Al Kufa Barrage
- Study of energy loss, range, and stopping time for proton in germanium and copper materials
- Effect of internal and external recycle ratios on the nutrient removal efficiency of anaerobic/anoxic/oxic (VIP) wastewater treatment plant
- Enhancing structural behaviour of polypropylene fibre concrete columns longitudinally reinforced with fibreglass bars
- Sustainable road paving: Enhancing concrete paver blocks with zeolite-enhanced cement
- Evaluation of the operational performance of Karbala waste water treatment plant under variable flow using GPS-X model
- Design and simulation of photonic crystal fiber for highly sensitive chemical sensing applications
- Optimization and design of a new column sequencing for crude oil distillation at Basrah refinery
- Inductive 3D numerical modelling of the tibia bone using MRI to examine von Mises stress and overall deformation
- An image encryption method based on modified elliptic curve Diffie-Hellman key exchange protocol and Hill Cipher
- Experimental investigation of generating superheated steam using a parabolic dish with a cylindrical cavity receiver: A case study
- Effect of surface roughness on the interface behavior of clayey soils
- Investigated of the optical properties for SiO2 by using Lorentz model
- Measurements of induced vibrations due to steel pipe pile driving in Al-Fao soil: Effect of partial end closure
- Experimental and numerical studies of ballistic resistance of hybrid sandwich composite body armor
- Evaluation of clay layer presence on shallow foundation settlement in dry sand under an earthquake
- Optimal design of mechanical performances of asphalt mixtures comprising nano-clay additives
- Advancing seismic performance: Isolators, TMDs, and multi-level strategies in reinforced concrete buildings
- Predicted evaporation in Basrah using artificial neural networks
- Energy management system for a small town to enhance quality of life
- Numerical study on entropy minimization in pipes with helical airfoil and CuO nanoparticle integration
- Equations and methodologies of inlet drainage system discharge coefficients: A review
- Thermal buckling analysis for hybrid and composite laminated plate by using new displacement function
- Investigation into the mechanical and thermal properties of lightweight mortar using commercial beads or recycled expanded polystyrene
- Experimental and theoretical analysis of single-jet column and concrete column using double-jet grouting technique applied at Al-Rashdia site
- The impact of incorporating waste materials on the mechanical and physical characteristics of tile adhesive materials
- Seismic resilience: Innovations in structural engineering for earthquake-prone areas
- Automatic human identification using fingerprint images based on Gabor filter and SIFT features fusion
- Performance of GRKM-method for solving classes of ordinary and partial differential equations of sixth-orders
- Visible light-boosted photodegradation activity of Ag–AgVO3/Zn0.5Mn0.5Fe2O4 supported heterojunctions for effective degradation of organic contaminates
- Production of sustainable concrete with treated cement kiln dust and iron slag waste aggregate
- Key effects on the structural behavior of fiber-reinforced lightweight concrete-ribbed slabs: A review
- A comparative analysis of the energy dissipation efficiency of various piano key weir types
- Special Issue: Transport 2022 - Part II
- Variability in road surface temperature in urban road network – A case study making use of mobile measurements
- Special Issue: BCEE5-2023
- Evaluation of reclaimed asphalt mixtures rejuvenated with waste engine oil to resist rutting deformation
- Assessment of potential resistance to moisture damage and fatigue cracks of asphalt mixture modified with ground granulated blast furnace slag
- Investigating seismic response in adjacent structures: A study on the impact of buildings’ orientation and distance considering soil–structure interaction
- Improvement of porosity of mortar using polyethylene glycol pre-polymer-impregnated mortar
- Three-dimensional analysis of steel beam-column bolted connections
- Assessment of agricultural drought in Iraq employing Landsat and MODIS imagery
- Performance evaluation of grouted porous asphalt concrete
- Optimization of local modified metakaolin-based geopolymer concrete by Taguchi method
- Effect of waste tire products on some characteristics of roller-compacted concrete
- Studying the lateral displacement of retaining wall supporting sandy soil under dynamic loads
- Seismic performance evaluation of concrete buttress dram (Dynamic linear analysis)
- Behavior of soil reinforced with micropiles
- Possibility of production high strength lightweight concrete containing organic waste aggregate and recycled steel fibers
- An investigation of self-sensing and mechanical properties of smart engineered cementitious composites reinforced with functional materials
- Forecasting changes in precipitation and temperatures of a regional watershed in Northern Iraq using LARS-WG model
- Experimental investigation of dynamic soil properties for modeling energy-absorbing layers
- Numerical investigation of the effect of longitudinal steel reinforcement ratio on the ductility of concrete beams
- An experimental study on the tensile properties of reinforced asphalt pavement
- Self-sensing behavior of hot asphalt mixture with steel fiber-based additive
- Behavior of ultra-high-performance concrete deep beams reinforced by basalt fibers
- Optimizing asphalt binder performance with various PET types
- Investigation of the hydraulic characteristics and homogeneity of the microstructure of the air voids in the sustainable rigid pavement
- Enhanced biogas production from municipal solid waste via digestion with cow manure: A case study
- Special Issue: AESMT-7 - Part I
- Preparation and investigation of cobalt nanoparticles by laser ablation: Structure, linear, and nonlinear optical properties
- Seismic analysis of RC building with plan irregularity in Baghdad/Iraq to obtain the optimal behavior
- The effect of urban environment on large-scale path loss model’s main parameters for mmWave 5G mobile network in Iraq
- Formatting a questionnaire for the quality control of river bank roads
- Vibration suppression of smart composite beam using model predictive controller
- Machine learning-based compressive strength estimation in nanomaterial-modified lightweight concrete
- In-depth analysis of critical factors affecting Iraqi construction projects performance
- Behavior of container berth structure under the influence of environmental and operational loads
- Energy absorption and impact response of ballistic resistance laminate
- Effect of water-absorbent polymer balls in internal curing on punching shear behavior of bubble slabs
- Effect of surface roughness on interface shear strength parameters of sandy soils
- Evaluating the interaction for embedded H-steel section in normal concrete under monotonic and repeated loads
- Estimation of the settlement of pile head using ANN and multivariate linear regression based on the results of load transfer method
- Enhancing communication: Deep learning for Arabic sign language translation
- A review of recent studies of both heat pipe and evaporative cooling in passive heat recovery
- Effect of nano-silica on the mechanical properties of LWC
- An experimental study of some mechanical properties and absorption for polymer-modified cement mortar modified with superplasticizer
- Digital beamforming enhancement with LSTM-based deep learning for millimeter wave transmission
- Developing an efficient planning process for heritage buildings maintenance in Iraq
- Design and optimization of two-stage controller for three-phase multi-converter/multi-machine electric vehicle
- Evaluation of microstructure and mechanical properties of Al1050/Al2O3/Gr composite processed by forming operation ECAP
- Calculations of mass stopping power and range of protons in organic compounds (CH3OH, CH2O, and CO2) at energy range of 0.01–1,000 MeV
- Investigation of in vitro behavior of composite coating hydroxyapatite-nano silver on 316L stainless steel substrate by electrophoretic technic for biomedical tools
- A review: Enhancing tribological properties of journal bearings composite materials
- Improvements in the randomness and security of digital currency using the photon sponge hash function through Maiorana–McFarland S-box replacement
- Design a new scheme for image security using a deep learning technique of hierarchical parameters
- Special Issue: ICES 2023
- Comparative geotechnical analysis for ultimate bearing capacity of precast concrete piles using cone resistance measurements
- Visualizing sustainable rainwater harvesting: A case study of Karbala Province
- Geogrid reinforcement for improving bearing capacity and stability of square foundations
- Evaluation of the effluent concentrations of Karbala wastewater treatment plant using reliability analysis
- Adsorbent made with inexpensive, local resources
- Effect of drain pipes on seepage and slope stability through a zoned earth dam
- Sediment accumulation in an 8 inch sewer pipe for a sample of various particles obtained from the streets of Karbala city, Iraq
- Special Issue: IETAS 2024 - Part I
- Analyzing the impact of transfer learning on explanation accuracy in deep learning-based ECG recognition systems
- Effect of scale factor on the dynamic response of frame foundations
- Improving multi-object detection and tracking with deep learning, DeepSORT, and frame cancellation techniques
- The impact of using prestressed CFRP bars on the development of flexural strength
- Assessment of surface hardness and impact strength of denture base resins reinforced with silver–titanium dioxide and silver–zirconium dioxide nanoparticles: In vitro study
- A data augmentation approach to enhance breast cancer detection using generative adversarial and artificial neural networks
- Modification of the 5D Lorenz chaotic map with fuzzy numbers for video encryption in cloud computing
- Special Issue: 51st KKBN - Part I
- Evaluation of static bending caused damage of glass-fiber composite structure using terahertz inspection