Hazard zonation for potential earthquake-induced landslide in the eastern East Kunlun fault zone
-
Lifu Zheng
 ,
Guochao Fu
,
Guochao Fu

Abstract
Based on probabilistic seismic hazard analysis, the seismic landslide hazard research considers the spatial and temporal distribution characteristics of seismic peak ground acceleration, which integrates the factors such as seismic intensity, location, and recurrence time. The occurrence of future earthquakes has certain randomness. This article presents the landslide hazard zoning of the eastern Kunlun fault zone and its surrounding faults, which is carried out under the action of horizontal ground motion with certain exceeding probability. According to the geological structure and seismicity characteristics of the study area, the potential source is divided. Based on the seismic hazard analysis and Newmark cumulative displacement evaluation model, the seismic landslide hazard in the study area is analyzed. The landslide probability is taken as the risk index. The seismic landslide hazard can be divided into five grades: extremely low-prone area, low-prone area, medium-prone area, high-prone area, and extremely high-prone area. In the results of seismic landslide risk zoning given in this article, the surrounding areas of Tazang fault and Minjiang fault are high-risk areas, which should be paid attention to.
1 Introduction
Seismic landslides, occurring when mountains destabilize due to strong shaking during earthquakes, constitute a significant secondary disaster, posing a grave threat to human lives and property. These events wield an immense socioeconomic impact, leading to disrupted traffic, infrastructure destruction, and river blockages, resulting in substantial losses [1]. In mountainous regions, the damage inflicted by seismic landslides can surpass that directly caused by earthquakes [2]. China, a nation frequently experiencing earthquakes, faces notable susceptibility to severe landslide disasters triggered by these events. The western multi-earthquake region stands particularly vulnerable to numerous seismic landslides, as evidenced by the magnitude-8.0 Wenchuan earthquake of 2008, which triggered approximately 50,000 landslides and claimed 20,000 lives [3,4]. Such landslides entail loss of life and property, critical infrastructure damage, and the emergence of secondary hazards that may exceed the earthquake’s magnitude. Hence, it is imperative to thoroughly investigate earthquake-induced landslides to prioritize factors influencing rescue decisions and the selection of rescue routes during post-earthquake emergency responses.
Research on seismic landslide hazard assessment encompasses both qualitative and quantitative methods. The qualitative approach primarily focuses on the examination of early seismic landslides. Notably, Keefer pioneered this approach by analyzing 40 historical seismic events occurring worldwide between 1958 and 1977 [5]. Through an examination of seismic geologic hazard motion, internal rupture, and geological context, Keefer established the initial correlation curve between the maximum area of seismic landslide hazard and earthquake magnitude. Subsequent studies by Rodriguez delved into the impact of earthquake density, affected area, landslide count, and types on maximum landslides [6]. Li derived an approximate relationship between landslide area and earthquake magnitude through regression calculations based on regional geological, and geomorphological characteristics in China [7]. Moreover, Sun conducted statistical analyses on historical earthquake data in China, synthesizing the correlation between the distribution area of earthquake-induced landslides and magnitude, epicenter distance, lithology, and topographic slope [8]. These investigations have profoundly influenced the field and garnered widespread citation.
Various quantitative methodologies were employed by the researchers to assess the susceptibility of earthquake-induced landslides. These methodologies encompass statistical approaches grounded in mathematical models, alongside the Newmark model. The authors utilized the neural network methodology for evaluating the susceptibility of earthquake-induced landslides, as detailed by Pradel and co-workers [9]. Furthermore, the vulnerability of landslides was assessed by the authors through the utilization of support vector machine (SVM) and logistic regression (LR) models, incorporating different percentages of landslide sample points, as demonstrated by Hu et al. [10]. Some scholars appraised the landslide hazard after the Yushu earthquake using a LR model, yielding the distribution of the landslide hazard index, as illustrated in the investigation by Xu and Xu [11].
In 1965, Newmark introduced a sliding block model to assess dam stability during seismic events [12]. Subsequently, this model underwent a series of mechanical model-based investigations aimed at quantitatively evaluating the hazard posed by regional seismic landslides. Utilizing the Newmark displacement model, Jibson groups [13,14] developed seismic landslide hazard maps for the Oat Mountain region, proximate to the epicenter of the Northridge earthquake in California, USA, and the Anchorage area, respectively. The outcomes of these studies revealed a strong correlation between the assessments derived from the Newmark model and the actual distribution of landslides, demonstrating promising results. Notably, the analysis of seismic parameters, particularly PGA, in seismic landslide hazard assessment has garnered significant attention among the various methodologies employed in studying seismic landslides.
Several scholars have extensively researched the assessment of seismic landslide risk using the Newmark model [15,16,17,18]. Noteworthy among these studies is the work of Jibson and Michael, who created a seismic landslide risk zoning map for the Aras region in the United States [17]. Similarly, Chen developed a seismic landslide hazard zoning map for the Yadong area in Tibet, at a 2% probability of exceedance (POE) in 50 years [18].
This article integrates seismic hazard analysis with the Newmark cumulative displacement model to assess landslide hazard and probability. Using the eastern segment of the Kunlun fault zone as a case study, seismic landslide hazard within the region is evaluated for a risk level of 10% POE in 50 years. The findings offer valuable insights for seismic landslide risk assessment in land use planning.
2 Framework
The research framework employed in this study is shown in Figure 1, which is made of three components as follows:
Probabilistic seismic hazard analysis
PSHA assesses the potential seismic accelerations in a given study area by considering the probabilities of occurrence for various potential seismic sources. The results of PSHA yield peak ground acceleration (PGA) values, which are essential for calculating seismic landslide displacement.
Seismic landslide hazard zoning
The central component of this study framework is seismic landslide hazard zoning, which integrates parameters related to the strength of rock and soil masses. This integration is based on the regional geological map and the digital elevation model (DEM) of the study area. Subsequently, these parameters are used to calculate the factor of safety and critical acceleration for landslides.
Seismic landslide displacement

Research framework of this study.
The displacement of seismic landslides is determined through a combination of geotechnical parameters and seismic hazard indicators, such as PGA and acceleration coefficient. This model utilizes a probabilistic approach to assess the probability of landslide occurrence.
3 Regional geological background of study area
The Eastern Kunlun Fracture Zone is an essential component of the boundary of the Bayankara Block, influenced by the concurrent processes of Indian Plate subduction and extrusion, along with the eastward migration of material from the Qinghai–Tibet Plateau, as depicted in Figure 2a. This block exhibits significant crustal activity within its confines and along its peripheries [19,20,21,22,23,24,25,26]. The primary fault branches comprising the eastern segment of the Eastern Kunlun fault zone include the Tazang fault, Longriba fault, Minjiang fault, Tiger fault, the adjacent Bailongjiang fault, and the He Guanggai Mountain–Dieshan fault. All these faults have demonstrated activity since the late Quaternary period, as evidenced by previous investigations [27,28,29,30,31,32]. The study area resides within the northern section of China’s north–south seismic belt and is identified as one of China’s active seismic regions. This region has a history of frequent seismic events, including recent earthquakes like the magnitude-7.0 Jiuzhaigou earthquake on August 8, 2017, as well as past occurrences such as the magnitude-6.5 Songpan earthquake in 1973 and the magnitude-6.5 Songpan earthquake in 1748 (Figure 2b). These seismic events have triggered significant landslides, notably the Jiuzhaigou earthquake, which triggered numerous landslides, severely affecting the tourism economy of the Jiuzhaigou and Aba Prefecture areas [33].

Regional topography, active tectonics, and seismic distribution map.
4 Probabilistic seismic hazard analysis
Earthquakes and ground shaking are inherently unpredictable events that necessitate expression in terms of probabilities for accurate prediction [34,35,36]. The intensity and frequency of seismic activity exhibit variability across different regions. Conducting a seismic hazard analysis specific to the study area offers a foundational framework for delineating seismic landslide hazard zones.
Assessing seismic hazard at a construction site necessitates comprehending the local seismic activity, predicting future earthquake magnitudes, and quantifying the intensity of ground shaking that poses a risk to the site. Nonetheless, the inherent unpredictability of earthquakes and their resultant ground shaking events poses a significant challenge to precise prediction. To mitigate this challenge, PSHA has emerged as an effective approach for expressing seismic risk probabilistically. Recently, probabilistic analysis was utilized to determine ground shaking parameters at a specific site with a defined POE, as documented in previous studies [37–39].
In this study, PSHA of the eastern part of the eastern Kunlun fault zone is carried out based on the classification of potential hypocenters, and the PGA for a risk level of a 10% POE in 50 years is calculated.
4.1 Classification of potential earthquake sources in the study area
The primary technique employed for seismic hazard analysis in China is Chinese probabilistic seismic hazard analysis (CPSHA), as outlined in the Seismic Ground Motion Parameters Zonation Map of China (2015) [40]. This approach adeptly accounts for the spatiotemporal variability of seismic activity [27]. The main seismic hazard parameters (the upper limit of earthquake magnitude [
Seismic parameters of the seismic statistical zones
| Seismic zone |
|
|
|
|---|---|---|---|
| Longmenshan earthquake belt | 8.0 | 0.72 | 4.76 |

Potential seismic sources in the study area.
4.2 Main seismic hazard parameters in the study area
Several studies have indicated that earthquakes can trigger landslides by subjecting the slopes to extra forces resulting from the back-and-forth movement of the ground during shaking, which disrupts the stability of the slope [42]. The PGA of bedrock was evaluated by employing a suitable attenuation relationship and conducting seismic hazard analysis computations within the study area. The average PGA was then translated and arranged using the scientific approach and research outcomes of the Seismic Ground Motion Parameters Zonation Map of China (2001) [43].
In assessing seismic risk at a given site, two key indicators are the likelihood of ground motion acceleration and the POE. However, challenges arise in directly reconciling the Newmark model displacement with ground motion acceleration POE. This arises from the distinction that the latter quantifies the probability of a ground motion parameter surpassing a specific threshold at a particular site due to at least one potential earthquake nearby [13], yet it incompletely encapsulates the probabilities of earthquake occurrences. To address this, a probability model of earthquake occurrence is necessary, guided by the following principle:
Basic assumptions of the Cornell model about seismicity [44].
In the proximity of the study site, multiple earthquake sources exist (assuming a total number of
(1)where
The average annual occurrence rate of the potential seismic source area should be
Then, the probability of n earthquakes occurring in the area under consideration is computing as
Given the independent distribution of characteristics for each earthquake
Based on the aforementioned equation, the calculation formula for the probability of occurrence of ground acceleration at the site can be derived as
This study provides an assessment of PGA within study area using a finely resolved grid with a cell dimension of 0.1 × 0.1° and a total of 21,671 calculated field points (Figure 3). Due to the significant influence of topography on seismic motion, it is necessary to correct the PGA calculated for the bedrock to obtain the PGA on the slope. Based on some Chinese standards [48,49], we calculated the amplification effect of the local prominent terrain for PGA using the following empirical equation:
where
The results, as shown in Figure 4, indicate that the PGA values in the study area range between 91 and 279 (gal) for a 10 POE in 50 years.
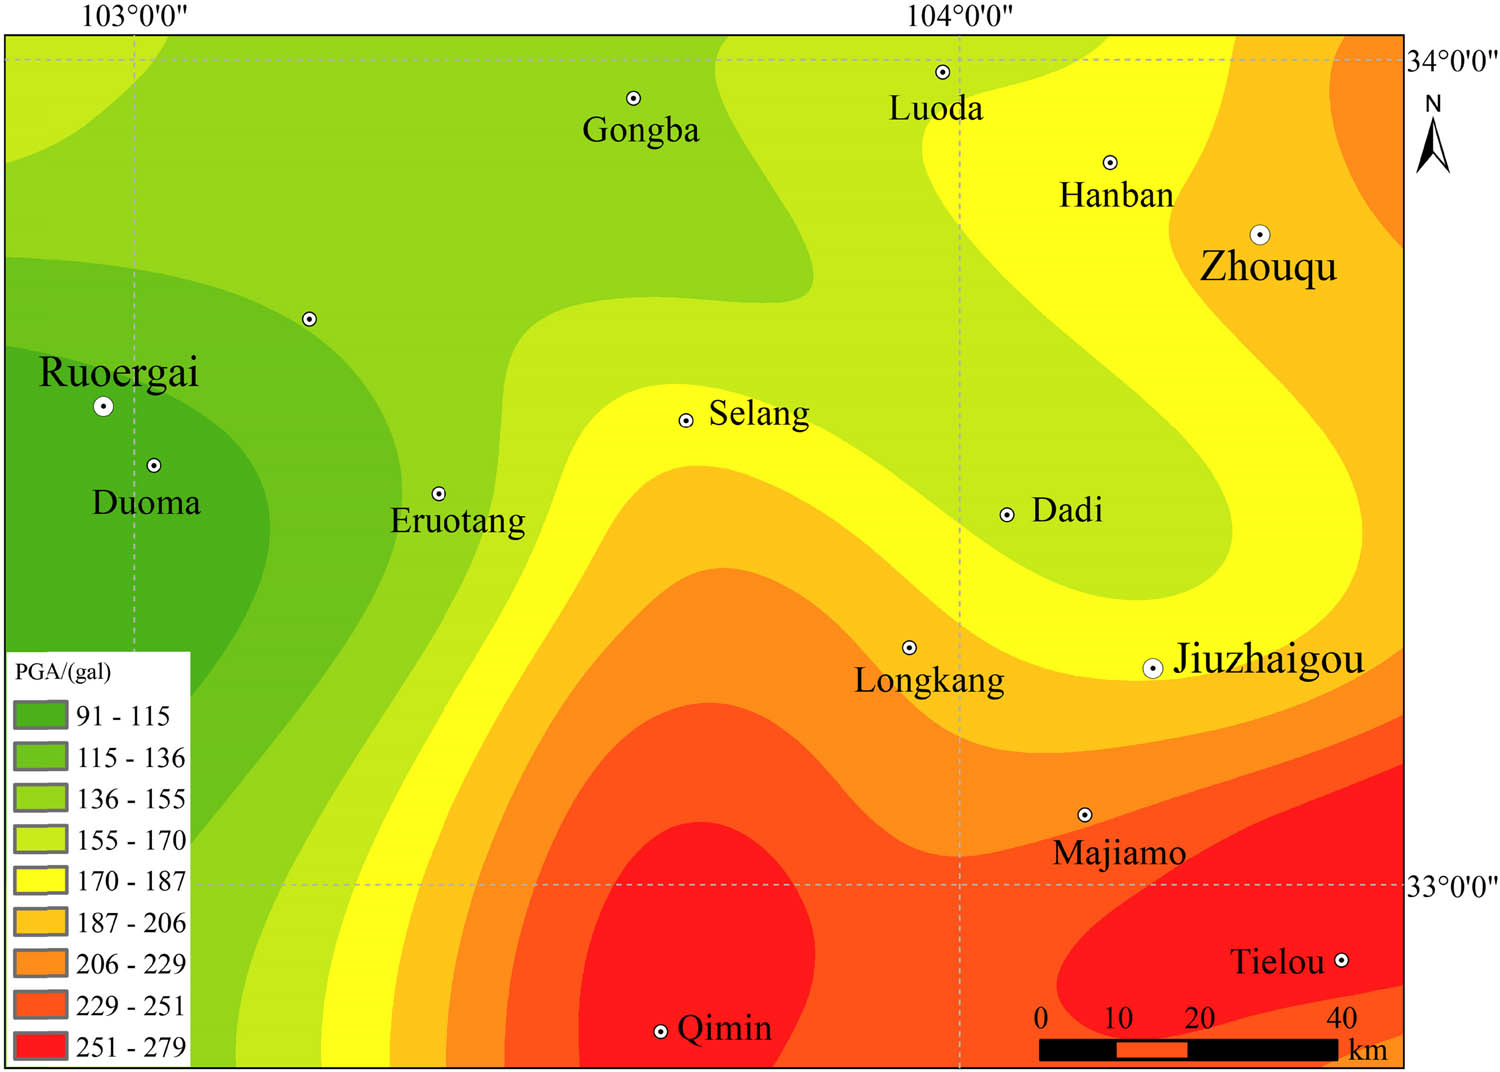
Peak acceleration zoning map (10% POE in 50 years).
5 Seismic landslide hazard zoning
5.1 Newmark model
In 1965, Newmark introduced a novel technique for evaluating rigid slip to assess slope displacements and resulting damage following seismic events [12]. This approach involves observing slope displacement when ground shaking acceleration exceeds the critical acceleration threshold. The sliding block analysis technique hinges on determining both the critical acceleration of the slope and that of the site, as illustrated in Figure 5, and discussed in the literature [25].
![Figure 5
Sliding-block model used for Newmark analysis (adapted from Jibson et al. [14]).](/document/doi/10.1515/geo-2022-0704/asset/graphic/j_geo-2022-0704_fig_005.jpg)
Sliding-block model used for Newmark analysis (adapted from Jibson et al. [14]).
Regional analysis often employs the infinite slope model for computing critical acceleration [12]. However, the simplified Newmark model, introduced by Wilson and Keefer, is more prevalent in regional landslide seismic hazard assessments [14]. This model simplifies horizontal ground shaking acceleration to be input parallel to the slope of the slip surface, thereby facilitating the calculation of the critical acceleration at the slip surface. The static factor of safety of the slope is predicted via infinite slope analysis under the assumption that ground vibrations align parallel to the slope. The flow acceleration can be calculated as follows:
where
When using the critical acceleration
where

Diagram showing the cumulative displacement algorithm principle of Newmark model.
In practice, the application of the method in assessing seismic landslide hazard is limited by the limited number of seismic stations and strong seismic records, even in potential seismic source areas. Therefore, many scientists have established the relationship between ground shaking parameters and seismic landslide displacements [14].
5.2 Regional engineering geological rock formations
The distribution of seismic landslides is intricately tied to lithology, as it not only affects the propagation of landslides but also significantly influences the types of landslides present.
The stratigraphic composition of the study area exhibits considerable complexity, with the classification of engineering geological rock types conducted based on the 1:200,000 regional geological map. The classification primarily adhered to some standards in China [48,49]. Considering the hardness, integrity, geological genesis, and lithological composition of rocks in the study area, alongside contemporary engineering rock type investigations, the study area was delineated into five rock types (Figure 7): hard (Ⅰ), harder (Ⅱ), softer (Ⅲ), weaker (Ⅳ), and loose (Ⅴ). The hard rock type (Ⅰ) predominantly comprises Silurian siliclastic rocks of the Zhouqu Formation, Triassic orthoclase, amphibolite, quartz veins, and granite of the Luo Period. The harder rock group (Ⅱ) consists mainly of shale from the Triassic Zagashan Formation. The softer rock type (Ⅲ) is primarily characterized by Lower Tertiary quartz sandstone. The weak rock type (Ⅳ) is sporadically distributed and comprises Lower Tertiary sandstone. The loose rock type (Ⅴ) primarily consists of Quaternary loose gravel–clay sediments, found predominantly in the Ruoerge Basin. To obtain the slopes’ static factor of safety in equation (7), it is necessary to consider the anti-sliding effects of the effective cohesion and effective friction angle of the landslide, as well as the weakening effect of groundwater on the friction angle. Due to the lack of detailed measured rock mass structural surface strength parameters, empirical values of various rock types are used (Table 2) [50,51,52].

Engineering geological rock formations map of the study area.
Seismic parameters of the seismic statistical zones
| Rock types |
|
|
|
|---|---|---|---|
| I | 0.035 | 28 | 27.5 |
| II | 0.04 | 26 | 26.5 |
| III | 0.025 | 18 | 25.5 |
| IV | 0.015 | 11 | 23.5 |
| V | 0.01 | 12 | 21.5 |
5.3 Slope of the study area
The regional slope data for the eastern segment of the East Kunlun Fault Zone were obtained from DEM with a spatial resolution of 30 meters by 30 meters (accessible at http://www.gscloud.cn). This dataset was generated by calculating the ratio between the maximum vertical disparity between adjacent grid cells and the corresponding horizontal extent (Figure 8). Empirical assessments indicate that terrains with slopes less than 10 degrees typically exhibit a high level of stability, with significant landslides being rare. Therefore, slope calculations have been excluded for areas falling within this range [14].

Topographic slope map of the study area.
5.4 Slope static stability factor and critical acceleration
The distribution of the static factor of safety (
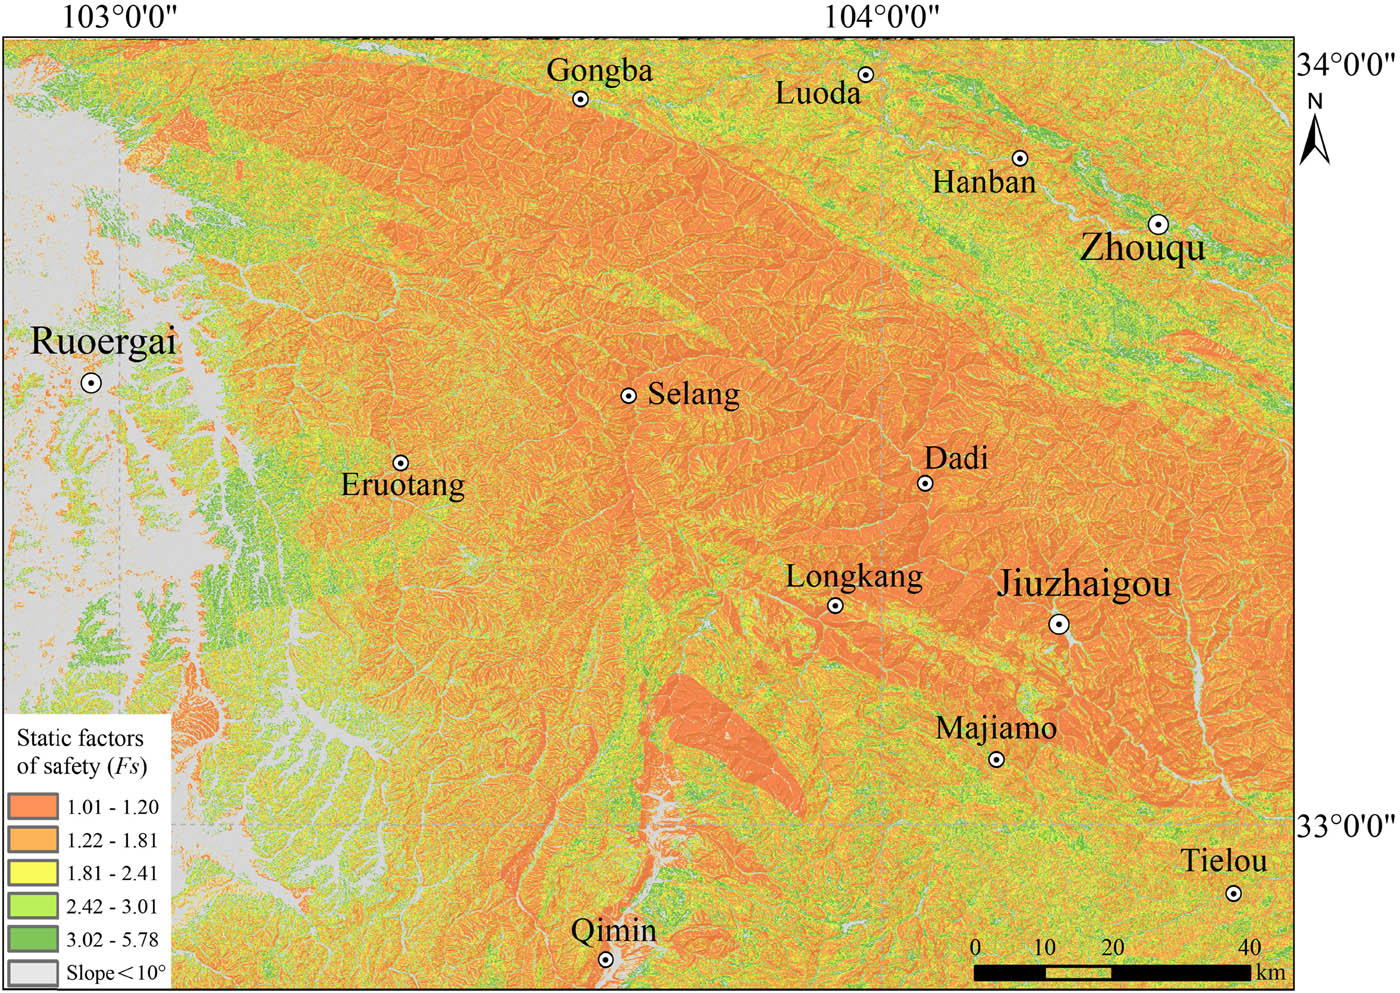
Map showing slope static safety factor

Map showing critical acceleration
The critical acceleration demonstrates a strong correlation with the geological, geotechnical characteristics, and the morphology of slopes in the studied area. Specifically, softer geotechnical materials composing the slope and steeper terrain lead to a proportional decrease in the
5.5 Newmark displacement distribution
The Newmark cumulative displacement method was initially introduced by Newmark in 1965 as a means to assess the stability of levees subjected to seismic forces. This method’s fundamental approach involves the quadratic integration of ground shaking acceleration components surpassing the critical acceleration threshold. Consequently, obtaining time curves of ground shaking acceleration for extensive geographical regions and conducting meticulous Newmark displacement integration calculations simultaneously becomes a formidable challenge under such conditions.
In this study, the determination of PGA is grounded upon PSHA for a risk level of 10% POE in 50 years. The calculation is performed employing a regression equation, as proposed by Jibson et al. [14], which relates Newmark displacement (
In accordance with the Newmark displacement classification (Figure 11), the following distribution of areas was observed within the study region: 51.8% of the study area corresponded to
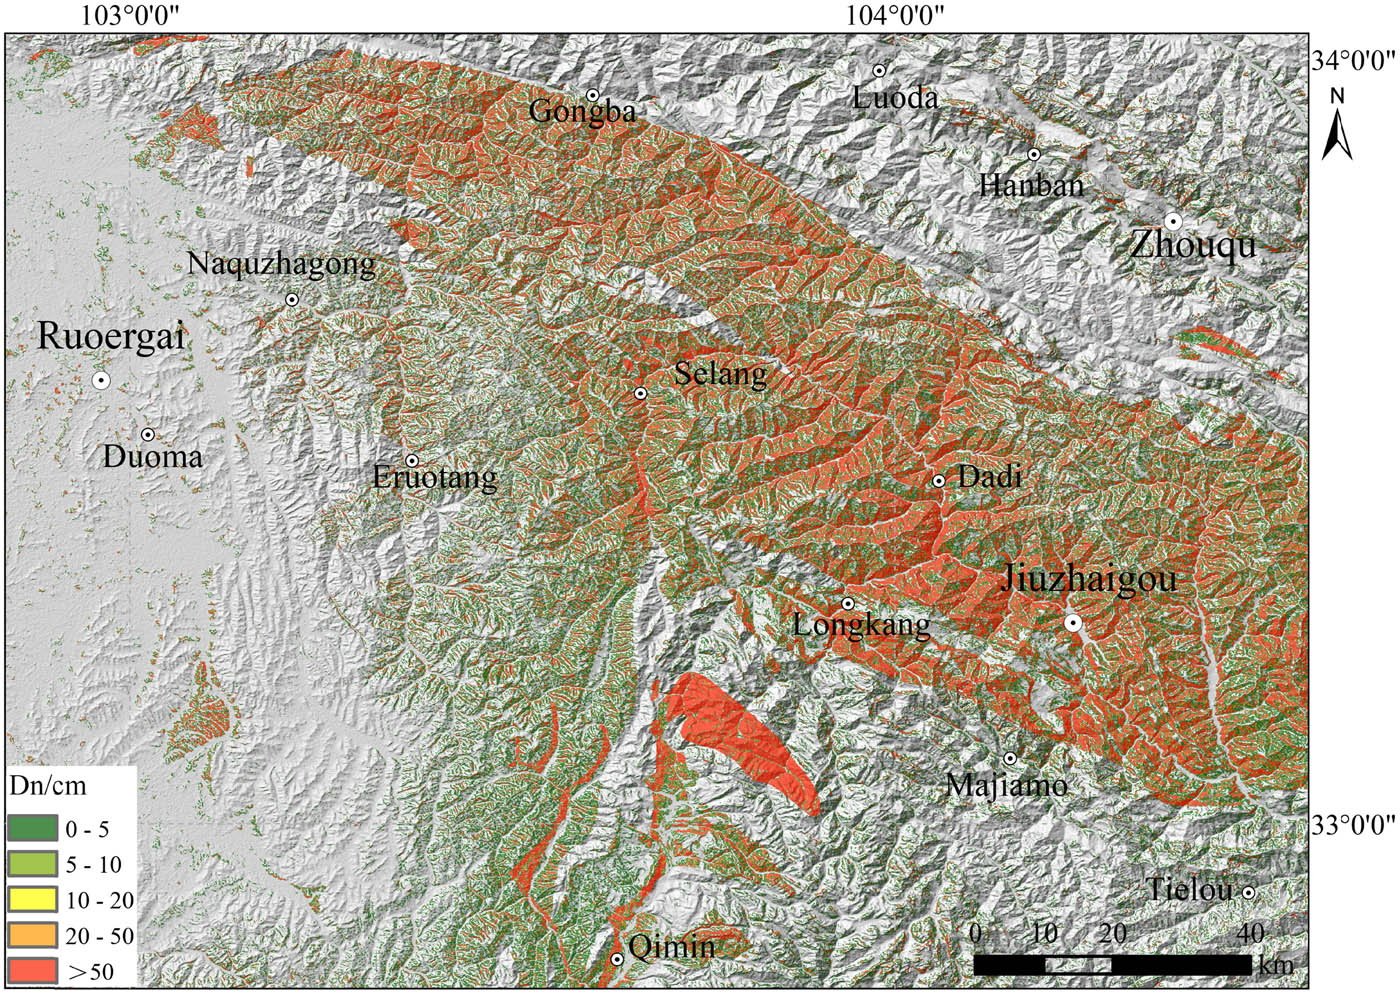
Newmark displacement distribution in the study area.
5.6 Seismic landslide probability distribution map
Jibson groups evaluated the probabilities of landslides by analyzing the relationship between anticipated Newmark displacement values and the spatial distribution of earthquake-triggered landslides [13]. This analysis was conducted in conjunction with regional assessments of Newmark displacements.
The probability of landslide instability, denoted as

Probability of seismic-induced landslide occurrence in the study area.
The seismic landslide hazard analysis results within the study area, as illustrated in Figure 12, encapsulate both seismic hazard characteristics and engineering geological conditions. These integrated factors are employed to calculate the prospective seismic landslide probability. This metric assesses the likelihood of seismic landslides occurring in different regions of the study area in response to ground shaking events surpassing a specified probability threshold. Based on prior research findings [53], the seismic landslide hazard is classified into five distinct categories according to probabilistic values: a very low susceptibility zone (0 to 2%), a low susceptibility zone (2 to 4%), a moderate susceptibility zone (4 to 6%), a high susceptibility zone (6 to 8%), and a very high susceptibility zone (8 to 11%).
The results of the regional seismic landslide hazard zoning analysis indicate that the upper plate of the Tazang Rift, particularly the area spanning from Selang to Majima, the local vicinity within the Minjiang Rift, and the lower plate of the Bailong River Rift, all exhibit notably high hazard zones. In contrast, the seismic landslide hazard zone covering the Longriba Rift and the Guanggai Mountain–Dieshan Rift is less pronounced. This distribution of seismic landslides is consistent with the geographical dispersion of the active rupture zone, primarily due to the compromised structural integrity of the rock surrounding the fracture zone, leading to diminished mechanical strength. Consequently, internal fissures or joints are more likely to form within the rock, with some faults or joints acting as interfaces that facilitate slip surface or landslide formation, as mentioned in the study by Cornell [44]. Moreover, these geological factors, combined with alterations in groundwater flow dynamics, can contribute to a reduction in slope stability. Conversely, susceptibility to seismic landslides is significantly influenced by geological rock type and ground vibration parameters, particularly the PGA.
6 Discussion
In the realm of zoning seismic landslide hazards, it is essential to account for the anticipated earthquakes’ impact. This study seeks to evaluate the seismic landslide hazard in the eastern segment of the East Kunlun Fault Zone, utilizing landslide probability as the primary hazard indicator. This probability is shaped by various factors, including the activity of fracture zones, geological characteristics of engineering rock types, and ground shaking parameters. The probabilistic seismic landslide distribution map within the research domain delineates varying degrees of landslide susceptibility. The study area’s hazard levels are categorized into five distinct classes: “very low susceptibility,” “low susceptibility,” “medium susceptibility,” “high susceptibility,” and “very high susceptibility.” Our findings reveal significantly high-risk areas within the upper plate of the Tazang Rift, specifically extending from Selang to Majiama, the local region of the lower plate of the Minjiang Rift, and the lower plate of the Bailong River Rift. Conversely, the seismic landslide hazard in the vicinity of the Longriba Rift and the Guanggai Mountain–Dieshan Rift is comparatively lower.
The seismic landslide hazard zoning, derived from a comprehensive regional seismic hazard analysis, integrates seismic tectonics, seismic activity, and potential source zones across the study area. This analysis employs a defined level of transcendental probability while considering the influence of all tectonic factors and potential seismic events within the study area on future seismic landslides. As a result, the distribution patterns of seismic landslide hazards depicted in this zoning may differ from those associated with landslides triggered by individual earthquakes. This holistic and comprehensive approach is advantageous for a more inclusive evaluation of prospective seismic landslide hazards within the study area.
Newmark analysis is widely used in the assessment of seismic landslide hazard, while the practice shows that its quantitative evaluation results have limitations [54,55]. In this case study, we aim to gain insights into seismic landslide hazard assessment in the East Kunlun region based on the simplified Newmark displacement model. Although we considered some of most important influencing factors, such as PGA distribution, the amplification effect of topography on ground motion, the evaluation results are not so accurate due to some assumptions in the simplified model and the influence of parameters using empirical values. So in the future study, we will consider the uncertainty of the rock mechanical parameters (
7 Conclusion
This study analyzes seismic landslides within the study area by employing seismic hazard analysis and the Newmark cumulative displacement model. The distribution of seismic landslides aligns with the spatial extent of active fracture zones. A seismic landslide hazard index is computed based on the probability of landslide occurrence, categorizing the hazard degree within the study area into five classes ranging from very low to very high susceptibility zones. The results of the hazard classification reveal that the upper plate along the Tazang Rift, specifically from Selang to Majiama, the local area beneath the Minjiang Rift, and the earthquake beneath the Bailong River Rift exhibit extremely high hazard zones. In contrast, the seismic landslide hazard zones surrounding the Longriba Rift and the Guanggai Mountain–Dieshan Rift are comparatively less severe.
Acknowledgement
Authors gratefully acknowledge anonymous reviewers for their thorough reading of this manuscript and for their insightful questions and constructive suggestions, which significantly improved the quality of this article.
-
Funding Information: This study was supported by the Scientific Research Fund of Institute of Engineering Mechanics, China Earthquake Administration (Grant No. 2022QJGJ04).
-
Author contributions: Conceptualization: L. Z. and G. F.; methodology: G. F.; programming: G. F. and L. Z.; validation: L. Z. and G. L.; resources: G. L.; data curation: G. F., writing original draft preparation: L. Z. and G. F; writing review and editing: L. Z, G. F. and G. L.; visualization: G. F. and L. Z. All authors have read and agreed to the published version of the manuscript.
-
Conflict of interest: Authors state no conflict of interest.
References
[1] Huang R. Geohazard Assessment of Wenchuan Earthquake. Beijing: Science Press; 2009. (in Chinese).Suche in Google Scholar
[2] Qi SW, Xu Q, Liu CL. Slope instabilities in the severest disaster areas of 5.12 Wenchuan earthquake. J Eng Geol. 2009;17(1):25–30. (in Chinese).Suche in Google Scholar
[3] Xu C, Dai FC, Xu XW. Wenchuan earthquake-induced landslides: An overview. Geol Rev. 2010;56(6):860–74. (in Chinese).Suche in Google Scholar
[4] Wang XY, Nie GZ, Wang DW. Research on relationship between landslides and peak ground accelerations induced by Wenchuan earthquake. Chin J Rock Mech Eng. 2010;29(1):82–9. (in Chinese).Suche in Google Scholar
[5] Keefer DK. Landslides caused by earthquake. Geol Soc Am Bull. 1984;95(4):406–21.10.1130/0016-7606(1984)95<406:LCBE>2.0.CO;2Suche in Google Scholar
[6] Rodriguez CE, Bommer JJ, Chandler RJ. Earthquake-induced landslides: 1980-1997. Soil Dyn Earthq Eng. 1999;18(5):325–46.10.1016/S0267-7261(99)00012-3Suche in Google Scholar
[7] Li TC. Relationship between earthquake and landslides and prediction of earthquake induced landslides. Landslide Anthology (II). Beijing: The People’s Railway Publishing House; 1979. (in Chinese).Suche in Google Scholar
[8] Sun CS, Cai HW. Developing and distributing characteristics of collapses and landslides during strong historic earthquake in China. J Nat Disasters. 1997;6(1):25–30. (in Chinese).Suche in Google Scholar
[9] Pradel D, Smith PM, Stewart JP, Raad G. Case history of landslide movement during the Northridge earthquake. J Geootech Geoenviron Eng. 2005;131(11):1360–9. (in Chinese).10.1061/(ASCE)1090-0241(2005)131:11(1360)Suche in Google Scholar
[10] Hu DY, Li J, Chen YH. Study on spatial prediction method of landslide disaster based on GIS. J Remote Sens. 2007;6:852–9 (in Chinese).Suche in Google Scholar
[11] Xu C, Xu XW. Logistic regression model and its validation for hazard mapping of landslides triggered by the 8 August 2017 Jiuzhaigou, Sichuan MS7.0 earthquake. Seismol Geol. 2012;3:24–31. (in Chinese).Suche in Google Scholar
[12] Newmark NM. Effect of earthquake on dams and embankments. Geotechnique. 1965;15(2):139–59.10.1680/geot.1965.15.2.139Suche in Google Scholar
[13] Harp EL, Jibson RW. Landslides triggered by the 1994 Northridge, California, earthquake. Bull Seismol Soc Am. 1996;86:S319–32.10.1785/BSSA08601BS319Suche in Google Scholar
[14] Jibson RW, Harp EL, Michael JA. A method for producing digital probabilistic seismic landslide hazard maps. Eng Geol. 2000;58(3):271–89.10.1016/S0013-7952(00)00039-9Suche in Google Scholar
[15] Gallen SF, Clark MK, Godt JW, Roback K, Niemi NA. Application and evaluation of a rapid response earthquake-triggered landslide model to the 25 April 2015 Mw 7.8 Gorkha earthquake. Nepal Tectonophys. 2017;714–715:173–87.10.1016/j.tecto.2016.10.031Suche in Google Scholar
[16] Tapponnier P, Zhiqin X, Roger F, Meyer B, Arnaud N, Wittlinger G, et al. Oblique stepwise rise and growth of the Tibet plateau. Science. 2001;294(5547):1671–7.10.1126/science.105978Suche in Google Scholar
[17] Jibson RW, Michael JA. Maps showing seismic landslide hazards in Anchorage, Alaska. Reston, VA, USA: US Geological Survey; 2009.10.3133/sim3077Suche in Google Scholar
[18] Chen L, Mei L, Zeng B, Yin K, Shrestha DP, Du J. Failure probability assessment of landslides triggered by earthquakes and rainfall: a case study in Yadong County, Tibet, China. Sci Rep. 2020;10:16531. 10.1038/s41598-020-73727-4.Suche in Google Scholar
[19] Zhang PZ, Shen Z, Wang M, Gan W, Bürgmann R, Molnar P, et al. Continuous deformation of the Tibetan Plateau from global positioning system data. Geology. 2004;32(9):809–12.10.1130/G20554.1Suche in Google Scholar
[20] Beaumont C, Jamieson RA, Nguyen MH, Lee B. Himalayan tectonics explained by extrusion of a low-viscosity crustal channel coupled to focused surface denudation. Nature. 2004;414(6865):738–42.10.1038/414738aSuche in Google Scholar PubMed
[21] Burchfiel BC, Zhiliang C, Yupinc L, Royden LH. Tectonics of the Longmen Shan and adjacent regions, central China. Int Geol Rev. 1995;37(8):661–735.10.1080/00206819509465424Suche in Google Scholar
[22] Kirby E, Harkins N, Wang E, Shi X, Fan C, Burbank D. Slip rate gradients along the eastern Kunlun fault. Tectonics. 2007;26(2):TC2010.1.Suche in Google Scholar
[23] Harkins N, Kirby E, Shi X, Wang E, Burbank D, Chun F. Millennial slip rates along the eastern Kunlun fault: Implications for the dynamics of intracontinental deformation in Asia. Lithosphere. 2010;2(4):247–66.10.1130/L85.1Suche in Google Scholar
[24] Van der Woerd J, Ryerson FJ, Tapponnier P, Meriaux AS, Gaudemer Y, Meyer B, et al. Uniform slip-rate along the Kunlun Fault: implications for seismic behaviour and large-scale tectonics. Geophys Res Lett. 2000;27(16):2353–6.10.1029/1999GL011292Suche in Google Scholar
[25] Li C, Xu X, Wen X, Zheng R, Chen G, Yang H, et al. Rupture segmentation and slip partitioning of the mid-eastern part of the Kunlun fault, north Tibetan Plateau. Sci China Earth Sci. 2011;54:1730–45.10.1007/s11430-011-4239-5Suche in Google Scholar
[26] Xu XW, Wen XZ, Chen GH, Yu GH. Discovery of the longriba fault zone in eastern Bayan Har block, China and its tectonic implication. Sci China. 2008;51(9):1209–23.10.1007/s11430-008-0097-1Suche in Google Scholar
[27] Ren J, Xu X, Yeats RS, Zhang S. Latest quaternary paleoseismology and slip rates of the Longriba fault zone, eastern Tibet: Implications for fault behavior and strain partitioning. Tectonics. 2013;32(2):216–38.10.1002/tect.20029Suche in Google Scholar
[28] Wang WF, Zhu CH, Qing YB, Shan XJ. Research on transverse faults in the Longmenshan fault zone, China. Adv Mater Res. 2014;1010–1012:1380–6.10.4028/www.scientific.net/AMR.1010-1012.1380Suche in Google Scholar
[29] Kirby E, Harkins N, Wang E, Shi X, Fan C, Burbank D. Slip rate gradients along the eastern Kunlun fault. Tectonics. 2007;26:TC2010.10.1029/2006TC002033Suche in Google Scholar
[30] Gao R, Wang H, Li W, Li H. Structure deformation of the Minjiang and Huya fault, the eastern margin of the Tibetan plateau revealed by deep seismic reflection profiles. AGU Fall Meeting Abstracts; 2014. p. T21B–4575.Suche in Google Scholar
[31] Yang W, Huang X, Zhang C, Si H. Deformation behavior of landslides and their formation mechanism along Pingding-Huama active fault in Bailongjiang river region. Jilin Daxue Xuebao (Diqiu Kexue Ban). J Jilin Univ. 2014;44(2):574–83.Suche in Google Scholar
[32] Nie Z, Wang DJ, Jia Z, Yu P, Li L. Fault model of the 2017 Jiuzhaigou Mw 6.5 earthquake estimated from coseismic deformation observed using global positioning system and interferometric synthetic aperture radar data. Earth Planets Space. 2018;70(1):55.10.1186/s40623-018-0826-4Suche in Google Scholar
[33] Zhang QK, Ling SX, Li XN, Sun CW, Xu JX, Huang T. Comparison of landslide susceptibility mapping rapid assessment models in Jiuzhaigou County, Sichuan province, China. Chinese J Rock Mech Eng. 2020;39(8):1595–1610.Suche in Google Scholar
[34] Hu YX. Seismic safety evaluation. Beijing: Seismological Press; 1999. (in Chinese).Suche in Google Scholar
[35] Chinese seismic ground motion zoning working group. Seismic Zoning Map in China. Beijing: Standards Press of China; 2001. (in Chinese).Suche in Google Scholar
[36] Hu YX. Comprehensive probability method in Seismic Risk Analysis. Beijing: Seismological Press; 1999. (in Chinese).Suche in Google Scholar
[37] Pan H, Li JC. Seismicity model of new generation seismic zoning map. City and Disaster Reduction. Urban and Disaster Reduction 2016;3(3):28–33. (in Chinese). Suche in Google Scholar
[38] Hua P, Jinchen L, Zhiguo L. Study on uncertainties of seismicity parameters b and v4 in seismic statistical zones. 2007;21(3):318–26.Suche in Google Scholar
[39] Pan H. Study on uncertains in the parameters of probabilistic seismic hazard analysis Dissertation. 2000. (in Chinese)Suche in Google Scholar
[40] GB 18306-2015. Seismic ground motion parameters zonation map of China [Standard]. General administration of quality supervision, inspection and quarantine. Beijing: Standardization Administration of China; 2015.Suche in Google Scholar
[41] Xiao L, Yu YX. Seismic intensity attenuation relationship in the western region of China. Earthquake Disaster Prevention and Mitigation Technology. 2011;6(4):358–71. (in Chinese)Suche in Google Scholar
[42] Wang XY, Wang CL, Zhang CC. Analysis correlation between ground motion parameters and earthquake disaster: A case study on earthquake-induced landslide hazard in Wenchuan earthquake area.Suche in Google Scholar
[43] Gao MT. GB 18306-2015 zoning map of ground motion parameters in China Propaganda and implementation of teaching materials. Beijing: China Quality Inspection Press; 2015. (in Chinese).Suche in Google Scholar
[44] Cornell CA. Engineering seismic risk analysis. Bull Seismol Soc Am. 1968;58(5):1583–606.10.1785/BSSA0580051583Suche in Google Scholar
[45] Wang T. Study on seismic landslide hazard assessment in Wenchuan earthquake severely afflicted area. Beijing: Chinese Academy of Geological Sciences; 2010. (in Chinese).Suche in Google Scholar
[46] Jibson RW. Regression models for estimating coseismic landslide displacement. Eng Geol. 2007;91(2–4):209–18.10.1016/j.enggeo.2007.01.013Suche in Google Scholar
[47] Hübner B, Mahler A. Analysis of seismic fragility functions of highway embankments. Period Polytech Civil Eng. 2020 Jan;64(4):1162–9, https://pp.bme.hu/ci/article/view/16483.10.3311/PPci.16483Suche in Google Scholar
[48] Ministry of Construction, People’s Republic of China. Grading standards for engineering rock mass [Standard]. Beijing; 1994. (in Chinese).Suche in Google Scholar
[49] Ministry of Construction of the People’s Republic of China. Code for investigation of geotechnical engineering (GB 50021-2001). Beijing: China Architecture & Building Press; 2001. (in Chinese).Suche in Google Scholar
[50] Veylon G, Luu LH, Mercklé S, Mercklé S, Bard PY, Delvallée A, et al. A simplified method for estimating Newmark displacements of mountain reservoirs. Soil Dyn Earthq Eng. 2018;100:518–28. 10.1016/j.soildyn.2017.07.003.Suche in Google Scholar
[51] Ma S, Xu C. Assessment of co-seismic landslide hazard using the Newmark model and statistical analyses: a case study of the 2013 Lushan, China, Mw6.6 earthquake. Nat Hazards. 2019;96:389–412. 10.1007/s11069-018-3548-9.Suche in Google Scholar
[52] Chousianitis K, Del Gaudio V, Kalogeras I, Ganas A. Predictive model of Arias intensity and Newmark displacement for regional scale evaluation of earthquake-induced landslide hazard in Greece. Soil Dyn Earthq Eng. 2014;65:11–29. 10.1016/j.soildyn.2014.05.009.Suche in Google Scholar
[53] Chen L, Mei L, Zeng B, Yin K, Shrestha DP, Du J. Failure probability assessment of landslides triggered by earthquakes and rainfall: a case study in Yadong County, Tibet, China. Scientific Reports. 2020;10(1):16531.10.1038/s41598-020-73727-4Suche in Google Scholar PubMed PubMed Central
[54] Fell R, Corominas J, Bonnard C, Cascini L, Leroi E, Savage WZ. Guidelines for landslide susceptibility, hazard and risk zoning for land use planning. Eng Geol. 2008;102(3–4):85–98.10.1016/j.enggeo.2008.03.022Suche in Google Scholar
[55] Feng XJ. Discussion on the relationship between active faults and landslides and collapses. J Chang’ an Univ. 1990:92–9. (in Chinese).Suche in Google Scholar
© 2024 the author(s), published by De Gruyter
This work is licensed under the Creative Commons Attribution 4.0 International License.
Artikel in diesem Heft
- Regular Articles
- Theoretical magnetotelluric response of stratiform earth consisting of alternative homogeneous and transitional layers
- The research of common drought indexes for the application to the drought monitoring in the region of Jin Sha river
- Evolutionary game analysis of government, businesses, and consumers in high-standard farmland low-carbon construction
- On the use of low-frequency passive seismic as a direct hydrocarbon indicator: A case study at Banyubang oil field, Indonesia
- Water transportation planning in connection with extreme weather conditions; case study – Port of Novi Sad, Serbia
- Zircon U–Pb ages of the Paleozoic volcaniclastic strata in the Junggar Basin, NW China
- Monitoring of mangrove forests vegetation based on optical versus microwave data: A case study western coast of Saudi Arabia
- Microfacies analysis of marine shale: A case study of the shales of the Wufeng–Longmaxi formation in the western Chongqing, Sichuan Basin, China
- Multisource remote sensing image fusion processing in plateau seismic region feature information extraction and application analysis – An example of the Menyuan Ms6.9 earthquake on January 8, 2022
- Identification of magnetic mineralogy and paleo-flow direction of the Miocene-quaternary volcanic products in the north of Lake Van, Eastern Turkey
- Impact of fully rotating steel casing bored pile on adjacent tunnels
- Adolescents’ consumption intentions toward leisure tourism in high-risk leisure environments in riverine areas
- Petrogenesis of Jurassic granitic rocks in South China Block: Implications for events related to subduction of Paleo-Pacific plate
- Differences in urban daytime and night block vitality based on mobile phone signaling data: A case study of Kunming’s urban district
- Random forest and artificial neural network-based tsunami forests classification using data fusion of Sentinel-2 and Airbus Vision-1 satellites: A case study of Garhi Chandan, Pakistan
- Integrated geophysical approach for detection and size-geometry characterization of a multiscale karst system in carbonate units, semiarid Brazil
- Spatial and temporal changes in ecosystem services value and analysis of driving factors in the Yangtze River Delta Region
- Deep fault sliding rates for Ka-Ping block of Xinjiang based on repeating earthquakes
- Improved deep learning segmentation of outdoor point clouds with different sampling strategies and using intensities
- Platform margin belt structure and sedimentation characteristics of Changxing Formation reefs on both sides of the Kaijiang-Liangping trough, eastern Sichuan Basin, China
- Enhancing attapulgite and cement-modified loess for effective landfill lining: A study on seepage prevention and Cu/Pb ion adsorption
- Flood risk assessment, a case study in an arid environment of Southeast Morocco
- Lower limits of physical properties and classification evaluation criteria of the tight reservoir in the Ahe Formation in the Dibei Area of the Kuqa depression
- Evaluation of Viaducts’ contribution to road network accessibility in the Yunnan–Guizhou area based on the node deletion method
- Permian tectonic switch of the southern Central Asian Orogenic Belt: Constraints from magmatism in the southern Alxa region, NW China
- Element geochemical differences in lower Cambrian black shales with hydrothermal sedimentation in the Yangtze block, South China
- Three-dimensional finite-memory quasi-Newton inversion of the magnetotelluric based on unstructured grids
- Obliquity-paced summer monsoon from the Shilou red clay section on the eastern Chinese Loess Plateau
- Classification and logging identification of reservoir space near the upper Ordovician pinch-out line in Tahe Oilfield
- Ultra-deep channel sand body target recognition method based on improved deep learning under UAV cluster
- New formula to determine flyrock distance on sedimentary rocks with low strength
- Assessing the ecological security of tourism in Northeast China
- Effective reservoir identification and sweet spot prediction in Chang 8 Member tight oil reservoirs in Huanjiang area, Ordos Basin
- Detecting heterogeneity of spatial accessibility to sports facilities for adolescents at fine scale: A case study in Changsha, China
- Effects of freeze–thaw cycles on soil nutrients by soft rock and sand remodeling
- Vibration prediction with a method based on the absorption property of blast-induced seismic waves: A case study
- A new look at the geodynamic development of the Ediacaran–early Cambrian forearc basalts of the Tannuola-Khamsara Island Arc (Central Asia, Russia): Conclusions from geological, geochemical, and Nd-isotope data
- Spatio-temporal analysis of the driving factors of urban land use expansion in China: A study of the Yangtze River Delta region
- Selection of Euler deconvolution solutions using the enhanced horizontal gradient and stable vertical differentiation
- Phase change of the Ordovician hydrocarbon in the Tarim Basin: A case study from the Halahatang–Shunbei area
- Using interpretative structure model and analytical network process for optimum site selection of airport locations in Delta Egypt
- Geochemistry of magnetite from Fe-skarn deposits along the central Loei Fold Belt, Thailand
- Functional typology of settlements in the Srem region, Serbia
- Hunger Games Search for the elucidation of gravity anomalies with application to geothermal energy investigations and volcanic activity studies
- Addressing incomplete tile phenomena in image tiling: Introducing the grid six-intersection model
- Evaluation and control model for resilience of water resource building system based on fuzzy comprehensive evaluation method and its application
- MIF and AHP methods for delineation of groundwater potential zones using remote sensing and GIS techniques in Tirunelveli, Tenkasi District, India
- New database for the estimation of dynamic coefficient of friction of snow
- Measuring urban growth dynamics: A study in Hue city, Vietnam
- Comparative models of support-vector machine, multilayer perceptron, and decision tree predication approaches for landslide susceptibility analysis
- Experimental study on the influence of clay content on the shear strength of silty soil and mechanism analysis
- Geosite assessment as a contribution to the sustainable development of Babušnica, Serbia
- Using fuzzy analytical hierarchy process for road transportation services management based on remote sensing and GIS technology
- Accumulation mechanism of multi-type unconventional oil and gas reservoirs in Northern China: Taking Hari Sag of the Yin’e Basin as an example
- TOC prediction of source rocks based on the convolutional neural network and logging curves – A case study of Pinghu Formation in Xihu Sag
- A method for fast detection of wind farms from remote sensing images using deep learning and geospatial analysis
- Spatial distribution and driving factors of karst rocky desertification in Southwest China based on GIS and geodetector
- Physicochemical and mineralogical composition studies of clays from Share and Tshonga areas, Northern Bida Basin, Nigeria: Implications for Geophagia
- Geochemical sedimentary records of eutrophication and environmental change in Chaohu Lake, East China
- Research progress of freeze–thaw rock using bibliometric analysis
- Mixed irrigation affects the composition and diversity of the soil bacterial community
- Examining the swelling potential of cohesive soils with high plasticity according to their index properties using GIS
- Geological genesis and identification of high-porosity and low-permeability sandstones in the Cretaceous Bashkirchik Formation, northern Tarim Basin
- Usability of PPGIS tools exemplified by geodiscussion – a tool for public participation in shaping public space
- Efficient development technology of Upper Paleozoic Lower Shihezi tight sandstone gas reservoir in northeastern Ordos Basin
- Assessment of soil resources of agricultural landscapes in Turkestan region of the Republic of Kazakhstan based on agrochemical indexes
- Evaluating the impact of DEM interpolation algorithms on relief index for soil resource management
- Petrogenetic relationship between plutonic and subvolcanic rocks in the Jurassic Shuikoushan complex, South China
- A novel workflow for shale lithology identification – A case study in the Gulong Depression, Songliao Basin, China
- Characteristics and main controlling factors of dolomite reservoirs in Fei-3 Member of Feixianguan Formation of Lower Triassic, Puguang area
- Impact of high-speed railway network on county-level accessibility and economic linkage in Jiangxi Province, China: A spatio-temporal data analysis
- Estimation model of wild fractional vegetation cover based on RGB vegetation index and its application
- Lithofacies, petrography, and geochemistry of the Lamphun oceanic plate stratigraphy: As a record of the subduction history of Paleo-Tethys in Chiang Mai-Chiang Rai Suture Zone of Thailand
- Structural features and tectonic activity of the Weihe Fault, central China
- Application of the wavelet transform and Hilbert–Huang transform in stratigraphic sequence division of Jurassic Shaximiao Formation in Southwest Sichuan Basin
- Structural detachment influences the shale gas preservation in the Wufeng-Longmaxi Formation, Northern Guizhou Province
- Distribution law of Chang 7 Member tight oil in the western Ordos Basin based on geological, logging and numerical simulation techniques
- Evaluation of alteration in the geothermal province west of Cappadocia, Türkiye: Mineralogical, petrographical, geochemical, and remote sensing data
- Numerical modeling of site response at large strains with simplified nonlinear models: Application to Lotung seismic array
- Quantitative characterization of granite failure intensity under dynamic disturbance from energy standpoint
- Characteristics of debris flow dynamics and prediction of the hazardous area in Bangou Village, Yanqing District, Beijing, China
- Rockfall mapping and susceptibility evaluation based on UAV high-resolution imagery and support vector machine method
- Statistical comparison analysis of different real-time kinematic methods for the development of photogrammetric products: CORS-RTK, CORS-RTK + PPK, RTK-DRTK2, and RTK + DRTK2 + GCP
- Hydrogeological mapping of fracture networks using earth observation data to improve rainfall–runoff modeling in arid mountains, Saudi Arabia
- Petrography and geochemistry of pegmatite and leucogranite of Ntega-Marangara area, Burundi, in relation to rare metal mineralisation
- Prediction of formation fracture pressure based on reinforcement learning and XGBoost
- Hazard zonation for potential earthquake-induced landslide in the eastern East Kunlun fault zone
- Monitoring water infiltration in multiple layers of sandstone coal mining model with cracks using ERT
- Study of the patterns of ice lake variation and the factors influencing these changes in the western Nyingchi area
- Productive conservation at the landslide prone area under the threat of rapid land cover changes
- Sedimentary processes and patterns in deposits corresponding to freshwater lake-facies of hyperpycnal flow – An experimental study based on flume depositional simulations
- Study on time-dependent injectability evaluation of mudstone considering the self-healing effect
- Detection of objects with diverse geometric shapes in GPR images using deep-learning methods
- Behavior of trace metals in sedimentary cores from marine and lacustrine environments in Algeria
- Spatiotemporal variation pattern and spatial coupling relationship between NDVI and LST in Mu Us Sandy Land
- Formation mechanism and oil-bearing properties of gravity flow sand body of Chang 63 sub-member of Yanchang Formation in Huaqing area, Ordos Basin
- Diagenesis of marine-continental transitional shale from the Upper Permian Longtan Formation in southern Sichuan Basin, China
- Vertical high-velocity structures and seismic activity in western Shandong Rise, China: Case study inspired by double-difference seismic tomography
- Spatial coupling relationship between metamorphic core complex and gold deposits: Constraints from geophysical electromagnetics
- Disparities in the geospatial allocation of public facilities from the perspective of living circles
- Research on spatial correlation structure of war heritage based on field theory. A case study of Jinzhai County, China
- Formation mechanisms of Qiaoba-Zhongdu Danxia landforms in southwestern Sichuan Province, China
- Magnetic data interpretation: Implication for structure and hydrocarbon potentiality at Delta Wadi Diit, Southeastern Egypt
- Deeply buried clastic rock diagenesis evolution mechanism of Dongdaohaizi sag in the center of Junggar fault basin, Northwest China
- Application of LS-RAPID to simulate the motion of two contrasting landslides triggered by earthquakes
- The new insight of tectonic setting in Sunda–Banda transition zone using tomography seismic. Case study: 7.1 M deep earthquake 29 August 2023
- The critical role of c and φ in ensuring stability: A study on rockfill dams
- Evidence of late quaternary activity of the Weining-Shuicheng Fault in Guizhou, China
- Extreme hydroclimatic events and response of vegetation in the eastern QTP since 10 ka
- Spatial–temporal effect of sea–land gradient on landscape pattern and ecological risk in the coastal zone: A case study of Dalian City
- Study on the influence mechanism of land use on carbon storage under multiple scenarios: A case study of Wenzhou
- A new method for identifying reservoir fluid properties based on well logging data: A case study from PL block of Bohai Bay Basin, North China
- Comparison between thermal models across the Middle Magdalena Valley, Eastern Cordillera, and Eastern Llanos basins in Colombia
- Mineralogical and elemental analysis of Kazakh coals from three mines: Preliminary insights from mode of occurrence to environmental impacts
- Chlorite-induced porosity evolution in multi-source tight sandstone reservoirs: A case study of the Shaximiao Formation in western Sichuan Basin
- Predicting stability factors for rotational failures in earth slopes and embankments using artificial intelligence techniques
- Origin of Late Cretaceous A-type granitoids in South China: Response to the rollback and retreat of the Paleo-Pacific plate
- Modification of dolomitization on reservoir spaces in reef–shoal complex: A case study of Permian Changxing Formation, Sichuan Basin, SW China
- Geological characteristics of the Daduhe gold belt, western Sichuan, China: Implications for exploration
- Rock physics model for deep coal-bed methane reservoir based on equivalent medium theory: A case study of Carboniferous-Permian in Eastern Ordos Basin
- Enhancing the total-field magnetic anomaly using the normalized source strength
- Shear wave velocity profiling of Riyadh City, Saudi Arabia, utilizing the multi-channel analysis of surface waves method
- Effect of coal facies on pore structure heterogeneity of coal measures: Quantitative characterization and comparative study
- Inversion method of organic matter content of different types of soils in black soil area based on hyperspectral indices
- Detection of seepage zones in artificial levees: A case study at the Körös River, Hungary
- Tight sandstone fluid detection technology based on multi-wave seismic data
- Characteristics and control techniques of soft rock tunnel lining cracks in high geo-stress environments: Case study of Wushaoling tunnel group
- Influence of pore structure characteristics on the Permian Shan-1 reservoir in Longdong, Southwest Ordos Basin, China
- Study on sedimentary model of Shanxi Formation – Lower Shihezi Formation in Da 17 well area of Daniudi gas field, Ordos Basin
- Multi-scenario territorial spatial simulation and dynamic changes: A case study of Jilin Province in China from 1985 to 2030
- Review Articles
- Major ascidian species with negative impacts on bivalve aquaculture: Current knowledge and future research aims
- Prediction and assessment of meteorological drought in southwest China using long short-term memory model
- Communication
- Essential questions in earth and geosciences according to large language models
- Erratum
- Erratum to “Random forest and artificial neural network-based tsunami forests classification using data fusion of Sentinel-2 and Airbus Vision-1 satellites: A case study of Garhi Chandan, Pakistan”
- Special Issue: Natural Resources and Environmental Risks: Towards a Sustainable Future - Part I
- Spatial-temporal and trend analysis of traffic accidents in AP Vojvodina (North Serbia)
- Exploring environmental awareness, knowledge, and safety: A comparative study among students in Montenegro and North Macedonia
- Determinants influencing tourists’ willingness to visit Türkiye – Impact of earthquake hazards on Serbian visitors’ preferences
- Application of remote sensing in monitoring land degradation: A case study of Stanari municipality (Bosnia and Herzegovina)
- Optimizing agricultural land use: A GIS-based assessment of suitability in the Sana River Basin, Bosnia and Herzegovina
- Assessing risk-prone areas in the Kratovska Reka catchment (North Macedonia) by integrating advanced geospatial analytics and flash flood potential index
- Analysis of the intensity of erosive processes and state of vegetation cover in the zone of influence of the Kolubara Mining Basin
- GIS-based spatial modeling of landslide susceptibility using BWM-LSI: A case study – city of Smederevo (Serbia)
- Geospatial modeling of wildfire susceptibility on a national scale in Montenegro: A comparative evaluation of F-AHP and FR methodologies
- Geosite assessment as the first step for the development of canyoning activities in North Montenegro
- Urban geoheritage and degradation risk assessment of the Sokograd fortress (Sokobanja, Eastern Serbia)
- Multi-hazard modeling of erosion and landslide susceptibility at the national scale in the example of North Macedonia
- Understanding seismic hazard resilience in Montenegro: A qualitative analysis of community preparedness and response capabilities
- Forest soil CO2 emission in Quercus robur level II monitoring site
- Characterization of glomalin proteins in soil: A potential indicator of erosion intensity
- Power of Terroir: Case study of Grašac at the Fruška Gora wine region (North Serbia)
- Special Issue: Geospatial and Environmental Dynamics - Part I
- Qualitative insights into cultural heritage protection in Serbia: Addressing legal and institutional gaps for disaster risk resilience