Vibration prediction with a method based on the absorption property of blast-induced seismic waves: A case study
-
Serdar Ercins


Abstract
In cases where blast vibrations cannot be measured with seismographs, empirical formulas are commonly used to predict vibration by specifying the peak particle velocity (PPV)-scale distance (SD) relationship. A new approach that provides important information about the relationship of seismic waves generated by blasting with rocks is the seismic quality factor (Q). The Q Factor depends on variables such as measurement distance, geological conditions, frequency, and seismic velocity. In this study, the seismic data obtained from blasting were used to determine the Q factor of the field, which in turn determines the Q value of the site. Blast vibrations were calculated using field equations derived from both the conventional and Q-factor methods. The vibration values measured by seismographs were then compared with the calculated data. The Q factor method, which takes into account the frequency content of the seismic waves, the velocity of the surface waves, and the absorption and damping properties of the seismic waves, predicted the vibration velocity with values very close to reality. However, the values obtained using the PPV-SD method are incompatible with the measurement results. The Q method is highly effective in cases where vibration measurement is not feasible. Additionally, the significance of directional changes in predicting blast vibrations is emphasized.
1 Introduction
Seismographs measure vibrations during blasting operations, with the highest particle velocity serving as an important damage indicator. The recorded frequency values include lateral (Tran), vertical (Vert), and longitudinal (Long), as well as the peak vector sum (PVS), which is the vector sum of these three components.
To ensure environmental continuity, it is crucial to minimize the impact of vibrations and assess the displacement and wave propagation during blasting by analyzing frequency data.
Various methods exist to detect vibrations beforehand and reduce their effects. The most commonly used approach involves the relationship between scaled distance (SD) and peak particle velocity (PPV). This relationship has been widely used in both national and local communities since the early 1960s.
There are several approaches to predicting the PPV in the literature [1,2,3,4,5,6,7,8,9,10,11,12,13,14,15,16,17,18,19,20,21,22,23,24,25,26,27,28].
The seismic quality factor (Q) has been known since 1940 and provides important information about the earthquake–ground relationship [29]. Today, a different approach based on the absorption mechanism of blast-induced seismic waves is used, instead of PPV, to predict vibration at nearby settlements and close to the slopes of mine sites. This approach is based on the seismic quality factor included in geophysical theories. The reason for using the Q factor, which is frequently used in earthquake research, to predict blast vibrations is that blasting produces the same waves as earthquakes. For this reason, Q can be used to interpret the relationship between the seismic effects that occur during blasting and the rocks [30]. In 2010, Aldas [31] proposed a formula that relates the PPV prediction in mine blasting with the frequency of the generated seismic waves and the Q factor that describes the surface waves and absorption characteristics. In addition, this formula has shown successful results in metal and coal mines in the publication of Aksoy’s article [30] published in 2020.
This study utilized the “Seismic Quality Factor (Q)” method proposed by Aksoy and Aksoy [30] to predict vibrations caused by seismic waves resulting from blasting operations in a quarry in the Sivas Province of Türkiye, instead of the traditional PPV-SD method. The method allowed for the prediction of blasting-induced vibration values that vary with distance. The Q value specific to the site was determined by analyzing the geological formations through which the blasting waves passed and the absorption mechanism of the ground. Vibration values were also calculated using time and frequency parameters and incorporated into the formula. As a result, the determined PPV will vary depending on the Q value. The data obtained from the second blasting operation highlighted the significance of directional variation in vibration. The comparison between the vibration data obtained from the seismic quality factor and the data measured at the blast sites is discussed. The suitability of the method of predicting blast vibrations using the seismic quality factor for today’s conditions and requirements is evaluated in comparison to the traditional PPV-SD method.
2 Methodology used in the study
In this part, the method of determining the seismic quality factor used in blasting-induced vibration prediction and predicting vibrations using this factor is described.
2.1 Determination of seismic quality factor from blast-induced seismic waves
The seismic quality factor provides crucial information on the absorbency of the ground. Seismic wave energy is absorbed through elastic and plastic deformation of the ground. This information can be used to determine the reflection, scattering, and refraction of seismic waves, as well as the internal friction of the ground.
The propagation distance causes a sudden weakening of the shock waves from the explosion. During the disintegration of rocks, the stress wave plays a crucial role. Natural rock masses are typically non-homogeneous. Structural planes such as joints, faults, and cracks within the rock mass prevent the propagation of stress waves and weaken their energy [32].
Calculating the seismic quality factor can help understand the effect of the ground, including scattering, weakening, and decay of seismic waves near the surface [33]. Blasts produce seismic waves similar to earthquake waves, so it is possible to determine the seismic quality factor of the environment using blasting as a source.
In the case of measurements to be made in the blast area, the seismographs are placed on the same line and the situation is studied using the principle of absorption of the seismic waves received from the seismographs with distance. Based on this principle, the seismic quality factor can be determined by measuring the ground absorption factor and the surface wave velocities. In this way, it will be possible to produce a regional seismic quality factor map. If the value of the seismic quality factor is low, the blast waves release some of their elastic energy to the ground in the form of plastic deformation. A low seismic quality factor indicates high damping in the ground, which can be caused by factors such as cracking or softness of the layer. Conversely, a high Q value indicates less damping in the layer. In soils with a high Q factor value, blast waves exhibit elastic behavior and cause minimal damage. In addition, an increase in pressure results in an increase in the Q value, indicating a reduction in energy loss.
The reflection amplitudes in seismic wave propagation environments depend not only on ground properties and incidence angles but also on frequency [34,35,36].
When determining the Q factor, calculations should be made in the frequency domain. The ground response, which expresses the expected rock behavior during blasting, is obtained from instrumental records using a seismograph. To achieve this, seismographs are placed at least two points on the same line as the blast, and measurements are taken. The natural logarithm of the ratio of the amplitude spectra of the blast-induced vibration records is then calculated. A line segment is placed on the resulting curve, and Q is calculated from the slope of this line segment [30].
As seismic waves travel from the source to the target point, they contain all geological, structural, and tectonic features of the route. Therefore, there is no need to model the geology separately. What is important here is that seismic waves should be recorded by at least two seismographs between the source and the target point. If the seismic waves are damped on the way to the target point due to different site conditions, the seismographs are shifted after each source blast. An average seismic quality factor value is determined from all the values determined for the source-target route.
The seismographs placed on the same line as the blasting point are named “Y” and “U” or the near and far stations, respectively. Borcherdt introduced the near-remote station spectral-ratio method (Figure 1), which is now commonly referred to as the standard spectral ratio (SSR) method [37]. The SSR method is widely used in the literature [38,39,40,41].
![Figure 1
Near-remote station spectral-ratio method [42].](/document/doi/10.1515/geo-2022-0633/asset/graphic/j_geo-2022-0633_fig_001.jpg)
Near-remote station spectral-ratio method [42].
The study employed the near-far station spectral-ratio method. Figure 1 shows the near station function, represented by Y(f), given by equation (1), the far station function, represented by U(f), given by equation (2), and the near station/far station spectral ratio function, represented by ΔR(f), given by equation (3).
where f is the frequency, F(f) is the earthquake source function, Y(f) is the near station function, U(f) is the far station function, R(f) is the path function between the earthquake and the nearest station, ΔR(f) is the path difference between the near station and remote station.
When calculating the seismic quality factor (Q), it is necessary to know the seismic velocity. An alternative method to determine the Q value is to provide a predicted value for the seismic velocity. However, to address the uncertainty in velocity, Aksoy and Aksoy [30] proposed an empirical equation (equation (4)) that relates Seismic Q and velocity.
where x is the distance from source to target, (m); a is the coefficient obtained from the slope of the curve found by spectral ratio, (unitless).
Devine [43] introduced equation (5), which is widely used to determine the maximum allowable amount of explosive for blast-induced vibration data to fall under the damage limit curves.
The k and β coefficients are uncontrollable parameters that have different values for each blasting site. To ensure consistency, the highest particle velocity measurements resulting from blasting must always be made in the same direction. Regression techniques are used to determine the k and β coefficients in the equation. The particle velocities obtained from vibration measurement devices in blasting operations and the applied blasting data (amount of explosive used per delay, scaled distance, etc.) are used for this purpose. The site equation was created using data obtained from previous blasting operations in the quarry where the studies were carried out. The value of k was determined as 723.417 and β was 1.292 [44]. The equation’s data were used to predict vibrations using the PPV-SD method. The resulting values were then compared to those obtained from the seismic quality factor method.
where PPV is the peak particle velocity (mm/s), M is the maximum amount of explosive per delay (kg), R is the distance between blasting and measuring points (m); k, β is the site parameter.
It is clear that equation (5) only relates PPV to the explosive amount per delay, distance, and site constant parameters. It does not take into account the frequency or duration of the impact of the blast vibrations.
Aldas [31] equated the formula, widely used in mining, with the attenuation factor in the site of geophysics. She developed a new prediction equation that includes frequency and blasting relationship. This equation can determine the seismic quality factor (Q) of the rocks to which seismic waves arising from blasting operations will propagate. Equation (6) compares the formula developed based on the seismic wave frequency at the source, the propagation speed of surface waves in rocks, and the distance with the absorption formula:
where Q is the seismic quality factor, V is the seismic velocity (m/s), and f is the PPV-frequency (Hz).
The frequency calculation in equation (6) introduces a new definition of PPV, referred to as “PPV-frequency” (equation (7)), in addition to the dominant frequency and zero-crossing frequency concepts found in the literature. Equation (8) is derived by adding the attenuation factor “a” to equation (7) [31].
This new definition includes the frequency parameter, which is not commonly used in the literature formula. PPV can be calculated using the attenuation factor, ground constants, and explosive amount.
The effect time of the blast vibrations, an important parameter that is often neglected, is not found in the widely used PPV prediction formula in the literature. The traditional approach only takes into account the PPV when designing blasting parameters. However, this approach may not be able to identify the destructive effects caused by long-duration vibrations, even if the measured PPV is low [45].
3 Application of the seismic quality factor to predict vibrations from blasting
This operation was made for the prediction of vibrations caused by blasting in a limestone quarry within the borders of the Sivas Province of Türkiye, and the geology and site studies of the crushed stone quarry are given below.
3.1 Geological structure of the quarry
The quarry region features medium-thick bedded limestone that is grey or blackish. The limestone appears as a level without lateral continuity and its thickness varies. It precipitated unconformably on the ophiolite mix and gained its present position as a result of the second transfer of ophiolites in the Eocene. Its age is stated as Upper Maestrichtian-Paleocene [46].
3.2 Site studies and comparison of measured-calculated data
Two blasting operations were conducted at the site. Seismographs were placed along the same line as the blasting area and the points to be measured to record seismic data. The absorption factor of the site ground and surface wave velocities were determined using the principle of seismic wave absorption obtained from the seismographs at a distance, and Q was calculated with the obtained information. Figures 2 and 3 show the blast area and seismographs, respectively. The blast area in Figure 2 is numbered, and the seismographs in Figure 3 are positioned on the same line and also numbered as seismic recorders.

Location of devices in seismic quality factor measurement of the first blast.

Seismographs positioned on the same line of the first blast.
The data of the first blast performed are as in Table 1. Figure 4 shows the blast area of the second blast, while Figure 5 displays the numbered seismographs located on the same line (seismic recorder). The data for the second blast can be found in Table 2.
Rock and pattern information of the first blast
| Ignition type | Rock density (ton/m³) | Slice thickness (m) | Hole diameter (mm) | Hole distance (m) | Hole length (m) | Stemming (m) | Total number of holes (piece) | Amount of explosive per delay (kg) |
|---|---|---|---|---|---|---|---|---|
| Nonel | 2.65 | 1.5 | 89 | 4 | 14 | 2 | 100 | 62.5 |

Seismographs positioned on the same line of the second blast.

Location of devices in seismic quality factor measurement of the second blast.
Rock and pattern information of the second blast
| Ignition type | Rock density (ton/m³) | Slice thickness (m) | Hole diameter (mm) | Hole distance (m) | Hole length (m) | Stemming (m) | Total number of holes (piece) | Amount of explosive per delay (kg) |
|---|---|---|---|---|---|---|---|---|
| Nonel | 2.65 | 1.5 | 89 | 4 | 14 | 2.5 | 95 | 60 |
4 Results
The study conducted several blasting operations in a quarry located in Sivas Province. Seismographs were used to measure vibration data and were placed at different distances and positions from the blast point. The seismic amplitudes recorded by seismographs 1, 2, and 3 in Figure 3 are shown in Figure 6.

Time-dependent variation of seismic amplitudes recorded by seismographs.
Figure 7 displays the Q values that were calculated from the slope of the spectral ratios of the seismic waves received from the far and near station at points 1–2, 1–3, and 2–3.
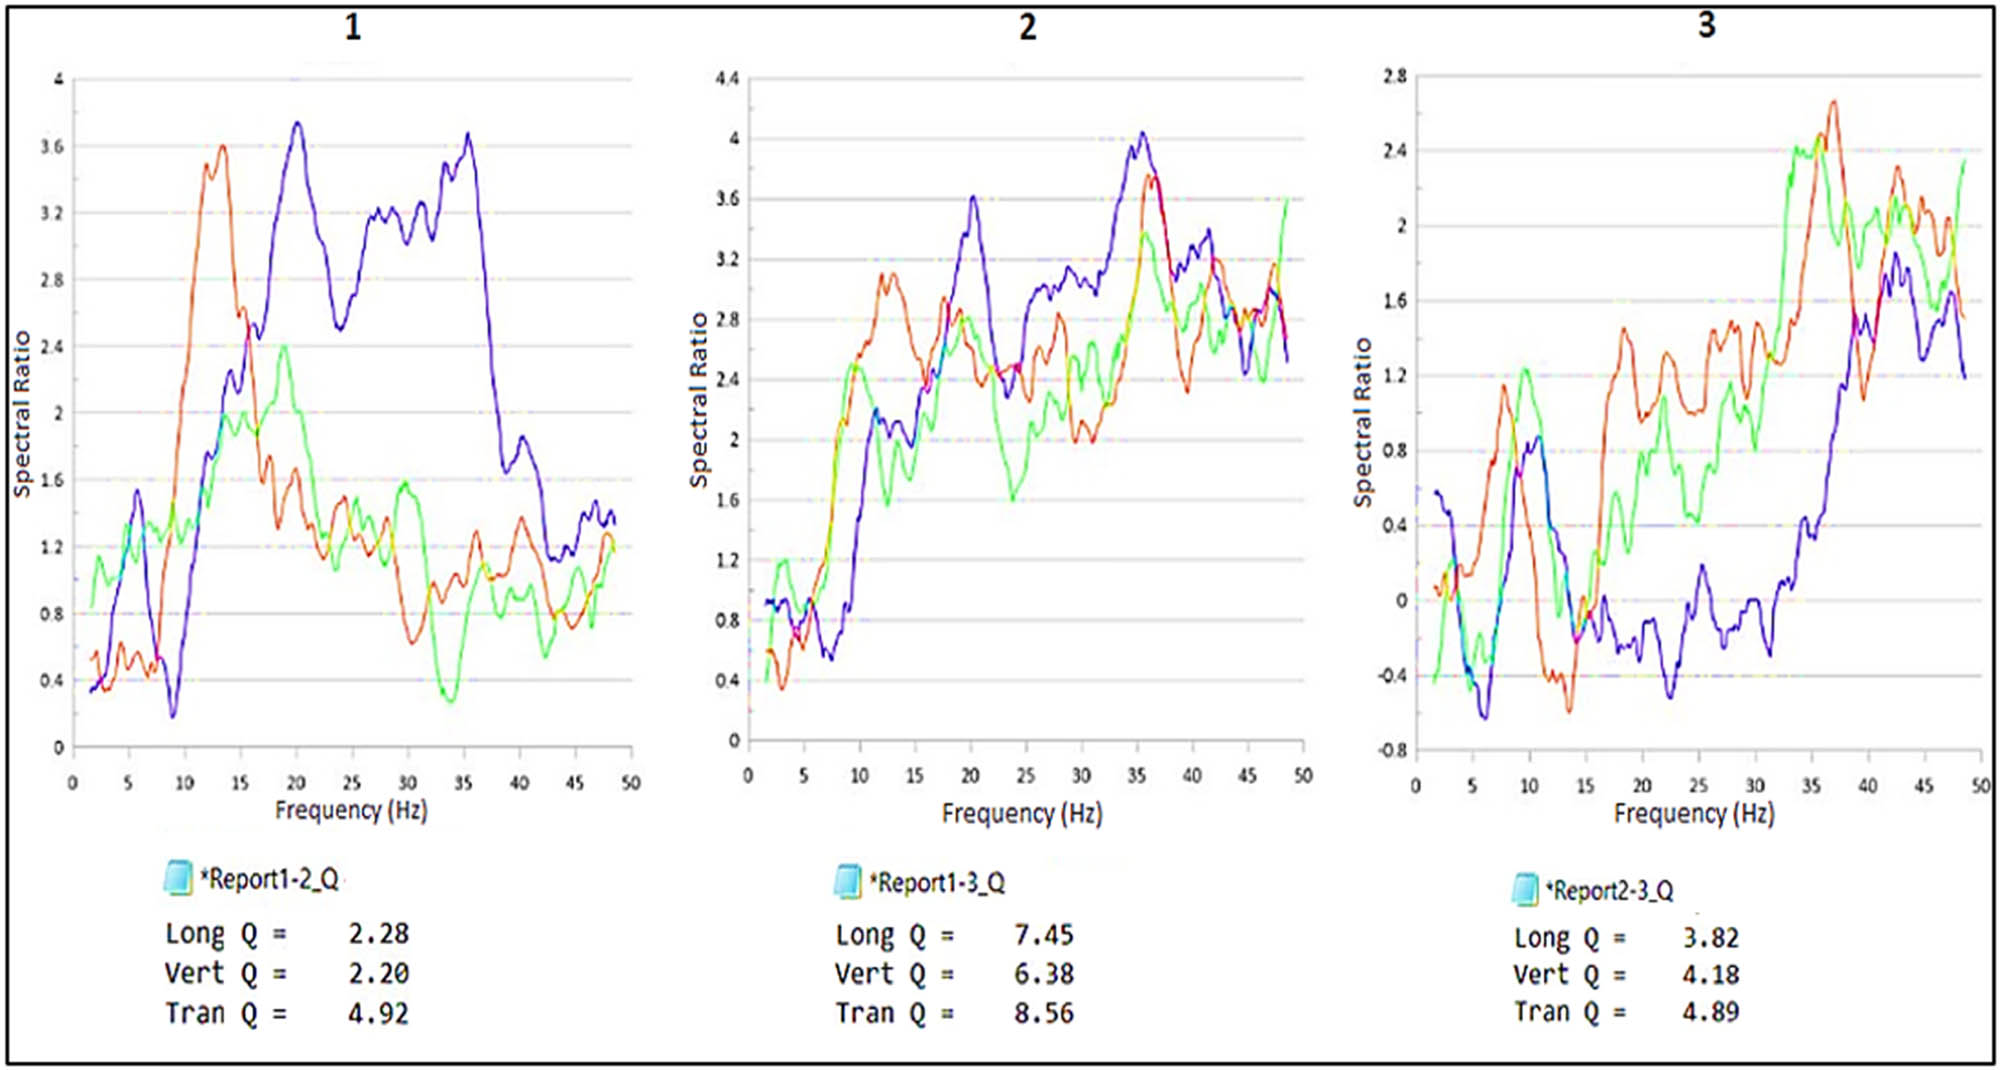
Spectral ratio plot between 1–2, 1–3, 2–3 points and Q values calculated in three components.
Table 3 shows the measurement data of the seismographs placed on the same line in two different directions during the blasting operation.
Blast data recorded by seismographs
| Device No | Distance to blast area (m) | Measured value of the device (mm/s) | ||||||
|---|---|---|---|---|---|---|---|---|
| Tran | Hz | Vert | Hz | Long | Hz | PVS | ||
| 1 | 100 | 13.97 | 85 | 14.60 | 30 | 26.16 | 10 | 28.18 |
| 2 | 200 | 3.175 | 11 | 2.159 | 12 | 3.683 | 8.8 | 4.131 |
| 3 | 300 | 2.790 | 5.2 | 1.474 | 7.4 | 2.569 | 6.9 | 3.782 |
| 4 | 130 | 14.60 | 11 | 10.92 | 13 | 11.18 | 9.1 | 15.13 |
| 5 | 210 | 7.493 | 8.5 | 4.191 | 14 | 8.636 | 8.3 | 10.83 |
Particle velocities predicted to be created by seismic waves generated in the first blasting operation at different distances are calculated using equation (6) and presented in Table 4. The seismic quality factor in equation (6) was determined as 4.961 based on the calculation in Figure 7. The value of V in equation (6) was determined as 1,000 m/s using seismic data obtained from two seismographs on the same line with the Seisblast [47] and Seisblast-Plus software. The seismic waves’ dominant frequency is 20 Hz on average for distances of 100 and 200 m, and 15 Hz for 300 m distances (Figure 8).
The values of vibrations caused by blasting, calculated with the Q Factor and measured with seismographs
| Operation 1 – Direction 1 | |||
|---|---|---|---|
| Parameters | Seismographs | ||
| 1 | 2 | 3 | |
| Q | 4.961 | 4.961 | 4.961 |
| V | 1,000 | 1,000 | 1,000 |
| F | 20 | 20 | 15 |
| R | 100 | 200 | 300 |
| Calculated PVS, mm/s | 28.19 | 5.620 | 3.345 |
| Measured PVS, mm/s | 28.18 | 4.131 | 3.782 |

Values calculated based on distance in the Seis Blast application, 1–2–3, (Seis Blast-Plus).
The time-dependent variations of the seismic amplitudes recorded by the seismographs numbered 4 and 5 in Figure 3 are shown in Figure 9.

Time-dependent variation of seismic amplitudes recorded by seismographs.
Figure 10 shows the Q values calculated from the slope of the spectral ratios of the seismic waves (between 4 and 5 points) received from the far and near station.

Spectral ratio graph between 4 and 5 points and Q values calculated in three components.
Table 5 shows the PPV generated by the seismic waves from the first blasting operation at various distances, along with data obtained from the fourth and fifth seismographs installed in the opposite direction. The average seismic quality factor was calculated as 2.89, as shown in Figure 10. The value of V in equation (6) was determined as 1,200 m/s using seismic data from two seismographs on the same line, with the assistance of Seisblast software. The seismic data show an average dominant frequency of 15 Hz at a distance of 130 m and 10 Hz at a distance of 210 m (Figure 11).
The values of vibrations caused by blasting, calculated with the Q Factor and measured with seismographs
| Operation 1 – Direction 2 | ||
|---|---|---|
| Parameters | Seismographs | |
| 4 | 5 | |
| Q | 2.89 | 2.89 |
| V | 1,200 | 1,200 |
| F | 15 | 10 |
| R | 130 | 210 |
| Calculated PVS, mm/s | 15.00 | 10.30 |
| Measured PVS, mm/s | 15.13 | 10.83 |

Values calculated based on distance in Seisblast-Plus application, 4–5.
In Figure 4, the time-dependent variations of the seismic amplitudes recorded by the seismographs numbered G1, G2, I1, and I2 are shown in Figure 12. Figure 13 shows the Q values calculated from the slope of the spectral ratios of the seismic waves (between points G1–G2 and I1–I2) received from the far and near stations.

Time-dependent variation of seismic amplitudes recorded by seismographs.

Spectral ratio graph between G1–G2, I1–I2 points, and Q values calculated in three components.
In the second blasting operation, the measurement data of the seismographs placed on the same line in two different directions are given in Table 6.
Blast data recorded by seismographs
| Device No | Distance to blast area (m) | Measured value of the device (mm/s) | ||||||
|---|---|---|---|---|---|---|---|---|
| Tran | Hz | Vert | Hz | Long | Hz | PVS | ||
| G1 | 110 | 48.39 | 34 | 39.75 | 39 | 41.19 | 12 | 55.62 |
| G2 | 220 | 6.604 | 13 | 3.429 | 15 | 7.747 | 16 | 8.866 |
| I1 | 110 | 11.43 | 11 | 3.937 | 20 | 13.08 | 9.0 | 15.59 |
| I2 | 220 | 5.833 | 6.2 | 3.500 | 13 | 7.716 | 9.8 | 8.208 |
| D1 | 468 | 1.651 | 7.3 | 0.889 | 20 | 1.270 | 6.4 | 1.769 |
Table 7 shows the particle velocities that will be created by the seismic waves at different distances between the points G1–G2 and I1–I2 where the seismographs are installed during the second blasting operation. Additionally, Figures 14 and 15 show the values calculated using the Seisblast-Plus application.
The values of vibrations caused by blasting, calculated with the Q Factor and measured with seismographs
| Operation 2 – Direction 1 | Operation 2 – Direction 2 | ||||
|---|---|---|---|---|---|
| Parameters | Seismographs | Parameters | Seismographs | ||
| G1 | G2 | I1 | I2 | ||
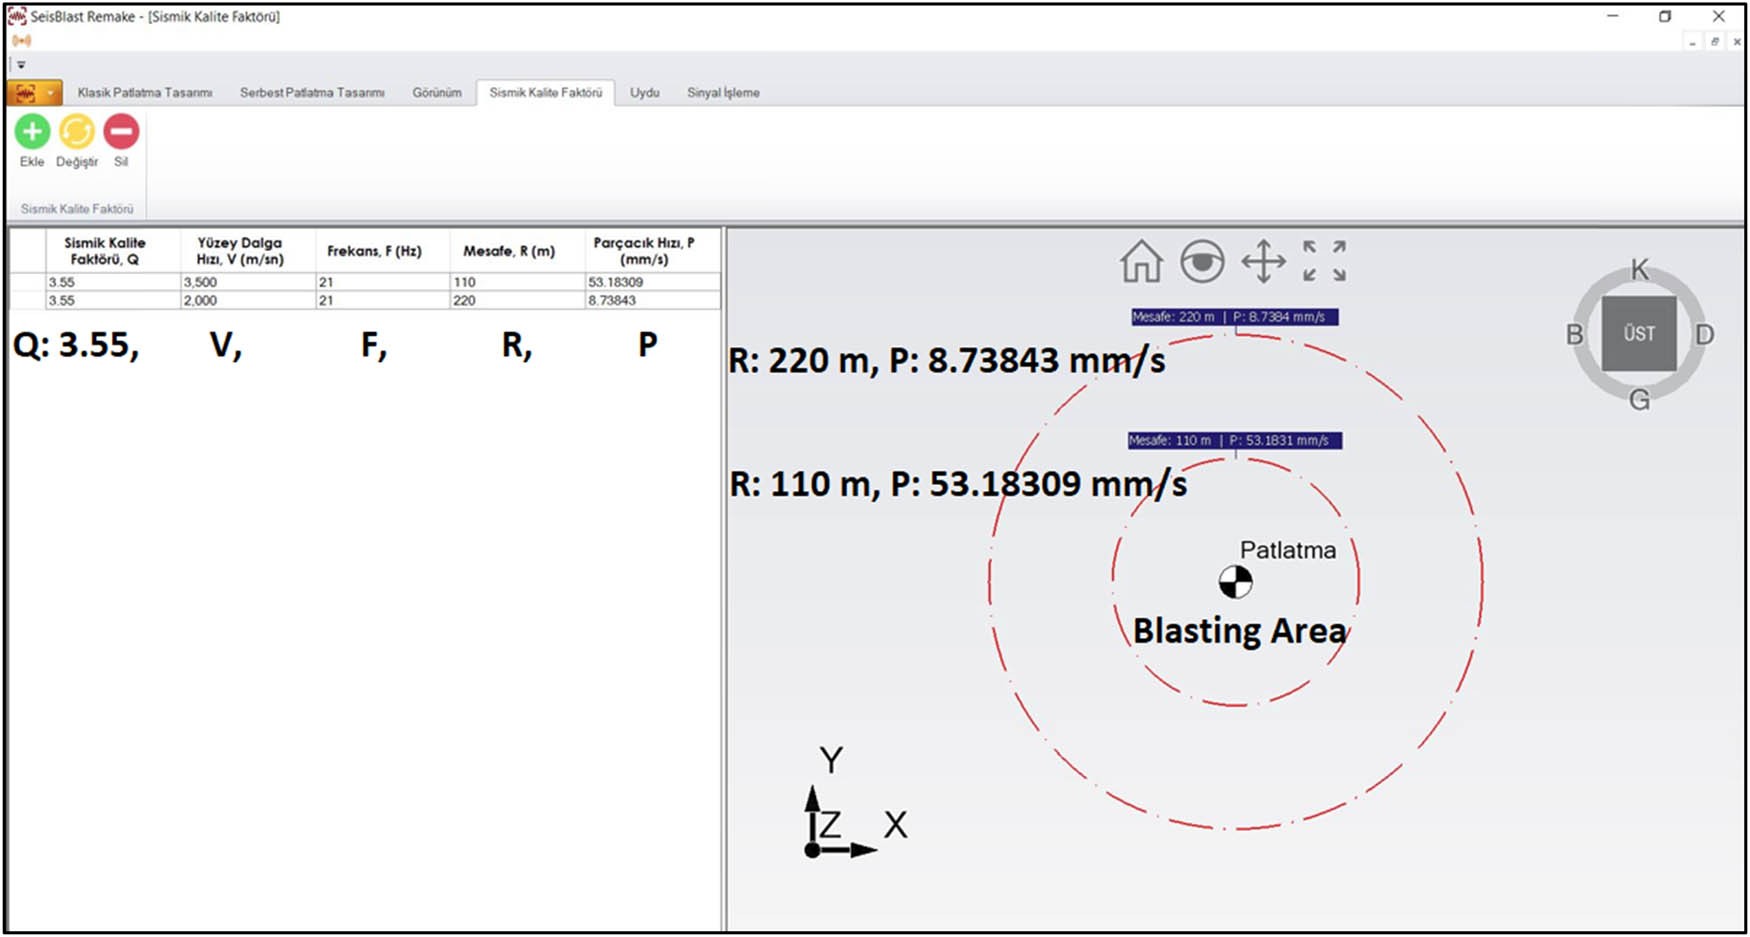
| Q | 3.55 | 3.55 | Q | 3.6 | 3.6 |
| V | 3,500 | 2,000 | V | 1,000 | 1,000 |
| F | 21 | 21 | F | 20 | 11 |
| R | 110 | 220 | R | 110 | 220 |
| Calculated PVS, mm/s | 53.18 | 8.730 | Calculated PVS, mm/s | 13.99 | 8.167 |
| Measured PVS, mm/s | 55.62 | 8.866 | Measured PVS, mm/s | 15.59 | 8.208 |
Values calculated depending on distance in Seisblast application, G1–G2.

Values calculated depending on distance in Seisblast application, I1–I2.
The vibration values for the first and second blasting operations were predicted using the PPV-SD method, as calculated by equation (5). Seismographs were placed at the measurement distances specified in Tables 3 and 6 for 62.5 and 60 kg explosives per delay, respectively, and vibration data were recorded. The measured vibration values for the blasting operations, as recorded by the seismographs, and the predicted vibration value calculated using the PPV-SD method and Q factor are presented in Table 8.
The values of vibrations caused by blasting, calculated with the PPV-SD method and measured with seismographs
| Device No | Distance to blast area (m) | Measured PVS (mm/s) | Calculated PPV-SD (mm/s) | Calculated Q Factor (mm/s) |
|---|---|---|---|---|
| 1 | 100 | 28.180 | 27.260 | 28.190 |
| 2 | 200 | 4.131 | 11.133 | 5.620 |
| 3 | 300 | 3.782 | 6.593 | 3.345 |
| 4 | 130 | 15.130 | 19.423 | 15.000 |
| 5 | 210 | 10.830 | 10.452 | 10.300 |
| G1 | 110 | 55.620 | 23.474 | 53.180 |
| G2 | 220 | 8.866 | 9.587 | 8.730 |
| I1 | 110 | 15.590 | 23.474 | 13.990 |
| I2 | 220 | 8.208 | 9.587 | 8.160 |
| D1 | 468 | 1.760 | 3.615 | 1.720 |
5 Discussion
The Q-factor approach is effective in minimizing vibrations by analyzing frequency, wave speed, and absorption parameters in detail using modern technology. The PPV-SD method, which has achieved successful results in minimizing vibrations with the knowledge and technology of the 1960s and based on only a few variables, is insufficient to minimize vibration today, especially in close settlements and slopes in the mine. This is because this formula does not include “frequency,” which is the most critical parameter in minimizing vibration. It also does not include the parameters of absorption and wave velocity. The formula is based on an empirical formula derived from 30 or more field blasting data. It loses validity when the site formation changes.
The Q factor method analyzes seismic data recorded by two seismographs on the same line. These data take into account the absorption and damping characteristics of seismic waves, the frequency content of possible surface waves, and their velocities. By measuring two seismic data near the blast area, vibration velocities can be accurately estimated at close range. Unlike the PPV-SD formula, the Q factor method requires only one pilot hole blast and two seismographs to be repeated in the changed formation.
Aksoy and Aksoy [30] stated that the PPV-SD method does not consider frequency, requires at least 30 blasting data to be valid, loses validity when the formation changes, and needs 30 blasting data to be renewed. The formula is only sensitive to explosive limitation, and vibration rates cannot be accurately predicted near the explosion area. The vibration values were measured at distances of 100 and 200 m, resulting in 12.07 and 2.338 mm/s, respectively. The Q factor method was used to calculate the vibrations, resulting in 12.327 and 2.159 mm/s, respectively. The results were found to be quite close.
The Q factor method requires seismic data from multiple seismographs on the same line with only one blasting or pilot hole operation. This method predicts vibration velocities with values close to reality by considering the frequency content, absorption and damping properties of seismic waves, and the velocity of surface waves. It has been shown to be effective even at close distances.
Fuławka et al. [48] employed quantitative methods based on in situ seismic measurements to evaluate blasting efficiency. They claimed that the results would facilitate the determination of blasting parameters. The method is applicable in underground mines, quarries, and open pits where monitoring the seismic effect of blasting is necessary.
The impact of blast-induced vibrations on structures and living organisms is not solely determined by the maximum particle velocity. Frequency is also a crucial parameter, with low-frequency vibrations being particularly damaging to structures. Therefore, it is essential to accurately predict vibrations prior to blasting to minimize any physical or psychological effects on the environment.
6 Conclusions
There is limited literature on the results of predicting blast-induced vibration using alternative methods, particularly in quarry areas, compared to traditional methods.
Table 8 shows a comparison between the vibration measurement data obtained from seismographs placed on the same line as the blasting area during the first and second blasting operations and the predicted vibration values obtained from the PPV-SD and Q factor methods. The Q factor method yielded more effective results.
At the measurement site, the Q value in all components was approximately average. Specifically, it was 4.961 in the first direction in the first blasting, 2.890 in the second direction, 3.550 in the first direction, and 3.600 in the second direction in the second blasting. These values can be used to predict the particle velocities created by seismic waves in cases where measurements cannot be made at the operation site.
The PPV-SD method is inadequate for predicting vibration values at points in different directions where the amount of explosive used per delay and the scaled distance range are equal. When examining the vibration values in the G1-I1 and G2-I2 directions at equal distances during the second blasting operation from Table 8, values of 55.620 and 15.590 mm/s were measured at points 110 m away from the blasting point in the G1-I1 direction, and values of 8.860 and 8.200 mm/s were measured at points 220 m away from the blasting point in the G2-I2 direction. In the Q method, the values at G1-I1 points were 53.180 and 13.990 mm/s, and at G2-I2 points were 8.730 and 8.160 mm/s. The vibration values were calculated using two methods. The measured and calculated values were found to be very close to each other. In the PPV-SD method, a single value of 23.474 mm/s was calculated at G1-I1 points, and a single value of 9.587 mm/s was calculated at G2-I2 points. The PPV-SD method calculates a single value because the explosive per delay and measurement distance values are identical, and seismic wave frequency and surface wave propagation speed in rocks are not considered.
During the second blasting operation at the site, the PVS value was measured in two directions, G1-G2 and I1-I2, at equal distances. The PVS value in the G1–G2 direction was 55.620 mm/s, while in the I1–I2 direction, it was 15.590 mm/s. This indicates that seismic waves propagating in different directions from the detonation point can result in significantly different vibration rates at the same distances. Furthermore, the directional examination of seismic wave absorption is necessary due to factors such as the structural-tectonic composition of the Earth.
The study concludes that the Q factor method is highly effective in predicting vibrations resulting from quarry blasting.
-
Conflict of interest: Author states no conflict of interest.
References
[1] Duvall WI, Fogleson DE. Review of criteria for estimating damage to residences from blasting vibrations. RI:5968. Washington, D.C., U.S.A: US Bureau of Mines; 1962.Search in Google Scholar
[2] Davies B, Farmer W, Attewell PB. Ground vibration from shallow sub-surface blasts. Engineering. London, U.K.: Wiley; 1964Search in Google Scholar
[3] Langefors U, Kihlström B. The modern technique of rock blasting. Stockholm, Sweden: Almqvist & Wiksell; 1967.Search in Google Scholar
[4] Ambraseys NR, Hendron AJ. Dynamic behaviour of rock masses in rock mechanics in engineering practices. London, U.K: Wiley; 1968.Search in Google Scholar
[5] Nreholls HR, Johnson CF, Duvall WL. Blasting. New Jersey, U.S.A: Prentice-Hall; 1971.Search in Google Scholar
[6] Indian Standard Institute, Criteria for safety and design of structures subjected to underground blast, Indian Mining Institue, India, Report No. IS-6922, 1973.Search in Google Scholar
[7] Siskind DE, Stagg MS, Kopp JW, Dowding CH. Structure response and damage produced by ground vibrations from surface mine blasting. Washington, D.C., U.S.A: US Bureau of Mines; Report No. RI 8507, 1980.Search in Google Scholar
[8] Anderson DA, Winzer SR, Ritter AP. Blast design for optimizing fragmentation while controlling frequency of ground vibration. Proceedings of the 8th Conference on Explosives and Blasting Technique. New Orleans, Louisiana, U.S.A.; 1982.Search in Google Scholar
[9] Ghosh A, Daemen JJK. A simple new blast vibration predictor (Based on Wave Propagation Laws). Proceedings of the U.S. Symposium on Rock Mechanics. Texas, U.S.A.; 1983.Search in Google Scholar
[10] Dowding CH. Blast vibration monitoring and control. Englewood Cliffs, New Jersey, U.S.A: Prentice Hall; 1985.Search in Google Scholar
[11] Gupta RN, Roy PP, Bagachi A, Singh B. Dynamic effects in various rock mass and their predictions. J Mines Met Fuels. 1987;12(1):455–62.Search in Google Scholar
[12] Siskind DE, Crum SV, Otterness RE, Kopp JW. Comparative study of blasting vibrations from Indiana surface coal mine. Washington, D.C., U.S.A: US Bureau of Mines; Report No. RI 9226, 1989.Search in Google Scholar
[13] Roy PP. Vibration control in an opencast mine based on improved blast vibration predictors. Min Sci Technol. 1991;12(31):157–65. 10.1016/0167-9031(91)91642-U.Search in Google Scholar
[14] Anderson DA. Blast monitoring: Regulations, methods and control techniques. In: Hudson JA, editor. Comprehensive rock engineering. Pergamon Press; 1993. p. 95–110.10.1016/B978-0-08-042067-7.50011-8Search in Google Scholar
[15] Persson PA, Holmberg R, Lee J. Rock blasting and explosives engineering. Boca Raton: CRC Press; 1994. p. 365–7.Search in Google Scholar
[16] Muller B. Adapting blasting technologies to the characteristics of rock masses in order to improve blasting results and reduce blasting vibrations. Fragblast. 1997;1(1):361–78. 10.1080/13855149709408403.Search in Google Scholar
[17] Muller B, Hohlfeld TH. New possibility of reducing blasting vibrations with an improved prognosis. Fragblast. 1997;1(1):379–92. 10.1080/13855149709408404.Search in Google Scholar
[18] Hoshino T, Mogi G, Shaoquan K. Optimum delay interval design in delay blasting. Fragblast. 2000;4(2):139–48. 10.1076/frag.4.2.139.7448.Search in Google Scholar
[19] Siskind DE. Vibrations from blasting. International Society of Explosives Engineers; 2000. p. 120.Search in Google Scholar
[20] Bilgin HA, Esen S, Kılıç M, Aldaş GGU. Blasting minimisation studies at Yeniköy lignite mine. Proceedings of the 4 th Drilling and Blasting Symposium. Ankara; 2000.Search in Google Scholar
[21] Chen G, Huang S. Analysis of ground vibrations caused by open pit production blasts: A case study. Fragblast. 2001;5(1):91–107. 10.1076/frag.5.1.91.3316.Search in Google Scholar
[22] Tripathy G, Gupta ID. Prediction of ground vibrations due to construction blasts in different types of rock. Rock Mech Rock Eng. 2002;35(3):195–204. 10.1007/s00603-001-0022-9.Search in Google Scholar
[23] Adhikari GR, Theresraj AI, Venkatesh S, Balachander R, Gupta RN. Ground vibration due to blasting in limestone quarries. Int J Blast Fragm. 2004;8(2):85–94. 10.1080/13855140412331336160.Search in Google Scholar
[24] Kahriman A. Analysis of parameters of ground vibration produced from bench blasting at a limestone quarry. Soil Dyn Earthq Eng. 2004;24(11):887–92. 10.1016/j.soildyn.2004.06.018.Search in Google Scholar
[25] Cihangir F, Kesimal A, Erçıkdı B, Durmuş O. Bir Kalker Ocağında Patlatmak Kazılardan Kaynaklanan Çevresel Etkilerin Analizi. Trabzon Madencilik ve Çevre Sempozyumu. Turkey: Karadeniz Teknik Üniversitesi, Maden Mühendisliği Bölümü; 2005.Search in Google Scholar
[26] Singh PK, Roy MP. Damage to surface structures due to blast vibration. Int J Rock Mech Min Sci. 2010;47(6):949–61. 10.1016/j.ijrmms.2010.06.010.Search in Google Scholar
[27] Hasanipanah M, Naderi R, Kashir J, Noorani SA, Zeynali Aaq Qaleh A. Prediction of blast-produced ground vibration using particle swarm optimization. Eng Computers. 2017;33:173–9. 10.1007/s00366-016-0462-1.Search in Google Scholar
[28] Mokfi T, Shahnazar A, Bakhshayeshi I, Derakhsh AM, Tabrizi O. Proposing of a new soft computing-based model to predict peak particle velocity induced by blasting. Eng Computers. 2018;34:881–8. 10.1007/s00366-018-0578-6.Search in Google Scholar
[29] Ricker N. The form and nature of seismic waves and the structure of seismograms. Geophysics. 1940;5(4):348–66. 10.1190/1.1441816.Search in Google Scholar
[30] Aksoy GGU, Aksoy O. Usage of seismic quality factor in prediction of blast induced vibrations. J Undergr Resour. 2020;18:133–46.Search in Google Scholar
[31] Aldas GGU. Explosive charge mass and peak particle velocity (PPV-frequency relation in mining blast. J Geophys Eng. 2010;7(1):223–31. 10.1088/1742-2132/7/3/001.Search in Google Scholar
[32] Feng X, Zhang Q, Ali M. Explosion-induced stress wave propagation in interacting fault system: Numerical modeling and implications for Chaoyang coal mine. Shock Vib. 2019;1–12. 10.1155/2019/5856080.Search in Google Scholar
[33] Abercrombie RE. Near-surface attenuation and site effects from comparison of surface and deep borehole recordings. Bull Seismol Soc Am. 1997;87(3):731–44. 10.1785/BSSA0870030731.Search in Google Scholar
[34] Chapman M, Liu E, Li X-Y. The influence of fluid sensitive dispersion and attenuation on AVO analysis. J Geophys Int. 2006;167(1):89–105. 10.1111/j.1365-246X.2006.02919.x.Search in Google Scholar
[35] Jin Z, Chapman M, Wu X, Papageorgiou G. Estimating gas saturation in a thin layer by using frequency-dependent amplitude versus offset modelling. Geophys Prospect. 2017;65(3):747–65. 10.1111/1365-2478.12437.Search in Google Scholar
[36] Kumar D, Zhao Z, Foster DJ, Dralus D, Sen MK. Frequency-dependent AVO analysis using the scattering response of a layered reservoir. Geophysics. 2020;85(2):N1–N16. 10.1190/geo2019-0167.1.Search in Google Scholar
[37] Borcherdt RD. Effects of local geology on ground motion near San Francisco Bay. Bull Seismol Soc Am. 1970;60(1):35–44. 10.1785/BSSA0600010029.Search in Google Scholar
[38] Allmann B, Hauksson E. Spectral discrimination between quarry blasts and earthquakes in Southern California. Bull Seismol Soc Am. 2008;98(4):2073–9. 10.1785/0120070215.Search in Google Scholar
[39] Dıkun J, Urmonıene L, Stanelyte D. Spectral ratio method for fault detection in rotating machines. Balk J Electr Computer Eng. 2018;6(2):129–31. 10.17694/bajece.419642.Search in Google Scholar
[40] Lıu N, Gao J. Seismic attenuation estimation using the modified log spectral ratio method. J Appl Geophys. 2018;159:386–94. 10.1016/j.jappgeo.2018.09.014.Search in Google Scholar
[41] Ceydilek N, Horasan G. Discrimination of quarry blasts and earthquakes in Manisa district. Turk J Earthq Res. 2019;1(1):26–47.10.46464/tdad.563941Search in Google Scholar
[42] Ecevitoğlu B. Sismik Veri İşlem Ders Notları. Ankara Üniversitesi Jeofizik Müh; 2008.Search in Google Scholar
[43] Devine JF. Effect of charge weight on vibration levels from quarry blasting. US Department of the Interior, Bureau of Mines. Vol. 6774; 1966.Search in Google Scholar
[44] Ercins S. Performance analysis of open-pit blasting works. PhD Thesis. Kütahya: Kütahya Dumlupınar University, Graduate School of Sciences, Department of Mining Engineering; 2018.Search in Google Scholar
[45] Uyar GG, Aksoy CO. Comparative review and interpretation of the conventional and new methods in blast vibration analyses. Geomech Eng. 2019;18(5):545–54. 10.12989/gae.2019.18.5.545.Search in Google Scholar
[46] İnan S, Öztürk A, ve Gürsoy H. Stratigraphy of the Ulaş-Sincan (Sivas) region. Turkish J Earth Sci. 1993;2:1–15.Search in Google Scholar
[47] Aldas GGU, Ecevitoğlu B. Waveform analysis in mitigation of blast_induced vibrations. J Appl Geophys. 2008;66(1-2):25–30. 10.1016/j.jappgeo.2008.08.004.Search in Google Scholar
[48] Fuławka K, Mertuszka P, Pytel W, Szumny M, Jones T. Seismic evaluation of the destress blasting efficiency. J Rock Mech Geotech Eng. 2022;14(5):1501–13. 10.1016/j.jrmge.2021.12.010.Search in Google Scholar
© 2024 the author(s), published by De Gruyter
This work is licensed under the Creative Commons Attribution 4.0 International License.
Articles in the same Issue
- Regular Articles
- Theoretical magnetotelluric response of stratiform earth consisting of alternative homogeneous and transitional layers
- The research of common drought indexes for the application to the drought monitoring in the region of Jin Sha river
- Evolutionary game analysis of government, businesses, and consumers in high-standard farmland low-carbon construction
- On the use of low-frequency passive seismic as a direct hydrocarbon indicator: A case study at Banyubang oil field, Indonesia
- Water transportation planning in connection with extreme weather conditions; case study – Port of Novi Sad, Serbia
- Zircon U–Pb ages of the Paleozoic volcaniclastic strata in the Junggar Basin, NW China
- Monitoring of mangrove forests vegetation based on optical versus microwave data: A case study western coast of Saudi Arabia
- Microfacies analysis of marine shale: A case study of the shales of the Wufeng–Longmaxi formation in the western Chongqing, Sichuan Basin, China
- Multisource remote sensing image fusion processing in plateau seismic region feature information extraction and application analysis – An example of the Menyuan Ms6.9 earthquake on January 8, 2022
- Identification of magnetic mineralogy and paleo-flow direction of the Miocene-quaternary volcanic products in the north of Lake Van, Eastern Turkey
- Impact of fully rotating steel casing bored pile on adjacent tunnels
- Adolescents’ consumption intentions toward leisure tourism in high-risk leisure environments in riverine areas
- Petrogenesis of Jurassic granitic rocks in South China Block: Implications for events related to subduction of Paleo-Pacific plate
- Differences in urban daytime and night block vitality based on mobile phone signaling data: A case study of Kunming’s urban district
- Random forest and artificial neural network-based tsunami forests classification using data fusion of Sentinel-2 and Airbus Vision-1 satellites: A case study of Garhi Chandan, Pakistan
- Integrated geophysical approach for detection and size-geometry characterization of a multiscale karst system in carbonate units, semiarid Brazil
- Spatial and temporal changes in ecosystem services value and analysis of driving factors in the Yangtze River Delta Region
- Deep fault sliding rates for Ka-Ping block of Xinjiang based on repeating earthquakes
- Improved deep learning segmentation of outdoor point clouds with different sampling strategies and using intensities
- Platform margin belt structure and sedimentation characteristics of Changxing Formation reefs on both sides of the Kaijiang-Liangping trough, eastern Sichuan Basin, China
- Enhancing attapulgite and cement-modified loess for effective landfill lining: A study on seepage prevention and Cu/Pb ion adsorption
- Flood risk assessment, a case study in an arid environment of Southeast Morocco
- Lower limits of physical properties and classification evaluation criteria of the tight reservoir in the Ahe Formation in the Dibei Area of the Kuqa depression
- Evaluation of Viaducts’ contribution to road network accessibility in the Yunnan–Guizhou area based on the node deletion method
- Permian tectonic switch of the southern Central Asian Orogenic Belt: Constraints from magmatism in the southern Alxa region, NW China
- Element geochemical differences in lower Cambrian black shales with hydrothermal sedimentation in the Yangtze block, South China
- Three-dimensional finite-memory quasi-Newton inversion of the magnetotelluric based on unstructured grids
- Obliquity-paced summer monsoon from the Shilou red clay section on the eastern Chinese Loess Plateau
- Classification and logging identification of reservoir space near the upper Ordovician pinch-out line in Tahe Oilfield
- Ultra-deep channel sand body target recognition method based on improved deep learning under UAV cluster
- New formula to determine flyrock distance on sedimentary rocks with low strength
- Assessing the ecological security of tourism in Northeast China
- Effective reservoir identification and sweet spot prediction in Chang 8 Member tight oil reservoirs in Huanjiang area, Ordos Basin
- Detecting heterogeneity of spatial accessibility to sports facilities for adolescents at fine scale: A case study in Changsha, China
- Effects of freeze–thaw cycles on soil nutrients by soft rock and sand remodeling
- Vibration prediction with a method based on the absorption property of blast-induced seismic waves: A case study
- A new look at the geodynamic development of the Ediacaran–early Cambrian forearc basalts of the Tannuola-Khamsara Island Arc (Central Asia, Russia): Conclusions from geological, geochemical, and Nd-isotope data
- Spatio-temporal analysis of the driving factors of urban land use expansion in China: A study of the Yangtze River Delta region
- Selection of Euler deconvolution solutions using the enhanced horizontal gradient and stable vertical differentiation
- Phase change of the Ordovician hydrocarbon in the Tarim Basin: A case study from the Halahatang–Shunbei area
- Using interpretative structure model and analytical network process for optimum site selection of airport locations in Delta Egypt
- Geochemistry of magnetite from Fe-skarn deposits along the central Loei Fold Belt, Thailand
- Functional typology of settlements in the Srem region, Serbia
- Hunger Games Search for the elucidation of gravity anomalies with application to geothermal energy investigations and volcanic activity studies
- Addressing incomplete tile phenomena in image tiling: Introducing the grid six-intersection model
- Evaluation and control model for resilience of water resource building system based on fuzzy comprehensive evaluation method and its application
- MIF and AHP methods for delineation of groundwater potential zones using remote sensing and GIS techniques in Tirunelveli, Tenkasi District, India
- New database for the estimation of dynamic coefficient of friction of snow
- Measuring urban growth dynamics: A study in Hue city, Vietnam
- Comparative models of support-vector machine, multilayer perceptron, and decision tree predication approaches for landslide susceptibility analysis
- Experimental study on the influence of clay content on the shear strength of silty soil and mechanism analysis
- Geosite assessment as a contribution to the sustainable development of Babušnica, Serbia
- Using fuzzy analytical hierarchy process for road transportation services management based on remote sensing and GIS technology
- Accumulation mechanism of multi-type unconventional oil and gas reservoirs in Northern China: Taking Hari Sag of the Yin’e Basin as an example
- TOC prediction of source rocks based on the convolutional neural network and logging curves – A case study of Pinghu Formation in Xihu Sag
- A method for fast detection of wind farms from remote sensing images using deep learning and geospatial analysis
- Spatial distribution and driving factors of karst rocky desertification in Southwest China based on GIS and geodetector
- Physicochemical and mineralogical composition studies of clays from Share and Tshonga areas, Northern Bida Basin, Nigeria: Implications for Geophagia
- Geochemical sedimentary records of eutrophication and environmental change in Chaohu Lake, East China
- Research progress of freeze–thaw rock using bibliometric analysis
- Mixed irrigation affects the composition and diversity of the soil bacterial community
- Examining the swelling potential of cohesive soils with high plasticity according to their index properties using GIS
- Geological genesis and identification of high-porosity and low-permeability sandstones in the Cretaceous Bashkirchik Formation, northern Tarim Basin
- Usability of PPGIS tools exemplified by geodiscussion – a tool for public participation in shaping public space
- Efficient development technology of Upper Paleozoic Lower Shihezi tight sandstone gas reservoir in northeastern Ordos Basin
- Assessment of soil resources of agricultural landscapes in Turkestan region of the Republic of Kazakhstan based on agrochemical indexes
- Evaluating the impact of DEM interpolation algorithms on relief index for soil resource management
- Petrogenetic relationship between plutonic and subvolcanic rocks in the Jurassic Shuikoushan complex, South China
- A novel workflow for shale lithology identification – A case study in the Gulong Depression, Songliao Basin, China
- Characteristics and main controlling factors of dolomite reservoirs in Fei-3 Member of Feixianguan Formation of Lower Triassic, Puguang area
- Impact of high-speed railway network on county-level accessibility and economic linkage in Jiangxi Province, China: A spatio-temporal data analysis
- Estimation model of wild fractional vegetation cover based on RGB vegetation index and its application
- Lithofacies, petrography, and geochemistry of the Lamphun oceanic plate stratigraphy: As a record of the subduction history of Paleo-Tethys in Chiang Mai-Chiang Rai Suture Zone of Thailand
- Structural features and tectonic activity of the Weihe Fault, central China
- Application of the wavelet transform and Hilbert–Huang transform in stratigraphic sequence division of Jurassic Shaximiao Formation in Southwest Sichuan Basin
- Structural detachment influences the shale gas preservation in the Wufeng-Longmaxi Formation, Northern Guizhou Province
- Distribution law of Chang 7 Member tight oil in the western Ordos Basin based on geological, logging and numerical simulation techniques
- Evaluation of alteration in the geothermal province west of Cappadocia, Türkiye: Mineralogical, petrographical, geochemical, and remote sensing data
- Numerical modeling of site response at large strains with simplified nonlinear models: Application to Lotung seismic array
- Quantitative characterization of granite failure intensity under dynamic disturbance from energy standpoint
- Characteristics of debris flow dynamics and prediction of the hazardous area in Bangou Village, Yanqing District, Beijing, China
- Rockfall mapping and susceptibility evaluation based on UAV high-resolution imagery and support vector machine method
- Statistical comparison analysis of different real-time kinematic methods for the development of photogrammetric products: CORS-RTK, CORS-RTK + PPK, RTK-DRTK2, and RTK + DRTK2 + GCP
- Hydrogeological mapping of fracture networks using earth observation data to improve rainfall–runoff modeling in arid mountains, Saudi Arabia
- Petrography and geochemistry of pegmatite and leucogranite of Ntega-Marangara area, Burundi, in relation to rare metal mineralisation
- Prediction of formation fracture pressure based on reinforcement learning and XGBoost
- Hazard zonation for potential earthquake-induced landslide in the eastern East Kunlun fault zone
- Monitoring water infiltration in multiple layers of sandstone coal mining model with cracks using ERT
- Study of the patterns of ice lake variation and the factors influencing these changes in the western Nyingchi area
- Productive conservation at the landslide prone area under the threat of rapid land cover changes
- Sedimentary processes and patterns in deposits corresponding to freshwater lake-facies of hyperpycnal flow – An experimental study based on flume depositional simulations
- Study on time-dependent injectability evaluation of mudstone considering the self-healing effect
- Detection of objects with diverse geometric shapes in GPR images using deep-learning methods
- Behavior of trace metals in sedimentary cores from marine and lacustrine environments in Algeria
- Spatiotemporal variation pattern and spatial coupling relationship between NDVI and LST in Mu Us Sandy Land
- Formation mechanism and oil-bearing properties of gravity flow sand body of Chang 63 sub-member of Yanchang Formation in Huaqing area, Ordos Basin
- Diagenesis of marine-continental transitional shale from the Upper Permian Longtan Formation in southern Sichuan Basin, China
- Vertical high-velocity structures and seismic activity in western Shandong Rise, China: Case study inspired by double-difference seismic tomography
- Spatial coupling relationship between metamorphic core complex and gold deposits: Constraints from geophysical electromagnetics
- Disparities in the geospatial allocation of public facilities from the perspective of living circles
- Research on spatial correlation structure of war heritage based on field theory. A case study of Jinzhai County, China
- Formation mechanisms of Qiaoba-Zhongdu Danxia landforms in southwestern Sichuan Province, China
- Magnetic data interpretation: Implication for structure and hydrocarbon potentiality at Delta Wadi Diit, Southeastern Egypt
- Deeply buried clastic rock diagenesis evolution mechanism of Dongdaohaizi sag in the center of Junggar fault basin, Northwest China
- Application of LS-RAPID to simulate the motion of two contrasting landslides triggered by earthquakes
- The new insight of tectonic setting in Sunda–Banda transition zone using tomography seismic. Case study: 7.1 M deep earthquake 29 August 2023
- The critical role of c and φ in ensuring stability: A study on rockfill dams
- Evidence of late quaternary activity of the Weining-Shuicheng Fault in Guizhou, China
- Extreme hydroclimatic events and response of vegetation in the eastern QTP since 10 ka
- Spatial–temporal effect of sea–land gradient on landscape pattern and ecological risk in the coastal zone: A case study of Dalian City
- Study on the influence mechanism of land use on carbon storage under multiple scenarios: A case study of Wenzhou
- A new method for identifying reservoir fluid properties based on well logging data: A case study from PL block of Bohai Bay Basin, North China
- Comparison between thermal models across the Middle Magdalena Valley, Eastern Cordillera, and Eastern Llanos basins in Colombia
- Mineralogical and elemental analysis of Kazakh coals from three mines: Preliminary insights from mode of occurrence to environmental impacts
- Chlorite-induced porosity evolution in multi-source tight sandstone reservoirs: A case study of the Shaximiao Formation in western Sichuan Basin
- Predicting stability factors for rotational failures in earth slopes and embankments using artificial intelligence techniques
- Origin of Late Cretaceous A-type granitoids in South China: Response to the rollback and retreat of the Paleo-Pacific plate
- Modification of dolomitization on reservoir spaces in reef–shoal complex: A case study of Permian Changxing Formation, Sichuan Basin, SW China
- Geological characteristics of the Daduhe gold belt, western Sichuan, China: Implications for exploration
- Rock physics model for deep coal-bed methane reservoir based on equivalent medium theory: A case study of Carboniferous-Permian in Eastern Ordos Basin
- Enhancing the total-field magnetic anomaly using the normalized source strength
- Shear wave velocity profiling of Riyadh City, Saudi Arabia, utilizing the multi-channel analysis of surface waves method
- Effect of coal facies on pore structure heterogeneity of coal measures: Quantitative characterization and comparative study
- Inversion method of organic matter content of different types of soils in black soil area based on hyperspectral indices
- Detection of seepage zones in artificial levees: A case study at the Körös River, Hungary
- Tight sandstone fluid detection technology based on multi-wave seismic data
- Characteristics and control techniques of soft rock tunnel lining cracks in high geo-stress environments: Case study of Wushaoling tunnel group
- Influence of pore structure characteristics on the Permian Shan-1 reservoir in Longdong, Southwest Ordos Basin, China
- Study on sedimentary model of Shanxi Formation – Lower Shihezi Formation in Da 17 well area of Daniudi gas field, Ordos Basin
- Multi-scenario territorial spatial simulation and dynamic changes: A case study of Jilin Province in China from 1985 to 2030
- Review Articles
- Major ascidian species with negative impacts on bivalve aquaculture: Current knowledge and future research aims
- Prediction and assessment of meteorological drought in southwest China using long short-term memory model
- Communication
- Essential questions in earth and geosciences according to large language models
- Erratum
- Erratum to “Random forest and artificial neural network-based tsunami forests classification using data fusion of Sentinel-2 and Airbus Vision-1 satellites: A case study of Garhi Chandan, Pakistan”
- Special Issue: Natural Resources and Environmental Risks: Towards a Sustainable Future - Part I
- Spatial-temporal and trend analysis of traffic accidents in AP Vojvodina (North Serbia)
- Exploring environmental awareness, knowledge, and safety: A comparative study among students in Montenegro and North Macedonia
- Determinants influencing tourists’ willingness to visit Türkiye – Impact of earthquake hazards on Serbian visitors’ preferences
- Application of remote sensing in monitoring land degradation: A case study of Stanari municipality (Bosnia and Herzegovina)
- Optimizing agricultural land use: A GIS-based assessment of suitability in the Sana River Basin, Bosnia and Herzegovina
- Assessing risk-prone areas in the Kratovska Reka catchment (North Macedonia) by integrating advanced geospatial analytics and flash flood potential index
- Analysis of the intensity of erosive processes and state of vegetation cover in the zone of influence of the Kolubara Mining Basin
- GIS-based spatial modeling of landslide susceptibility using BWM-LSI: A case study – city of Smederevo (Serbia)
- Geospatial modeling of wildfire susceptibility on a national scale in Montenegro: A comparative evaluation of F-AHP and FR methodologies
- Geosite assessment as the first step for the development of canyoning activities in North Montenegro
- Urban geoheritage and degradation risk assessment of the Sokograd fortress (Sokobanja, Eastern Serbia)
- Multi-hazard modeling of erosion and landslide susceptibility at the national scale in the example of North Macedonia
- Understanding seismic hazard resilience in Montenegro: A qualitative analysis of community preparedness and response capabilities
- Forest soil CO2 emission in Quercus robur level II monitoring site
- Characterization of glomalin proteins in soil: A potential indicator of erosion intensity
- Power of Terroir: Case study of Grašac at the Fruška Gora wine region (North Serbia)
- Special Issue: Geospatial and Environmental Dynamics - Part I
- Qualitative insights into cultural heritage protection in Serbia: Addressing legal and institutional gaps for disaster risk resilience