Using fuzzy analytical hierarchy process for road transportation services management based on remote sensing and GIS technology
-
Ashraf A. A. Beshr
 ,
Magdy Israil
,
Magdy Israil

Abstract
The importance of site selection for road transportation management and emergency services has been underscored, particularly in the wake of the global Covid-19 pandemic in addition to road accident injuries, which emphasized the need for swift patient, injured and wounded peoples transfer to hospitals. As a result, comprehensive road transportation management is essential during crises to ensure the safety and convenience of road users. To achieve effective road network management, a robust database is imperative. The aim of this study is to employ multi-criteria decision analysis with the aid of Geographical Information System (GIS) technology and remote sensing for the optimization of site selection for traffic signals, fire stations, and emergency services in Kafr El-Sheikh city, Egypt. The methodology incorporates two different methods which are Fuzzy Analytical Hierarchy Process (F-AHP) and the spline transformation method. The integration of Fuzzy set theory with AHP principles has given rise to a variant of AHP known as F-AHP. F-AHP combines qualitative and quantitative approaches. Fuzzy logic handles situations that are vague or poorly defined by assigning numerical values. Through the F-AHP approach, criteria that decision-makers unanimously deem “absolutely not important” in comparison to others are eliminated, allowing them to focus on the most significant criteria. As a case study, an Egyptian city was selected to apply these techniques. The results revealed multiple sites that were identified and selected through the applied analytical methods. These selected sites were also marked on the city map and verified in reality.
1 Introduction
The roadway network is the heart of any country’s development. Traffic problems are closely related to human life and are numerous; some of them belong to the road network and the ability to accommodate the daily traffic volume and parking demand [1]. Consequently, the mobility of road users (pedestrians – drivers – passengers) moving from one site to another at an appropriate speed or without exposure to the risks of accidents represents a daily problem in developed countries. In addition, traffic congestion results in consuming the national economy. The optimal use of the available tools and techniques would help manage the efforts and suggest solutions in a crisis.
In Egypt, the central cities suffer from traffic problems such as traffic accidents, congestion, and environmental pollution, especially at peak hours. The crowded cities need emergency transportation and ambulance services, which cannot handle multiple demands simultaneously in those cities. Indeed, it is of paramount importance to ascertain the optimal site selection for road services like fire stations and emergency services, as this decision holds great significance for urban areas. The choice of a suitable location can have a direct impact on reducing response times, optimizing coverage, and minimizing operational costs.
Determining the locations of road services, such as fire stations and emergency services, holds a pivotal role in the planning and administration of urban areas. Optimal site selection can lead to substantial improvements in response times, service coverage, and cost efficiency. To address these challenges, modern technologies like GIS and remote sensing systems are indispensable. They empower planners and administrators to monitor road networks and track the movements of traffic vehicles. GIS, in particular, offers a robust set of capabilities, encompassing data storage, management, analysis, computation, and visualization. It serves as a versatile and powerful tool for efficiently managing and optimizing road services [2,3,4,5].
In addition to GIS, the spline transformation method is employed to accurately map source control points to target control points. While it ensures precision for control points, it may not guarantee the same level of accuracy for pixels located at a distance from these control points. F-AHP is another valuable technique used to establish ratio scales through paired comparisons. This method can incorporate both objective measurements like weight and price, as well as subjective evaluations such as preferences and satisfaction. Notably, research by Lagunzad et al. [6] explored the integration of Global Positioning System (GPS), GIS, and traditional database applications to manage highway networks. Their approach involved the creation of a locational reference system (LRS) that consolidates data related to road and bridge inventories. Another study by Yamada and Thill [7] delved into the application of network autocorrelation analysis, focusing on the analysis of spatial relationships within a transportation network using point data. Various software tools are available, providing statistical methods for cluster analysis [7,8,9].
Road monitoring GIS (RMGIS) plays a crucial role in monitoring road conditions by directly displaying the precise geographical locations of monitored sites, setting it apart from other road monitoring systems. Multiple studies have been conducted to determine the optimal placement of emergency services, emphasizing the significance of geospatial tools and analysis in this process [10,11,12].
The target of this study is to use GIS technology and remote sensing systems for the identification of optimal locations for the placement of new traffic signals, emergency services, and fire stations. A distinctive aspect of this research lies in the application of F-AHP for site selection, offering a comparative analysis with the conventional spline transformation method. This methodological innovation is implemented in the urban context of Kafr El-Sheikh city and serves as a case study in Egypt, a Middle Eastern country. Specifically, the study seeks to assess the efficacy of F-AHP in contrast to the spline transformation method for enhancing the precision of site selection. The outcomes of this research hold the potential to refine response times and bolster public safety, thereby contributing valuable insights for urban planning and infrastructure development. There are several research works, which used several techniques for site selection for different applications [13,14,15].
2 Study area
The chosen city for implementing the proposed technique is Kafr El-Sheikh city, the capital of Kafr El-Sheikh Governorate, Egypt as depicted in Figure 1. Situated on the northern border of Egypt, the city is positioned at approximately 31°6′ 42″ N latitude and 30° 56′ 45″ E longitude. As of the year 2020, it had an estimated population of around 3.6 million, according to data from the Egyptian Central Agency for Public Mobilization and Statistics [15]. Kafr El-Sheikh city boasts a road network comprising both two-lane and multilane roads, with some operating in a single direction and others in dual directions. From visual inspection, the average road width within the city varies between 10 and 20 m. The primary modes of transportation in the city are private cars and public transport. Additionally, the city is equipped with numerous government and private-sector hospitals and dispensaries. However, despite these amenities, Kafr El-Sheikh city grapples with persistent issues of traffic congestion and traffic collisions, particularly during peak hours. As a result, there is a pressing need to identify a lasting solution to address these challenging problems effectively.
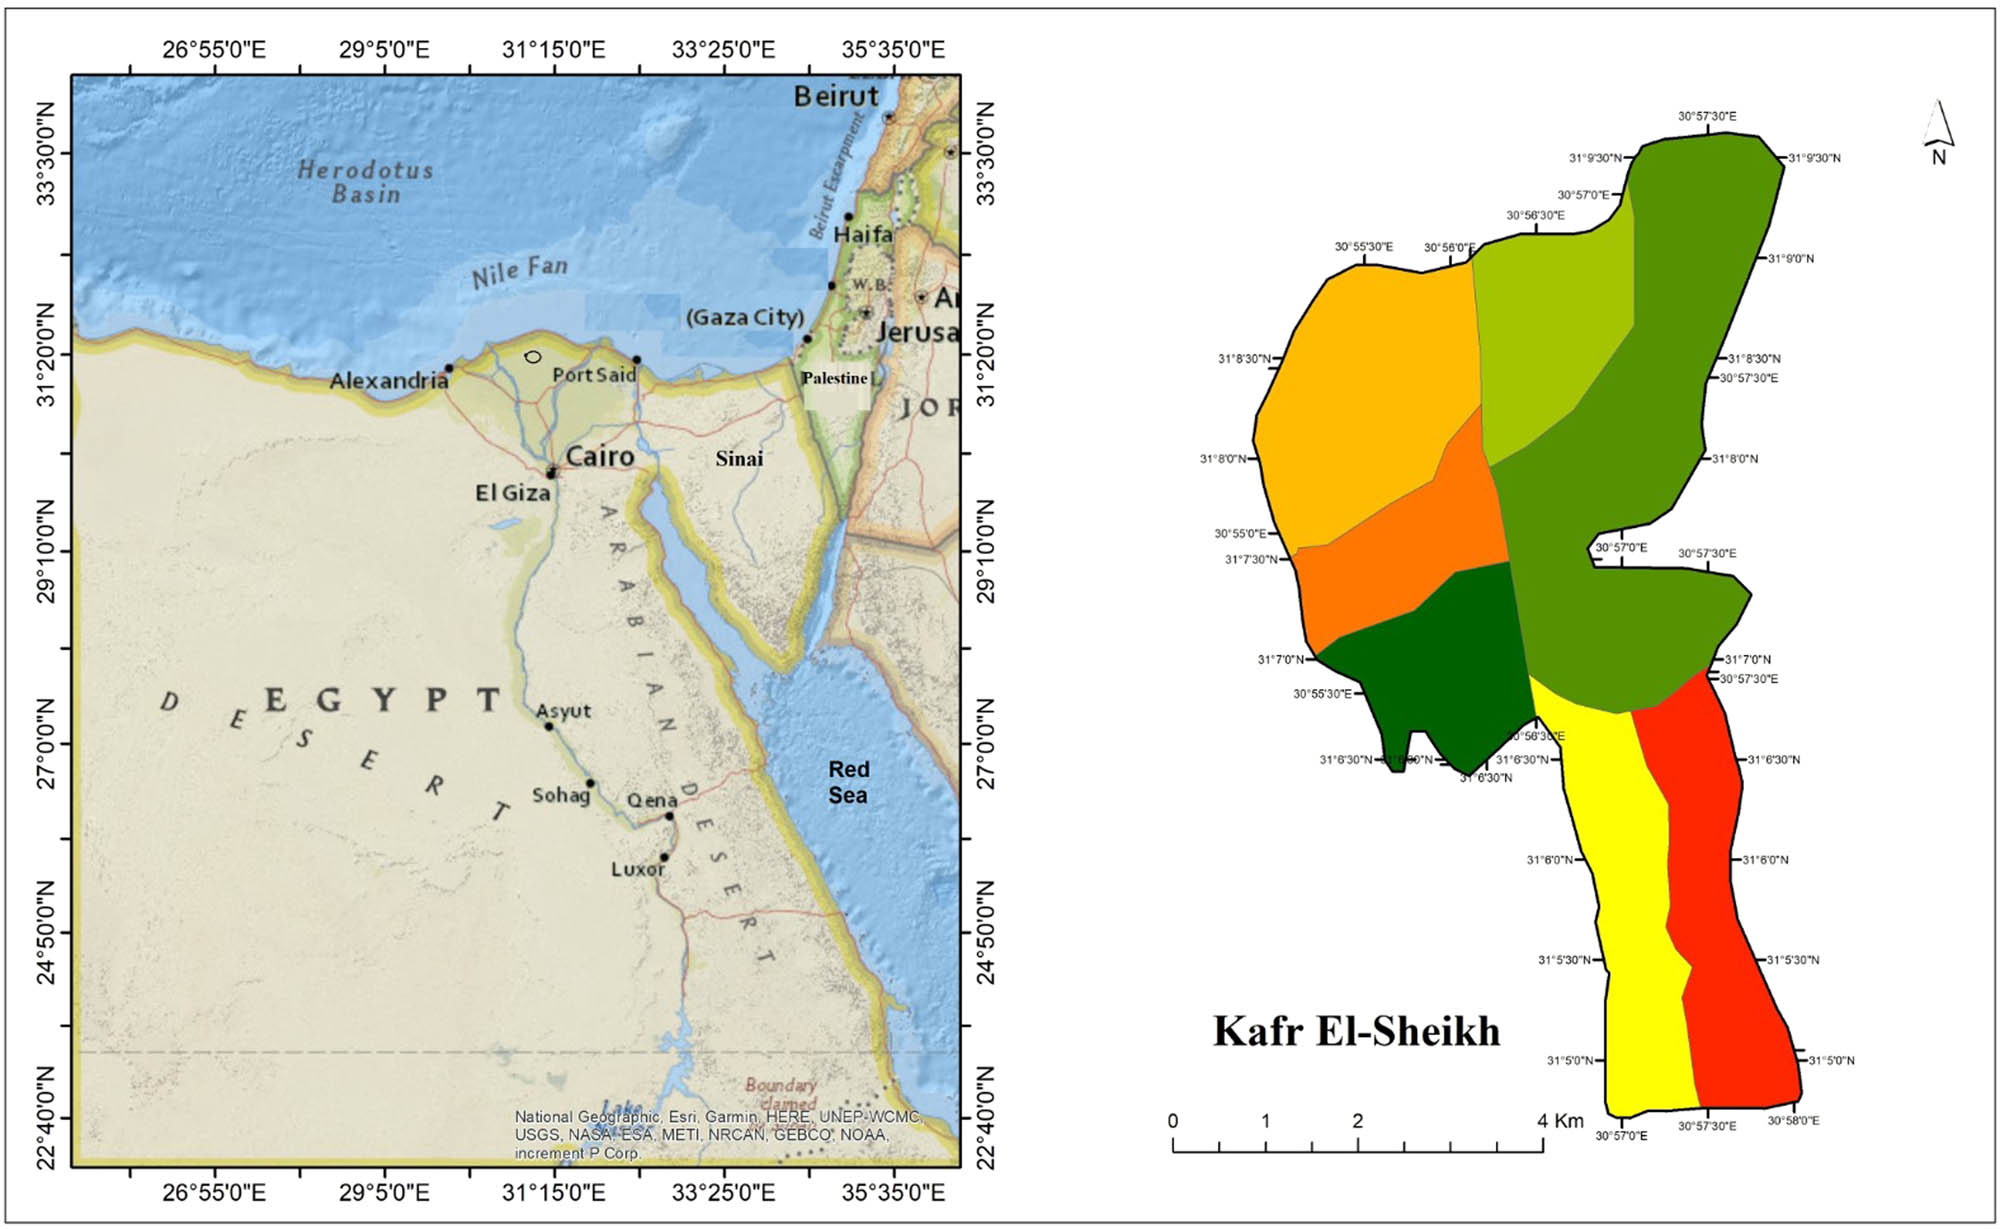
Study area (Kafr El-Sheikh city, Egypt) from Google Earth 2022.
3 Research methodology
In this study, two analytical methods for optimal site selection were employed: F-AHP and the spline transformation method. The study utilized multiple-criteria decision analysis (MCDA) approach based on GIS techniques and remote sensing to determine the ideal sites for new traffic signals, emergency services, and new locations for fire stations within the study area. This approach integrates various criteria and spatial data to make informed decisions about site selection, with a focus on enhancing the management of transportation services and emergency response. To select the optimal locations (site selection) for new emergency services, traffic signals, and fire stations throughout managing road transportation services, Figure 2 shows the methodology employed by GIS tools and MCDA. The details of each step are further discussed here.

Flowchart of research methodology for the management of road transportation services.
4 Input and available data
In the current study, several data sources were utilized to gather essential information. These sources include:
Satellite images sourced from Landsat 8 with a resolution of 30 m. These images were obtained from internet sites, specifically (Source: https://earthexplorer.usgs.gov).
Satellite images specific to the study area obtained from Google Earth, providing a higher resolution of 0.5 m. These images were acquired using the Google Earth program, which is available online.
The official cadastral map of Kafr El-Sheikh city’s urban plan, designed at a scale of 1:5,000. This map included 30 ground control points (GCPs) with known coordinates in the urban area. The GCPs underwent geometric correction by the Kafr El-Sheikh Survey Authority. The RMS of GCPs are few millimeters according to official report.
Geometric properties data for various roads in Kafr El-Sheikh city, comprising information such as road widths, the number of lanes, travel times, and road conditions. These data were collected through field observations and obtained from the Roads Directorate in Kafr El-Sheikh. Traffic-related data for the years 2019 and 2020, encompassing statistics on traffic accidents, traffic volume, and speed limits, were sourced from the Roads Directorate in Kafr El-Sheikh.
5 Image processing and analysis
In processing Google Earth images acquired in 2020 with a spatial resolution of 0.5 m, the following steps were undertaken using ArcGIS 10.3 software.
The initial phase involved identifying image coordinates, specifically the row and column values, for distinct points known as GCPs. These GCPs were subsequently paired with their real-world positions in ground coordinates, encompassing latitude and longitude. Formulation of transformation equations: After identifying a satisfactory number of well-distributed GCP pairs, the process employed ArcGIS 10.3 software to establish transformation equations. These equations served to establish the relationship between image coordinates (row and column) and their corresponding new ground coordinates. Mapping coordinates: Subsequently, the transformation equations were applied to the image coordinates, facilitating the mapping of these points to their newly determined ground coordinates. The transformation parameters between image coordinates and GCPs are determined using least square techniques and the accuracy did not exceed few millimeters. This systematic approach ensured the precise georeferencing of the image data. In addition to geographic coordinates, geometric registration can also be performed by aligning one image (or more) to another image. This technique, known as image-to-image registration, was frequently employed prior to various image transformation procedures. The hardcopy map underwent geo-referencing through the utilization of 20 known coordinate GCPs, with their values established using ArcGIS 10.3 software. The additional points served as checkpoints to assess and validate the precision of the geo-referencing procedure. Subsequently, the study area boundaries were digitized and transformed from ArcGIS shape file format to Google Earth format, ensuring seamless compatibility and integration with the georeferenced data.
6 Applied analytical techniques for the study
Two analytical techniques were used in this research to determine the optimal location for the traffic signals, fire stations, and emergency services as follows.
6.1 Fuzzy analytical hierarchy process (Fuzzy-AHP)
F-AHP is a methodology that extends the traditional AHP by integrating principles from fuzzy logic theory. Although the steps of the F-AHP method resemble those of the traditional AHP, it introduces a distinctive feature by transforming the AHP scale into a fuzzy triangular scale for priority assessment [14,16,17]. This adaptation of AHP has gained considerable attention, especially in the field of risk management and various other domains, owing to its capacity to provide more adaptable scales using fuzzy membership functions [18].
The primary rationale behind adopting this innovative approach is to address the limitations of traditional AHP when dealing with uncertainty. Traditional AHP necessitates decision-makers to select a value from a fixed, predetermined scale, often ranging from 1 to 9. However, decision-makers frequently require greater flexibility to accommodate uncertainty. F-AHP achieves this by incorporating fuzzy membership functions and linguistic variables like “good” or “poor,” instead of relying solely on precise numerical values. This pioneering method has found applications across various sectors, including the construction industry, where its adaptable approach to decision-making in the presence of uncertainty proves to be advantageous and valuable.
Overall, the text effectively argues for the value of F-AHP in overcoming the limitations of traditional AHP when addressing uncertainty in decision-making contexts. While potential limitations exist, F-AHP offers a powerful and adaptable tool for tackling complex problems in various fields.
6.1.1 Pairwise comparison matrix formation
The F-AHP method is widely regarded as a robust mathematical tool for analyzing intricate decision-making problems [19–21]. It operates by establishing the weights of different criteria by means of pairwise comparisons, where decision-makers assess the relative importance of each criterion in relation to others. This process is captured in a pairwise comparison matrix, which forms the foundation for determining the overall priorities and preferences within the decision-making framework.
6.1.2 Calculation of criterion weights
The calculation of criterion weights in the FAHP method is carried out once the pairwise comparison matrix has been established. Here is how the process unfolds:
Normalization: Initially, the sum of all values in each column of the pairwise comparison matrix is determined. This step helps ensure that the comparisons are balanced and consistent. Each element in the matrix is then divided by the total sum of its respective column. The resulting matrix is referred to as the “normalized pairwise comparison matrix.”
Average row scores: Subsequently, the next step involves computing the average of the elements in each row of the normalized matrix. To do this, the sum of the normalized scores in each row is divided by the total number of criteria. These row averages serve as a preliminary estimation of the relative weights of the criteria being considered [22].
By following these steps, the F-AHP method establishes a quantitative basis for evaluating the importance and significance of each criterion within the decision-making process. These criterion weights are instrumental in making informed and prioritized decisions [23,24].
6.1.3 Estimation of the consistency ratio
The F-AHP method explicitly addresses consistency when conducting pairwise comparisons, involving the following operations [25,26]:
Calculation of weighted sum vector: Initially, the weighted sum vector is computed by multiplying the matrix of pairwise comparisons on the right by the vector of priorities. This results in a new column vector. Then, each element in this new column vector is divided by its corresponding element in the priorities vector. Finally, these values are summed across all rows.
Calculation of consistency vector: The consistency vector is derived by dividing the weighted sum vector by the criterion weights. This step ensures that the comparisons remain consistent with the relative importance of the criteria.
Computation of lambda (λ) and consistency index (CI): Once the consistency vector is obtained, the next step is to calculate two additional terms: lambda (λ) and the CI. Lambda (λ) is determined as the average value of the elements in the consistency vector.
Calculation of CI: The calculation of the CI is based on the observation that λ for a positive and consistent pairwise comparison matrix is always greater than or equal to the number of criteria under consideration (n). Therefore, the difference between λ and n, denoted as (λ–n), can be regarded as a measure of inconsistency. The CI measure can be normalized using a specific equation [27,28].
The term CI is used to quantify the level of deviation from consistency in the AHP. To evaluate the significance of CI, AHP compares it to a reference value called the random index (RI). The result of this comparison is known as the consistency ratio (CR), and it is defined as follows:
The RI represents the consistency index of a pairwise comparison matrix that has been randomly generated and typically ranges from order 1 to 10. This value is obtained by approximating random indices for different matrix sizes. To calculate the CI, equation (1) can be used. Equation (2) can be applied to calculate the CR: CR < 0.10, then weights are acceptable.
GIS and MCDA were applied to determine the best sites for emergency services after entering the weights into the ArcGIS 10.3 program. MCDA is used to calculate the relative weights of individual evaluation criteria [29,30]. The used criteria informing matrix was applied according to Table 1.
Degree of importance assigned to the used criteria
| Intensity of significance | Description | Classification of suitability |
|---|---|---|
| 1 | Same importance | Lowest suitability |
| 2 | Same to moderate importance | Very low suitability |
| 3 | Moderate importance | Low suitability |
| 4 | Moderate to strong importance | Moderately low suitability |
| 5 | Strong importance | Moderate suitability |
| 6 | Strong to very strong importance | Moderately high suitability |
| 7 | Very strong importance | High suitability |
| 8 | Very strong to extremely strong importance | Very high suitability |
| 9 | Extreme importance | Highest suitability |
6.2 Spline transformation method
The spline transformation method is a precise technique for transforming source control points to target control points. It is particularly valuable when it is essential to achieve precise registration of critical control points. To carry out the spline transformation, a minimum of 10 control points is necessary, as established by previous literature [25–27]. Increasing the number of control points beyond this minimum can enhance the overall accuracy of the spline transformation. The method typically involves three main steps.
6.2.1 Defining and formulating criteria for evaluating the land
Many criteria have been adopted in the planning process through the layers and available databases provided by the GIS system. The system determines the optimum sites for fire stations [31,32], traffic signals, and emergency services [33–35]. Each criterion will be assigned a specific rank according to its importance. The criteria that will be included in the comparison process can be summarized as follows and shown in Figure 3
Elevation: It is a layer of the Raster grid type, representing the land heights in the investigated city.
The land use layer, a layer of the Raster grid type, represents the description of the study area.
Roads layer: includes the road network in the investigated city.
Layer with traffic jams in Kafr El-Sheikh.
Layer of hospital and fire station locations in the city, study area, and existing government institutions, as well as banks, schools, and service areas.
Layer for the areas with the most accidents.


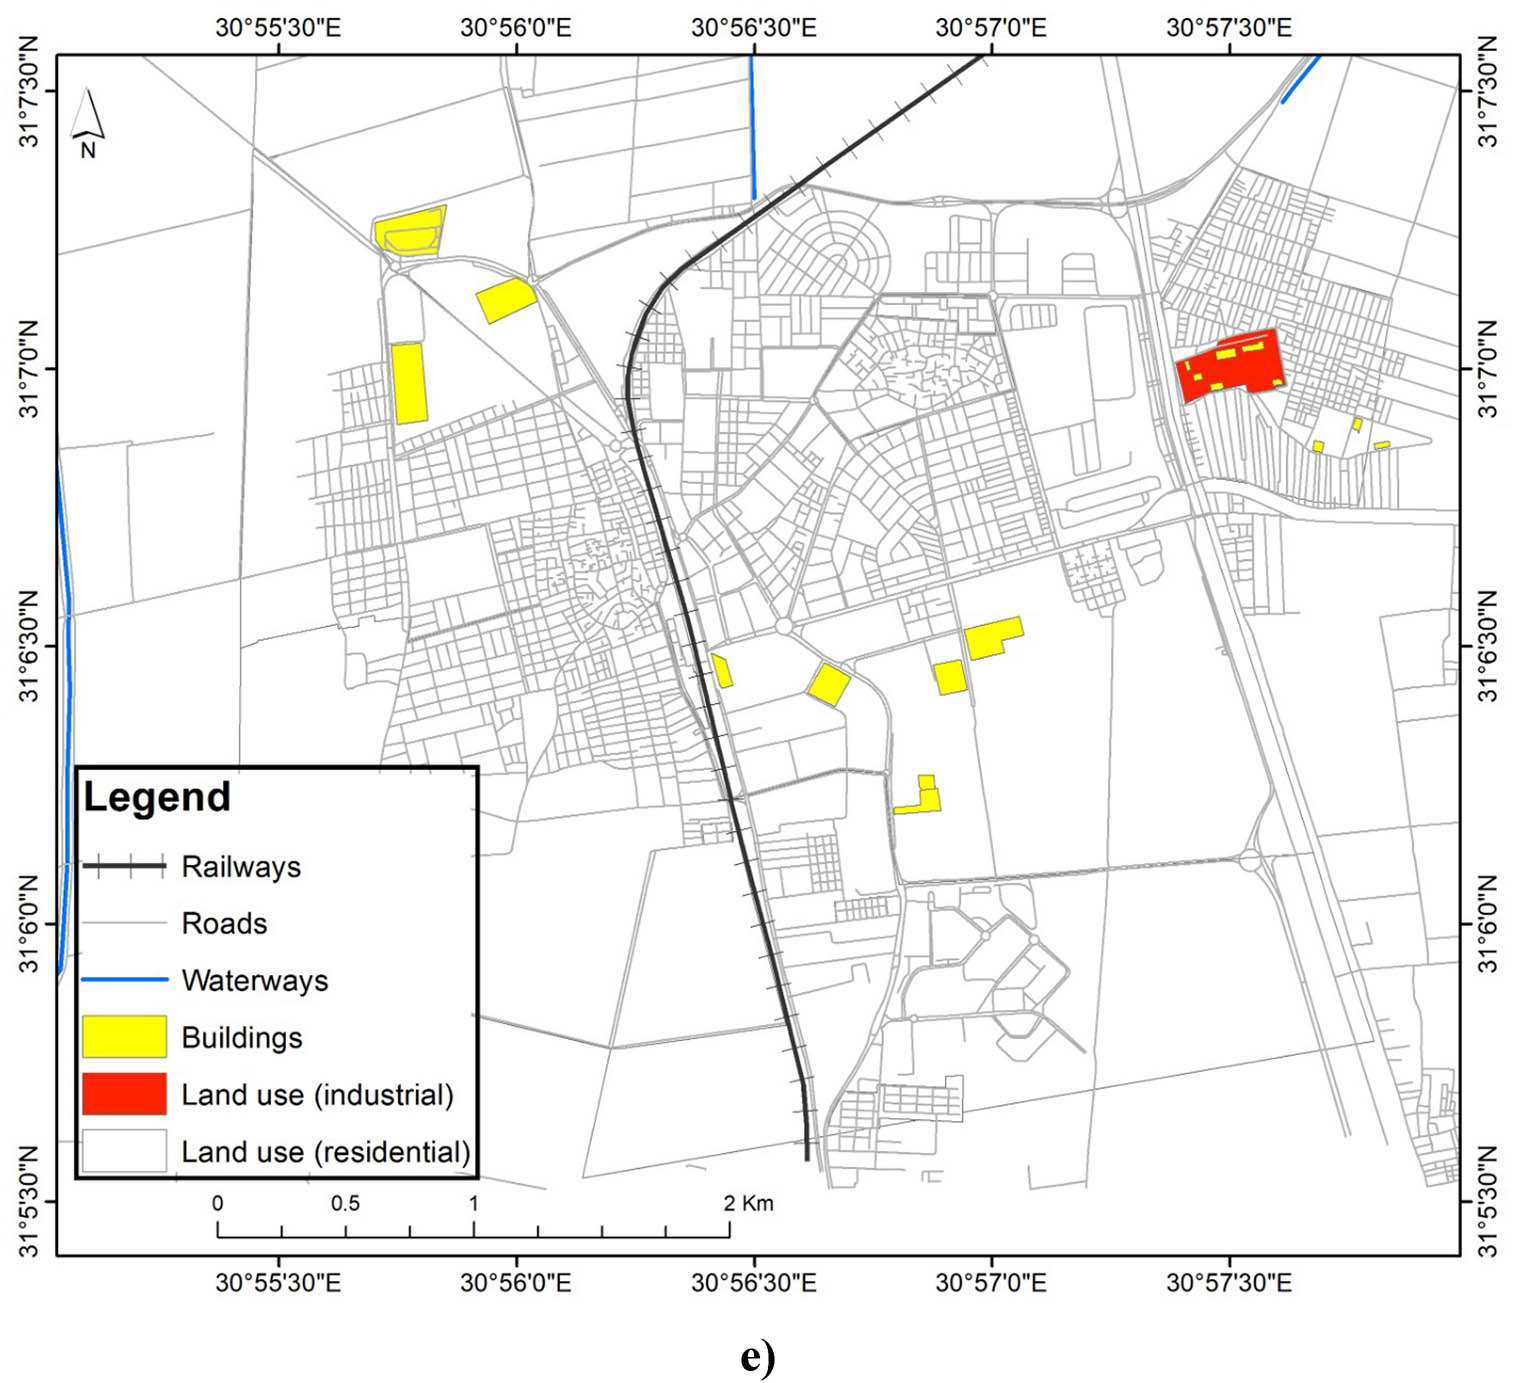
Land use maps for the study area. (a) Feature class for roads. (b) Directions for roads. (c) Road networks in Kafr El-Sheikh City. (d) Area errors for roads. (e) Roads in Kafr El-Sheikh city.
6.2.2 Dealing with criteria by using analysis of spatial functions
The methodology used in planning the optimum sites depends on statistical analysis to process the data types (Vector and Raster), which include:
Tools management data: It was used to find emergency services that were established before the new planning and to take a certain distance from them.
The buffer zone: This tool has been used to exclude areas near other aid centers.
Rasterization: The modeling processes make it easy to work with data in grid mode, so all vector maps are converted to a Raster grid.
Reclassification: Use this step to rearrange and distribute cells. This makes it easier to deal with, so the criteria are classified, with the most suitable cells receiving a rank of 10 and the least suitable receiving a rank of 1 on the common scale.
Overlay weighted criteria tool: GIS tools have been provided with the flexibility to give the influencing criteria greater weight than the rest. From this standpoint, the study resorted to using the weighted values by giving the influencing elements greater than the other elements.
7 Site analysis and applied criteria for the case study
Site analysis work was completed to manage the geographically established resources available to the study site, analyze the information available for the site, and show the potential obstacles to the development of the site under investigation. As a result, when analyzing any site, computer techniques can be used to prepare data and studies in digital form, which contributes to the development of a digital information system for site studies and analysis, resulting in increased efficiency of the site analysis process and the generation of accurate, correct, and spatially referenced results. Consequently, each criterion was analyzed separately. An appropriate map was produced for it by giving each cell or group of cells in the stratum an appropriate degree according to its importance or sensitivity to determine the optimum sites. Where two methods were used, where the appropriate areas for establishing the optimum sites were given number 6 and the inappropriate areas number 1, this was applied to road layers, residential communities, traffic congestion, and the rest of the other layers. However, the second method was given in the stratum and arranged according to its importance. The appropriate areas took the number 6 and the least appropriate 5, then 4, and so on until it reached number 1, which is the least appropriate for the establishment of service sites
The criteria used to determine the optimal site selection for emergency services, fire stations, and traffic signals were established based on a combination of available previous studies and the guidelines set forth by the Egyptian Ministry of Housing. These criteria play a crucial role in the decision-making process, helping identify the best locations for these essential services. While the specific criteria are not listed in your message, Table 2 is likely to provide a detailed breakdown of these criteria and their associated attributes. These criteria may encompass factors such as population density, response time, and proximity to critical infrastructure, traffic patterns, and more, with each criterion contributing to the overall assessment of optimal site selection.
Applied criteria for emergency services, fire stations, and traffic signals
| Criteria | Description |
|---|---|
| Buildings | Existing buildings |
| Land uses | City landmarks such as schools and petrol stations |
| Road | Roads, whether main or secondary roads within the city |
| Railways | City railways |
| Waterways | The city’s waterways, canals, and drains |
| Heavy traffic | City heavy transport vehicles |
| Hospitals | Hospitals, medical centers, dispensaries, and health units in the city |
| Ambulances | Ambulance centers currently exist and are located in the city |
| Fire fighter | Fire stations in the city |
| Highway roads | City highways roads |
| Crossroads | City intersections |
8 Results and analysis
The cartographic model was constructed within the ArcGIS software using the Builder Model tool. This approach is rooted in the concept of simplifying intricate problems, dealing with overlapping data, and considering their spatial and descriptive connections. Prior to creating the model, the following steps were undertaken: establishing criteria, defining their categories, determining the degree of their importance, and assigning weights to these criteria. Subsequently, the model was developed to break down the primary problem into smaller, more manageable sub-problems. This strategy relies on spatial analysis techniques and leverages the capabilities of the software to formulate a step-by-step approach for problem-solving, ensuring that it fully addresses the spatial and analytical aspects of the task at hand.
8.1 F-AHP method
Tables 3 and 4 play a significant role in the decision-making process by providing a structured approach to evaluate and prioritize criteria for optimal site selection. Table 3 presents a pairwise comparison matrix for emergency services, traffic signals, and fire stations. The matrix includes hypothetical numbers that represent the relative importance of each criterion. These numbers are assigned on a numerical scale where “extremely important” is denoted by number 6 and the least important criterion is assigned number 5, with the scale descending in decreasing order of importance.
Pairwise comparison matrix for the determination of new sites
| Criteria | Buildings | Land uses | Road | Railway | Waterways | Heavy traffic | Ambulances | Hospitals |
|---|---|---|---|---|---|---|---|---|
| Emergency services | ||||||||
| Buildings | 1 | 0.3 | 0.11 | 0.3 | 0.3 | 0.2 | 0.3 | 0.5 |
| Land uses | 3 | 1 | 0.11 | 0.2 | 0.3 | 0.1 | 0.3 | 0.5 |
| Road | 9 | 9 | 1 | 0.3 | 0.5 | 0.3 | 0.5 | 0.3 |
| Railway | 3 | 5 | 3 | 1 | 0.3 | 0.5 | 0.2 | 0.5 |
| Waterways | 3 | 3 | 2 | 3 | 1 | 0.3 | 0.5 | 0.5 |
| Heavy traffic | 5 | 7 | 3 | 2 | 3 | 1 | 0.2 | 0.3 |
| Ambulances | 3 | 3 | 2 | 5 | 2 | 5 | 1 | 0.5 |
| Hospitals | 2 | 2 | 3 | 2 | 2 | 3 | 2 | 1 |
| Criteria | Road | High way | Landmark | Cross section | Heavy traffic |
|---|---|---|---|---|---|
| Traffic signal | |||||
| Road | 1 | 0.2 | 0.2 | 0.2 | 0.2 |
| High way | 5 | 1 | 0.3 | 0.2 | 0.14 |
| Landmark | 5 | 3 | 1 | 0.3 | 0.14 |
| Cross section | 5 | 5 | 3 | 1 | 0.16 |
| Heavy traffic | 5 | 7 | 7 | 6 | 1 |
| Criteria | Fire fighter | Landmark | Buildings | Land use | Road | Railway | Waterways | Heavy traffic |
|---|---|---|---|---|---|---|---|---|
| Fire stations | ||||||||
| Fire fighter | 1 | 0.2 | 0.3 | 0.3 | 0.2 | 0.2 | 0.5 | 0.2 |
| Landmarks | 5 | 1 | 0.3 | 0.5 | 0.2 | 0.3 | 0.5 | 0.2 |
| Buildings | 3 | 3 | 1 | 0.5 | 0.3 | 0.2 | 0.3 | 0.2 |
| Land uses | 3 | 2 | 2 | 1 | 0.3 | 0.5 | 0.3 | 0.11 |
| Road | 5 | 5 | 3 | 3 | 1 | 0.2 | 0.2 | 0.3 |
| Railway | 5 | 3 | 5 | 2 | 5 | 1 | 0.5 | 0.3 |
| Waterways | 2 | 2 | 3 | 3 | 5 | 2 | 1 | 0.5 |
| Heavy traffic | 5 | 5 | 5 | 9 | 3 | 3 | 2 | 1 |
Final resulting weights of applied criteria using F-AHP for emergency services, traffic signals, and fire stations
| Criteria | Emergency services | Traffic signals | Fire stations |
|---|---|---|---|
| Buildings | 0.04 | 0.06 | |
| Land uses | 0.05 | 0.07 | |
| Road | 0.14 | 0.04 | 0.12 |
| Railway | 0.10 | 0.17 | |
| Waterways | 0.11 | 0.18 | |
| Heavy traffic | 0.16 | 0.53 | 0.31 |
| Ambulances | 0.21 | ||
| Hospitals | 0.20 | ||
| Highway | 0.09 | ||
| Landmark | 0.13 | 0.06 | |
| Cross section | 0.2 | ||
| Fire fighter | 0.03 |
Table 4 displays the final weights of the criteria applied using F-AHP method. These weights represent a quantitative measure of the relative importance of each criterion specifically for the studied city. The resulting weights allow decision-makers to prioritize and make informed decisions based on the significance of each criterion within the context of the site selection process. In essence, these tables provide a structured framework for assessing and ranking the criteria based on their importance, helping guide the selection of optimal sites for emergency services, traffic signals, and fire stations in the studied city.
Weights were entered using the F-AHP method on the model builder on the ArcGIS program. The maps in Figure 6 show the optimal sites for emergency service, traffic signals, and fire stations, where the purple number 6 indicates the optimal sites for establishing new services, the number 5, with the mauve color, indicates the least suitable sites for establishing new emergency services.
The system determines the nearest emergency center to eliminate a problem when reporting on the accident site by determining the shortest and fastest path to reach it, and finally it is drawn on the map to facilitate tracking and arrival in a timely manner and providing the service quickly. If there is an accident, the shortest path is calculated in terms of time to reach the nearest hospital or ambulance to that center, and it is drawn on the map, and so on in any other type of accident.
The first model of the analysis shows how to calculate the shortest path between the Kafr El-Sheikh parking lot and the Armed Forces Hospital and the shortest time it takes to get from the parking lot to the hospital. This example is considered the general case for finding the shortest path, where the starting and ending point is determined, and the system calculates the shortest path, using the specified speed for each part of the road according to the type of road, whether it is a highway, secondary, or other road, and the length of the road to calculate the time taken to cross the road. Then, the most appropriate path, i.e., the lowest, is chosen to cut the distance between the parking lot and the hospital, as shown in Figure 4.

The short and quick path from main barking to armed forces hospital.
The second model assumed that an accident occurred in a certain area in the city of Kafr El-Sheikh, as shown in Figure 5. Using the system, the location of the accident is determined and displayed on the map, and then the nearest ambulance is determined. And the most appropriate path for the ambulance to take is determined to reach the site of the accident in the shortest time, by studying the speed tables for the roads used, as well as avoiding areas with traffic congestion and reducing risk (Figure 6).

The closest ambulance to a specific accident site and the best way to get to it and move to the hospital.


Optimal sites selection for emergency services, traffic signals, and fire stations based on the F-AHP method. (a) Emergency services. (b) Traffic signals. (c) Fire stations.
The common scale is based on values from 6 to 1, with 6 being the highest degree deemed suitable for ideal sites and 1 being the lowest degree deemed suitable for site selection.
8.2 Spline transformation method
Based on previous research and following the standards of the Egyptian Ministry of Housing, the weights assigned to the applied criteria have been determined as follows:
Traffic congestion: 20%
Emergency services located in the city: 20%
Hospitals: 10%
Roads: 15%
Residential compounds: 15%
Railways: 5%
Schools and service areas: 15%
After inputting these weights into the model using the spline transformation method within the Model Builder of the ArcGIS program, a resulting digital map is generated. This map displays the new optimal sites, where number 6 represents the most optimal sites, and number 5 represents the least important sites, as depicted in Figure 7. It is important to note that the areas represented by different colors or classifications in Figure 7 can be analyzed and interpreted using the functionalities of the ArcGIS program. This map provides valuable insights for decision-makers regarding the optimal locations for emergency services in the studied city based on the weighted criteria and the spline transformation method.


Optimal sites selection for emergency services, traffic signals, and fire stations based on the spline transformation method. (a) Emergency services. (b) Traffic signals. (c) Fire stations.
8.3 Comparison between the two analytic methods for emergency services
Table 5 and Figure 5 provide a breakdown of the areas resulted from the spline method and F-AHP method for three different services: Emergency service, traffic signals, and fire stations. It can be observed that the distribution of areas for individual sites differs between the spline and F-AHP methods. For emergency service, site 2 has a substantial increase in area when using the F-AHP method. However, for fire station, sites 3 and 4 have notable increases in area when using the F-AHP method, suggesting different site preferences compared to the spline method. The difference between the areas resulting from the two analytic methods is approximately 2–7%. In the F-AHP model, the correlation between applied criteria was considered in optimal site selection. Therefore, this method is better than the spline transformation method. In general, the F-AHP method seems to allocate larger areas to certain sites compared to the spline method in all three services. Differences in percentage distribution between the two methods indicate variations in site prioritization or selection criteria. It is important to consider the specific factors and criteria that led to these results (Figure 8).
Comparison between the estimated areas from F-AHP and spline method analysis
| Area number | Area resulted from F-AHP method (m2) | Percentage | Area resulted from spline method (m2) | Percentage |
|---|---|---|---|---|
| Emergency service | ||||
| 1 | 129,165 | 1 | 69,701 | 1 |
| 2 | 1,358,338 | 10 | 506,646 | 4 |
| 3 | 3,061,977 | 24 | 2,786,867 | 22 |
| 4 | 4,097,574 | 32 | 5,083,484 | 39 |
| 5 | 3,704,264 | 29 | 3,055,805 | 23 |
| 6 | 516,949 | 4 | 1,365,764 | 11 |
| Sum | 12,868,267 | 100 | 12,868,267 | 100 |
| Traffic signals | ||||
| 1 | 130,605 | 3 | 111,064 | 2 |
| 2 | 783,580 | 10 | 357,519 | 5 |
| 3 | 1,510,546 | 20 | 1,355,740 | 18 |
| 4 | 1,603,897 | 21 | 1,984,253 | 26 |
| 5 | 553,916 | 7 | 1,769,253 | 23 |
| 6 | 2,965,280 | 39 | 1,972,916 | 26 |
| Sum | 7,547,824 | 100 | 7,550,745 | 100 |
| Fire stations | ||||
| 1 | 99,121 | 1 | 9,546 | 1 |
| 2 | 593,561 | 7 | 625,221 | 5 |
| 3 | 2,988,553 | 28 | 2,142,076 | 17 |
| 4 | 4,737,209 | 36 | 4,498,637 | 34 |
| 5 | 2,008,500 | 16 | 3,817,662 | 29 |
| 6 | 914,147 | 12 | 1,777,869 | 14 |
| Sum | 11,341,091 | 100 | 12,871,011 | 100 |

Comparison of the estimated areas for emergency services, traffic signals, and fire station sites using F-AHP and spline techniques. (a) Emergency services. (b) Traffic signals. (c) Fire stations.
9 Validation of optimal sites
The validation of the results for the selection of the four optimal sites for each service involves a comprehensive process. The identification of these new sites is visualized on the Google Earth city map, as depicted in Figure 9. A meticulous visual examination is undertaken to confirm the selected sites in a real-world context and to ensure the absence of existing buildings. Subsequently, a field visit to the specified sites, as extracted from the preceding results, validates their excellent location suitability for the intended purposes. The findings affirm that the predetermined goals are successfully achieved through this site selection process.


Validation of results from optimal site selection for new emergency services, traffic signals, and fire stations on Kafr El-Sheikh City on Google Earth map and visual examination. (a) Emergency services: Optimal site selection for emergency services on Kafr El-Sheikh city on Google Earth map. Validation of resulted site selection for emergency service through visual examination. (b) Traffic signals: Optimal site selection for traffic signals on Kafr El-Sheikh city on Google Earth map. Validation of resulted site selection for traffic signals through visual examination. (c) Fire stations: Optimal site selection of fire stations on Kafr El-Sheikh city on Google Earth map. Validation of resulted site selection for fire stations through visual examination.
10 Conclusion
In summary, the effective management of road transportation is paramount in addressing the complex challenges arising from population growth, transportation congestion, and the impact of external factors such as the development of the corona virus. This study leverages GIS Network Analyst, incorporating remote sensing data, to analyze and propose solutions for road-related issues in Kafr El-Sheikh city, Egypt. Based on the obtained results, the following key conclusions can be drawn:
The combination of GIS techniques and MCDA employing F-AHP proves to be highly effective in identifying optimal new sites for constructing traffic signals, emergency services, and fire stations within residential cities.
Kafr El-Sheikh city stands to benefit from the establishment of four new traffic signal sites at specified locations outlined in the study. This strategic placement aims to mitigate accidents, alleviate traffic congestion – particularly during peak hours – and minimize delays in travel time.
The study recommends the establishment of four new emergency service sites at resulted identified locations to expedite the transportation of patients to hospitals efficiently. Additionally, four new fire station sites are deemed essential, strategically positioned as indicated in this research. The comparison between the F-AHP and spline transformation methods reveals a close alignment in the location and area of resulting new sites for traffic signals, fire stations, and emergency services. The differences in site areas range from 2 to 12% across all studied cases.
Satellite imaging emerges as a crucial and useful tool for detecting changes in both urban and rural areas, underscoring its importance in the context of this study.
The outcomes of this research empower decision-makers in the study area with comprehensive data to expedite problem-solving efforts. The identified and verified sites, validated through ground-trothing, serve as a robust foundation for optimizing site selection for emergency services. Ultimately, this approach facilitates timely and efficient decision-making, addressing current and future challenges related to the establishment of fire stations and traffic signals in the study area.
The study provides valuable insights for urban planners, enabling them to optimize the placement of critical infrastructure such as traffic signals, fire stations, and emergency services. This can contribute to more efficient city planning and improved public safety.
Decision-makers can use the identified optimal sites to allocate resources more effectively, ensuring that emergency services are strategically positioned to minimize response times and enhance overall service delivery.
The establishment of new traffic signal sites at recommended locations holds the potential to significantly reduce accidents and alleviate traffic congestion, positively impacting overall transportation efficiency.
Acknowledgement
The authors extend their sincere thanks to their dear colleague Dr. Abd El Halim Azzam, Associate professor at Public Works Engineering Department, Faculty of Engineering, Mansoura University, Egypt for the effort he made in collecting the data necessary for the research.
-
Funding information: Funding information is not applicable/no funding was received.
-
Author contributions: The basic theme and the methodology of the research were discussed and decided by all authors. The manuscript was written by Ashraf A. A. Beshr, and Azza S. Ismail; review and editing were done by all authors; introduction, characterization of the facility, case study, research methodology, results, and discussion, and conclusions were completed by all authors; All authors have read and agreed to the published version of the manuscript.
-
Conflict of interest: The authors state that there is no conflict of interest.
-
Data availability statement: The submitted work contains all data, models, and code generated or used during the study.
References
[1] Johnson BH, Demetsky MJ. Geographic information system environment for transportation management systems. Transportation Research Record. 1994;(1429):67–73.Search in Google Scholar
[2] Ashu N, Tapan A, Chandan G, Bijoy KH. Site suitability analysis for turmeric in Jaintia Hills of Meghalaya, India, using analytical hierarchical process and weighted overlay analysis. A comparative approach. 2020;118(8):1246–54.Search in Google Scholar
[3] Erdal A, Mutlu A, Ali K, Suat T, Ali A. Environmental urbanization assessment using GIS and multicriteria decision analysis: A case study for Denizli (Turkey) municipal area. Adv Civ Eng. 2018;2018:7. Article ID 6915938.Search in Google Scholar
[4] Machiwal D, Jha MK, Mal BC. Assessment of groundwater potential in a semi-arid region of India using remote sensing, GIS and MCDM techniques. Water Resour Manag. 2011;25(5):1359–86.Search in Google Scholar
[5] Ulutaş A, Karakuş CB. Location selection for a textile manufacturing facility with GIS based on hybrid MCDM approach. Industriatextila. 2021;72(2):126–32.Search in Google Scholar
[6] Lagunzad V, Mcpherson K, Manila M, Area P. GIS applications for road network of the Philippines: A new technology in road management. J East Asia Soc Transp Stud. 2003;5:846–54.Search in Google Scholar
[7] Yamada I, Thill JC. Comparison of planar and network K-functions in traffic accident analysis. J Transp Geogr. 2004;12(2):149–58. 10.1016/j.jtrangeo.2003.10.006.Search in Google Scholar
[8] Hovenden E, Sliogeris J, Walker C. Roads spatial information system: The Victorian experience. Road Transp Res. 1995;4(1):110–8.Search in Google Scholar
[9] Kansara S, Modgil S, Kumar R. Structural transformation of fuzzy analytical hierarchy process: A relevant case for Covid-19. Oper Manag Res. 2023;16(1):450–65.Search in Google Scholar
[10] Suzuki T, Satoh E. An analysis on the optimum location of fire department based on ambulance dispatch situation—A case study in Utsunomiya City. Jpn Archit Rev. 2020;3(2):241–55. 10.1002/2475-8876.12144.Search in Google Scholar
[11] Rajani RL, Heggde GS, Kumar R, Bangwal D. Demand management approaches in services sector and influence on company performance. Int J Product Perform Manag. 2023;72(10):2808–37.Search in Google Scholar
[12] Bolouri S, Vafaeinejad A, Alesheikh A, Aghamohammadi H. The ordered capacitated multi-objective location-allocation problem for fire stations using spatial optimization. Int J Geo-Inf. 2018;7:44. 10.3390/ijgi7020044.Search in Google Scholar
[13] Pourahmad A, Hosseini A, Banaitis A, Nasiri H, Banaitienė N, Tzeng GH. Combination of fuzzy-AHP and DEMATEL-ANP with GIS in a new hybrid MCDM model used for the selection of the best space for leisure in a blighted urban site. Technol Econ Dev Econ. 2015;21(5):773–96.Search in Google Scholar
[14] Ismaeel WS, Elsayed MA. Sustainable sites in two generations of city development using GIS-MCDM and LEED LT and S.S. categories. J Clean Prod. 2022;330:129782.Search in Google Scholar
[15] Kabak M, Erbaş M, Cetinkaya C, Özceylan E. A GIS-based MCDM approach for the evaluation of bike-share stations. J Clean Prod. 2018;201:49–60.Search in Google Scholar
[16] https://ar.wikipedia.org.Search in Google Scholar
[17] Karatop B, Taşkan B, Adar E, Kubat C. Decision analysis related to the renewable energy investments in Turkey based on a Fuzzy AHP-EDAS-Fuzzy FMEA approach. Computers Ind Eng. 2021;151:106958. 10.1016/j.cie.2020.106958.Search in Google Scholar
[18] Khazaeni G, Khanzadi M, Afshar A. Fuzzy adaptive decision making model for selection balanced risk allocation. Int J Proj Manag. 2012;30(4):511–22.Search in Google Scholar
[19] Bennani M, Jawab F, Hani Y, ElMhamedi A, Amegouz D. A Hybrid MCDM for the location of urban distribution centers under uncertainty: A case study of Casablanca, Morocco. Sustainability. 2022;14(15):9544.Search in Google Scholar
[20] Lawal DU, Matori AN, Balogun AL. A geographic information system and multicriteria decision analysis in proposing new recreational park sites in Universiti Teknologi Malaysia. Mod Appl Sci. 2011;5(3):39. 10.5539/mas.v5n3p39.Search in Google Scholar
[21] Alzamili HH, El-Mewafi M, Beshr AA, Awad A. GIS based multi criteria dicesion analysis for industrial site selection in Al-Nasiriyah City in Iraq. Int J Sci Eng Res. 2015;6(7):1330–7. 10.13140/RG.2.1.4883.2480Search in Google Scholar
[22] Nazeri Z, Mirzaee J, Rostami A. Application of analytical hierarchy process in land suitability for forest park location (case study: Ilam county, Iran). J Biodivers Env Sci. 2014;4:301–9.Search in Google Scholar
[23] Onuigbo IC, Orisakwe KU. Applications of geographic information system and remote sensing in road monitoring in Minna and environs, Nigeria. IOSR J Environ Sci Toxicol Food Technol. 2013;4:301–9. 10.9790/2402-0360105.Search in Google Scholar
[24] Bangwal D, Kumar R, Suyal J, Ghouri AM. Does AI-technology-based indoor environmental quality impact occupants’ psychological, physiological health, and productivity? Ann Oper Res. 2023;1–19.Search in Google Scholar
[25] Ahmadi H, Pekkan E. “Fault-based geological lineaments extraction using remote sensing and GIS” A review. Geosciences. 2021;11(5):183. 10.3390/geosciences11050183.Search in Google Scholar
[26] Baby S. AHP modeling for multicriteria decision-making and to optimise strategies for protecting coastal landscape resources. Int J Innov Manag Technol. 2013;4(2):218. 10.7763/IJIMT.2013.V4.395.Search in Google Scholar
[27] Colak HE, Memisoglu T, Gercek Y. Optimal site selection for solar photovoltaic (P.V.) power plants using GIS and AHP: A case study of Malatya Province, Turkey. Renew Energy. 2020;149:565–76. 10.1016/j.renene.2019.12.078.Search in Google Scholar
[28] Eldrandaly KA. Exploring multicriteria decision strategies in GIS with linguistic quantifiers: an extension of the analytical network process using ordered weighted averaging operators. Int J Geogr Inf Sci. 2013;27(12):2455–82. 10.1080/13658816.2013.815356.Search in Google Scholar
[29] Ghavami SM, Borzooei Z, Maleki J. An effective approach for assessing risk of failure in urban sewer pipelines using a combination of GIS and AHP-DEA. Process Saf Environ Prot. 2020;133:275–85. 10.1016/j.psep.2019.10.036.Search in Google Scholar
[30] Hussein R, Al-Sulttani A. Spatial analysis of noise in Kufa University (Kufa River Campus) using GIS. J Geoinf Env Res. 2020;1(1):38–45. 10.38094/jgier1114Search in Google Scholar
[31] Lai WEI, Han-Lun LI, Qi LIU, Jing-Yi CHEN, Yi-jiao CUI. Study and implementation of fire sites planning based on GIS and AHP. Procedia Eng. 2011;11:486–95. 10.1016/j.proeng.2011.04.687.Search in Google Scholar
[32] Negi P, Jain K. Spatial multicriteria analysis for siting groundwater polluting industries. J Environ Inform. 2021;2(1):68–72.Search in Google Scholar
[33] Vahidnia MH, Alesheikh AA, Alimohammadi A. Hospital site selection using fuzzy AHP and its derivatives. J Environ Manag. 2009;90(10):3048–56. 10.1016/j.jenvman.2009.04.010.Search in Google Scholar
[34] Khan S, Masoodi TH, Pala NA, Murtaza S, Mugloo JA, Sofi PA, et al. Phytoremediation prospects for restoration of contamination in the natural ecosystems. Water. 2023;15(8):1498.Search in Google Scholar
[35] Kumar R, Nath V. IT adaptation in sugar supply chain: A study at milling level. Int J Logist Syst Manag. 2020;35(1):28–49.Search in Google Scholar
© 2024 the author(s), published by De Gruyter
This work is licensed under the Creative Commons Attribution 4.0 International License.
Articles in the same Issue
- Regular Articles
- Theoretical magnetotelluric response of stratiform earth consisting of alternative homogeneous and transitional layers
- The research of common drought indexes for the application to the drought monitoring in the region of Jin Sha river
- Evolutionary game analysis of government, businesses, and consumers in high-standard farmland low-carbon construction
- On the use of low-frequency passive seismic as a direct hydrocarbon indicator: A case study at Banyubang oil field, Indonesia
- Water transportation planning in connection with extreme weather conditions; case study – Port of Novi Sad, Serbia
- Zircon U–Pb ages of the Paleozoic volcaniclastic strata in the Junggar Basin, NW China
- Monitoring of mangrove forests vegetation based on optical versus microwave data: A case study western coast of Saudi Arabia
- Microfacies analysis of marine shale: A case study of the shales of the Wufeng–Longmaxi formation in the western Chongqing, Sichuan Basin, China
- Multisource remote sensing image fusion processing in plateau seismic region feature information extraction and application analysis – An example of the Menyuan Ms6.9 earthquake on January 8, 2022
- Identification of magnetic mineralogy and paleo-flow direction of the Miocene-quaternary volcanic products in the north of Lake Van, Eastern Turkey
- Impact of fully rotating steel casing bored pile on adjacent tunnels
- Adolescents’ consumption intentions toward leisure tourism in high-risk leisure environments in riverine areas
- Petrogenesis of Jurassic granitic rocks in South China Block: Implications for events related to subduction of Paleo-Pacific plate
- Differences in urban daytime and night block vitality based on mobile phone signaling data: A case study of Kunming’s urban district
- Random forest and artificial neural network-based tsunami forests classification using data fusion of Sentinel-2 and Airbus Vision-1 satellites: A case study of Garhi Chandan, Pakistan
- Integrated geophysical approach for detection and size-geometry characterization of a multiscale karst system in carbonate units, semiarid Brazil
- Spatial and temporal changes in ecosystem services value and analysis of driving factors in the Yangtze River Delta Region
- Deep fault sliding rates for Ka-Ping block of Xinjiang based on repeating earthquakes
- Improved deep learning segmentation of outdoor point clouds with different sampling strategies and using intensities
- Platform margin belt structure and sedimentation characteristics of Changxing Formation reefs on both sides of the Kaijiang-Liangping trough, eastern Sichuan Basin, China
- Enhancing attapulgite and cement-modified loess for effective landfill lining: A study on seepage prevention and Cu/Pb ion adsorption
- Flood risk assessment, a case study in an arid environment of Southeast Morocco
- Lower limits of physical properties and classification evaluation criteria of the tight reservoir in the Ahe Formation in the Dibei Area of the Kuqa depression
- Evaluation of Viaducts’ contribution to road network accessibility in the Yunnan–Guizhou area based on the node deletion method
- Permian tectonic switch of the southern Central Asian Orogenic Belt: Constraints from magmatism in the southern Alxa region, NW China
- Element geochemical differences in lower Cambrian black shales with hydrothermal sedimentation in the Yangtze block, South China
- Three-dimensional finite-memory quasi-Newton inversion of the magnetotelluric based on unstructured grids
- Obliquity-paced summer monsoon from the Shilou red clay section on the eastern Chinese Loess Plateau
- Classification and logging identification of reservoir space near the upper Ordovician pinch-out line in Tahe Oilfield
- Ultra-deep channel sand body target recognition method based on improved deep learning under UAV cluster
- New formula to determine flyrock distance on sedimentary rocks with low strength
- Assessing the ecological security of tourism in Northeast China
- Effective reservoir identification and sweet spot prediction in Chang 8 Member tight oil reservoirs in Huanjiang area, Ordos Basin
- Detecting heterogeneity of spatial accessibility to sports facilities for adolescents at fine scale: A case study in Changsha, China
- Effects of freeze–thaw cycles on soil nutrients by soft rock and sand remodeling
- Vibration prediction with a method based on the absorption property of blast-induced seismic waves: A case study
- A new look at the geodynamic development of the Ediacaran–early Cambrian forearc basalts of the Tannuola-Khamsara Island Arc (Central Asia, Russia): Conclusions from geological, geochemical, and Nd-isotope data
- Spatio-temporal analysis of the driving factors of urban land use expansion in China: A study of the Yangtze River Delta region
- Selection of Euler deconvolution solutions using the enhanced horizontal gradient and stable vertical differentiation
- Phase change of the Ordovician hydrocarbon in the Tarim Basin: A case study from the Halahatang–Shunbei area
- Using interpretative structure model and analytical network process for optimum site selection of airport locations in Delta Egypt
- Geochemistry of magnetite from Fe-skarn deposits along the central Loei Fold Belt, Thailand
- Functional typology of settlements in the Srem region, Serbia
- Hunger Games Search for the elucidation of gravity anomalies with application to geothermal energy investigations and volcanic activity studies
- Addressing incomplete tile phenomena in image tiling: Introducing the grid six-intersection model
- Evaluation and control model for resilience of water resource building system based on fuzzy comprehensive evaluation method and its application
- MIF and AHP methods for delineation of groundwater potential zones using remote sensing and GIS techniques in Tirunelveli, Tenkasi District, India
- New database for the estimation of dynamic coefficient of friction of snow
- Measuring urban growth dynamics: A study in Hue city, Vietnam
- Comparative models of support-vector machine, multilayer perceptron, and decision tree predication approaches for landslide susceptibility analysis
- Experimental study on the influence of clay content on the shear strength of silty soil and mechanism analysis
- Geosite assessment as a contribution to the sustainable development of Babušnica, Serbia
- Using fuzzy analytical hierarchy process for road transportation services management based on remote sensing and GIS technology
- Accumulation mechanism of multi-type unconventional oil and gas reservoirs in Northern China: Taking Hari Sag of the Yin’e Basin as an example
- TOC prediction of source rocks based on the convolutional neural network and logging curves – A case study of Pinghu Formation in Xihu Sag
- A method for fast detection of wind farms from remote sensing images using deep learning and geospatial analysis
- Spatial distribution and driving factors of karst rocky desertification in Southwest China based on GIS and geodetector
- Physicochemical and mineralogical composition studies of clays from Share and Tshonga areas, Northern Bida Basin, Nigeria: Implications for Geophagia
- Geochemical sedimentary records of eutrophication and environmental change in Chaohu Lake, East China
- Research progress of freeze–thaw rock using bibliometric analysis
- Mixed irrigation affects the composition and diversity of the soil bacterial community
- Examining the swelling potential of cohesive soils with high plasticity according to their index properties using GIS
- Geological genesis and identification of high-porosity and low-permeability sandstones in the Cretaceous Bashkirchik Formation, northern Tarim Basin
- Usability of PPGIS tools exemplified by geodiscussion – a tool for public participation in shaping public space
- Efficient development technology of Upper Paleozoic Lower Shihezi tight sandstone gas reservoir in northeastern Ordos Basin
- Assessment of soil resources of agricultural landscapes in Turkestan region of the Republic of Kazakhstan based on agrochemical indexes
- Evaluating the impact of DEM interpolation algorithms on relief index for soil resource management
- Petrogenetic relationship between plutonic and subvolcanic rocks in the Jurassic Shuikoushan complex, South China
- A novel workflow for shale lithology identification – A case study in the Gulong Depression, Songliao Basin, China
- Characteristics and main controlling factors of dolomite reservoirs in Fei-3 Member of Feixianguan Formation of Lower Triassic, Puguang area
- Impact of high-speed railway network on county-level accessibility and economic linkage in Jiangxi Province, China: A spatio-temporal data analysis
- Estimation model of wild fractional vegetation cover based on RGB vegetation index and its application
- Lithofacies, petrography, and geochemistry of the Lamphun oceanic plate stratigraphy: As a record of the subduction history of Paleo-Tethys in Chiang Mai-Chiang Rai Suture Zone of Thailand
- Structural features and tectonic activity of the Weihe Fault, central China
- Application of the wavelet transform and Hilbert–Huang transform in stratigraphic sequence division of Jurassic Shaximiao Formation in Southwest Sichuan Basin
- Structural detachment influences the shale gas preservation in the Wufeng-Longmaxi Formation, Northern Guizhou Province
- Distribution law of Chang 7 Member tight oil in the western Ordos Basin based on geological, logging and numerical simulation techniques
- Evaluation of alteration in the geothermal province west of Cappadocia, Türkiye: Mineralogical, petrographical, geochemical, and remote sensing data
- Numerical modeling of site response at large strains with simplified nonlinear models: Application to Lotung seismic array
- Quantitative characterization of granite failure intensity under dynamic disturbance from energy standpoint
- Characteristics of debris flow dynamics and prediction of the hazardous area in Bangou Village, Yanqing District, Beijing, China
- Rockfall mapping and susceptibility evaluation based on UAV high-resolution imagery and support vector machine method
- Statistical comparison analysis of different real-time kinematic methods for the development of photogrammetric products: CORS-RTK, CORS-RTK + PPK, RTK-DRTK2, and RTK + DRTK2 + GCP
- Hydrogeological mapping of fracture networks using earth observation data to improve rainfall–runoff modeling in arid mountains, Saudi Arabia
- Petrography and geochemistry of pegmatite and leucogranite of Ntega-Marangara area, Burundi, in relation to rare metal mineralisation
- Prediction of formation fracture pressure based on reinforcement learning and XGBoost
- Hazard zonation for potential earthquake-induced landslide in the eastern East Kunlun fault zone
- Monitoring water infiltration in multiple layers of sandstone coal mining model with cracks using ERT
- Study of the patterns of ice lake variation and the factors influencing these changes in the western Nyingchi area
- Productive conservation at the landslide prone area under the threat of rapid land cover changes
- Sedimentary processes and patterns in deposits corresponding to freshwater lake-facies of hyperpycnal flow – An experimental study based on flume depositional simulations
- Study on time-dependent injectability evaluation of mudstone considering the self-healing effect
- Detection of objects with diverse geometric shapes in GPR images using deep-learning methods
- Behavior of trace metals in sedimentary cores from marine and lacustrine environments in Algeria
- Spatiotemporal variation pattern and spatial coupling relationship between NDVI and LST in Mu Us Sandy Land
- Formation mechanism and oil-bearing properties of gravity flow sand body of Chang 63 sub-member of Yanchang Formation in Huaqing area, Ordos Basin
- Diagenesis of marine-continental transitional shale from the Upper Permian Longtan Formation in southern Sichuan Basin, China
- Vertical high-velocity structures and seismic activity in western Shandong Rise, China: Case study inspired by double-difference seismic tomography
- Spatial coupling relationship between metamorphic core complex and gold deposits: Constraints from geophysical electromagnetics
- Disparities in the geospatial allocation of public facilities from the perspective of living circles
- Research on spatial correlation structure of war heritage based on field theory. A case study of Jinzhai County, China
- Formation mechanisms of Qiaoba-Zhongdu Danxia landforms in southwestern Sichuan Province, China
- Magnetic data interpretation: Implication for structure and hydrocarbon potentiality at Delta Wadi Diit, Southeastern Egypt
- Deeply buried clastic rock diagenesis evolution mechanism of Dongdaohaizi sag in the center of Junggar fault basin, Northwest China
- Application of LS-RAPID to simulate the motion of two contrasting landslides triggered by earthquakes
- The new insight of tectonic setting in Sunda–Banda transition zone using tomography seismic. Case study: 7.1 M deep earthquake 29 August 2023
- The critical role of c and φ in ensuring stability: A study on rockfill dams
- Evidence of late quaternary activity of the Weining-Shuicheng Fault in Guizhou, China
- Extreme hydroclimatic events and response of vegetation in the eastern QTP since 10 ka
- Spatial–temporal effect of sea–land gradient on landscape pattern and ecological risk in the coastal zone: A case study of Dalian City
- Study on the influence mechanism of land use on carbon storage under multiple scenarios: A case study of Wenzhou
- A new method for identifying reservoir fluid properties based on well logging data: A case study from PL block of Bohai Bay Basin, North China
- Comparison between thermal models across the Middle Magdalena Valley, Eastern Cordillera, and Eastern Llanos basins in Colombia
- Mineralogical and elemental analysis of Kazakh coals from three mines: Preliminary insights from mode of occurrence to environmental impacts
- Chlorite-induced porosity evolution in multi-source tight sandstone reservoirs: A case study of the Shaximiao Formation in western Sichuan Basin
- Predicting stability factors for rotational failures in earth slopes and embankments using artificial intelligence techniques
- Origin of Late Cretaceous A-type granitoids in South China: Response to the rollback and retreat of the Paleo-Pacific plate
- Modification of dolomitization on reservoir spaces in reef–shoal complex: A case study of Permian Changxing Formation, Sichuan Basin, SW China
- Geological characteristics of the Daduhe gold belt, western Sichuan, China: Implications for exploration
- Rock physics model for deep coal-bed methane reservoir based on equivalent medium theory: A case study of Carboniferous-Permian in Eastern Ordos Basin
- Enhancing the total-field magnetic anomaly using the normalized source strength
- Shear wave velocity profiling of Riyadh City, Saudi Arabia, utilizing the multi-channel analysis of surface waves method
- Effect of coal facies on pore structure heterogeneity of coal measures: Quantitative characterization and comparative study
- Inversion method of organic matter content of different types of soils in black soil area based on hyperspectral indices
- Detection of seepage zones in artificial levees: A case study at the Körös River, Hungary
- Tight sandstone fluid detection technology based on multi-wave seismic data
- Characteristics and control techniques of soft rock tunnel lining cracks in high geo-stress environments: Case study of Wushaoling tunnel group
- Influence of pore structure characteristics on the Permian Shan-1 reservoir in Longdong, Southwest Ordos Basin, China
- Study on sedimentary model of Shanxi Formation – Lower Shihezi Formation in Da 17 well area of Daniudi gas field, Ordos Basin
- Multi-scenario territorial spatial simulation and dynamic changes: A case study of Jilin Province in China from 1985 to 2030
- Review Articles
- Major ascidian species with negative impacts on bivalve aquaculture: Current knowledge and future research aims
- Prediction and assessment of meteorological drought in southwest China using long short-term memory model
- Communication
- Essential questions in earth and geosciences according to large language models
- Erratum
- Erratum to “Random forest and artificial neural network-based tsunami forests classification using data fusion of Sentinel-2 and Airbus Vision-1 satellites: A case study of Garhi Chandan, Pakistan”
- Special Issue: Natural Resources and Environmental Risks: Towards a Sustainable Future - Part I
- Spatial-temporal and trend analysis of traffic accidents in AP Vojvodina (North Serbia)
- Exploring environmental awareness, knowledge, and safety: A comparative study among students in Montenegro and North Macedonia
- Determinants influencing tourists’ willingness to visit Türkiye – Impact of earthquake hazards on Serbian visitors’ preferences
- Application of remote sensing in monitoring land degradation: A case study of Stanari municipality (Bosnia and Herzegovina)
- Optimizing agricultural land use: A GIS-based assessment of suitability in the Sana River Basin, Bosnia and Herzegovina
- Assessing risk-prone areas in the Kratovska Reka catchment (North Macedonia) by integrating advanced geospatial analytics and flash flood potential index
- Analysis of the intensity of erosive processes and state of vegetation cover in the zone of influence of the Kolubara Mining Basin
- GIS-based spatial modeling of landslide susceptibility using BWM-LSI: A case study – city of Smederevo (Serbia)
- Geospatial modeling of wildfire susceptibility on a national scale in Montenegro: A comparative evaluation of F-AHP and FR methodologies
- Geosite assessment as the first step for the development of canyoning activities in North Montenegro
- Urban geoheritage and degradation risk assessment of the Sokograd fortress (Sokobanja, Eastern Serbia)
- Multi-hazard modeling of erosion and landslide susceptibility at the national scale in the example of North Macedonia
- Understanding seismic hazard resilience in Montenegro: A qualitative analysis of community preparedness and response capabilities
- Forest soil CO2 emission in Quercus robur level II monitoring site
- Characterization of glomalin proteins in soil: A potential indicator of erosion intensity
- Power of Terroir: Case study of Grašac at the Fruška Gora wine region (North Serbia)
- Special Issue: Geospatial and Environmental Dynamics - Part I
- Qualitative insights into cultural heritage protection in Serbia: Addressing legal and institutional gaps for disaster risk resilience