Formation mechanism and oil-bearing properties of gravity flow sand body of Chang 63 sub-member of Yanchang Formation in Huaqing area, Ordos Basin
-
Jianbo Liao
 ,
Zedong Zhu
,
Zedong Zhu

Abstract
Gravity flow sand body is an important reservoir for deep water deposition. The in-depth study of its formation mechanism and oil enrichment law can provide important guidance for oil and gas exploration in deep water areas. In this article, taking the deep-water gravity flow sand body of the Triassic Chang 63 sub-member in the Huaqing area as an example, the identification characteristics, formation mechanism, and oil-bearing characteristics of the gravity flow sand body are systematically discussed. The results show that sandy debris flow, turbidite flow, and mixed event flow present different superposition combination modes on vertical gravity flow deposition. The lithofacies of the gravity flow sandstone complex are mainly affected by lake level fluctuation, provenance supply, and hydrodynamic conditions. According to the formation conditions, sedimentary types. and distribution characteristics of deep water gravity flow sand bodies, a three-dimensional sedimentary mode of deep water gravity flow sand bodies is established. It is found that the physical and oil-bearing properties of the sandy debris flow sand body are better than those of the turbidity flow sand body. The reason is that the proportion of debris in the sand body of sandy debris flow is high, and the content of debris particles is generally greater than 70% according to the statistics of thin sections, which is conducive to the formation of pores. Second, sandy debris flow belongs to block transport, and the mixing of lithology is not sufficient in the process of block flow transport, so some pores will be preserved. Finally, gravity flows, which are dense at the beginning, become less dense later as detrital sediments unload, allowing them to be transported to distant regions. Therefore, the monolayer thickness of the sandy debris flow sand body is large (generally greater than 0.5 m), and the particle size of the debris ranges from 0.03 to 0.3 mm. Finally, the physical and oil-bearing properties of the sandy clastic flow sand body are better than those of the turbidity flow sand body.
1 Introduction
The sedimentary types of gravity flow in deep water mainly include sliding rock, slump rock, liquefied flow, sandy debris flow, muddy clastic flow, and turbidite flow [1,2,3,4,5]. Among them, sandy debris flow and turbidity current deposits have better reservoir physical properties [6,7,8]. At present, most of the researches on deep-water gravity flow around the world focus on its genetic mechanism and identification markers. However, the researches on the micropetrology, differences in reservoir properties, and their effects on oil enrichment of these two types of sand bodies are very limited [9,10,11].
Gravity flow sand body is an important reservoir of deep water deposition. The distribution of sand body is closely related to the large-scale accumulation of oil and gas [12,13,14,15]. Generally, the distribution of gravity flow sand bodies is mainly controlled by internal and external factors [16,17,18,19]. External factors include tectonic activity, sediment supply, climate change, and sea level rise and fall. Tectonic activity mainly controls the collapse of sediments and the flow and velocity of water bodies. Sediment supply usually comes from provenance areas adjacent to drainage systems [20,21]. Internal factors mainly include water density and basin topography. Water density mainly refers to the difference in water density caused by flood flow. Basin topography includes topographic slope and basin landform [22,23,24]. The topographic slope mainly determines the differentiation rate of sand bodies in the fluid, while the basin geomorphology determines the distribution and sedimentary characteristics of the final gravity flow sand bodies [25,26,27,28].
The Ordos Basin is the second largest sedimentary basin in China, and the Chang 7 Member period of the Late Triassic Yanchang Formation is the largest lake flooding period, with deep and extensive water bodies, and the distribution of semi-deep lakes-deep lakes is up to 5 × 10⁴ km2. Among them, the Huaqing area is located in the center of the semi-deep lake-deep lake (Figure 1). By the Chang 6 Member period, the basin basement began to rise, the peripheral deltaic sedimentary system continued to accumulate toward the central part of the lake basin, and the slope of the leading edge slope reached a critical angle. Triggered by external forces, the sandy-muddy soft sediments formed by rapid accretion became gravitationally destabilized, and a set of giant-thick gravity-flow composite sediments accumulated in the Huaqing area (lake-bottom plain) in the center of the lake basin. Due to the close proximity to the underlying Chang 7 Member hydrocarbon source rock, in the early Cretaceous end of the key reservoir period “near the water tower” priority to capture hydrocarbons, 1 billion tons of crude oil gathered in the Chang 6 Member. Therefore, the Huaqing area provides conditions for the coupled study of the elements of the source-sink system of gravity-flow sediments. In addition, different types of gravity flow deposition types are developed in the Chang 6 Member of the Huaqing area, which is the most ideal area for dissecting the genesis of gravity flow sand bodies and studying the oil-bearing characteristics of sand bodies of different genesis.

Location of the study area (a) and the target layer is the Chang 63 sub-member (b) of Chang 6 Member, Yanchang Formation, Ordos Basin.
In this study, taking the deep-water gravity flow sand body of the Triassic Chang 63 sub-member in the Huaqing area of the Ordos Basin as an example, the identification characteristics, formation mechanism, and oil-bearing characteristics of gravity flow sand body are systematically discussed. This study has positive significance for clarifying the difference between reservoir properties and oil enrichment law of gravity flow sand bodies.
2 Geological background
The study area is located in the Huaqing area in the middle part of the Ordos Basin (Figure 1a). During the sedimentary period of the Chang 63 sub-member, the study area was located in the center of the lake basin, and multiple provenance and rapid sedimentary facies changes resulted in strong heterogeneity of the reservoir. The Chang 7 Member oil shale is well developed in the central part of the lake basin. The gravity flow sand body of the Chang 63 sub-member is in direct contact with the source rock, and a good source–reservoir combination of lower generation and upper reservoir is formed. The research horizon in this study is the Chang 63 sub-member (Figure 1b). The Chang 63 sub-member consists of 1–2 positive and antiprosodic units, and its thickness is generally 29–56 m.
3 Methods
The experiments carried out in this study included thin sections, scanning electron microscopy (SEM), constant velocity mercury injection, and nuclear magnetic resonance. Thin section and SEM experiments were used to observe the microstructure of the internal mineral components of the Chang 63 sub-member sandstone. Furthermore, the observation results of the microscopic structure of mineral components and pores can provide a reference for the revelation of the genetic mechanism of the water gravity flow sand body [29,30,31].
An ASPE-730 mercury injection instrument was used to carry out the constant velocity mercury injection experiments. Constant velocity mercury injection is an important way to quantitatively calculate the pore–throat ratio. It accurately determines the size and quantity of different pore–throats through the pressure fluctuation during quasi-static mercury injection, and one fluctuation represents one pore–throat. Constant-rate mercury injection is done at a very low constant speed (usually 0.00005 ml/min). By injecting mercury into the throats and pores of rock samples, the quantity of throats can be measured, thus overcoming the defect of high-pressure mercury injection. Due to the low mercury intake rate, the quasi-static mercury intake process can be approximately maintained, and the pore and throat information can be obtained according to the pressure fluctuation of mercury intake.
To further clarify the controlling mechanism of physical properties on oil-bearing properties in sand bodies, NMR movable fluid saturation experiments were carried out. In this study, 13.90 ms was used as the T2 relaxation time limit of movable and bound fluids. The magnitude and percentage of the magnitude sum of all points on the T2 spectrum with the T2 relaxation time greater than 13.895 ms is the mobile fluid saturation. Conversely, bound fluid saturation is defined by the magnitude of each point on the T2 spectrum whose T2 relaxation time is less than 13.90 ms and the percentage of the magnitude sum of all points on the T2 spectrum.
4 Results
The deep water gravity flow deposits mainly include debris flow, turbidity current, and mixed event current. They have different genetic mechanisms and distribution characteristics. During the Chang 63 sub-member period, the sandy debris flow and turbidity flow sand bodies were widely developed in the middle part of the lake basin, while mixed event flow sand bodies were only developed in part of the lake basin.
4.1 Gravity flow types and identification markers
The Chang 6 Member represents a relatively stable development stage of lake basin. On the basis of the deep lacustrine facies of the Chang 7 Member, a group of zonal delta sedimentary bodies developed around the lake basin. Furthermore, a large number of turbidite fans developed under the lake slope, and good reservoir was formed. In general, the Chang 63 sub-member in the Huaqing area is dominated by the semi-deep lake gravity flow (slump gravity flow), followed by the delta front traction flow. Moreover, the slump gravity flow is mainly composed of sandy debris flow and turbidity current, and mixed event flow is rare.
4.1.1 Sandy debris flow sandstone
According to the observations of cores and outcrop profiles, the thickness of the sandy debris flow sand body ranges from 2.3 to 42.56 m, with an average thickness of 19.32 m, and most of the sand body thickness is concentrated in the range of 13–18 m. The sand body of sandy debris flow has fine particles and is mainly light gray in color (Figure 2a).

Sedimentary characteristics of Chang 63 sub-member in the study area. Notes: (a) Field profile (Yaoqu area), there is no internal sedimentary structure, no gradation of grain sequence, and its thickness is greater than 50 cm; (b) field profile (Yaoqu area), “mud-coated gravel” structure; (c) field profile (Shanshuihe area), “mud-coated gravel” structure; (d) well X322, 1956.4 m, interbedded mud-sand structure; (e) field profile (Yaoqu area), groove cast; (f) field profile (Yaoqu area); flute cast (g) well L87, 2,225 m, H1 is massive fine sandstone, and H3 is lacerated deformed mudstone fragment; (h) well H56, 2424.3, H1 is massive fine sandstone, and H3 is lacerated deformed mudstone fragment; and (i) well L87, 2231.5 m, H1 is massive fine sandstone, H2 is a banded thin interbedded sand–mudstone combination.
The sandy debris flow has typical sedimentary structure features such as floating mud gravel and mudstone tearing debris. In addition, massive bedding is developed, there is no obvious grain sequence change in sandstone, and the top and bottom are in abrupt contact with mudstone. The upper part of the massive sandstone developed mud-gravel and mud-coated gravel along the bedding (Figure 2b). The gravel is usually in the shape of long strips. The “mud-coated gravel” has a double-layer structure with an outer layer of muddy or silty cladding not exceeding 3 cm thick (Figure 2c).
Most of the sandy debris flows have the characteristics of plastic rheology and belong to Bingham plastic fluid [32,33]. Under the action of various supporting mechanisms, such as dispersion pressure, buoyancy, and particle support, the mud and gravel are distributed along the bedding in a directional manner. The main difference between sandy debris flow sand bodies and other gravity flow sedimentary body is that it has massive structure, abrupt contact with mudstone, and floating mud debris and mud gravel inside [34,35].
4.1.2 Turbidity current sandstone
The typical sequence of turbidity deposition is the Bauma sequence, which consists of five tapering intervals from bottom to top. The bottom is composed of sandstone with graded bedding (section a), the bottom has groove mold and other scour casting mold, and the upper part is sandstone with parallel bedding; section c is siltstone with cross-bedding and deformed bedding with wavelet marks; section d is siltstone and silty mudstone with horizontal texture; and section e at the top is massive mudstone.
Turbidity current deposits have a wide distribution range in the Chang 63 sub-member of the Huaqing area, but the thickness of sand body is relatively thin, ranging from 0.02 to 13.67 m, with an average thickness of 8.47 m. The turbidity sand body has fine grains, and fine sandstone, siltstone, and mudstone are developed (Figure 2d). Among them, the content and color of mud are mainly determined by the depth of water body deposited by turbidity sand body. The deeper the water, the more muddy content, the more gray the color. According to the observation, the muddy content in turbidity sand bodies changes rapidly, and the sand-mud interbedding structure is obvious, which is a typical sign for identifying turbidity sand bodies (Figure 2d). The sedimentary structures of turbidity sand bodies include peeling lineation structure, trough mold, parallel bedding, sand lamination, and flame structure (Figure 2e and f). Turbidity current is mainly carried by suspension supported by turbulent flow, and the grain size of sediment becomes finer from bottom to top. Due to the relatively simple transport mode, turbidity current cannot transport or carry large clastic particles, so the sandstone particle size is fine and pure [36,37,38].
4.1.3 Mixed event flow
Mixed event flow refers to the mixed deposition of a variety of sedimentary sequences due to fluid transformation in a gravity flow event. The mixed event flow is formed under the condition of high sediment concentration and long transport distance, including the mixed sandstone of sandy debris flow and turbidite current, and the mixed sandstone of turbidite flow and muddy clastic flow [39,40,41].
For the mixed event flow sand bodies, massive sandstones (H1), banded thin interbedded sand-mudstone (H2), and deformed torn mudstone fragments (H3) develop. Among them, the H1 section is mainly fine sandstone with a thickness between 0.1 and 0.7 m, with an average thickness of 0.42 m. It has good oil content, massive bedding, and abrupt contact between top and bottom. In the H2 section, banded thin sand-mudstone is mainly developed. The H3 section is mainly argillaceous siltstone with thickness ranging from 0.1 to 0.5 m, with an average thickness of 0.26 m. Moreover, its interior contains scattered fragments of mud. The mixed event flow developed in the Chang 63 sub-member in the study area was mainly composed of H1 and H3 sections (Figure 2g–i). The reason for its formation is that with the increase in migration distance, the upper turbidity current is eroded by mudstone, and the flow pattern is transformed, which leads to part of the turbidity current being transformed into muddy clastic flow. The characteristics of argillaceous debris and the difference in lithology between upper and lower sandstone are the key evidence of turbidite flow transforming into argillaceous debris flow. It is found that the mixed event flow of the Chang 63 sub-member has low development degree and small thickness in the study area and only distributes sporadically in the semi-deep lake to the deep lake area.
4.2 Petrological characteristics
The gravity flow rock types in the study area are mainly feldspar lithic sandstone and lithic sandstone (Figure 3). The debris content of quartz, feldspar, and debris is 28.66, 8.61, and 31.87%, respectively. Moreover, the debris mainly includes volcanic debris, metamorphic debris, and sedimentary debris. According to statistics, the average content of volcanic, metamorphic, and sedimentary rock debris is 2.45, 12.5, and 18.9%, respectively.

Triangle diagram of sandstone composition of Chang 63 sub-member. (a) sandy debris flow sand body and (b) turbidity sand body. Notes: Ⅰ, Ⅱ, Ⅲ, Ⅳ, Ⅳ, Ⅵ, and Ⅶ represent quartz sandstone, feldspar quartz sandstone, lithic quartz sandstone, feldspar sandstone, lithic feldspar sandstone, feldspar lithic sandstone, and lithic sandstone, respectively.
The clastic composition of sandy debris flow is significantly different from that of turbidite sandstone. The clastic rock is mainly quartz, while the turbidite sandstone is mainly debris. The content of feldspar and quartz in sandy debris flow sandstone is relatively high. The average content of quartz, feldspar, and debris is 31.2, 11.7, and 28.3%, respectively. In addition, the average content of metamorphic, volcanic, and sedimentary rock debris is 13.6, 2.6, and 12.1%, respectively.
Based on the statistical analysis of the grain size of 80 samples, it is found that the lithology of gravity flow sand body in the study area is mainly fine sandstone, accounting for 85.39%; silty sand, medium sand, and clay accounted for 6.18, 4.12, and 5.24%, respectively; however, the coarse sand content is the least, accounting for only 1.12% (Figure 4).

Histogram of grain size of Chang 63 sub-member in the study area.
The particle size of sandy debris flow and turbidite sand body is similar, and both are mainly fine sandstone, accounting for 83.27 and 87.51%, respectively. Among them, the total content of fine sand, medium sand, and coarse sand in sandy debris flow is high, accounting for 93.18%. In contrast, the content of silt and clay in turbidite sandstone is high, accounting for 11.93%.
4.3 Pore structures
The gravity flow sand body of the Chang 63 sub-member mainly developed two types of reservoir space: pores and fractures (Figure 5). The pore morphology of gravity flow sandstone in the study area is mostly in the shape of long strip, grid, and honeycomb. The surface porosity is generally greater than 0.5% and up to 8.0%, and the pore diameter is generally 0.02–0.50 mm (Figure 5a–c). The pore morphology of intergranular pores in the cast thin section is triangular, quadrilateral, and irregular. Good connectivity constitutes the main percolation channels within the reservoir (Figure 5b). The dissolution pores are mainly feldspar and debris dissolution pores (Figure 5c–e). Feldspar dissolution pores are relatively developed in low permeability reservoirs in the middle of the lacustrine basin and are the main storage space of gravity flow sand bodies. Feldspar dissolution pores are often formed by selective dissolution along the cleavage direction of feldspar grains and the relatively easy dissolution parts of feldspar grains [42,43]. A large number of debris dissolution pores provide favorable reservoir conditions, with pore radius ranging from 5 to 35 μm (Figure 5f and g). The generation of dissolution pores has an important effect on optimizing pore structures and improving the connectivity of pore throats. A large number of intercrystalline pores are mainly distributed between clay and matrix components. They are mainly intercrystalline pores formed between quartz secondary enlargement, illite, and calcite crystals or between autogenous feldspar (Figure 5g–l).
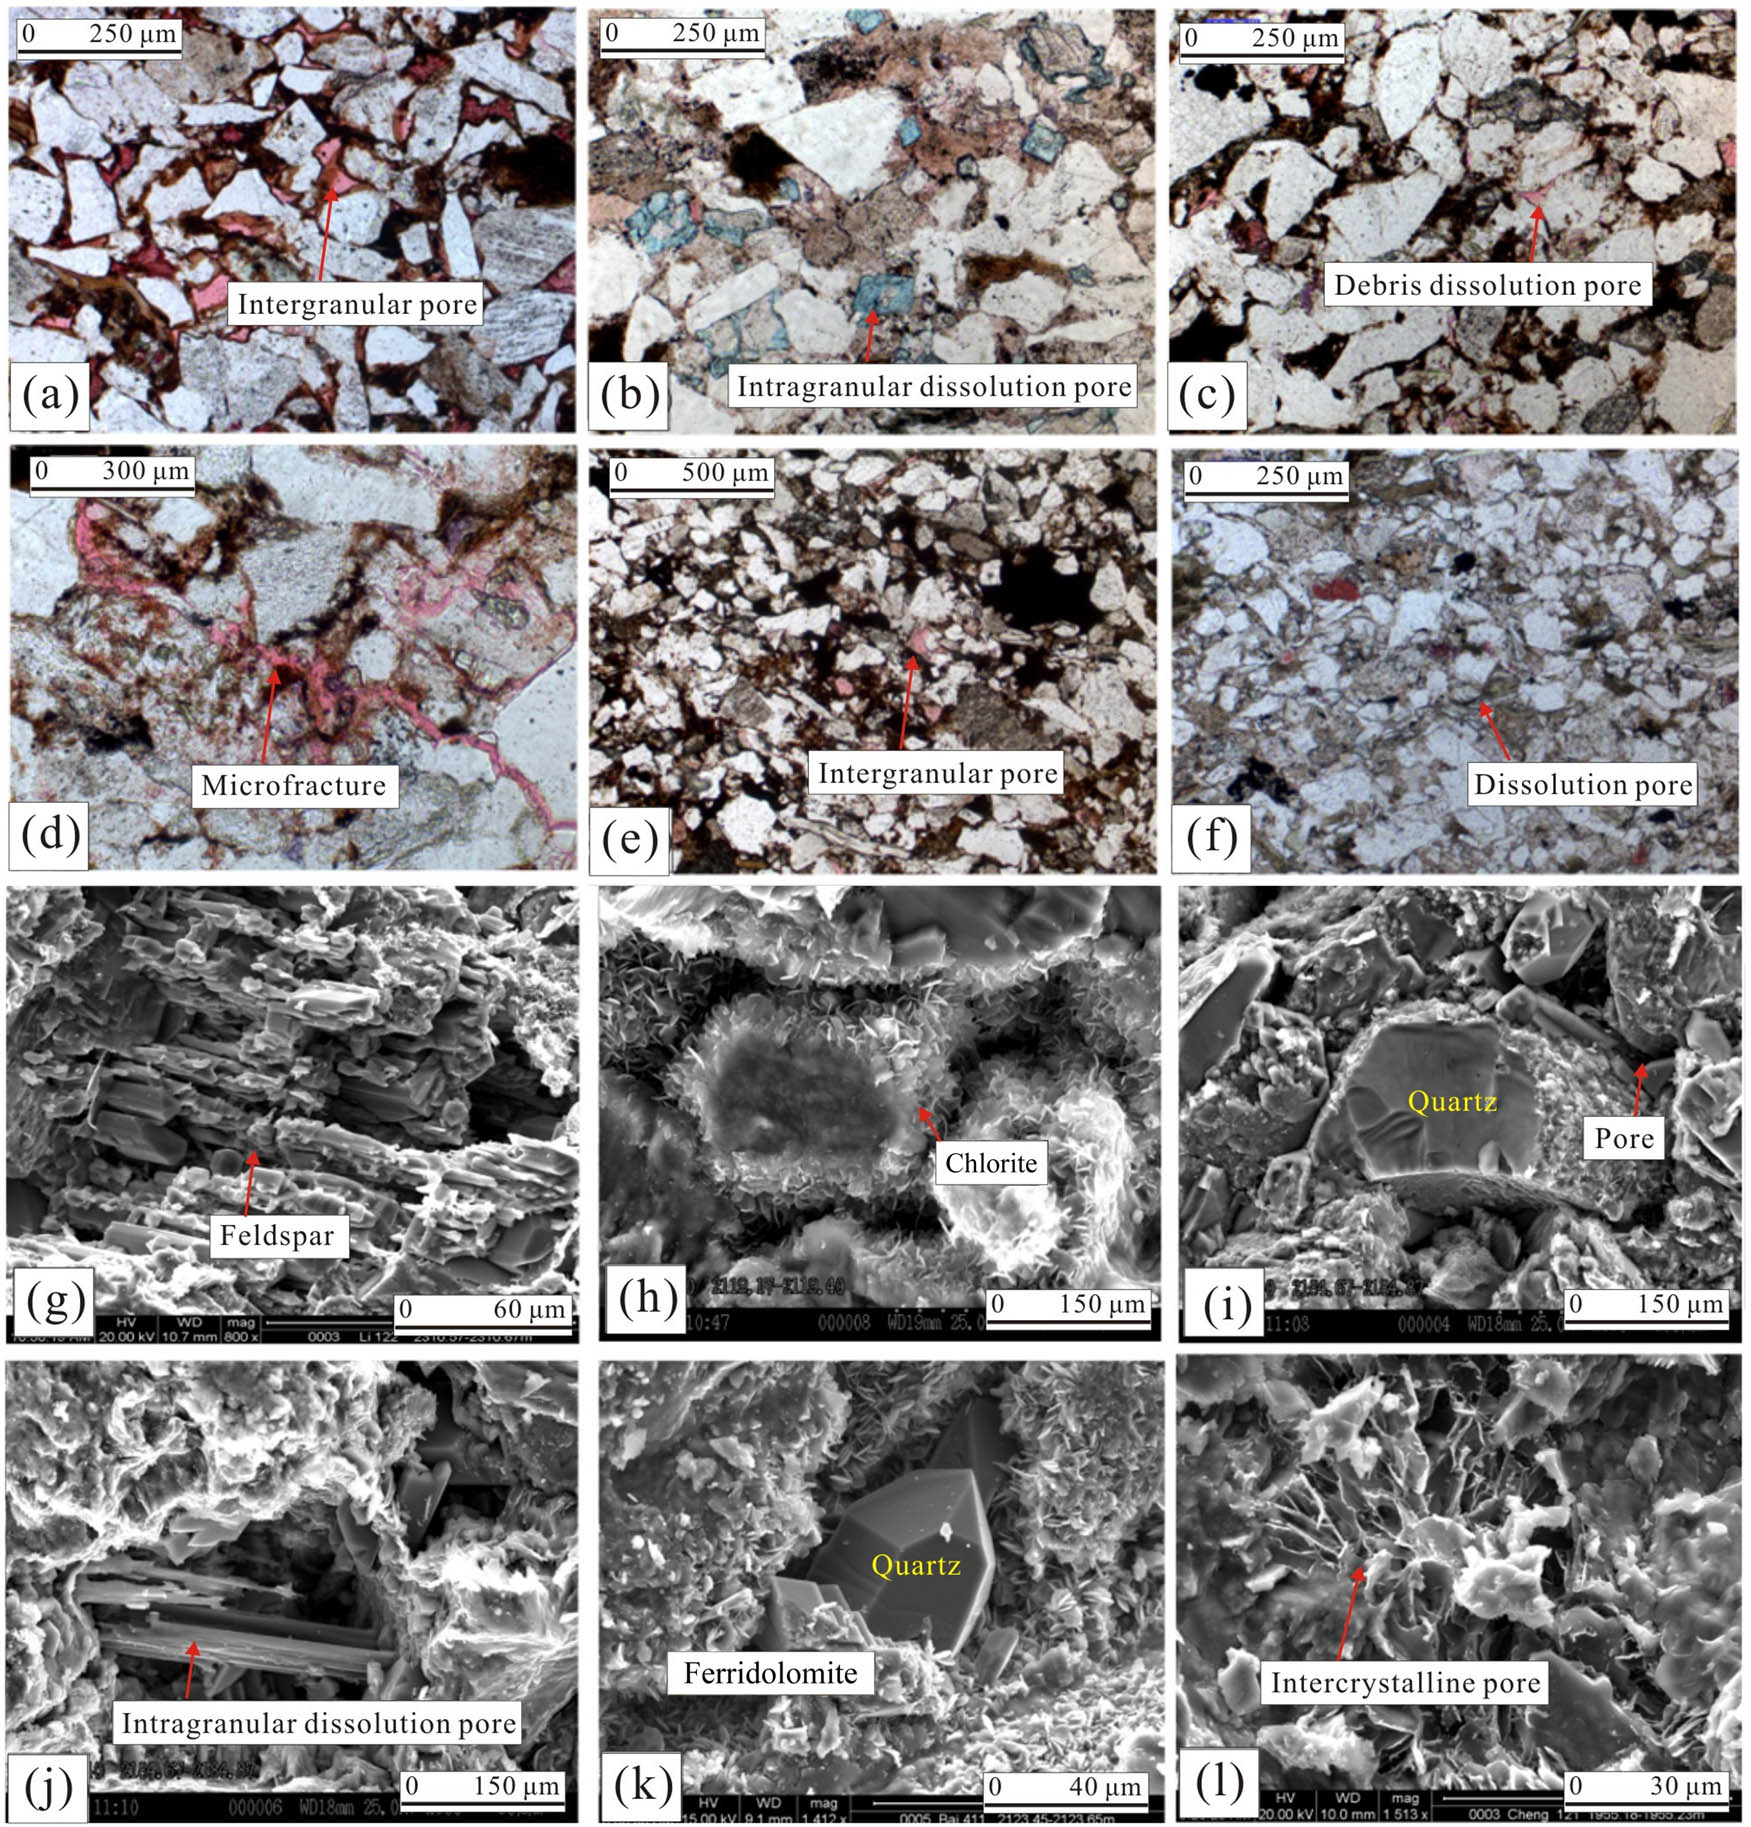
Cast thin section and SEM images of Chang 63 sub-member in the study area. Notes: (a) well S126, 1,807 m, intergranular pore, sandy debris flow sand body; (b) field profile, Xunyi area, intra- and intergranular dissolution pores, sandy debris flow sand body; (c) well B127, 1836.94 m, intergranular pore and debris dissolution pore, sandy debris flow sand body; (d) well N68, 1776.5 m, microfracture and intergranular pore, sandy debris flow sand body; (e) well L47, 1897.7 m, intergranular pore, turbidity sand body; (f) field profile, Xunyi area. Dense structure with visible small amounts of dissolved pores, turbidity sand body; (g) well L122, 2310.57 m, feldspar dissolution pore; (h) well B120, 2119.17 m, intergranular pores filled with Chlorite; (i) well B140, 2184.67 m, intercrystalline pore (quartz); (j) well B140, 2184.87 m, Intragranular dissolution pore; (k) well B411, 2123.45 m, intercrystalline pore (quartz and ferridolomite); and (l) well C211, 1955.18 m, intercrystalline pore (illite alteration).
According to statistics, the gravity flow sand body of the Chang 63 sub-member is dominated by intergranular pores, intergranular dissolution pores, intragranular dissolution pores, feldspar dissolution pores, and debris dissolution pores, accounting for 33.26, 15.21, 18.26, 15.87, and 12.39%, respectively; however, microfractures and intercrystalline pores account for 4.13 and 0.65%, respectively (Figure 6).

Statistics of pore types of sandstone of Chang 63 sub-member in the study area.
According to the mercury injection results, the pore type of the Chang 63 sub-member gravity flow sand body is a small pore–fine throat type (Figure 7). The pore radius is concentrated in the range of 30–50 μm, the minimum pore radius is 0.89 μm, and the maximum pore radius is 124.2 μm. The throat radius is concentrated in 0.5–1 μm, the minimum throat radius is 0.11 μm, and the maximum throat radius is 11.8 μm. The pore–throat ratio is distributed in 10–20, with a minimum value of 1.43 and a maximum value of 913.2.

Distribution of pore radius (a), throat radius (b), and pore–throat ratio (c) of gravity flow sandstone in Chang 63 sub-member.
According to the correlation analysis of constant velocity injection mercury throat, pore inlet mercury saturation, and total pore inlet mercury saturation, it was found that there was an obvious intersection of the two correlation lines (Figure 8). Below this intersection, the contribution of laryngeal mercury saturation to total pore–throat mercury saturation exceeds that of pore–throat mercury saturation. Above this intersection, the contribution of pore–entry mercury saturation to total pore–throat mercury saturation exceeds that of throat mercury saturation. The worse the porosity, the greater the mercury saturation; the better the physical property, the greater the mercury saturation [44,45]. Therefore, the mercury intake in the total pore–throat of sandstone reservoir in the study area is the result of the joint action of the throats and pores. The mercury saturation in the pore of rock sample plays a leading role. However, in a certain range of values, the contribution of mercury saturation to total pore–throat mercury saturation is slightly higher.

Correlation of constant velocity mercury injection parameters.
5 Discussion
5.1 Formation mechanism of gravity flow deposition
5.1.1 Sandy debris flow sandstone
Outcrop and core data show that the supporting characteristics of gravity flow sand bodies in the study area show that large debris such as mud-gravel and “mud-coated gravel” are suspended by the sandy matrix formed in the quasi-syngenic sedimentary stage. In the process of mass transport, sandstone with strong shear resistance will be involved in soft clay layer with relatively weak shear resistance (argillaceous clastic mudstone) due to gravitational shear action in the bulk flow complex, and then sedimentary structures such as tearing mud gravel and mud cladding are formed [46,47]. The argillaceous crust of floating argillaceous gravel and “mud-coated gravel” structure is characterized by a shallow water environment near shore, partial oxidation, and low paleo-salinity. It is closely related to the accompanying argillaceous clastic flow mudstone but is significantly different from the bottom bed semi-deep lacustrine stratified mudstone. In addition, the formation process of debris flow sand body retains the characteristics of block transport, and there is a material exchange in the sandy argillaceous soft sediment under the action of shear stress, resulting in a certain degree of lithology mixing [48,49].
In the formation process of sandy debris flow sandstone complex, the superimposed form of a single sand body is mainly related to slope, provenance supply, and hydrodynamic strength. When the slope break zone has a large slope or a stepped high-angle slope, the provenance supply is small and the water power is weak, and the isolated lenticular sand body complex is formed along the provenance direction; when the source supply is large and the hydrodynamic force is strong, the superimposed lenticular sand body complex is easily formed; when the slope is small and the source supply is large, it is easy to form sheet sand body complex (Figure 9).

Several typical superimposed patterns of sandy debris flow sand bodies.
5.1.2 Turbidity current sandstone
By dissecting the complete Bauma sequence of turbidite sand bodies in the outcrop, it was found that positive grain order changes were observed in section A (Figure 10a and b). The results show that the energy and velocity of turbidity current decrease continuously during deposition. The sedimentation of the suspended coarse and fine sediments due to their different falling velocity indicates the turbulent support mechanism of the sediments. The directional arrangement of sheet mica and long strip minerals can be observed in B and C segment depositions (Figure 10c). This indicates that turbidity current changes to traction current due to further energy depletion after the deposition of segment A, and the fluid flows in a directional way. Furthermore, sedimentary structures such as parallel bedding and sand bedding were formed (Figure 10c).
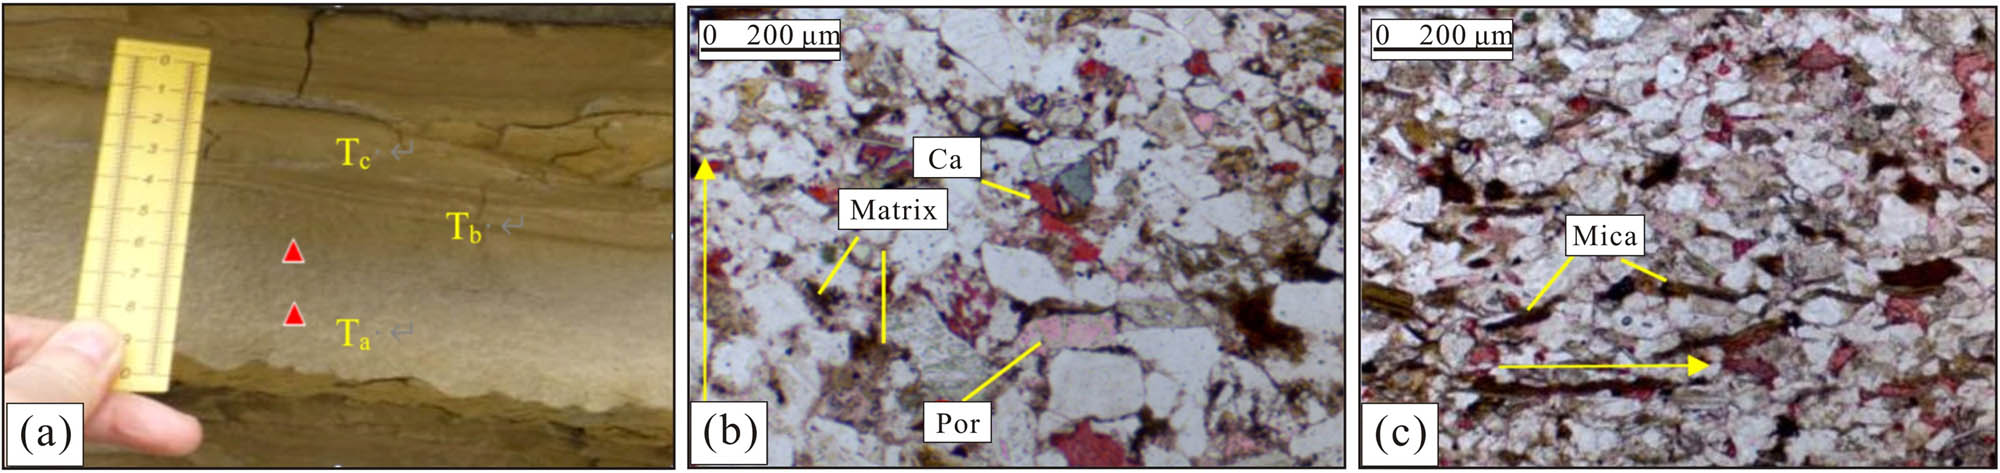
Images of thin sections of typical turbidity deposits. Notes: (a) Turbidity sand body in Shanshuihe area. The complete Bouma sequences developed in Ta, Tb, and Tc segments. (b) In the Ta segment, the oriented thin sections have visible grain sequence bedding and a few pores are developed. (c) Tb segment, slightly oriented arrangement, and its surface porosity are very low.
5.1.3 Mixed event flow sand body
During the Chang 63 sub-member period, the development degree of mixed event flow sandstone was mainly determined by the internal characteristics of source-sink system [50]. Since the provenance of this period was mainly from the northeast, and the sandstone experienced a long period of migration, the content of argillaceous material in the sandstone was low, and it was unlikely to have the conditions to form the upper argillaceous debris flow [51,52]. On the other hand, since the northeastern sand body itself is relatively well sorted and rounded during collapse, the gravity flow sand body formed during collapse usually does not carry a large amount of mud debris [53]. However, the mixed gravity flow sand body in the study area developed a large number of argillaceous debris. Therefore, the rarely found mixed gravity flow sandstone in the study area is mainly formed due to a large number of argillaceous debris carried by flooding [53,54]. The distribution range of mixed gravity flow sand bodies is limited due to the seasonality and sweep range of flood.
Sandy debris flow and turbidity current can be transformed into each other in time and space. Several typical models of the transformation of sandy debris flow and turbidity current have been established by the previous (Figure 11a). It can be seen from Figure 11a that in time the debris flow can be transformed into a turbidity current; in space, the flow stratification of debris flow can occur in the upper part of the flow layer to form a turbidity current.
![Figure 11
Development characteristics of deep water gravity flow deposits in the Yanchang Formation. Notes: (a) spatio-temporal transformation mode of sandy debris flow and turbidity current (modified after Shanmugam, [34]) and (b) combination mode of sandy debris flow and turbidity current deposition in Chang 63 sub-member, Huaqing area.](/document/doi/10.1515/geo-2022-0690/asset/graphic/j_geo-2022-0690_fig_011.jpg)
Development characteristics of deep water gravity flow deposits in the Yanchang Formation. Notes: (a) spatio-temporal transformation mode of sandy debris flow and turbidity current (modified after Shanmugam, [34]) and (b) combination mode of sandy debris flow and turbidity current deposition in Chang 63 sub-member, Huaqing area.
From the core observation, the three types of sediment gravity flows often interbedded in the longitudinal direction, and the combination of sandy debris flow and turbidity current is most common (Figure 11b). From the outcrop profile, the gravity flow of the Yanchang Formation usually develops in semi-deep lake mudstone. It shows that it was formed in a semi-deep lake environment and controlled by a deep water slope break zone.
Therefore, the transformation model of gravity flow formation in the Yanchang Formation sediments was established. In the vicinity of the deep water slope break zone, the loose sediments in the delta front will randomly slip and collapse under the condition of rapid deposition instability or triggered by some accidental mechanism (wave, volcano, earthquake, storm, etc.). As the slump body moves down the slope, the mixing of sediment with water and the decomposition of material increases. The slump flow forms a clastic flow in which the sediment flows as a loose viscous mass flow. As the debris flow continues to flow down the slope, the fluid composition in the flow increases, and the plastic debris flow may evolve into turbulent fluid and form turbidity current.
Sandy debris flow, turbidite flow, and mixed event flow show different combination modes in the vertical direction, which reflects the difference in the sedimentary evolution process of different gravity flow sandstone complexes. As shown in Figure 11b, two typical gravity flow sand body assemblage styles are developed in the study area. One is dominated by sandy debris flow sandstone, with a single sandy debris flow sand body having a large thickness and intermingled with thin layer turbidite and mixed event flow sand bodies. The other type is turbidity current, and the thickness of the single turbidity current sand body is relatively small, mixed with thick sandy debris flow and thin layer mixed event flow sand body. The lithofacies of these two gravity-flow sandstone complexes are mainly affected by lake level fluctuation, provenance supply, and hydrodynamic conditions.
5.2 Sedimentary mode of gravity flow sand body in deep water
According to the formation conditions, sedimentary types, and distribution characteristics of deep-water gravity flow sand bodies, their three-dimensional sedimentary mode was established (Figure 12).
Gravity flow is developed on both steep slope and gentle slope in the Ordos Basin. The type and scale of gravity flow are controlled by provenance and slope break zone. During the sedimentary period of the Chang 63 sub-member, the northeastern part of the study area had a steep slope and abundant provenance, and meander river deltas were mainly developed. Under the action of earthquake, volcano, gravity, and flood, the sediments collapse, and then, large-scale sandy debris flow and turbidite sandstone formation. In the southwest of the study area, the slope is slow, the provenance is insufficient, and braided river delta deposits are mainly developed. Therefore, the collapse of turbidite sandstone is easy to form. The sand body is small in scale and the small-scale slump body is formed at the foot of slope.
From the shore to the middle of the lake basin, there were three stages of large-scale sandy debris flow, turbidity current, and mixed event flow. In the near end, the multi-phase superimposed sandy debris flow sand body is the main body with large thickness and good transverse continuity. The middle part is dominated by sandy debris flow and turbidity flow sand bodies with large thickness and relatively good transverse continuity. At the far end, turbidity current and mixed event current are the main body, with small thickness and poor transverse continuity.

Sedimentary mode of deep water gravity flow sand body in Yanchang Formation, Ordos Basin.
5.3 Evaluation of reservoir and oil-bearing properties
According to the NMR fluid saturation tests, the oil-bearing properties of sand bodies of the Chang 63 sub-member are divided into the following categories: class I (good), with mobile fluid saturation >65%; class II (relatively good), with mobile fluid saturation distribution between 50 and 65%; class III (moderate), with mobile fluid saturation between 35 and 50%; class IV (poor), with mobile fluid saturation between 20 and 35%; class V (very poor), with mobile fluid saturation <20%.
The results show that the better the physical properties of sandstone, the higher the mobile fluid saturation, and the better the oil-bearing property. The comparison shows that permeability has more influence on the saturation of mobile fluid. For example, in B259 and B269 wells, there is little difference in sand porosity, but the permeability difference is more than ten times. The mobile fluid saturation of well B259 with higher permeability reaches 46.55%, while that of well B269 with lower permeability is only 2.16% (Figure 13).

T2 spectra of moving fluid in sandstone samples based on NMR experiments. Notes: (a) sample collected from well 259, 2187.3 m; (b) sample collected from well 269, 1943.9 m; (c) sample collected from well 470, 2148.79 m; (d) sample collected from well 480, 2004.4 m; (e) sample collected from well S141, 2165.48 m; and (f) sample collected from well 463, 1984.34 m.
According to the correlation analysis of porosity, permeability, and mobile fluid saturation (Figure 14), the oil-bearing property of the sand body is mainly controlled by permeability. The correlation between mobile fluid saturation and permeability is high. The higher the permeability, the higher the mobile fluid saturation and the better the oil content of the sand body (Figure 14).

Relationship between petrophysical properties and mobile fluid saturation of the target layer. Notes: (a) With the increase of porosity, the mobile fluid saturation tends to decrease slightly and (b) with the increase of permeability, the mobile fluid saturation tends to increase gradually, and the correlation coefficient R 2 is 0.68.
For ultra-low permeability reservoir, heterogeneity is an important factor to determine its oil content. If the heterogeneity of reservoir is weak, the oil content is good. The higher the heterogeneity, the worse the oil content. It is found that the larger the permeability range and standard deviation is, the lower the test oil production will be. This indicates that the strength of reservoir heterogeneity also controls the level of oil production (Figure 15).
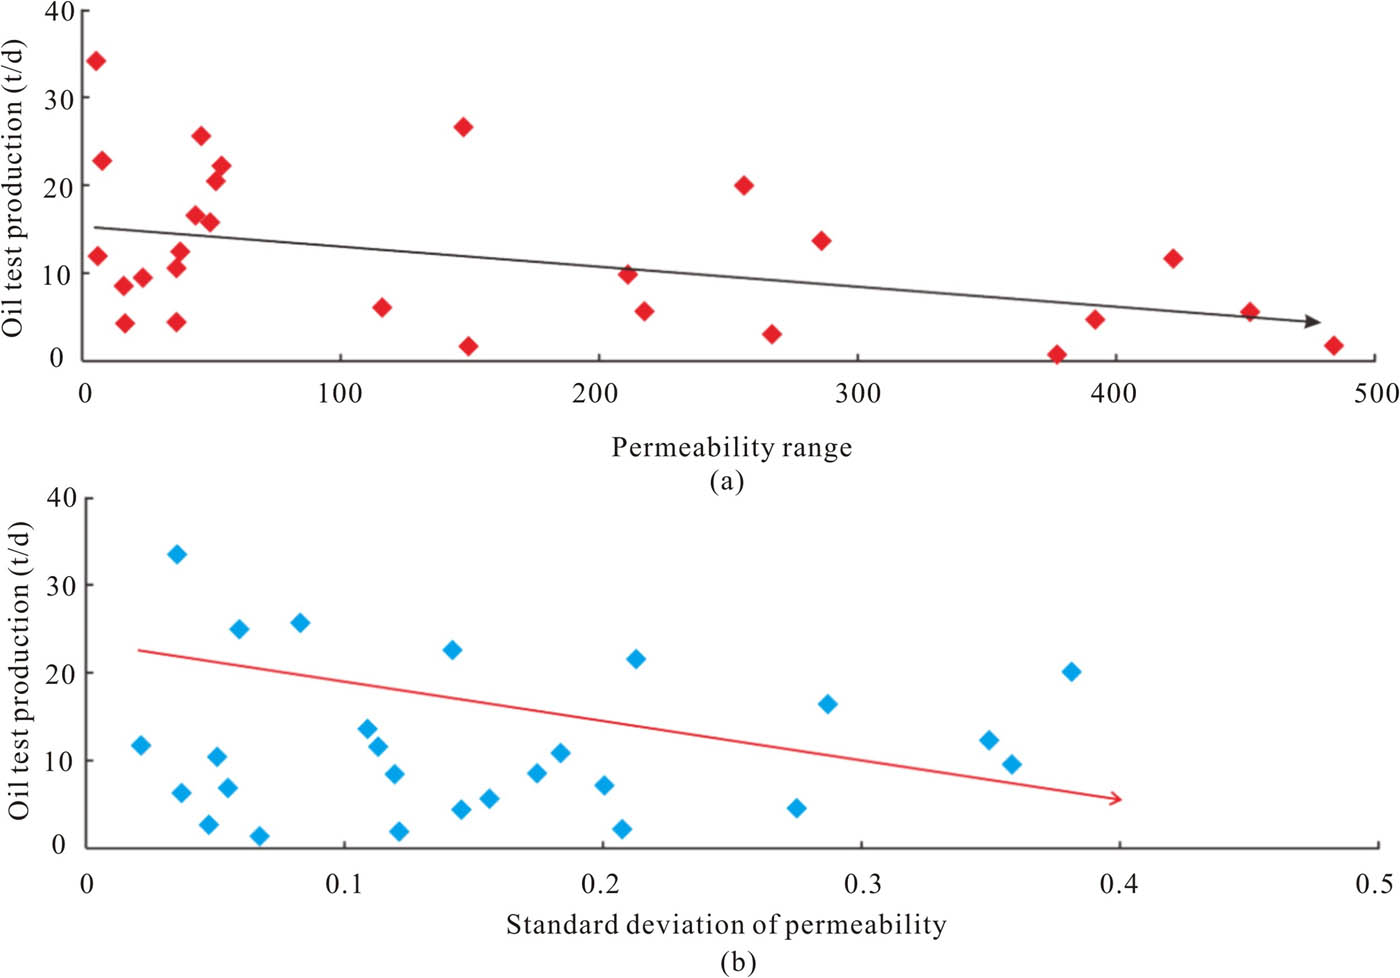
Relationship between permeability heterogeneity and oil test production. Notes: (a) permeability range and (b) standard deviation of permeability.
Combined with the sedimentary and reservoir characteristics of gravity flow sand body, the physical properties and oil content of sandy debris flow sand body are better than turbidity flow sand body. There are mainly three reasons for this:
First, the proportion of debris in the sand body of sandy debris flow is high, and the content of clastic particles is generally more than 70% according to thin section statistics. The content of mica in mechanical deposition is low, which is conducive to the formation of reservoir pores. The proportion of debris in turbidity current sediments is relatively low, and the content of debris particles is generally less than 65% according to thin section statistics. The content of fine-grained material and flake mica in mechanical deposition is high, which is not conducive to the formation of pores.
Second, sandy debris flow belongs to mass transport. In the process of bulk flow transport, the sandy debris flow sedimentary sand is involved in some adjacent mudstone layers under the action of plastic shear, resulting in lithologic mixing. However, the lithologic mixing of sandy debris flow is not sufficient, so some pores will be preserved. Especially for massive sand bodies with large thickness, the mixing at the top and bottom is more sufficient. In the middle part, the homogenization mixing is weak and more pores are retained, which also leads to the high oil content of the central sand body. Turbidity deposition, however, belongs to fluid transport (a kind of liquid flow, whose sediment is supported by liquid turbulence). Fine particles and impurities are evenly dispersed and filled in the pores, resulting in serious pore damage.
Finally, gravity flows, which are dense at the beginning, become less dense later as detrital sediments unload, allowing them to be transported to distant regions. Compared with sandy debris flow, turbidity current deposits carry longer distances and are relatively thin. Therefore, the single layer thickness of turbidity sand body is relatively thin, generally less than 0.5 m, and the particle size is relatively fine. According to thin section statistics, the particle size of the debris is between 0.03 and 0.15 mm. The thickness of single layer of sandy debris flow sand body is large, generally greater than 0.5 m, and the particle size of the debris is between 0.03 and 0.3 mm. Therefore, the physical property of turbidity flow sand body is worse than that of sandy debris flow sand body.
6 Conclusions
Sandy debris flow, turbidite flow, and mixed event flow present different superposition combination modes on vertical gravity flow deposition of the Chang 63 sub-member in the Huaqing area. The lithofacies of the gravity flow sandstone complex is mainly affected by lake level fluctuation, provenance supply, and hydrodynamic conditions. According to the formation conditions, sedimentary types and distribution characteristics of deep water gravity flow sand bodies, their three-dimensional sedimentary mode is established.
It is found that the physical and oil-bearing properties of the sandy debris flow sand body are better than those of the turbidity flow sand body. The reason is that the proportion of debris in the sandy debris flow is high, and the content of debris particles is generally greater than 70%, which is conducive to the formation of pores. Second, sandy debris flow belongs to block transport, and the mixing of lithology is not sufficient in the process of block flow transport, so some pores will be preserved. Finally, gravity flows, which are dense at the beginning, become less dense later as detrital sediments unload, allowing them to be transported to distant regions.
The physical and oil-bearing properties of the sandy debris flow sand body are better than those of the turbidity flow sand body.
-
Funding information: This research was financially supported by the Forward Looking Basic Strategic Technology Research Projects of China National Petroleum Corporation (Study on Reservoir Forming Law and the Key Technology of Lithologic Stratigraphic Oil and Gas Reservoirs) (No. 2021DJ0406).
-
Author contributions: Jianbo Liao is responsible for the idea and organization of this manuscript. Liwen Long are responsible for Formal analysis. Zedong Zhu, Sujuan Liang, Haoyuan Wei, and Leyi Zhao are responsible for Data curation.
-
Conflict of interest: There is no conflict of interest in this study.
-
Data availability statement: The original contributions presented in the study are included; further inquiries can be directed to the corresponding authors.
References
[1] Baas JH, Best JL, Peakall J. Depositional processes, bedform development and hybrid bed formation in rapidly decelerated cohesive (mud-sand) sediment flows. Sedimentology. 2011;58(7):1953–87.10.1111/j.1365-3091.2011.01247.xSearch in Google Scholar
[2] Cao L, Yao Y, Cui C, Sun Q. Characteristics of In-Situ Stress and its Controls on Coalbed Methane Development in the southeastern Qinshui Basin, North China. Energ Geosci. 2020;1(1–2):69–80. 10.1016/j.engeos.2020.05.003.Search in Google Scholar
[3] Liu ZL, Fan AP, Li YJ, Du ZW, Zhao ZJ, Zhang T. Constraints of clastic component difference on diagenesis: A case study of sandstone reservoirs in Dong-2 Block of the Sulige Gasfield, Ordos Basin. Nat Gas Ind. 2015;35:30–8.Search in Google Scholar
[4] Meiburg E, Kneller B. Turbidity currents and their deposits. Annu Rev Fluid Mech. 2010;42:135–56.10.1146/annurev-fluid-121108-145618Search in Google Scholar
[5] Shanmugam G. High-density turbidity currents: Are they sandy debris flows? J Sediment Res. 1996;66:2–10.10.1306/D426828E-2B26-11D7-8648000102C1865DSearch in Google Scholar
[6] Chen Y, Wang Y, Guo M. Differential enrichment mechanism of organic matters in the marine-continental transitional shale in northeastern Ordos Basin, China: Control of sedimentary environments. J Nat Gas Sci Eng. 2020;83:103625.10.1016/j.jngse.2020.103625Search in Google Scholar
[7] Guo H, Ji M, Sun Z, Zhou Z. Energy evolution characteristics of red sandstone under cyclic load. J Min Strata Control Eng. 2021;3(4):043019. 10.13532/j.jmsce.cn10-1638/td.20211008.001.Search in Google Scholar
[8] Dasgupta P. Sediment gravity flow—the conceptual problems. Earth-Sci Rev. 2003;62(3/4):265–81.10.1016/S0012-8252(02)00160-5Search in Google Scholar
[9] Dong S, Zeng L, Lyu W, Xia D, Liu G, Wu Y, et al. Fracture identification and evaluation using conventional logs in tight sandstones: A case study in the Ordos Basin, China. Energy Geosci. 2020;1(3–4):115–23. 10.1016/j.engeos.2020.06.003.Search in Google Scholar
[10] McBride EF. Quartz cement in sandstones: A review. Earth- Sci Rev. 1989;26:69–112.10.1016/0012-8252(89)90019-6Search in Google Scholar
[11] Chen G, Li T, Yang L, Zhang G, Li J, Dong H. Mechanical properties and failure mechanism of combined bodies with different coal-rock ratios and combinations. J Min Strata Control Eng. 2021;3(2):023522.Search in Google Scholar
[12] Jazi SD, Wells MG. Dynamics of settling‐riven convection beneath a sediment‐laden buoyant overflow: Implications for the length‐scale of deposition in lakes and the coast‐ al ocean. Sedimentology. 2020;67(1):699–720.10.1111/sed.12660Search in Google Scholar
[13] Jesús O, Jeannette W, Michael HG. Recognition criteria for distinguishing between hemipelagic and pelagic mudrocks in the characterization of deep-water reservoir heterogeneity. AAPG Bull. 2013;97(10):1785–803.10.1306/04221312086Search in Google Scholar
[14] Mulder T, Savoye B, Syvitski JPM. Numerical modelling of a mid-sized gravity flow: The 1979 Nice turbidity current (dynamics, processes, sediment budget and seafloor impact). Sedimentology. 1997;44(2):305–26.10.1111/j.1365-3091.1997.tb01526.xSearch in Google Scholar
[15] Mayall M, Kane IA, McCaffrey WD. Internal architecture, bedforms and geometry of turbidite channels. A conference held at the Geological Society, London, June 20-21st 2011. Mar Pet Geol. 2013;41:1–6.10.1016/j.marpetgeo.2012.10.004Search in Google Scholar
[16] Mutti E. Thin-bedded plumites: An overlooked deep-water de‐ posit. J Mediterr Earth Sci. 2019;11:61–80.Search in Google Scholar
[17] Morozov VP, Jin Z, Liang X, Korolev EA, Liu Q, Kolchugin AN, et al. Comparison of source rocks from the Lower Silurian Longmaxi Formation in the Yangzi Platform and the Upper Devonian Semiluksk Formation in East European Platform. Energy Geosci. 2021;2(1):63–72. 10.1016/j.engeos.2020.10.001.Search in Google Scholar
[18] Yin S, Wu Z. Geomechanical simulation of low-order fracture of tight sandstone. Mar Pet Geol. 2020;100:34. 1–10.Search in Google Scholar
[19] Stow DAV, Johansson M. Deep-water massive sands:nature, origin and hydrocarbon implications. Mar Pet Geol. 2000;17(2):145–74.10.1016/S0264-8172(99)00051-3Search in Google Scholar
[20] Yin S, Dong L, Yang X, Wang R. Experimental investigation of the petrophysical properties, minerals, elements and pore structures in tight sandstones. J Nat Gas Sci Eng. 2020;76(1):1–14.10.1016/j.jngse.2020.103189Search in Google Scholar
[21] Kuvaas B, Leitchenkov G. Glaciomarine turbidite and current controlled deposits in Prydz Bay, Antarctica. Mar Geol. 1992;108(3/4):365–81.10.1016/0025-3227(92)90205-VSearch in Google Scholar
[22] Li L, Huang B, Li Y, Hu R, Li X. Multi-scale modeling of shale laminas and fracture networks in the Yanchang formation, Southern Ordos Basin, China. Eng Geol. 2018;243:231–40.10.1016/j.enggeo.2018.07.010Search in Google Scholar
[23] Asante-Okyere S, Ziggah YY, Marfo SA. Improved total organic carbon convolutional neural network model based on mineralogy and geophysical well log data. Unconv Resour. 2021;1:1–8. 10.1016/j.uncres.2021.04.001.Search in Google Scholar
[24] Lai J, Wang GW, Wang ZY, Chen J, Pang XJ, Wang SC, et al. A review on pore structure characterization in tight sandstones. Earth-Sci Rev. 2018;177:436–57.10.1016/j.earscirev.2017.12.003Search in Google Scholar
[25] Li J, Li H, Yang C, Wu YJ, Gao Z, Jiang SL. Geological characteristics and controlling factors of deep shale gas enrichment of the Wufeng-Longmaxi Formation in the southern Sichuan Basin, China. Lithosphere. 2022;2022:4737801. 10.2113/1970/4737801.Search in Google Scholar
[26] Yin S, Tian T, Wu Z, Li Q. Developmental characteristics and distribution law of fractures in a tight sandstone reservoir in a low-amplitude tectonic zone, eastern Ordos Basin, China. Geol J. 2020;55:1546–62.10.1002/gj.3521Search in Google Scholar
[27] Kane IA, Pontén ASM. Submarine transitional flow deposits in the Paleogene Gulf of Mexico. Geology. 2012;40(12):1119–22.10.1130/G33410.1Search in Google Scholar
[28] Katz B, Gao L, Little J, Zhao YR. Geology still matters – Unconventional petroleum system disappointments and failures. Unconv Resour. 2021;1:18–38. 10.1016/j.uncres.2021.12.001.Search in Google Scholar
[29] Kirmani F, Raoof Gholami A, Haidar M, Fareed C. Analyzing the effect of steam quality and injection temperature on the performance of steam flooding. Energy Geosci. 2021;2(1):83–6. 10.1016/j.engeos.2020.11.002.Search in Google Scholar
[30] Parsons JD, Bush JWM, Syvitski JPM. Hyperpycnal plume formation from riverine outflows with small sediment concentrations. Sedimentology. 2001;48(2):465–78.10.1046/j.1365-3091.2001.00384.xSearch in Google Scholar
[31] Pattison SAJ, Bruce AR, Hoffman TA. Evidence of across‐helf transport of fine ‐grained sediments: Turbidite‐filled shelf channels in the Campanian Aberdeen Member, Book Cliffs, Utah, USA. Sedimentology. 2007;54(5):1033–64.10.1111/j.1365-3091.2007.00871.xSearch in Google Scholar
[32] Pritchard D, Gladstone C. Reversing buoyancy in turbidity currents: developing a hypothesis for flow transformation and for deposit facies and architecture. Mar & Pet Geol. 2009;26(10):1997–2010.10.1016/j.marpetgeo.2009.02.010Search in Google Scholar
[33] Qiao J, Zeng J, Jiang S, Wang Y. Impacts of sedimentology and diagenesis on pore structure and reservoir quality in tight oil sandstone reservoirs: Implications for macroscopic and microscopic heterogeneities. Mar Pet Geol. 2020;111:279–300. 10.1016/j.marpetgeo.2019.08.008.Search in Google Scholar
[34] Shanmugam G. New perspectives on deep-water sandstones: Implications. Pet Explor Dev. 2013;40(3):316–32.10.1016/S1876-3804(13)60038-5Search in Google Scholar
[35] Shanmugam G. Ten turbidite myths. Earth Sci Rev. 2002;58(4):311–41.10.1016/S0012-8252(02)00065-XSearch in Google Scholar
[36] Stevenson CJ, Peakall J. Effects of topography on lofting gravity flows:Implications for the deposition of deep-water massive sands. Mar Pet Geol. 2010;27(7):1366–78.10.1016/j.marpetgeo.2010.03.010Search in Google Scholar
[37] Talling PJ, Paull CK, Piper DJW. How are subaqueous sediment density flows triggered, what is their internal structure and how does it evolve? Direct observations from monitoring of active flows. Earth-Sci Rev. 2013;125:244–87.10.1016/j.earscirev.2013.07.005Search in Google Scholar
[38] Talling PJ. On the triggers, resulting flow types and frequencies of subaqueous sediment density flows in different settings. Mar Geol. 2014;352:155–82.10.1016/j.margeo.2014.02.006Search in Google Scholar
[39] Lan S, Song D, Li Z, Liu Y. Experimental study on acoustic emission characteristics of fault slip process based on damage factor. J Min Strata Control Eng. 2021;3(3):033024. 10.13532/j.jmsce.cn10-1638/td.20210510.002.Search in Google Scholar
[40] Li H, Zhou JL, Mou XY, Guo HX, Wang XX, An HY, et al. Pore structure and fractal characteristics of the marine shale of the Longmaxi Formation in the Changning Area, Southern Sichuan Basin, China. Front Earth Sci. 2022;10:1018274. 10.3389/feart.2022.1018274.Search in Google Scholar
[41] Nieves L, Elyseu F, Goulart S, Pereira M, Valvassori E, Bernardin A. Use of fly and bottom ashes from a thermoelectrical plant in the synthesis of geopolymers: Evaluation of reaction efficiency. Energy Geosci. 2021;2(2):167–73. 10.1016/j.engeos.2020.09.004.Search in Google Scholar
[42] Yuan H, Yin S, Dong L, Tan C. Restoration of the pre-Jurassic paleogeomorphology and its control on hydrocarbon distribution in western Ordos Basin. Energy Geosci. 2022;3(4):485–94. 10.1016/j.engeos.2021.06.007.Search in Google Scholar
[43] Zavala C, Arcuri M. Intrabasinal and extrabasinal turbidites: Origin and distinctive characteristics. Sediment Geol. 2016;337:36–54.10.1016/j.sedgeo.2016.03.008Search in Google Scholar
[44] Zeng WT, Zhang JC, Ding WL, Zhao S, Zhang YQ, Liu ZJ, et al. Fracture development in Paleozoic shale of Chongqing area (South China). Part one: Fracture characteristics and comparative analysis of main controlling factors. J Asian Earth Sci. 2013;75:251–66.10.1016/j.jseaes.2013.07.014Search in Google Scholar
[45] Wang J, Wang X. Seepage characteristic and fracture development of protected seam caused by mining protecting strata. J Min Strata Control Eng. 2021;3(3):033511. 10.13532/j.jmsce.cn10-1638/td.20201215.001.Search in Google Scholar
[46] Wignall PB, Twitchett RJ. Oceanic anoxia and the end Permian mass extinction. Science. 1996;272:1155–8.10.1126/science.272.5265.1155Search in Google Scholar PubMed
[47] Xiao Z, Ding W, Liu J, Tian M, Yin S, Zhou X, et al. A fracture identification method for low-permeability sandstone based on R/S analysis and the finite difference method: A case study from the Chang 6 reservoir in Huaqing oilfield, Ordos Basin. J Pet Sci Eng. 2019;174:1169–78.10.1016/j.petrol.2018.12.017Search in Google Scholar
[48] Xie X, Heller PL. U–Pb detrital zircon geochronology and its implications: The early Late Triassic Yanchang Formation, south Ordos Basin, China. J Asian Earth Sci. 2013;64:86–98.10.1016/j.jseaes.2012.11.045Search in Google Scholar
[49] Wang W, Lyu Q, Fan T, Xu X, Qu X, Zhang Y, et al. Characteristics of a the tuffaceous shale oil reservoir and its sweet spots: A case study of the Tiaohu depression in the Santanghu Basin. Unconv Resour. 2022;2:192–9. 10.1016/j.uncres.2022.10.004.Search in Google Scholar
[50] Xu JP, Sequeiros OE, Noble MA. Sediment concentrations, flow conditions, and downstream evolution of two turbidity currents, Monterey Canyon, USA. Deep Sea Res Part I: Oceanogr Res Pap. 2014;89:11–34.10.1016/j.dsr.2014.04.001Search in Google Scholar
[51] Xue F, Liu X, Wang T. Research on anchoring effect of jointed rock mass based on 3D printing and digital speckle technology. J Min Strata Control Eng. 2021;3(2):023013. 10.13532/j.jmsce.cn10-1638/td.20201020.001.Search in Google Scholar
[52] Shanmugam G. 50 years of the turbidite Paradigm (1950s-1990s): deep-water processes and facies models-acritical perspective. Mar Pet Geol. 2000;17(2):285–342.10.1016/S0264-8172(99)00011-2Search in Google Scholar
[53] Vafaie A, Kivi IR, Moallemi SA, Habibnia B. Permeability prediction in tight gas reservoirs based on pore structure characteristics: A case study from South Western Iran. Unconv Resour. 2021;1:9–17. 10.1016/j.uncres.2021.08.001.Search in Google Scholar
[54] Walker RG. Deep-water sandstone facies and ancient submarine fans: Models for exploration for stratigraphic traps. Am Assoc Pet Geol Bull. 1978;62(6):932–66.10.1306/C1EA4F77-16C9-11D7-8645000102C1865DSearch in Google Scholar
© 2024 the author(s), published by De Gruyter
This work is licensed under the Creative Commons Attribution 4.0 International License.
Articles in the same Issue
- Regular Articles
- Theoretical magnetotelluric response of stratiform earth consisting of alternative homogeneous and transitional layers
- The research of common drought indexes for the application to the drought monitoring in the region of Jin Sha river
- Evolutionary game analysis of government, businesses, and consumers in high-standard farmland low-carbon construction
- On the use of low-frequency passive seismic as a direct hydrocarbon indicator: A case study at Banyubang oil field, Indonesia
- Water transportation planning in connection with extreme weather conditions; case study – Port of Novi Sad, Serbia
- Zircon U–Pb ages of the Paleozoic volcaniclastic strata in the Junggar Basin, NW China
- Monitoring of mangrove forests vegetation based on optical versus microwave data: A case study western coast of Saudi Arabia
- Microfacies analysis of marine shale: A case study of the shales of the Wufeng–Longmaxi formation in the western Chongqing, Sichuan Basin, China
- Multisource remote sensing image fusion processing in plateau seismic region feature information extraction and application analysis – An example of the Menyuan Ms6.9 earthquake on January 8, 2022
- Identification of magnetic mineralogy and paleo-flow direction of the Miocene-quaternary volcanic products in the north of Lake Van, Eastern Turkey
- Impact of fully rotating steel casing bored pile on adjacent tunnels
- Adolescents’ consumption intentions toward leisure tourism in high-risk leisure environments in riverine areas
- Petrogenesis of Jurassic granitic rocks in South China Block: Implications for events related to subduction of Paleo-Pacific plate
- Differences in urban daytime and night block vitality based on mobile phone signaling data: A case study of Kunming’s urban district
- Random forest and artificial neural network-based tsunami forests classification using data fusion of Sentinel-2 and Airbus Vision-1 satellites: A case study of Garhi Chandan, Pakistan
- Integrated geophysical approach for detection and size-geometry characterization of a multiscale karst system in carbonate units, semiarid Brazil
- Spatial and temporal changes in ecosystem services value and analysis of driving factors in the Yangtze River Delta Region
- Deep fault sliding rates for Ka-Ping block of Xinjiang based on repeating earthquakes
- Improved deep learning segmentation of outdoor point clouds with different sampling strategies and using intensities
- Platform margin belt structure and sedimentation characteristics of Changxing Formation reefs on both sides of the Kaijiang-Liangping trough, eastern Sichuan Basin, China
- Enhancing attapulgite and cement-modified loess for effective landfill lining: A study on seepage prevention and Cu/Pb ion adsorption
- Flood risk assessment, a case study in an arid environment of Southeast Morocco
- Lower limits of physical properties and classification evaluation criteria of the tight reservoir in the Ahe Formation in the Dibei Area of the Kuqa depression
- Evaluation of Viaducts’ contribution to road network accessibility in the Yunnan–Guizhou area based on the node deletion method
- Permian tectonic switch of the southern Central Asian Orogenic Belt: Constraints from magmatism in the southern Alxa region, NW China
- Element geochemical differences in lower Cambrian black shales with hydrothermal sedimentation in the Yangtze block, South China
- Three-dimensional finite-memory quasi-Newton inversion of the magnetotelluric based on unstructured grids
- Obliquity-paced summer monsoon from the Shilou red clay section on the eastern Chinese Loess Plateau
- Classification and logging identification of reservoir space near the upper Ordovician pinch-out line in Tahe Oilfield
- Ultra-deep channel sand body target recognition method based on improved deep learning under UAV cluster
- New formula to determine flyrock distance on sedimentary rocks with low strength
- Assessing the ecological security of tourism in Northeast China
- Effective reservoir identification and sweet spot prediction in Chang 8 Member tight oil reservoirs in Huanjiang area, Ordos Basin
- Detecting heterogeneity of spatial accessibility to sports facilities for adolescents at fine scale: A case study in Changsha, China
- Effects of freeze–thaw cycles on soil nutrients by soft rock and sand remodeling
- Vibration prediction with a method based on the absorption property of blast-induced seismic waves: A case study
- A new look at the geodynamic development of the Ediacaran–early Cambrian forearc basalts of the Tannuola-Khamsara Island Arc (Central Asia, Russia): Conclusions from geological, geochemical, and Nd-isotope data
- Spatio-temporal analysis of the driving factors of urban land use expansion in China: A study of the Yangtze River Delta region
- Selection of Euler deconvolution solutions using the enhanced horizontal gradient and stable vertical differentiation
- Phase change of the Ordovician hydrocarbon in the Tarim Basin: A case study from the Halahatang–Shunbei area
- Using interpretative structure model and analytical network process for optimum site selection of airport locations in Delta Egypt
- Geochemistry of magnetite from Fe-skarn deposits along the central Loei Fold Belt, Thailand
- Functional typology of settlements in the Srem region, Serbia
- Hunger Games Search for the elucidation of gravity anomalies with application to geothermal energy investigations and volcanic activity studies
- Addressing incomplete tile phenomena in image tiling: Introducing the grid six-intersection model
- Evaluation and control model for resilience of water resource building system based on fuzzy comprehensive evaluation method and its application
- MIF and AHP methods for delineation of groundwater potential zones using remote sensing and GIS techniques in Tirunelveli, Tenkasi District, India
- New database for the estimation of dynamic coefficient of friction of snow
- Measuring urban growth dynamics: A study in Hue city, Vietnam
- Comparative models of support-vector machine, multilayer perceptron, and decision tree predication approaches for landslide susceptibility analysis
- Experimental study on the influence of clay content on the shear strength of silty soil and mechanism analysis
- Geosite assessment as a contribution to the sustainable development of Babušnica, Serbia
- Using fuzzy analytical hierarchy process for road transportation services management based on remote sensing and GIS technology
- Accumulation mechanism of multi-type unconventional oil and gas reservoirs in Northern China: Taking Hari Sag of the Yin’e Basin as an example
- TOC prediction of source rocks based on the convolutional neural network and logging curves – A case study of Pinghu Formation in Xihu Sag
- A method for fast detection of wind farms from remote sensing images using deep learning and geospatial analysis
- Spatial distribution and driving factors of karst rocky desertification in Southwest China based on GIS and geodetector
- Physicochemical and mineralogical composition studies of clays from Share and Tshonga areas, Northern Bida Basin, Nigeria: Implications for Geophagia
- Geochemical sedimentary records of eutrophication and environmental change in Chaohu Lake, East China
- Research progress of freeze–thaw rock using bibliometric analysis
- Mixed irrigation affects the composition and diversity of the soil bacterial community
- Examining the swelling potential of cohesive soils with high plasticity according to their index properties using GIS
- Geological genesis and identification of high-porosity and low-permeability sandstones in the Cretaceous Bashkirchik Formation, northern Tarim Basin
- Usability of PPGIS tools exemplified by geodiscussion – a tool for public participation in shaping public space
- Efficient development technology of Upper Paleozoic Lower Shihezi tight sandstone gas reservoir in northeastern Ordos Basin
- Assessment of soil resources of agricultural landscapes in Turkestan region of the Republic of Kazakhstan based on agrochemical indexes
- Evaluating the impact of DEM interpolation algorithms on relief index for soil resource management
- Petrogenetic relationship between plutonic and subvolcanic rocks in the Jurassic Shuikoushan complex, South China
- A novel workflow for shale lithology identification – A case study in the Gulong Depression, Songliao Basin, China
- Characteristics and main controlling factors of dolomite reservoirs in Fei-3 Member of Feixianguan Formation of Lower Triassic, Puguang area
- Impact of high-speed railway network on county-level accessibility and economic linkage in Jiangxi Province, China: A spatio-temporal data analysis
- Estimation model of wild fractional vegetation cover based on RGB vegetation index and its application
- Lithofacies, petrography, and geochemistry of the Lamphun oceanic plate stratigraphy: As a record of the subduction history of Paleo-Tethys in Chiang Mai-Chiang Rai Suture Zone of Thailand
- Structural features and tectonic activity of the Weihe Fault, central China
- Application of the wavelet transform and Hilbert–Huang transform in stratigraphic sequence division of Jurassic Shaximiao Formation in Southwest Sichuan Basin
- Structural detachment influences the shale gas preservation in the Wufeng-Longmaxi Formation, Northern Guizhou Province
- Distribution law of Chang 7 Member tight oil in the western Ordos Basin based on geological, logging and numerical simulation techniques
- Evaluation of alteration in the geothermal province west of Cappadocia, Türkiye: Mineralogical, petrographical, geochemical, and remote sensing data
- Numerical modeling of site response at large strains with simplified nonlinear models: Application to Lotung seismic array
- Quantitative characterization of granite failure intensity under dynamic disturbance from energy standpoint
- Characteristics of debris flow dynamics and prediction of the hazardous area in Bangou Village, Yanqing District, Beijing, China
- Rockfall mapping and susceptibility evaluation based on UAV high-resolution imagery and support vector machine method
- Statistical comparison analysis of different real-time kinematic methods for the development of photogrammetric products: CORS-RTK, CORS-RTK + PPK, RTK-DRTK2, and RTK + DRTK2 + GCP
- Hydrogeological mapping of fracture networks using earth observation data to improve rainfall–runoff modeling in arid mountains, Saudi Arabia
- Petrography and geochemistry of pegmatite and leucogranite of Ntega-Marangara area, Burundi, in relation to rare metal mineralisation
- Prediction of formation fracture pressure based on reinforcement learning and XGBoost
- Hazard zonation for potential earthquake-induced landslide in the eastern East Kunlun fault zone
- Monitoring water infiltration in multiple layers of sandstone coal mining model with cracks using ERT
- Study of the patterns of ice lake variation and the factors influencing these changes in the western Nyingchi area
- Productive conservation at the landslide prone area under the threat of rapid land cover changes
- Sedimentary processes and patterns in deposits corresponding to freshwater lake-facies of hyperpycnal flow – An experimental study based on flume depositional simulations
- Study on time-dependent injectability evaluation of mudstone considering the self-healing effect
- Detection of objects with diverse geometric shapes in GPR images using deep-learning methods
- Behavior of trace metals in sedimentary cores from marine and lacustrine environments in Algeria
- Spatiotemporal variation pattern and spatial coupling relationship between NDVI and LST in Mu Us Sandy Land
- Formation mechanism and oil-bearing properties of gravity flow sand body of Chang 63 sub-member of Yanchang Formation in Huaqing area, Ordos Basin
- Diagenesis of marine-continental transitional shale from the Upper Permian Longtan Formation in southern Sichuan Basin, China
- Vertical high-velocity structures and seismic activity in western Shandong Rise, China: Case study inspired by double-difference seismic tomography
- Spatial coupling relationship between metamorphic core complex and gold deposits: Constraints from geophysical electromagnetics
- Disparities in the geospatial allocation of public facilities from the perspective of living circles
- Research on spatial correlation structure of war heritage based on field theory. A case study of Jinzhai County, China
- Formation mechanisms of Qiaoba-Zhongdu Danxia landforms in southwestern Sichuan Province, China
- Magnetic data interpretation: Implication for structure and hydrocarbon potentiality at Delta Wadi Diit, Southeastern Egypt
- Deeply buried clastic rock diagenesis evolution mechanism of Dongdaohaizi sag in the center of Junggar fault basin, Northwest China
- Application of LS-RAPID to simulate the motion of two contrasting landslides triggered by earthquakes
- The new insight of tectonic setting in Sunda–Banda transition zone using tomography seismic. Case study: 7.1 M deep earthquake 29 August 2023
- The critical role of c and φ in ensuring stability: A study on rockfill dams
- Evidence of late quaternary activity of the Weining-Shuicheng Fault in Guizhou, China
- Extreme hydroclimatic events and response of vegetation in the eastern QTP since 10 ka
- Spatial–temporal effect of sea–land gradient on landscape pattern and ecological risk in the coastal zone: A case study of Dalian City
- Study on the influence mechanism of land use on carbon storage under multiple scenarios: A case study of Wenzhou
- A new method for identifying reservoir fluid properties based on well logging data: A case study from PL block of Bohai Bay Basin, North China
- Comparison between thermal models across the Middle Magdalena Valley, Eastern Cordillera, and Eastern Llanos basins in Colombia
- Mineralogical and elemental analysis of Kazakh coals from three mines: Preliminary insights from mode of occurrence to environmental impacts
- Chlorite-induced porosity evolution in multi-source tight sandstone reservoirs: A case study of the Shaximiao Formation in western Sichuan Basin
- Predicting stability factors for rotational failures in earth slopes and embankments using artificial intelligence techniques
- Origin of Late Cretaceous A-type granitoids in South China: Response to the rollback and retreat of the Paleo-Pacific plate
- Modification of dolomitization on reservoir spaces in reef–shoal complex: A case study of Permian Changxing Formation, Sichuan Basin, SW China
- Geological characteristics of the Daduhe gold belt, western Sichuan, China: Implications for exploration
- Rock physics model for deep coal-bed methane reservoir based on equivalent medium theory: A case study of Carboniferous-Permian in Eastern Ordos Basin
- Enhancing the total-field magnetic anomaly using the normalized source strength
- Shear wave velocity profiling of Riyadh City, Saudi Arabia, utilizing the multi-channel analysis of surface waves method
- Effect of coal facies on pore structure heterogeneity of coal measures: Quantitative characterization and comparative study
- Inversion method of organic matter content of different types of soils in black soil area based on hyperspectral indices
- Detection of seepage zones in artificial levees: A case study at the Körös River, Hungary
- Tight sandstone fluid detection technology based on multi-wave seismic data
- Characteristics and control techniques of soft rock tunnel lining cracks in high geo-stress environments: Case study of Wushaoling tunnel group
- Influence of pore structure characteristics on the Permian Shan-1 reservoir in Longdong, Southwest Ordos Basin, China
- Study on sedimentary model of Shanxi Formation – Lower Shihezi Formation in Da 17 well area of Daniudi gas field, Ordos Basin
- Multi-scenario territorial spatial simulation and dynamic changes: A case study of Jilin Province in China from 1985 to 2030
- Review Articles
- Major ascidian species with negative impacts on bivalve aquaculture: Current knowledge and future research aims
- Prediction and assessment of meteorological drought in southwest China using long short-term memory model
- Communication
- Essential questions in earth and geosciences according to large language models
- Erratum
- Erratum to “Random forest and artificial neural network-based tsunami forests classification using data fusion of Sentinel-2 and Airbus Vision-1 satellites: A case study of Garhi Chandan, Pakistan”
- Special Issue: Natural Resources and Environmental Risks: Towards a Sustainable Future - Part I
- Spatial-temporal and trend analysis of traffic accidents in AP Vojvodina (North Serbia)
- Exploring environmental awareness, knowledge, and safety: A comparative study among students in Montenegro and North Macedonia
- Determinants influencing tourists’ willingness to visit Türkiye – Impact of earthquake hazards on Serbian visitors’ preferences
- Application of remote sensing in monitoring land degradation: A case study of Stanari municipality (Bosnia and Herzegovina)
- Optimizing agricultural land use: A GIS-based assessment of suitability in the Sana River Basin, Bosnia and Herzegovina
- Assessing risk-prone areas in the Kratovska Reka catchment (North Macedonia) by integrating advanced geospatial analytics and flash flood potential index
- Analysis of the intensity of erosive processes and state of vegetation cover in the zone of influence of the Kolubara Mining Basin
- GIS-based spatial modeling of landslide susceptibility using BWM-LSI: A case study – city of Smederevo (Serbia)
- Geospatial modeling of wildfire susceptibility on a national scale in Montenegro: A comparative evaluation of F-AHP and FR methodologies
- Geosite assessment as the first step for the development of canyoning activities in North Montenegro
- Urban geoheritage and degradation risk assessment of the Sokograd fortress (Sokobanja, Eastern Serbia)
- Multi-hazard modeling of erosion and landslide susceptibility at the national scale in the example of North Macedonia
- Understanding seismic hazard resilience in Montenegro: A qualitative analysis of community preparedness and response capabilities
- Forest soil CO2 emission in Quercus robur level II monitoring site
- Characterization of glomalin proteins in soil: A potential indicator of erosion intensity
- Power of Terroir: Case study of Grašac at the Fruška Gora wine region (North Serbia)
- Special Issue: Geospatial and Environmental Dynamics - Part I
- Qualitative insights into cultural heritage protection in Serbia: Addressing legal and institutional gaps for disaster risk resilience