Application of remote sensing in monitoring land degradation: A case study of Stanari municipality (Bosnia and Herzegovina)
-
Luka Sabljić
 ,
Tin Lukić
,
Tin Lukić

Abstract
The subject of the research represents the application of remote sensing in monitoring land degradation in the municipality of Stanari in Bosnia and Herzegovina (B&H). The aim of the study is to identify spatial changes during the research period (2017–2023) by processing remote sensing “products.” Within the changes in land use, the focus is placed on alterations resulting from surface mineral resource mining activities. The total approved exploitation area amounts to 3841.08 ha, covering almost a quarter of the municipality (23.89%). Monitoring changes in land use was conducted through the processing of Sentinel-2 images using supervised classification (SC). The classification results were compared with the Dynamic World (DW) dataset. Results indicate significant losses in forested areas, reduced by −7.23% (DW) or −2.43% (SC) at the municipal level and −11.48% (DW) or −5.90% (SC) within the exploitation area. Spatial extents of deforestation were identified and analyzed based on processing the Hansen Global Forest Data Change dataset. The deforestation area, caused by mining activity in B&H over the research period (2001–2021), amounts to 977.94 ha, with 264.25 ha (27.02%) within the Stanari municipality. Over 90% of the cleared forest area is within the exploitation area. High erosion coefficient values (Z) were recorded within the approved exploitation area, coinciding with the spatial coverage of deforestation. Additionally, results obtained using an empirical method for studying mechanical water erosion (W y) indicate a high intensity within the exploitation area. For the approved exploitation area, possibilities for the restoration of degraded land were analyzed, including an overview of activities conducted so far and mapping some of the previously reclaimed areas. The research contributes to a better understanding of spatial changes resulting from mining activities, and the presented data are significant for numerous practical issues, such as sustainable land use planning, spatial planning, protection of forest ecosystems, and the environment.
1 Introduction
The degradation of land implies a reduction in the soil’s capacity for biological, chemical, and economic productivity [1]. It often occurs as a consequence of sudden changes in land use practices. According to Turner et al. [2], land use represents the process of interaction between people and their environment. Changes in land use enable people to exploit natural resources to meet the growing societal needs for food, water, shelter, etc. Unfortunately, such changes often result in environmental degradation, which includes land degradation [3,4].
The process of deforestation plays a significant role within changes in land use with a degrading effect on the environment. The mentioned process involves the clearing of forested areas for alternative land uses [5]. It occurs naturally (e.g., fires) or anthropogenically. Deforestation as a consequence of anthropogenic actions, most commonly occurs in the context of providing enough land for infrastructure, residential, agricultural, or industrial needs. It is present in mining regions where large forested areas are cleared for the exploitation of mineral resources.
Mining regions (also known as resource regions) are geologically defined by an abundance of economically viable mineral resources, and as such, they undergo rapid and significant changes in terms of land use [6]. The change in land use can be caused by a combination of mining and non-mining activities [7], and both types of activities have ecological and societal impacts [8]. The impacts are often highly negative and involve land degradation, biodiversity loss [9,10], as well as population displacement [11]. For example, surface coal mining involves a series of operations that include vegetation removal, topsoil removal, drilling, blasting hard layers above the coal seam, followed by subsequent extraction and transportation of coal [12].
The clearing of forests as an integral part of vegetation removal in mining activities, for the purpose of mineral resource exploitation, significantly contributes to the occurrence and intensification of other forms of land degradation. A significant form of land degradation is soil erosion, which refers to the process of mechanical water erosion [13,14]. Gocić et al. [15] defined soil erosion as a result of the interaction between natural processes and anthropogenic influences, and it represents one of the most widespread and significant forms of land degradation [16,17]. Bezak et al. [18] emphasized that soil erosion poses a significant threat to food security and the sustainable provision of ecosystem services. They also state that, for these reasons, global assessments of soil erosion can provide a significant contribution to understanding this issue. Furthermore, the importance of understanding the degradational consequences of soil erosion has been recognized in international frameworks by incorporating soil erosion assessments into the reports of the Intergovernmental Panel on Climate Change regarding the impacts of climate change on land degradation (Chapter 4 of the Special Report on Climate Change and Land).
Soil erosion is influenced by numerous factors such as topography, climate, soil characteristics, forest cover, and more [17,19,20,21,22,23,24,25,26,27,28,29]. Its occurrence, distribution, and timing are closely linked to anthropogenic factors [30]. Anthropogenic activities such as intensive agriculture, construction, mining, and similar practices cause the degradation of the Earth’s surface, forming areas that are susceptible to excessive soil erosion [31,32,33]. The mentioned anthropogenic activities cause the process of soil erosion with varying intensities [34]. According to Sonter et al. [35], the most destructive anthropogenic activity is mining, which leads to drastic changes in the Earth’s surface during the exploitation of mineral resources, creating challenges in management for the mining industry. Cragg et al. [36] highlighted that within mining activities, due to the process of excavating land, surface exploitation type leads to significantly higher levels of ecological degradation compared to underground exploitation type. For that reason, managing the impacts of changes in land use, namely, mitigating negative effects and increasing positive impacts, signifies an important goal of sustainable development, which poses a challenge for mining companies and regulatory agencies [8].
After concluding the exploitation process, it becomes imperative to determine the approach for restoring degraded land. The remediation and reclamation process plays a crucial and essential role in the restoration and renewal of degraded land [37]. The techniques, methods, and approaches in remediation and reclamation can vary, and their selection depends on the type of mineral resource that has been exploited. The goal of this process is to restore the area to its original purpose to the extent that it is feasible.
The use of Geographic Information Systems (GIS) with remote sensing “products,” such as satellite imagery, enables efficient monitoring of various types of land degradation in mining areas. Compared to traditional field and laboratory monitoring, their advantages are reflected in lower costs, shorter analysis timeframes, and a wide range of possibilities for monitoring changes, especially in larger areas [38,39,40].
Despite the increasing application of remote sensing techniques in monitoring land degradation worldwide, there appears to be a lack of comprehensive studies focusing specifically on the Stanari municipality in Bosnia and Herzegovina (B&H). While there is some comprehensive studies on land degradation in the broader context of B&H, there is a notable dearth of studies that delve into the unique challenges and characteristics of land degradation within the Stanari municipality with the usage of advanced remote sensing techniques and approaches. Therefore, this study strives to fill the existing research gap that needs addressing to better understand and mitigate land degradation in this specific area within the Western Balkans region.
Main research questions on which this study focuses encompass:
What are the spatial and temporal patterns of land degradation in the Stanari municipality, B&H, as observed through remote sensing data?
What are the primary drivers and factors contributing to land degradation within the study area?
How effective are the different remote sensing techniques in monitoring and assessing land degradation in the Stanari municipality?
What are the implications of land degradation on ecosystem services, agricultural productivity, and socio-economic well-being in the Stanari municipality?
How can the findings from this analysis be integrated into land management and policy decisions to mitigate and prevent further land degradation in the Stanari municipality?
The main goal of the research is to identify the impacts of mining activities, recognized as one of the primary factor in land degradation using modern technologies such as GIS and remote sensing. Land degradation is observed through changes in land use, deforestation, and erosive processes (mechanical water erosion) within the study area. This research contributes to a better understanding of the spatial processes resulting from mining activities and forms the basis for assessing their impacts on land degradation. The results of this research hold practical significance for risk assessment in the geographical environment, sustainable land use planning, and the restoration of already degraded land.
2 Study area
The study area encompasses the municipality of Stanari (from 44°40′26″N to 44°50′33″N and from 17°44′18″E to 17°55′55″E), situated in the northern region of Republic of Srpska (RS)/B&H (Figure 1). It was established in 2016 by separating 13 settlements from the city of Doboj. According to the latest population census in RS from 2013, the separated settlements had a combined population of 6,958 inhabitants, which simultaneously represents the total population of the municipality of Stanari [41]. Physically and geographically, the municipality of Stanari is characterized to a certain extent by a fluvial relief, namely, the basin of the Ukrina River. The terrain configuration is characterized as low-rolling hills, with the lowest elevation at 138 m above sea level (Brestovo) and the highest elevation at 343 m above sea level (Radnja Donja). The climate in the municipality of Stanari is moderately continental, characterized by warm summers and moist winters [42]. Based on data from the hydrometeorological (HM) station in Stanari (2006–2018), the average annual precipitation amounts to 1094.1 mm, while the average air temperature stands at 13.35°C.
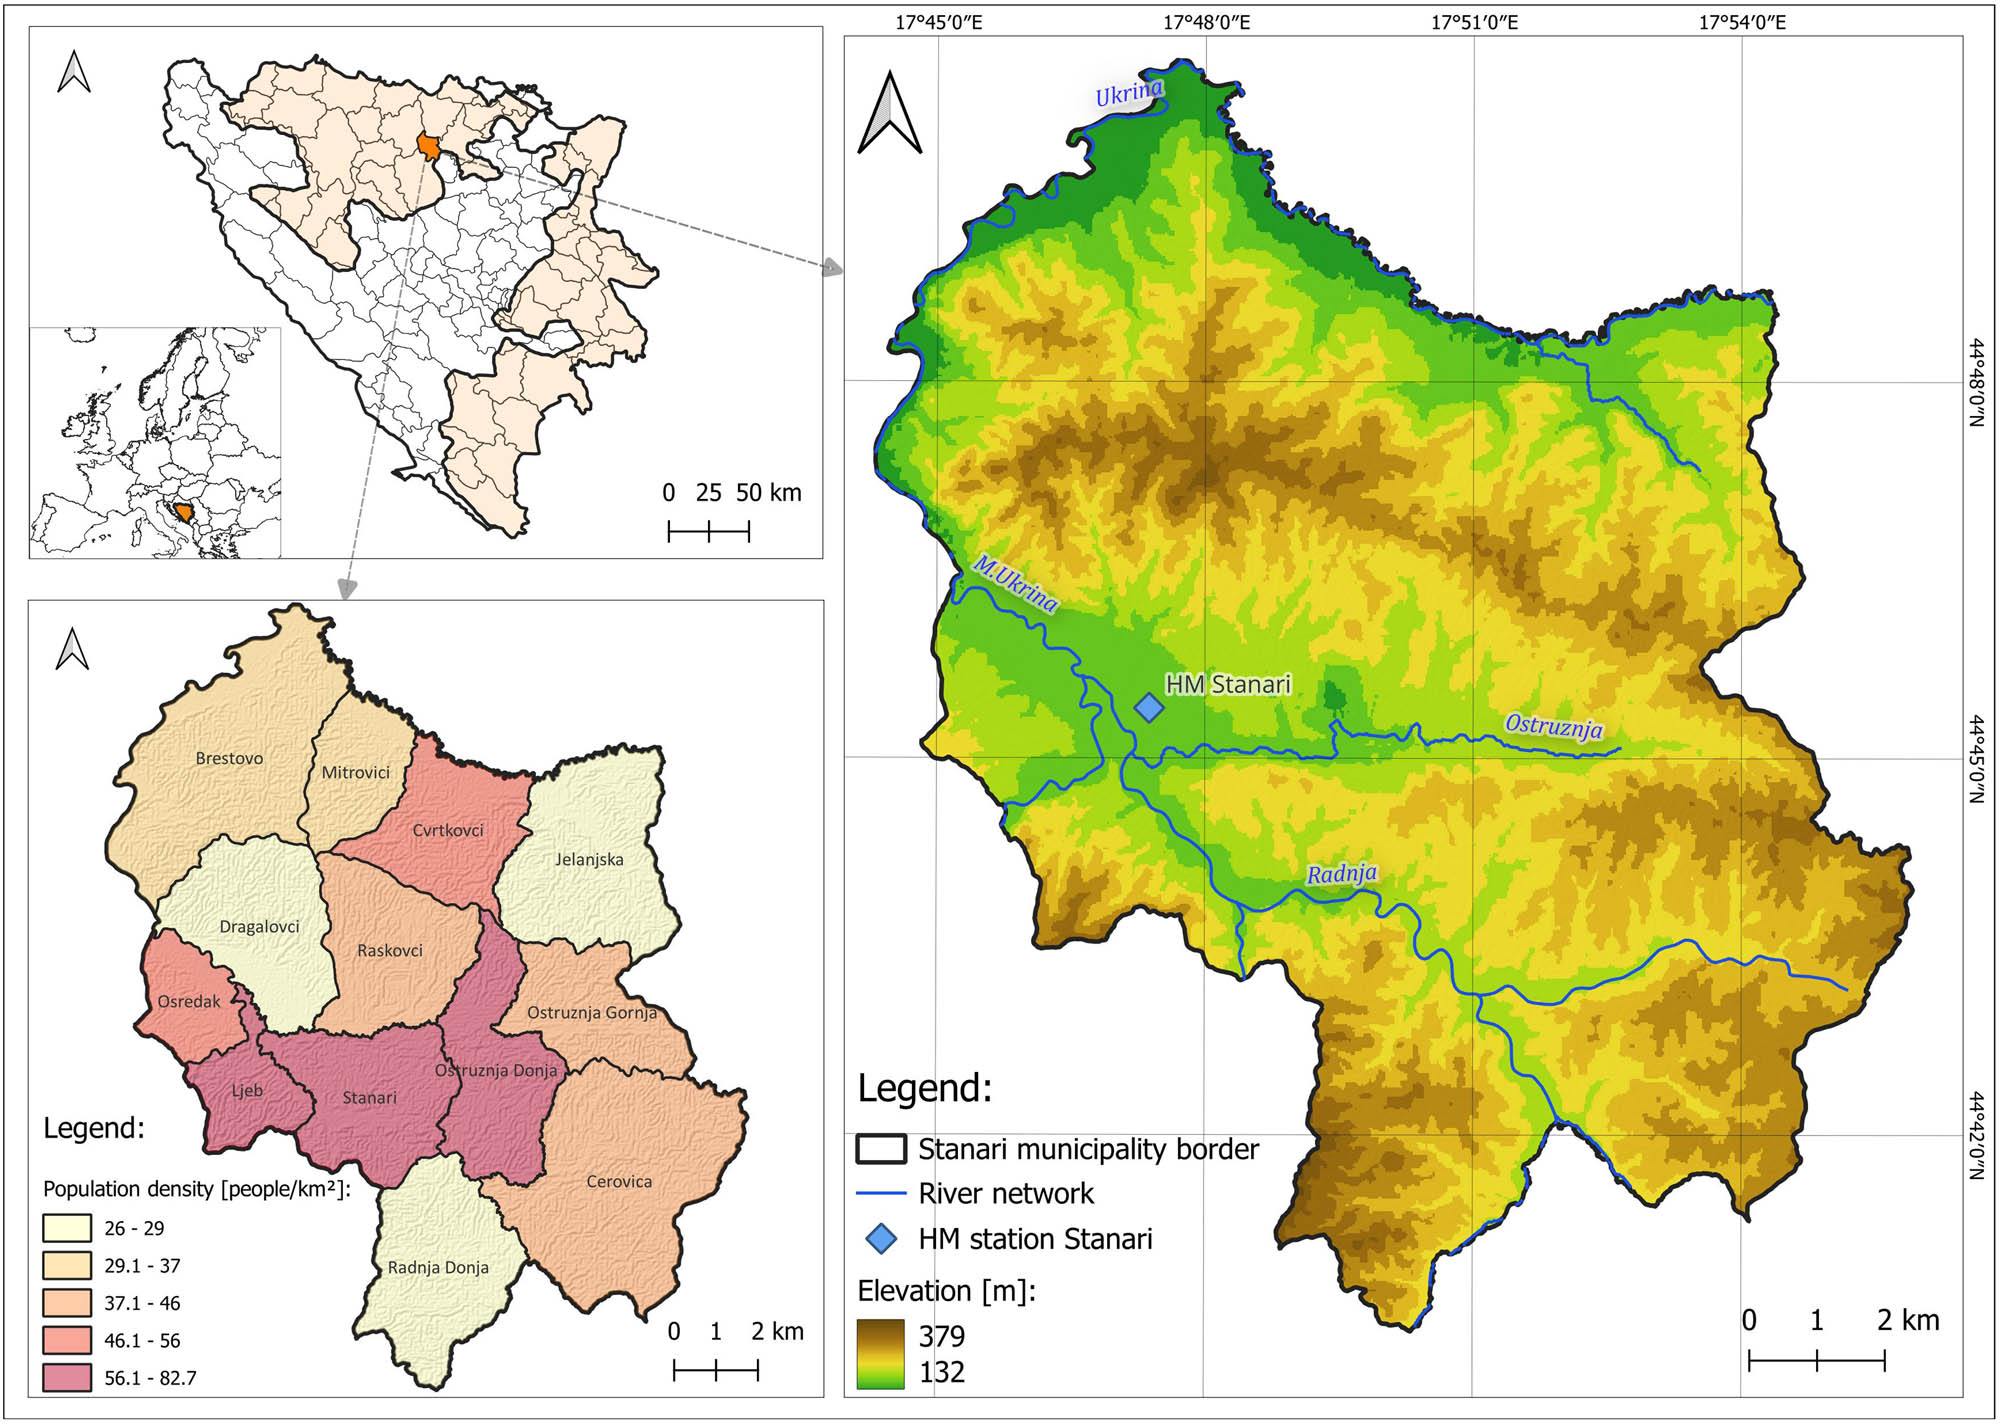
The location of the study area.
Based on the Basic Geological Map of the Socialist Federal Republic of Yugoslavia (SFRY) – Derventa (L33-120) [43] at a scale of 1:100,000, it is concluded that the area of the municipality of Stanari is characterized by lithological diversity (Figure 2a). The oldest rocks belong to the Triassic (T) age, consisting of sediments from the Lower Triassic (T1 2), Middle Triassic (T 2 1), and Middle to Upper Triassic (T 2,3). The youngest rocks are of Quaternary age and include river terraces (t 1, t 2), deluvial-proluvial sediments (dpr), proluvial sediments (pr), scree (S), floodplain facies (ap), and alluvium (al). Based on the pedological map at a scale of 1:50,000 [44], derived from the Food and Agriculture Organization of the United Nations (FAO) classification, it is concluded that the study area is characterized dominantly by the following soil types: luvisols (28.49%), podzols (26.70%), fluvisols (11.19%), cambisols (10.45%), acrisols (10.19%), vertisols (7.71%), leptosols (3.66%), and gleisols (1.56%) (Figure 2b).
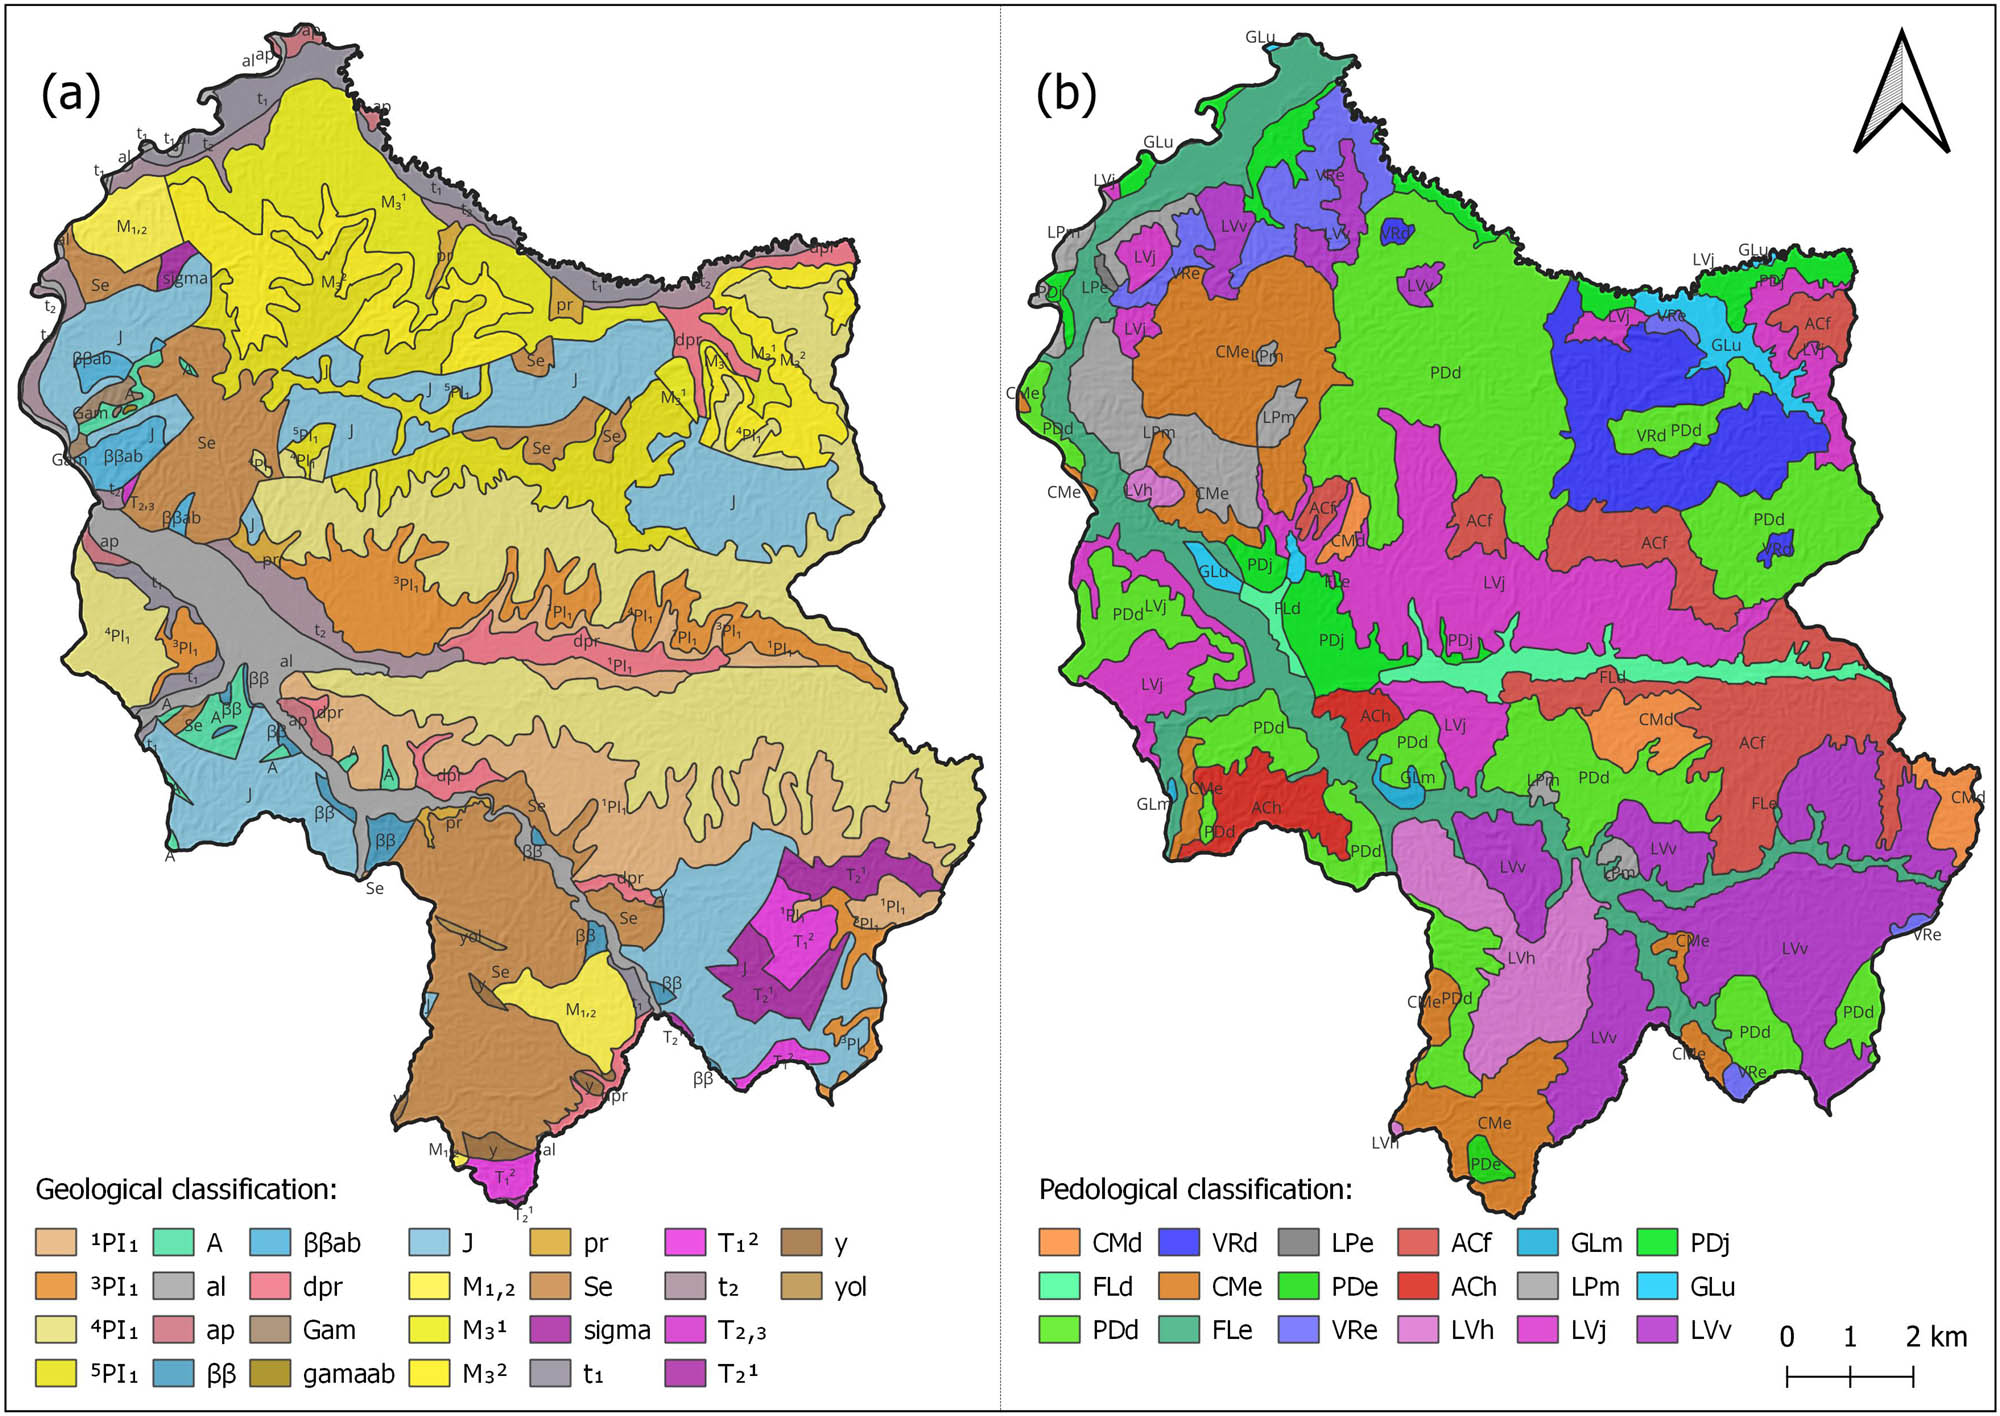
(a) Geological and (b) pedological classification of the study area. The markings (a) of the geological classification from the legend have the following meanings: 1PI1 – sands, conglomerates, and locally clayed; 3PI1 – fine-grained sands, layers of sandy clays, and lenses of gravel; 4PI1 – variegated sandstones and subordinate conglomerates; 5PI1 – weathered, coarse conglomerates, gravel, sandy, and gravelly silts; A – amphibolites; al – gravel and sand; ap – aleurolites, clays, and flood facies; ββ – dykes; ββab – phyllite; dpr – deluvial-proluvial sediments: rubble, gravel, and sand; Gam – amphibolite gneisses; gamaab – albitic granites; J – diorite-gabbroic formation: sandstones, clays, hornfels with small bodies of diabase and spilite; M1,2 – conglomerates, sandstones, clays, and tuffs; M3 1 – argillaceous-sandy shales, lapilli, oolitic limestones, carbonate sandstones, and conglomerates; M3 2 – argillaceous shales, argillaceous limestones, and sand; pr – clayey and sandy gravels and rubble with silts; Se – serpentinites; sigma – peridotites; t1 – lower river terrace; T1 2 – thin-bedded argillaceous and sandy limestones, shaly limestones, clays, and quartz sandstones; t2 – sand and gravel; T2,3 – massive, occasionally thinly-bedded limestones; T2 1 – platy to massive limestones with brachiopods; y – ophitic normal gabbros; yol – gabbros, predominantly olivine gabbro. The markings (b) of the pedological classification from the legend have the following meanings: CMd – Dystric Cambisols; FLd – Dystric Fluvisols; PDd – Dystric Podzoluvisols; VRd – Dystric Vertisols; CMe – Eutric Cambisols; FLe – Eutric Fluvisols; LPe – Eutric Leptosols; PDe – Eutric Podzoluvisols; VRe – Eutric Vertisols; ACf – Ferric Acrisols; ACh – Haplic Acrisols; LVh – Haplic Luvisols; GLm – Mollic Gleysols; LPm – Mollic Leptosols; LVj – Stagnic Luvisols; PDj – Stagnic Podzoluvisols; GLu – Umbric Gleysols; LVv – Vertic Luvisols.
In 2016, the Stanari Thermal Power Plant (TPP) [44°45′ 15″ N, 17°47′ 30′′ E] was launched in the municipality of Stanari, utilizing coal as its primary fuel source. According to the Energy Balance of RS for the year 2023, the Stanari TPP has the largest planned contribution to electricity production compared to other TPPs in RS. It represents a driver of industrial development for both the municipality and the region.
According to data from the Registry of Approved Exploration Areas and the Registry of Approved Exploitation Areas of the Ministry of Energy and Mining of Republic of Srpska (MEM RS), the area of the Stanari municipality is rich in numerous mineral resources. Currently, several exploration areas are approved in the following settlements: Cerovica (technical building stone – limestone), Stanari (hydrogeological research and coal), Raškovac (coal), and Dragalovci (technical building stone – serpentinite). In addition to exploration areas, there are several approved exploitation areas in the settlements: Stanari (surface coal mining), Dragalovac, and Raškovac (groundwater and surface coal mining), and Rudine (surface exploitation of technical building stone – serpentinite). The exploration and exploitation areas overlap to a certain extent (Figure 3). The total exploration area covers 14.06 km2 (8.73% of the municipality’s area), exploitation area covers 38.41 km2 (23.89% of the municipality’s area), totaling 52.52 km2 (32.62% of the municipality’s area). More than a third of the municipality’s area is subject to the exploration or exploitation of mineral resources. Based on data from the Registry of Approved Exploitation Areas of the MEM RS, it is concluded that there are two types of exploitation present in the study area: surface and underground exploitation. The assumption is that the surface exploitation will significantly impact changes in land use and thereby, contribute to land degradation through the processes of deforestation and soil erosion.
![Figure 3
Approved exploration and exploitation areas in the municipality of Stanari (based on Sentinel-2 [RGB] from the year 2017).](/document/doi/10.1515/geo-2022-0671/asset/graphic/j_geo-2022-0671_fig_003.jpg)
Approved exploration and exploitation areas in the municipality of Stanari (based on Sentinel-2 [RGB] from the year 2017).
3 Data and methods
3.1 Methodology for monitoring land use
The process of monitoring land use was carried out by processing remote sensing “products” in the form of satellite imagery. For their processing, the Google Earth Engine (GEE) platform based on cloud technology was utilized. The primary basis for researching and monitoring land use was the data from the Sentinel-2 satellite mission. According to Transon et al. [45], an overview of the characteristics of the Sentinel-2 mission is provided in Table 1.
Overview of the primary characteristics of the Sentinel-2 mission
| Platform name | Sentinel-2 |
|---|---|
| Sensor type | Multispectral |
| Swath width (km) | 290 |
| Spectral range (nm) | 443–2,190 |
| Spectral bands | 13 |
| Spatial resolution (m) | 10–20–60 |
| Temporal resolution (day) | 5 |
| Spectral resolution (nm) | 15–180 |
| Signal-to-noise ratio VNIR | From 89:1 to 168:1 |
| Signal-to-noise ratio SWIR | From 50:1 to 100:1 |
As part of the monitoring process, the identification of land use classes within the study area is conducted (Figure 4). The objective is to identify changes occurring within the space during the temporal period of the research. The image processing comprises two phases: pre-processing and post-processing. Within the pre-processing phase, the research period is defined. Considering that the initial Sentinel-2 images were captured at the end of 2016 and the beginning of 2017, the defined research period is 2017–2023. Although the chosen period is relatively short, taking into account that the Stanari TPP became operational in the second half of 2016 within the study area, and mining activities intensified following its opening, it is concluded that this selected time period will be sufficient to identify changes occurring in the space directly impacted by mining activities. An essential part of image pre-processing involved filtering the images based on cloud coverage percentage and spatial extent. Within the post-processing of images, the separation of land use classes is performed. The identification of these classes was accomplished through supervised classification (SC) for each of the reference monitoring years (2017 and 2023). Within the identification, three separate temporal subperiods were isolated. The aim of extracting temporal subperiods within 1 year is for a clearer identification of individual land use classes (e.g., easier differentiation between agricultural areas and meadows). Based on these temporal subperiods, a composite image (stack) was created and used as a basis for generating training data in the classification process. The mentioned process was conducted using the Random Forest algorithm. The following land use classes were extracted: water surfaces, forested areas, agricultural land, meadows, built-up areas, and surface mines (SMs). The result of the classification process underwent accuracy assessment by calculating the following parameters: user accuracy, producer accuracy, overall accuracy, Kappa coefficient, and F-1 score.
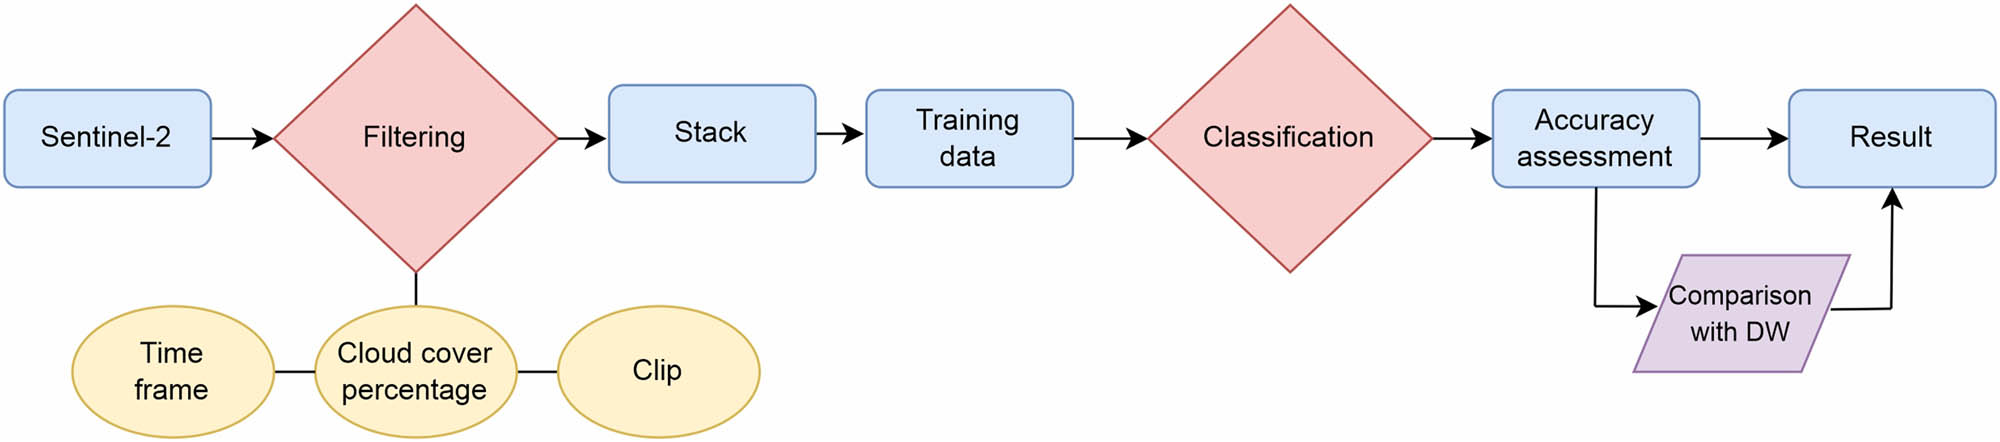
Algorithm for processing satellite data for land use monitoring.
The validated result of SC was compared with the Dynamic World (DW) dataset, which represents a global dataset on land use, using QGIS 3.28.13 “Firenze” software (https://qgis.org/), and its tools for area calculation (Raster layer unique values report). DW is created through calculations, artificial intelligence, and automated classification of Sentinel-2 satellite images [46]. Considering that the results of DW and SC originate from the processing of Sentinel-2 images using different methodological approaches, the comparison procedure highlighted the positive and negative aspects of the “local” and “global” algorithms for land use classification. The results were compared at the municipality level and within the approved exploitation areas, observing the direct and indirect impacts of mining activities on the resulting changes.
3.2 Methodology for monitoring deforestation
The changes occurring in land use due to mining activities often lead to land degradation by causing the loss of forested areas, resulting in the occurrence of deforestation processes. Within the research, monitoring of deforestation was carried out by processing the Hansen Global Forest Data Change (HGFDC) dataset (Figure 5). The mentioned dataset is of a global nature, providing high-resolution forest cover data. It was generated through the processing of Landsat 7 ETM+ satellite images, updated annually, and is available in a spatial resolution of 30 m [47]. The temporal coverage of available data spans 20 years (2001–2021). Using the GEE platform, data were filtered for the mentioned time period, first reduced to the level of country B&H and then narrowed down to the level of the study area. The data underwent a masking process, involving the definition of surface masks and simplification of pixel values. A band related to forest loss was filtered. Based on the post-processed data, a collection of images was created, including sub-collections for lost forest areas (area collection) by year (year collection) (Figure 5). Utilizing QGIS 3.28.13 “Firenze” software (https://qgis.org/), deforestation data at the level of country B&H and the municipality of Stanari, along with updated OpenStreetMap (OSM) data on SMs and approved exploitation areas, were successively intersected to determine the extent of deforestation caused by mining activities in country B&H and, consequently, in the Stanari municipality.
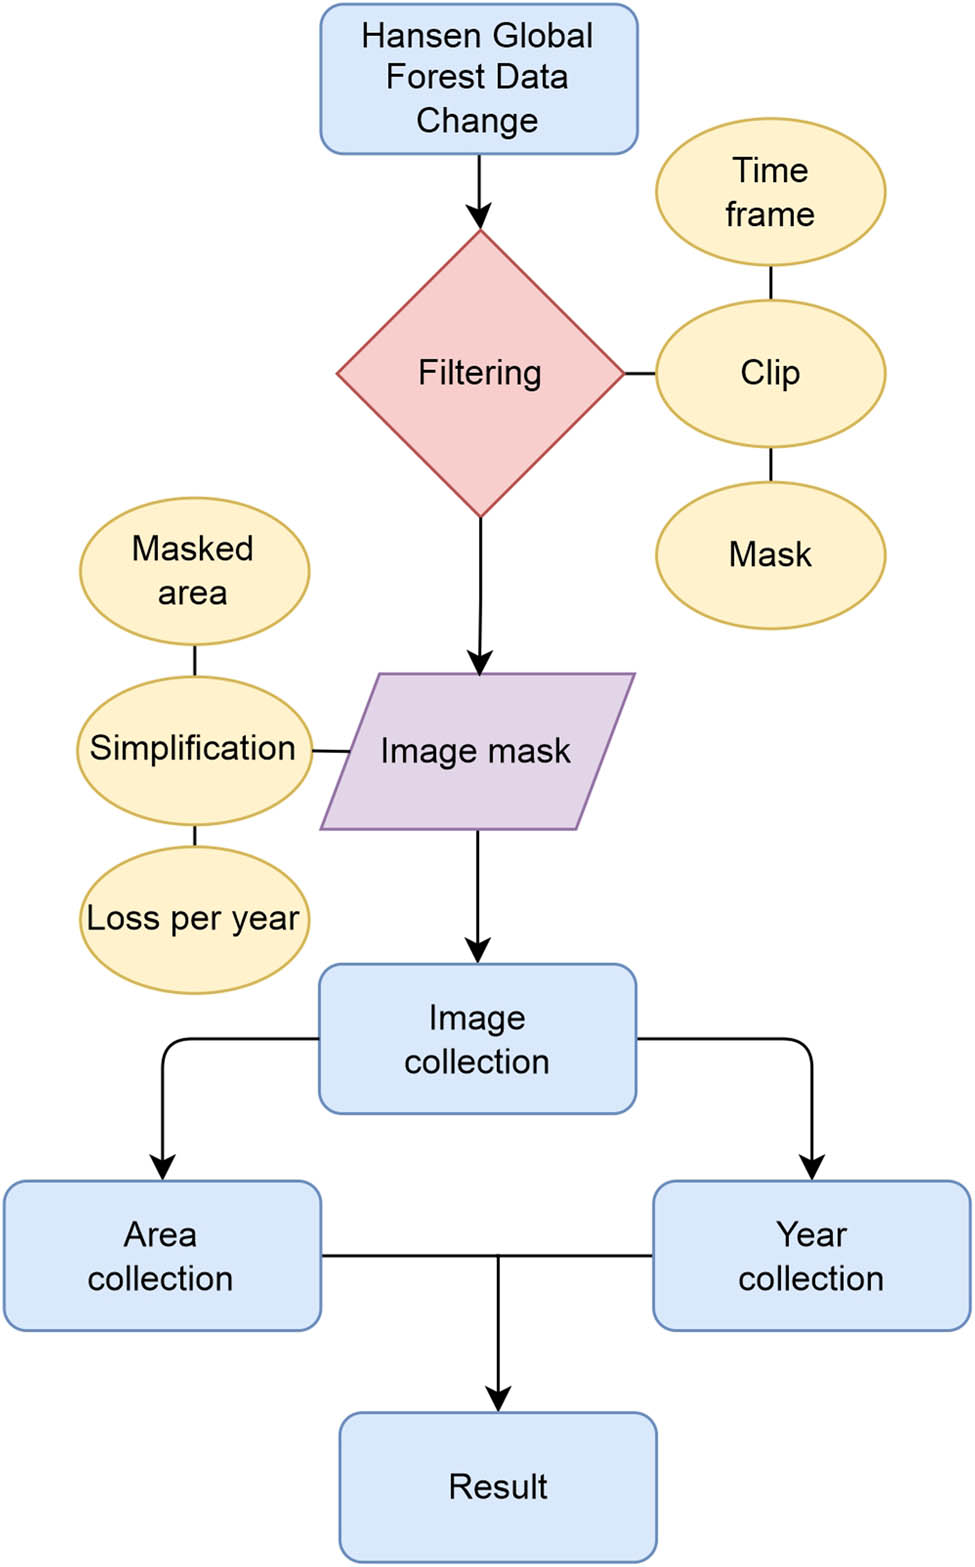
Algorithm for processing satellite data for deforestation monitoring.
3.3 Methodology for erosion assessment
The changes occurring in space due to mining activities, such as alterations in land use and the occurrence of deforestation, can significantly intensify erosion processes. Depending on the available digital data, the extent of erosion can be determined using GIS environments, and the results can be validated through field investigations [48]. According to Micić Ponjiger et al. [49], the mapped erosion data for the former Yugoslav countries were prepared in the 1980s based on expert assessment of field data and maps generated using the Erosion Potential Model (EPM), namely, Gavrilović's method of erosion potential [50]. Vujačić et al. [17] emphasized that the EPM is one of the widely accepted and applied empirical models for the regions of the Balkans, Southeastern and Central Europe, the Middle East, North Africa, and parts of South America. In the Western Balkans, the mentioned method is dominant for mapping the intensity of water erosion at the national level. It is based on long-term research of soil erosion processes conducted by Professor Gavrilović [50] in the Morava River region in Serbia. In the mentioned spatial extents, the application of a modified version of EPM called IntErO (Erosion and Runoff Intensity method) is also relevant. IntErO [23] represents a software platform that integrates EPM into an algorithm designed for the Windows operating system. The current updated version in use is WIntErO [51]. Important to note is that the EPM (as well as the widely used USLE and RUSLE models) has been tested in watershed areas worldwide, including: B&H [49,52,53,54,55,56,57], Serbia [15,48,58,59,60,61,62], Montenegro [17,29,63,64], Croatia [65,66], North Macedonia [67,68,69], Italy [70,71], Slovenia [72], Greece [73,74,75], Chile [76], Brazil [77,78,79,80,81], Iraq [82], Iran [83,84,85,86], Kuwait [87], Morocco [88,89,90], and Nepal [91].
The EPM (Gavrilović's method of erosion potential) is based on the following formula:
where W
Y is the average annual quantity of erosive material expressed in m3; T is the air temperature coefficient obtained from the formula:
The coefficient of erosion (Z) holds the greatest significance within the presented formula. The calculation of this coefficient takes into account the values of the following factors: erodibility of rocks/soil (Y), land cover index (X a), visible erosion process index (φ), and average slope (Ј) (Figure 6).
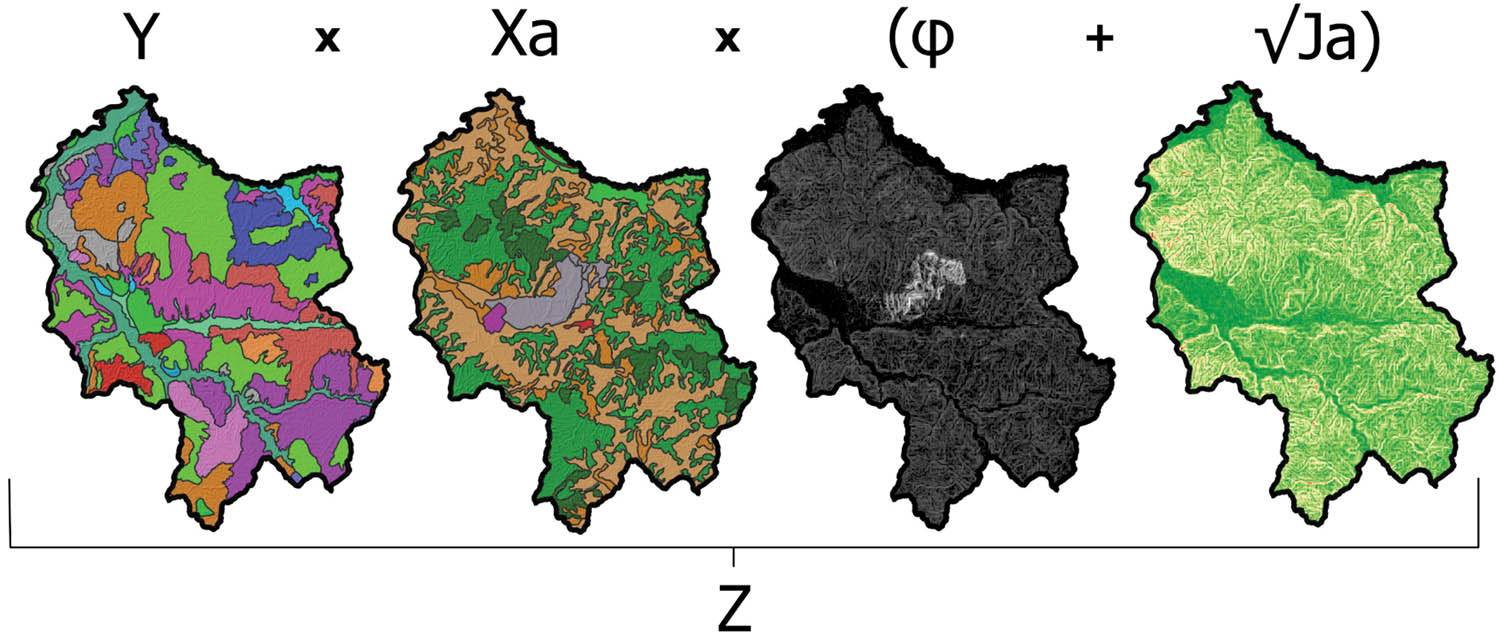
Schematic representation of erosion coefficient (Z) calculation.
Research implementing the EPM model within GIS environments often involves extracting parameters from various models based on digital elevation models or satellite data [18,68,69,92,93,94].
To determine the coefficient Y, digitization and preparation of geological and pedological data were carried out. The geological data for the study area were digitized from the Basic Geological Map of the SFRY - Derventa (L33-120) [43] at a scale of 1:100,000. Pedological data were digitized based on the Basic Pedological Map at a scale of 1:50,000 [44], derived according to the FAO classification. The geological and pedological resistance of the soil to erosion was assessed. Within the pedological context and depending on the soil’s resistance to erosion, values ranging from 0.1 to 2 were assigned to coefficient Y (Table 2). Lower values denote higher soil resistance to erosion, while higher values indicate soils susceptible to erosion. The vector data with assigned Y values were rasterized at a spatial resolution of 15 m. Considering the challenges in precisely estimating erosion correlativity [53], an adjustment of the Y values was made through a process involving extracting the square root according to the following formula:
Soil type and assigned Y coefficient
| Type of soil | Y coefficient |
|---|---|
| Dystric cambisols | 0.8 |
| Dystric fluvisols | 0.3 |
| Eutric vertisols | 1.6 |
| Dystric vertisols | 1.6 |
| Eutric cambisols | 0.8 |
| Eutric fluvisols | 0.3 |
| Eutric leptosols | 2.0 |
| Eutric podzoluvisols | 1.0 |
| Dystric podzoluvisols | 1.0 |
| Ferric acrisols | 1.6 |
| Haplic acrisols | 1.6 |
| Haplic luvisols | 1.0 |
| Mollic gleysols | 0.3 |
| Mollic leptosols | 2.0 |
| Stagnic luvisols | 1.0 |
| Vertic luvisols | 1.0 |
| Umbric gleysols | 0.3 |
| Stagnic podzoluvisols | 1.0 |
The Corine Land Cover 2018 dataset was utilized as a basis for assigning values to coefficient X. This dataset represents a geospatial database concerning land use. The values for coefficient X range from 0.1 (dense forests) to 1 (bare soil) and are assigned to various land use classes (Table 3) based on recommended values from the original model [95].
Land use types and assigned X coefficient
| Land use type | X coefficient |
|---|---|
| Discontinuous urban fabric | 0.25 |
| Road and rail networks and associated land | 0.80 |
| Mineral extraction sites | 1.00 |
| Construction sites | 1.00 |
| Pastures | 0.50 |
| Complex cultivation patterns | 0.70 |
| Land principally occupied by agriculture, with significant areas of natural vegetation | 0.55 |
| Broad-leaved forest | 0.20 |
| Mixed forest | 0.15 |
The challenge of subjectively determining visible erosion processes (φ) has been overcome by an approach that involves determining this coefficient based on satellite data. According to the methodology outlined by Aleksova et al. [69], the determination of visible erosion processes is carried out by processing Landsat 8 satellite images, specifically band 4 (b4; 0.64–0.67 μm) with a spatial resolution of 30 m. Numerical values of b4 range from 0 to 255, where lower numerical values indicate areas without visible erosion processes, while higher values indicate areas with intense erosion processes. The initial formula for determining φ is:
The slope factor (J) is calculated based on the available digital elevation model (EU-DEM - https://www.eea.europa.eu/). The spatial resolution of the data is 25 m. The slope is calculated in radians according to the formula:
Taking into account all previously mentioned information, the GIS calibrated coefficient Z is calculated according to the following formula:
The main climatic parameters in the EPM, which involve the coefficient of air temperature (T) and the average annual precipitation (H), were calculated based on processed satellite data. The calculation of T relied on the processing of ERA5 satellite data, while the calculation of H relied on the processing of Climate Hazards Group InfraRed Precipitation with Station data (CHIRPS). The mentioned satellite data were processed using the GEE platform, and before utilizing the data within the erosion model computation, their validity was assessed. The validation process involved comparing the aforementioned satellite data with data obtained from HM stations. Average annual air temperatures and precipitation were compared over a period of 20 years (2000–2020). The HM station data considered data from the Stanari and Doboj HM stations. The reason for including the Doboj HM station was the limited time period of precipitation data from the Stanari HM station (2006–2018), as well as the relatively small surface area of the Stanari municipality compared to the low spatial resolution of the satellite data (ERA5 ∼27.8 km; CHIRPS ∼5.5 km).
Based on the parameters of air temperature (T), precipitation (H), and the erosion coefficient (Z), as per the earlier mentioned formula, the average annual soil loss due to erosion process (W y) is calculated.
4 Results and discussion
In the holistic model provided by this research, several practical considerations from an engineering perspective are seamlessly integrated to facilitate the application of advanced remote sensing techniques in monitoring land degradation within the Stanari municipality of B&H: (1) Comprehensive analysis of data availability, preparation, and filtering; (2) Advanced geospatial techniques for preprocessing and postprocessing remote sensing “products”; (3) Calibration and validation procedures for data; (4) Integration of postprocessed data into purposeful analysis; (5) Calculation of land degradation indicators; (6) Utilization of specialized technical infrastructure and tools (such as GIS). The provided approach evaluates the overall cost-effectiveness and scalability of remote sensing approaches for monitoring land degradation.
4.1 Monitoring land use
The results of SC for monitoring land use underwent an accuracy assessment process. Within this process, an error matrix was constructed, that shows which land use classes the pixels in the validation set (ground truth) are assigned to, while the rows show which classes the pixels are assigned to during the classification process. The diagonal values within the error matrix represent pixels that are correctly classified. Values outside the diagonal represent incorrectly classified pixels, indicating potential mixing between different land use classes. Based on the presented values, the following parameters were calculated: user accuracy (UA), producer accuracy (PA), and F-1 score (Table 4). According to the classification results from 2017 (Table 4a), PA is >0.90 for all classes except SMs (0.77). UA is >0.90 for all classes except built-up areas (0.87). The F-1 score is >0.90 for all classes except built-up areas (0.82). According to the classification results from 2023 (Table 4b), PA is >0.90 for all classes except agricultural areas (0.87) and built-up areas (0.78). UA is > 0.90 for all classes except built-up areas (0.81). The F-1 score is > 0.90 for all classes except built-up areas (0.80).
Accuracy assessment and error matrix for (a) 2017 and (b) 2023
| Class name | Class | 1 | 2 | 3 | 4 | 5 | 6 | Total | UA (%) |
|---|---|---|---|---|---|---|---|---|---|
| (a) | |||||||||
| Water area | 1 | 205 | 0 | 0 | 0 | 0 | 3 | 208 | 0.98 |
| Forest area | 2 | 1 | 2,835 | 0 | 0 | 0 | 0 | 2,836 | 1 |
| Meadows | 3 | 3 | 0 | 115 | 0 | 0 | 2 | 120 | 0.91 |
| Agriculture area | 4 | 0 | 0 | 10 | 426 | 2 | 23 | 461 | 0.97 |
| Built-up area | 5 | 0 | 0 | 1 | 207 | 207 | 58 | 473 | 0.87 |
| SMs | 6 | 0 | 0 | 0 | 28 | 28 | 2,232 | 2,288 | 0.96 |
| Total | 209 | 2,835 | 126 | 661 | 237 | 2,318 | 6,386 | ||
| PA (%) | 0.98 | 0.99 | 0.91 | 0.92 | 0.77 | 0.98 | |||
| F-1 (%) | 0.98 | 0.99 | 0.91 | 0.94 | 0.82 | 0.97 | |||
| (b) | |||||||||
| Water area | 1 | 314 | 0 | 0 | 0 | 0 | 6 | 320 | 1 |
| Forest area | 2 | 0 | 1,055 | 0 | 0 | 0 | 0 | 1,055 | 1 |
| Meadows | 3 | 0 | 0 | 322 | 0 | 0 | 9 | 331 | 1 |
| Agriculture area | 4 | 0 | 0 | 0 | 164 | 2 | 22 | 188 | 1 |
| Built-up area | 5 | 0 | 0 | 0 | 0 | 238 | 64 | 302 | 0.81 |
| SMs | 6 | 0 | 0 | 0 | 0 | 53 | 2,561 | 2,614 | 0.96 |
| Total | 314 | 1,055 | 322 | 164 | 293 | 2,662 | 4,810 | ||
| PA (%) | 0.98 | 1 | 0.97 | 0.87 | 0.78 | 0.97 | |||
| F-1 (%) | 0.99 | 1 | 0.98 | 0.93 | 0.80 | 0.97 | |||
The diagonal bold values within the error matrix represent pixels that are correctly classified for each class.
The overall accuracy for 2017 is 0.97, whereas for 2023, it is 0.96. The Kappa coefficient for 2017 is 0.96, and for 2023, it is 0.94. This coefficient represents a statistical parameter derived from comparing reference and user-classified data. The Kappa coefficient value is used to assess the classification, where a range of values between 0.81 and 1 indicates almost perfect agreement between classified and reference data in the classification process [96,97,98]. Considering this, alongside the presented accuracy assessment results for the classification at the study area level, it can be concluded that the data are valid for further research endeavors.
According to the previously described methodology, land use data were created at the study area level. The following classes were distinguished: water surfaces, forested areas, meadows, agricultural areas, built-up areas, and SMs. The DW dataset also includes the class of shrub vegetation. The results were compared at the municipality level and within the approved exploitation area for the years 2017 and 2023 (Figure 7).
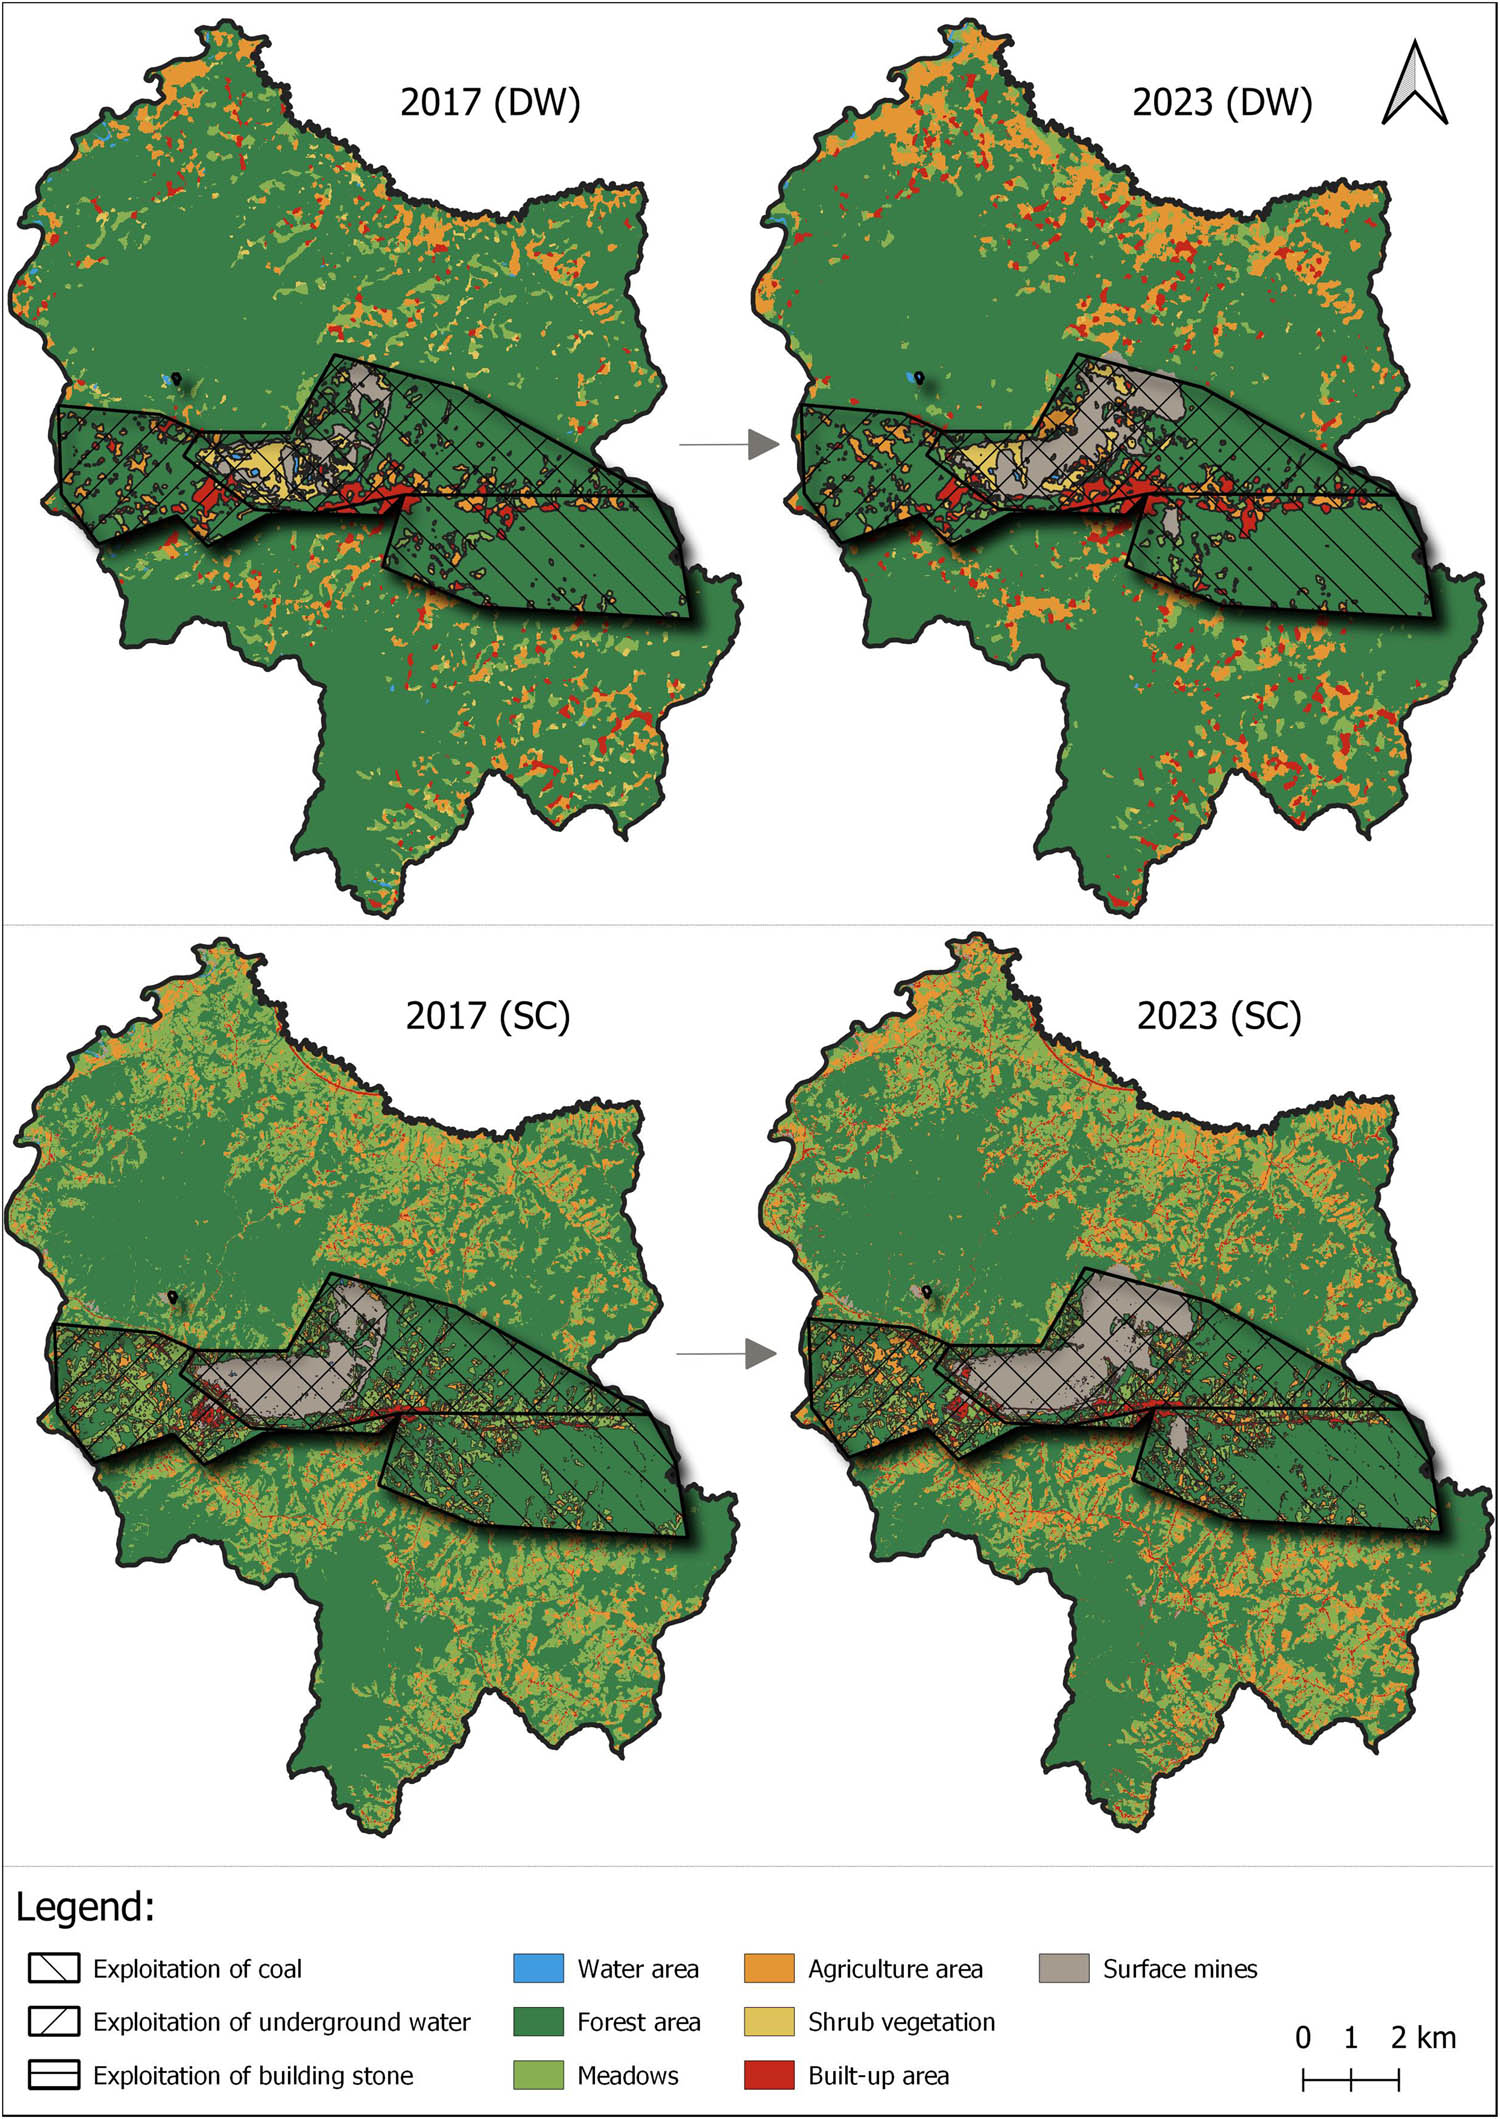
Land use classes (DW, SC) for the years 2017 and 2023.
Within the monitoring of changes in land use, a comparison was made between the trends in land use changes between DW and SC results. The results indicate a high degree of similarity in land use change trends (Figure 8). At the municipality level, the trends completely align, while at the level of the approved exploitation area, there is a negligible difference in the trend of meadow land use change.
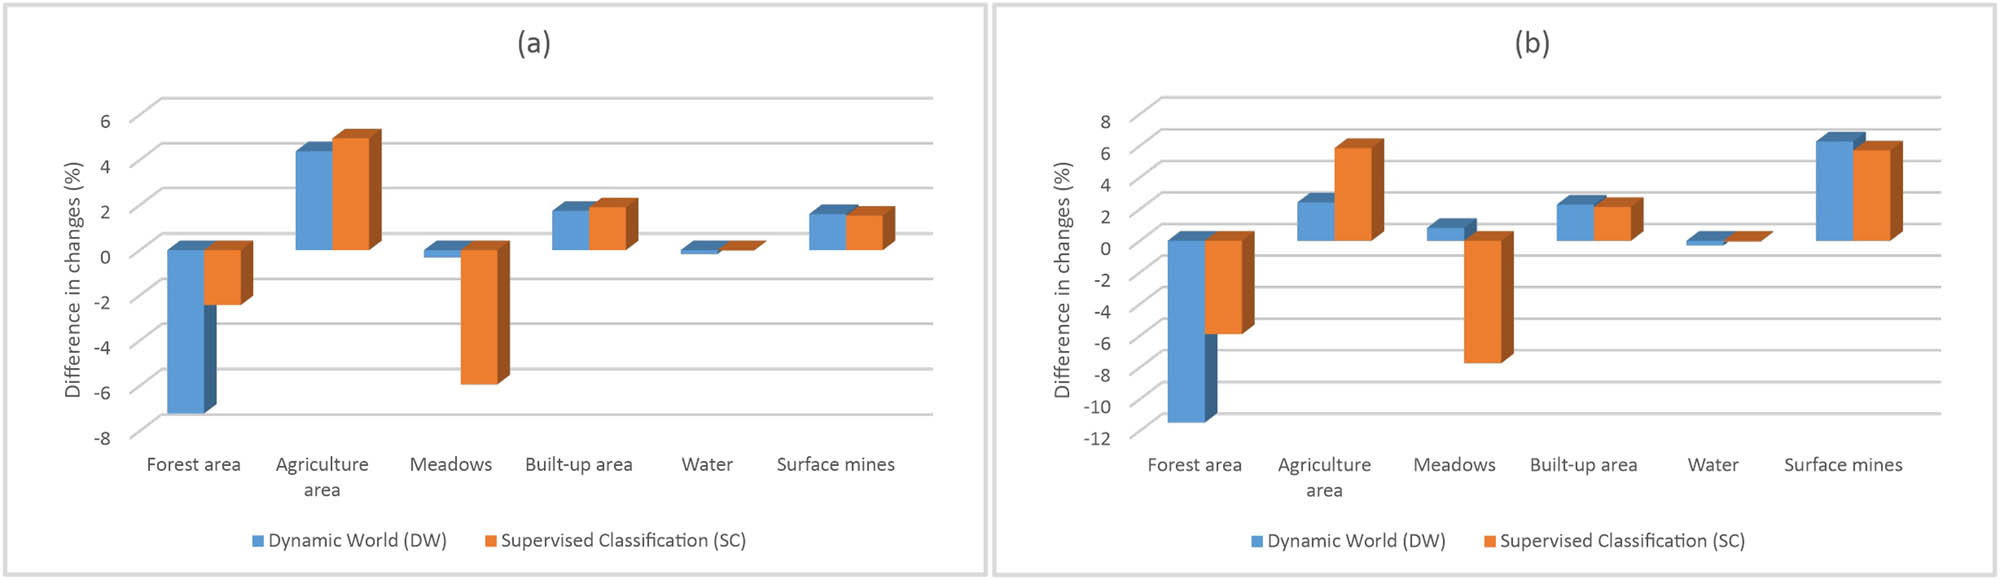
Trends of changes in land use surface area: (a) at the municipality level and (b) at the exploitation area level.
Both datasets identified forests as the dominant land use class at the municipality level. According to the DW dataset, forests cover 83.90% (13507.59 ha) of the municipality’s area, while according to the SC dataset, forests cover 76.67% (9649.73 ha). During the research period (2017–2023), forested areas decreased by 7.23% (DW) and 2.43% (SC). Additionally, the area of meadows decreased by 0.32% (DW) and 5.94% (SC), while water surfaces decreased by 0.17% (DW) and 0.01% (SC). As a result of the reduction in these land use classes, the areas of other classes increased: agricultural areas (4.38% DW; 4.95% SC), built-up areas (1.74% DW; 1.90% SC), and SMs (1.60% DW; 1.53% SC) (Figure 8a).
At the level of the approved exploitation area, forested areas are also the dominant land use class. According to the DW dataset, they cover 79.58%, while according to the SC dataset, they cover 54.03% of the approved exploitation area. During the research period (2017–2023), forested areas decreased by 11.48% (DW) and 5.90% (SC). Besides forested areas, water surfaces also decreased, by 0.29% (DW) and 0.05% (SC). Due to the reduction in forested and water surfaces, the areas of the following land use classes increased: agricultural areas (2.42% DW; 5.85% SC), built-up areas (2.28% DW; 2.13% SC), and SMs (6.27% DW; 5.70% SC). A noticeable difference in trends between DW and SC is observed in the meadow land use class. According to the DW data, the meadow area increased by 0.81%, while according to the SC results, it decreased by 7.73% (Figure 8b).
Although the trends in land use changes between DW and SC largely overlap, there is a noticeable percentage difference within individual land use classes. The difference arises in terms of coverage for each of the trends due to different methodological approaches and algorithms used in land use identification. The DW dataset applies generalized algorithms adapted at a global level. According to the results of Hong et al. [99], the overall accuracy of this dataset for Europe is 66%, while at the global level, the overall accuracy is 72%. Algorithms within this dataset cannot identify land use areas smaller than 250 m², leading to the generalization of certain land use classes. For instance, objects, trees, and grass within an area smaller than 250 m² might be identified as built-up areas within the classification algorithm. On the other hand, the SC process results from a “local algorithm” whose training data for classification are specific to the study area, allowing for more accurate land use identification. However, a limiting factor in identification is the spatial resolution of Sentinel-2 imagery (10 m). Considering the different approaches and methodologies used to obtain DW and SC results, it can be concluded that the observed “oscillations” in surface areas within trends are negligible, and both datasets are valid.
The results from DW and SC data indicate a loss of forested areas due to mining activities at both the municipality and approved exploitation area levels. The reduction in forested areas has led to an increase in other land use types. Consequently, in the western part of the exploitation area, there has been an increase in agricultural areas. This segment of the exploitation area is characterized by underground exploitation methods, which do not directly change the land use or degrade it. On the other hand, the decrease in water surfaces is a direct consequence of mining activities affecting land use. During and after mining activities, “pits” form in the space, which, depending on weather conditions, can be filled with water. Depending on when the satellite image was captured, the same area may or may not be identified as a water surface, leading to “oscillations” in the area of this land use type.
DW and SC results both show a noticeable increase in built-up areas at both levels. The increase in this land use class within the approved exploitation area is explained by the construction of new infrastructure for the needs of the Stanari TPP. On the other hand, the increase at the municipal level is attributed to population migration from the exploitation area to other parts of the municipality. Specifically, the approved exploitation area encompasses the urban center of the municipality as well as 8 out of 13 settlements: Cerovica, Dragalovci, Ljeb, Osredak, Ostružnja Donja, Ostružnja Gornja, Raškovci, and Stanari. According to the latest population census from 2013, 4,697 residents live in this area, accounting for 67.50% of the total population of the municipality [41]. There is an ongoing process of property expropriation and relocation of the local population from this area. The current spatial plan of the municipality anticipates the relocation of the population to the northern part of the municipality, where there are currently no approved exploration or exploitation areas. The population migration process toward currently uninhabited areas will undoubtedly lead to changes in land use patterns in the future. It can be expected that the dominant forested area in this region will decrease, while other land use classes, primarily built-up and agricultural areas, will increase as part of forming new properties.
The surface area of mines has significantly increased as a direct consequence of mining activities during the research period. Figure 9(a) and (b) illustrates the impact of surface mining expansion, as a consequence of mining activities, on other land uses, such as forested and agricultural areas, shrub vegetation, as well as built-up areas. The main reason for this increase is the establishment of the Stanari TPP at the end of 2016. New exploitation areas for surface mining or mineral extraction were approved for the needs of this TPP, leading to a direct change in land use, i.e., land degradation. Furthermore, both DW and SC results indicate that the surface area of mines within the approved exploitation area is smaller compared to the area of SM areas at the municipal level. It is concluded that in certain locations, land exploitation has taken place beyond the boundaries of the approved exploitation area.
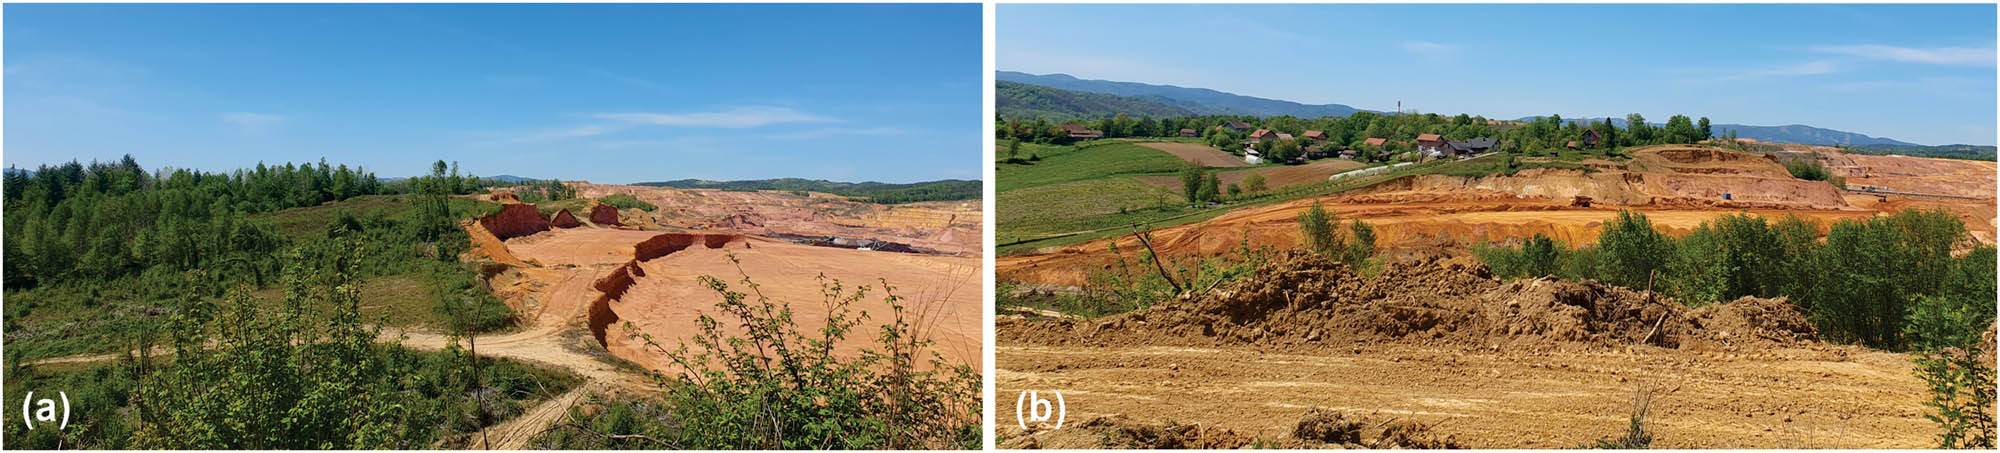
The impact of surface mining on the reduction in other land uses: (a) shrub vegetation and forested areas and (b) built-up areas, agricultural areas, and meadows.
Similar changes in land use were identified in the study area, according to the results of Milanović et al. [94], in the mining basin of Kolubara in the Republic of Serbia. As a direct consequence of mining activities, the following changes in land use were observed: a loss of forested areas, an increase in SMs and built-up areas, as well as “oscillations” in water surfaces. The results of Gbedzi et al. [100] indicate that mining activities in the context of surface mining in the Asutifi North District of Ghana resulted in significant losses of forested areas (approximately 107.3 km2).
By comparing the results on land use, it was determined that forested areas have decreased the most both at the municipal level and within the approved exploitation area. Forested areas play a vital role in the environment, seen through oxygen production, preventing soil erosion, desertification, floods, droughts, among other factors. They are particularly significant in regions dominated by mining activities, such as the area within the municipality of Stanari. For this reason, it is necessary to assess the loss of forested areas caused directly by mining activities in the study area.
4.2 Deforestation
Processing HGFDC satellite data (2001–2021) revealed the spatial extent of deforestation occurring as a direct consequence of mining activities (research or mineral exploitation) (Figure 10). Over 90% of the cleared forested area within the study area is located within the approved exploitation area. Deforestation predominates in the northern and central parts of the exploitation area characterized by surface coal mining and industrial stone construction. The change in land use is inevitable to exploit these mineral resources.
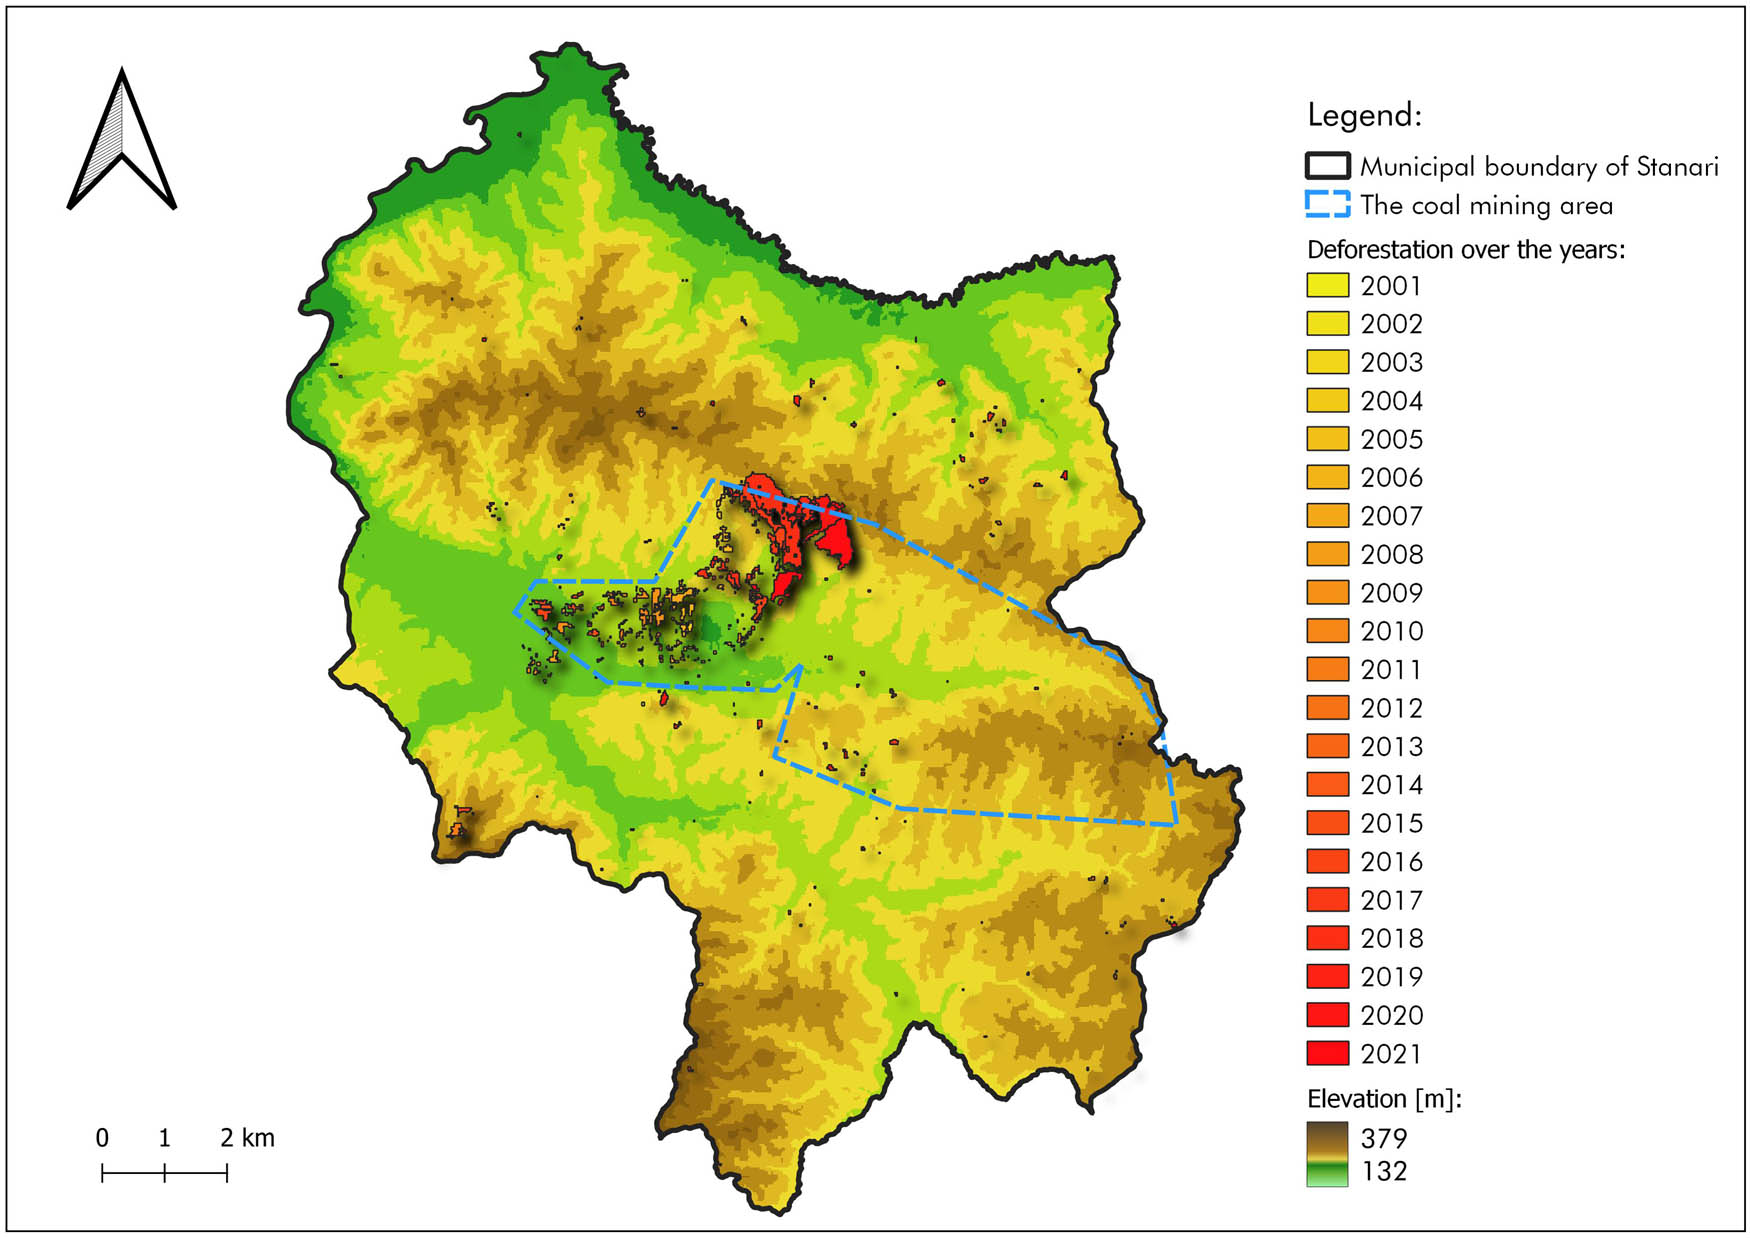
Deforestation in the area of the Stanari municipality (2001–2021).
The spatio-temporal extent of deforestation (2001–2021) in the municipality of Stanari was compared with that at the level of country B&H. Deforestation caused by mining activities was identified and compared in both areas. The process involved a successive overlay of deforestation data in B&H and the municipality of Stanari with updated OSM data on SMs in B&H, specifically with the approved exploitation area in the municipality of Stanari.
During the period 2001–2005, a total of 109.26 ha was deforested in B&H, of which 5.13 ha (4.70%) were in the municipality of Stanari. The period from 2006 to 2010 was characterized by more significant forest clearing, amounting to 291.83 ha in B&H, with 48.45 ha (16.60%) in the municipality of Stanari. In comparison to the 2006–2010 period, a smaller extent of deforested forest areas was observed during the period 2011–2015. During this period, deforestation in B&H covered an area of 178.07 ha, with 21.58 ha (12.12%) in the municipality of Stanari. The period from 2016 to 2021 was characterized by the most pronounced deforestation, during which 398.78 ha were cleared in B&H, of which a significant 189.09 ha (47.41%) were in the municipality of Stanari. In B&H, a total of 977.94 ha of forested area were deforested during the research period (2001–2021), with 264.25 ha (27.02%) in the municipality of Stanari (Figure 11).
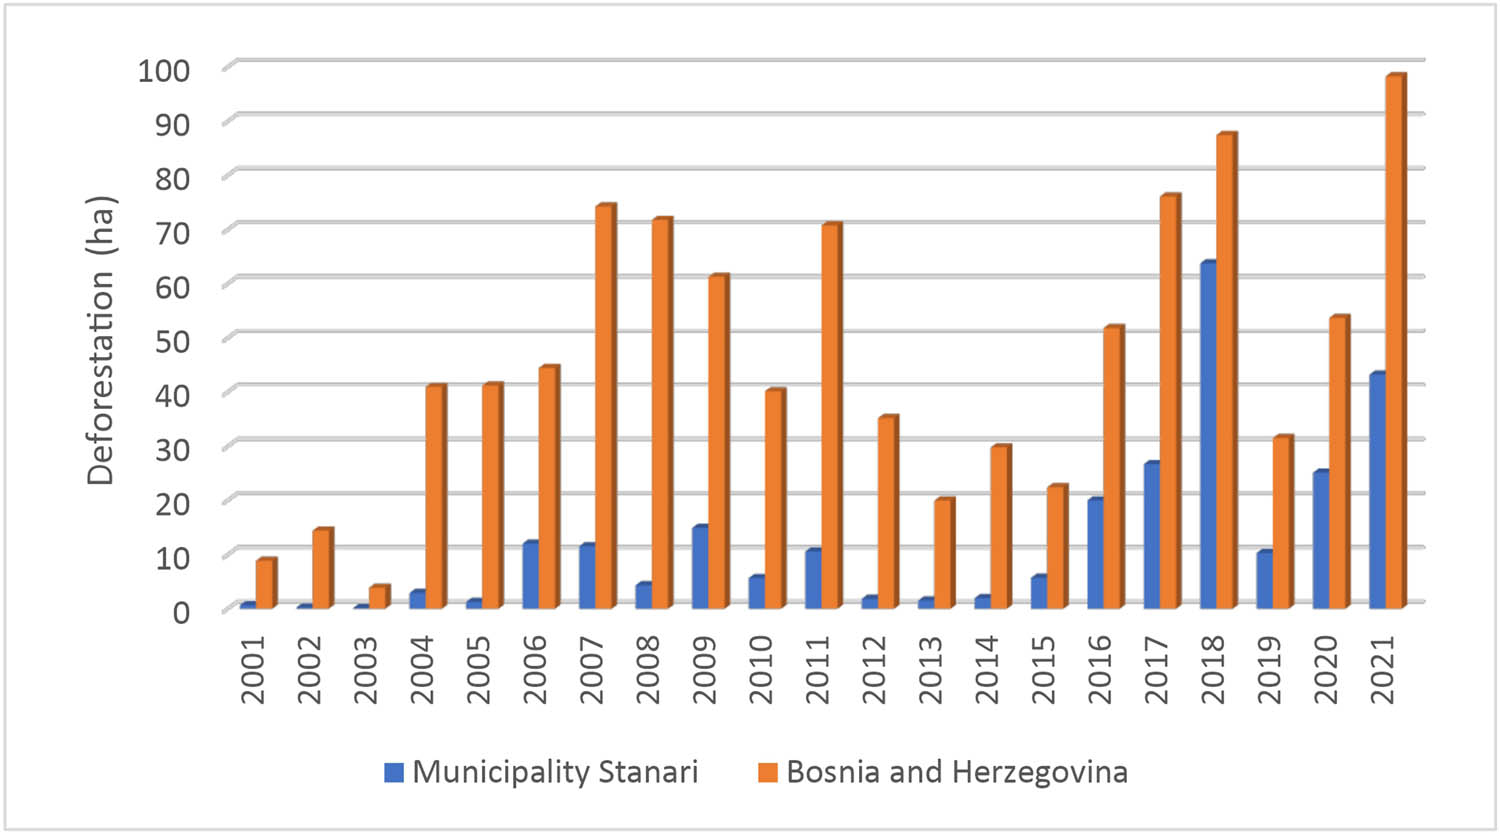
Comparison of changes in deforestation area at the level of the Stanari municipality and Bosnia and Herzegovina (2001–2021).
During 2016, the Stanari TPP was launched within the municipality of Stanari, for which new exploitation areas for coal mining were approved. Forested areas dominated as the primary land use within these new exploitation areas. Since that year until the present day, intense mining activities have led to a high degree of deforestation within the study area. Figure 12a–d shows the direct impact of mining activities in Stanari municipality on the occurrence of deforestation. An exception in trend of deforestation occurred in 2019, characterized by a lower extent of deforestation. This reduction could be attributed to a general technical overhaul of the TPP, which resulted in the TPP being non-operational for over 2 months.
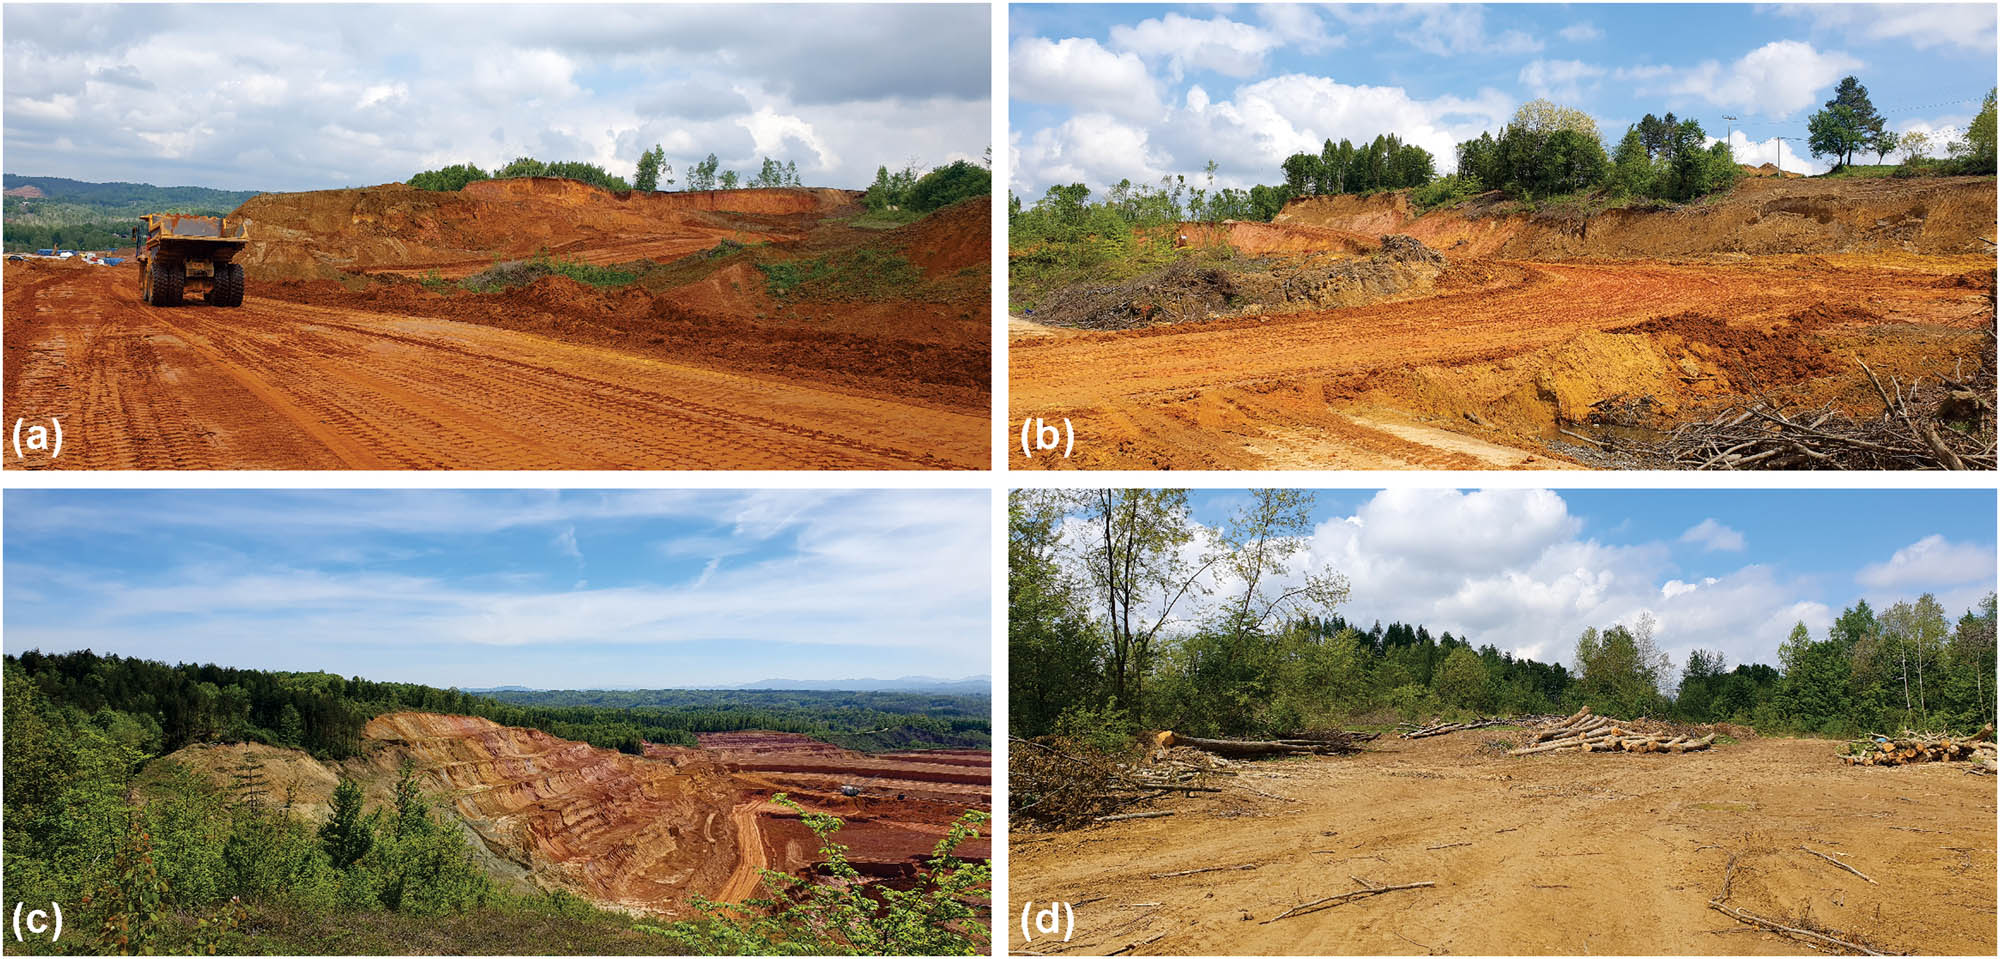
(a)–(d) The impact of surface mining activities on the occurrence of deforestation in the exploitation area in the municipality of Stanari.
Numerous mining activities within the study area have influenced changes in land use, leading to its degradation. Within the approved exploitation area, upon completion of the exploitation process, the remaining forested area will be completely cleared. Considering the time period from 2023 until the completion of exploitation (in 2035) within the approved exploitation area, assuming there would not be approval for new exploitation areas, the direct impact of mining activities will result in the deforestation of 2615.42 ha (DW) or 1848.80 ha (SC) of forested land. This represents 15.32% (DW) or 11.48% (SC) of the municipality’s area.
4.3 Erosion assessment
The process of deforestation significantly influences the intensification of erosion processes.
Within the study area, according to the previously described methodology, raster layers were prepared for each of the factors in calculating the erosion coefficient (Z). The calculation of the Z coefficient was performed using the Raster Calculator within the QGIS 3.28.13 “Firenze” software (https://qgis.org/). Based on the values of the mentioned factor, a map of erosion risk was created (Figure 13).
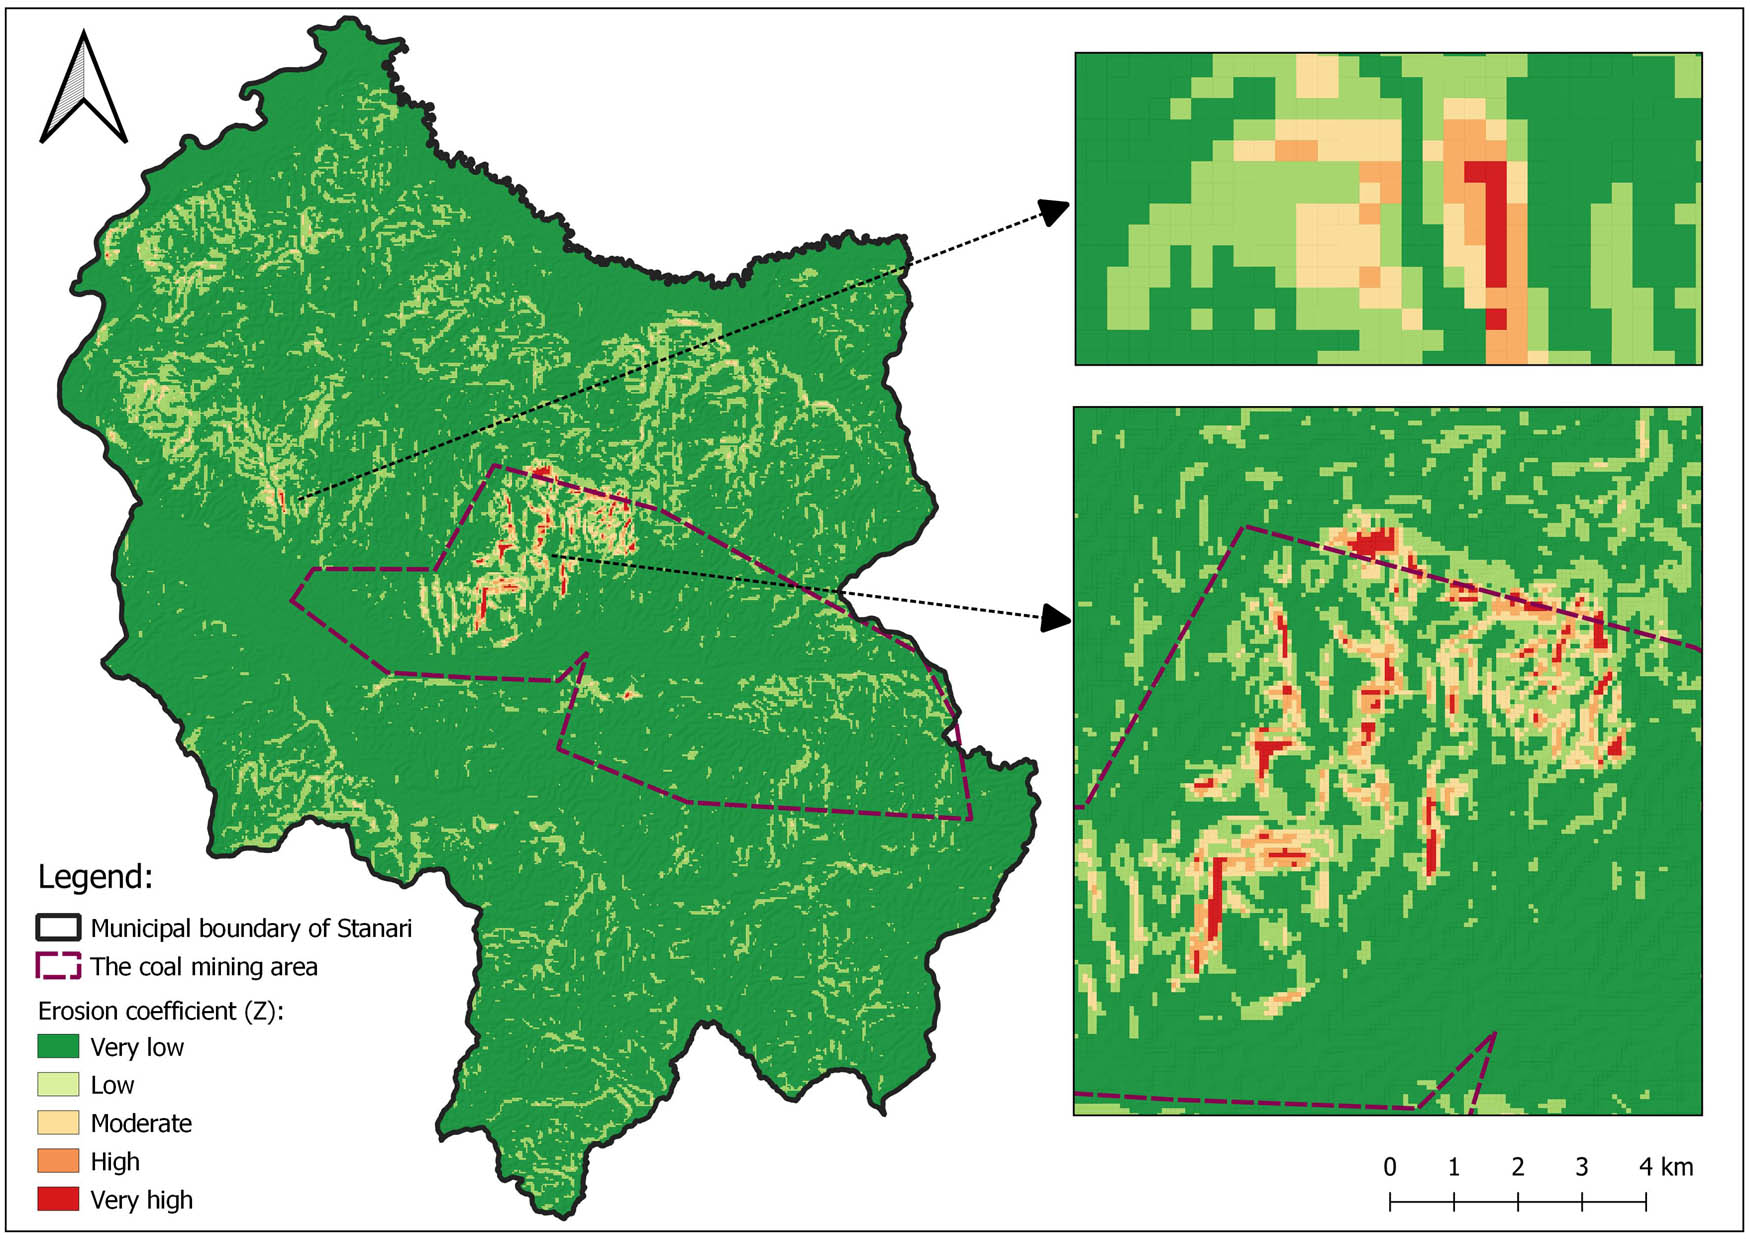
Map of erosion risk in the Stanari municipality (based on Z values).
The erosion coefficient (Z) results at the municipal level indicate a significant portion of the area with very low and low erosion coefficients (<0.8), constituting 98.71% of the total municipal area. On the other hand, the moderate, high, and very high erosion coefficient areas within the municipal territory constitute 1.29% (Table 5).
Erosion coefficient (Z) areas at the municipality level of Stanari
| Z factor | Area (ha) | Percentage (%) |
|---|---|---|
| 0–0.4 | 13798.77 | 86.11 |
| 0.4–0.8 | 2019.92 | 12.60 |
| 0.8–1.2 | 143.79 | 0.89 |
| 1.2–1.6 | 39.47 | 0.25 |
| >1.6 | 21.59 | 0.15 |
| Total | 16,098 | 100 |
In order to assess the validity of satellite data for calculating the T and H factors within W y, a comparison was made with actual data from HM stations. Comparison of the average air temperature HM and ERA5 indicates a high degree of validity of satellite data (Figure 14a). Five out of 12 months (March, April, October, November, and December) characterize > 85% agreement between satellite and real data. Additionally, 5 out of 12 months (May, June, July, August, and September) show >90% agreement between satellite data and real data. Noticeably lower agreement is observed in the months of January (64.81%) and February (75.35%).
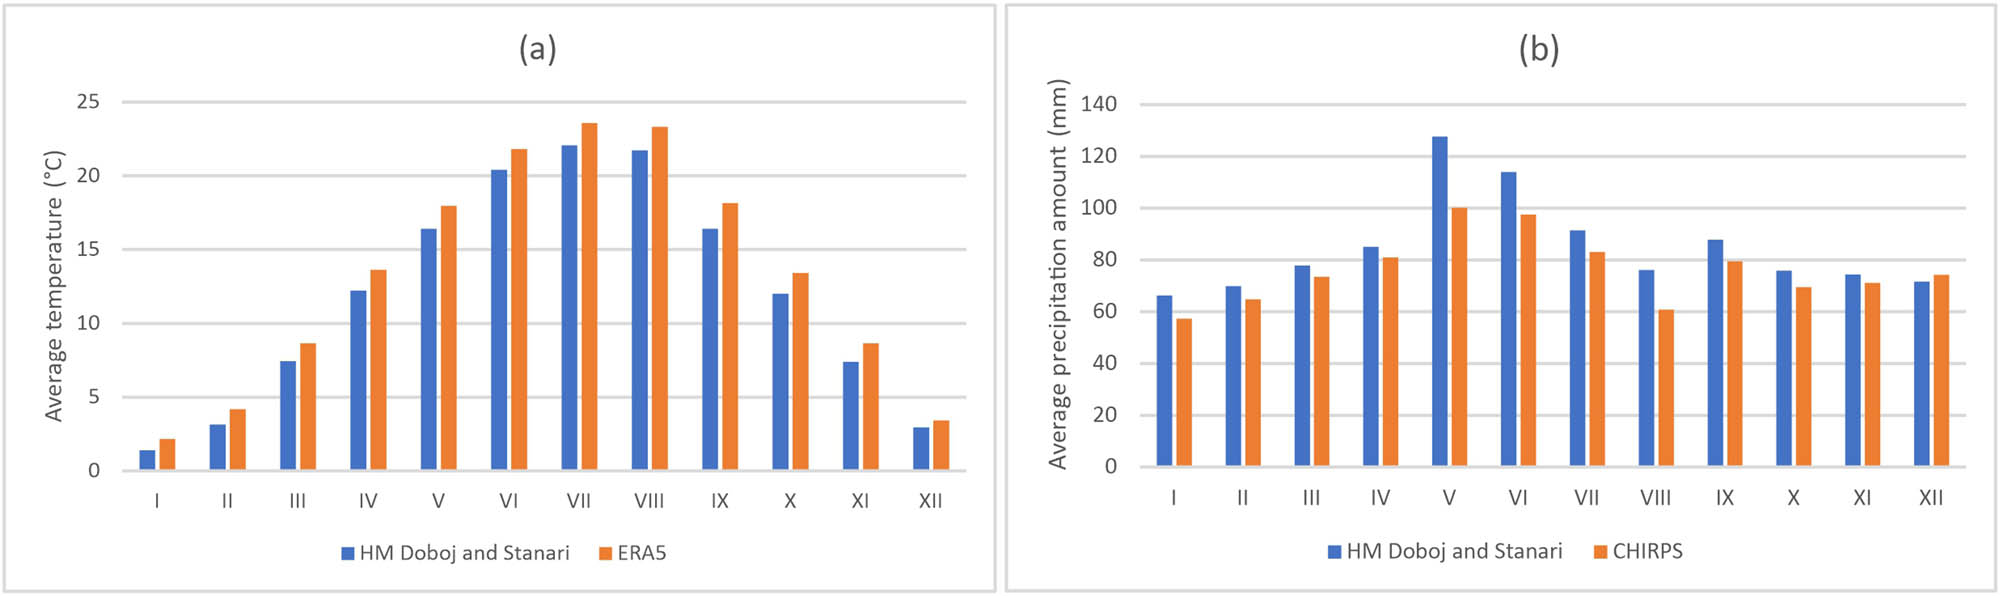
Comparison of (a) T-factor and (b) H-factor (2000–2020).
Comparison of the average precipitation amount HM and CHIRPS indicates a high degree of validity of satellite data (Figure 14b). Two out of 12 months (January and June) are characterized by > 85% agreement between satellite and real data. Eight out of 12 months (February, March, April, July, September, October, November, and December) characterize >90% agreement between satellite data and real data. A lower level of agreement is observed in the months of May (78.47%) and August (79.79%).
The average annual air temperature (2000–2020) of ERA5 satellite data matches the data obtained from the HM stations by 90.33%. The average annual precipitation amount (2000–2020) of CHIRPS satellite data matches the data obtained from the HM stations by 89.68%. Research conducted in the region of North Macedonia by Aleksova et al. [69] identified a high accuracy (98.5%) of ERA5 data for the Kratovska River Basin. Similarly, CHIRPS data, according to the results of Sabljić et al. [101] research, demonstrated high accuracy for the area of B&H (Sana River Basin). Considering that the HM data relate to two points in space, while the satellite data cover the entire area of the Stanari municipality and the city of Doboj, and taking into account the spatial resolution factor of satellite data, it is concluded that satellite data are valid for research and use within the EPM.
According to the previously described methodology and calculated values of the erosion coefficient (Z), air temperature coefficient (T), and annual precipitation amount (H), an erosion map for the municipality of Stanari has been created (Figure 15).
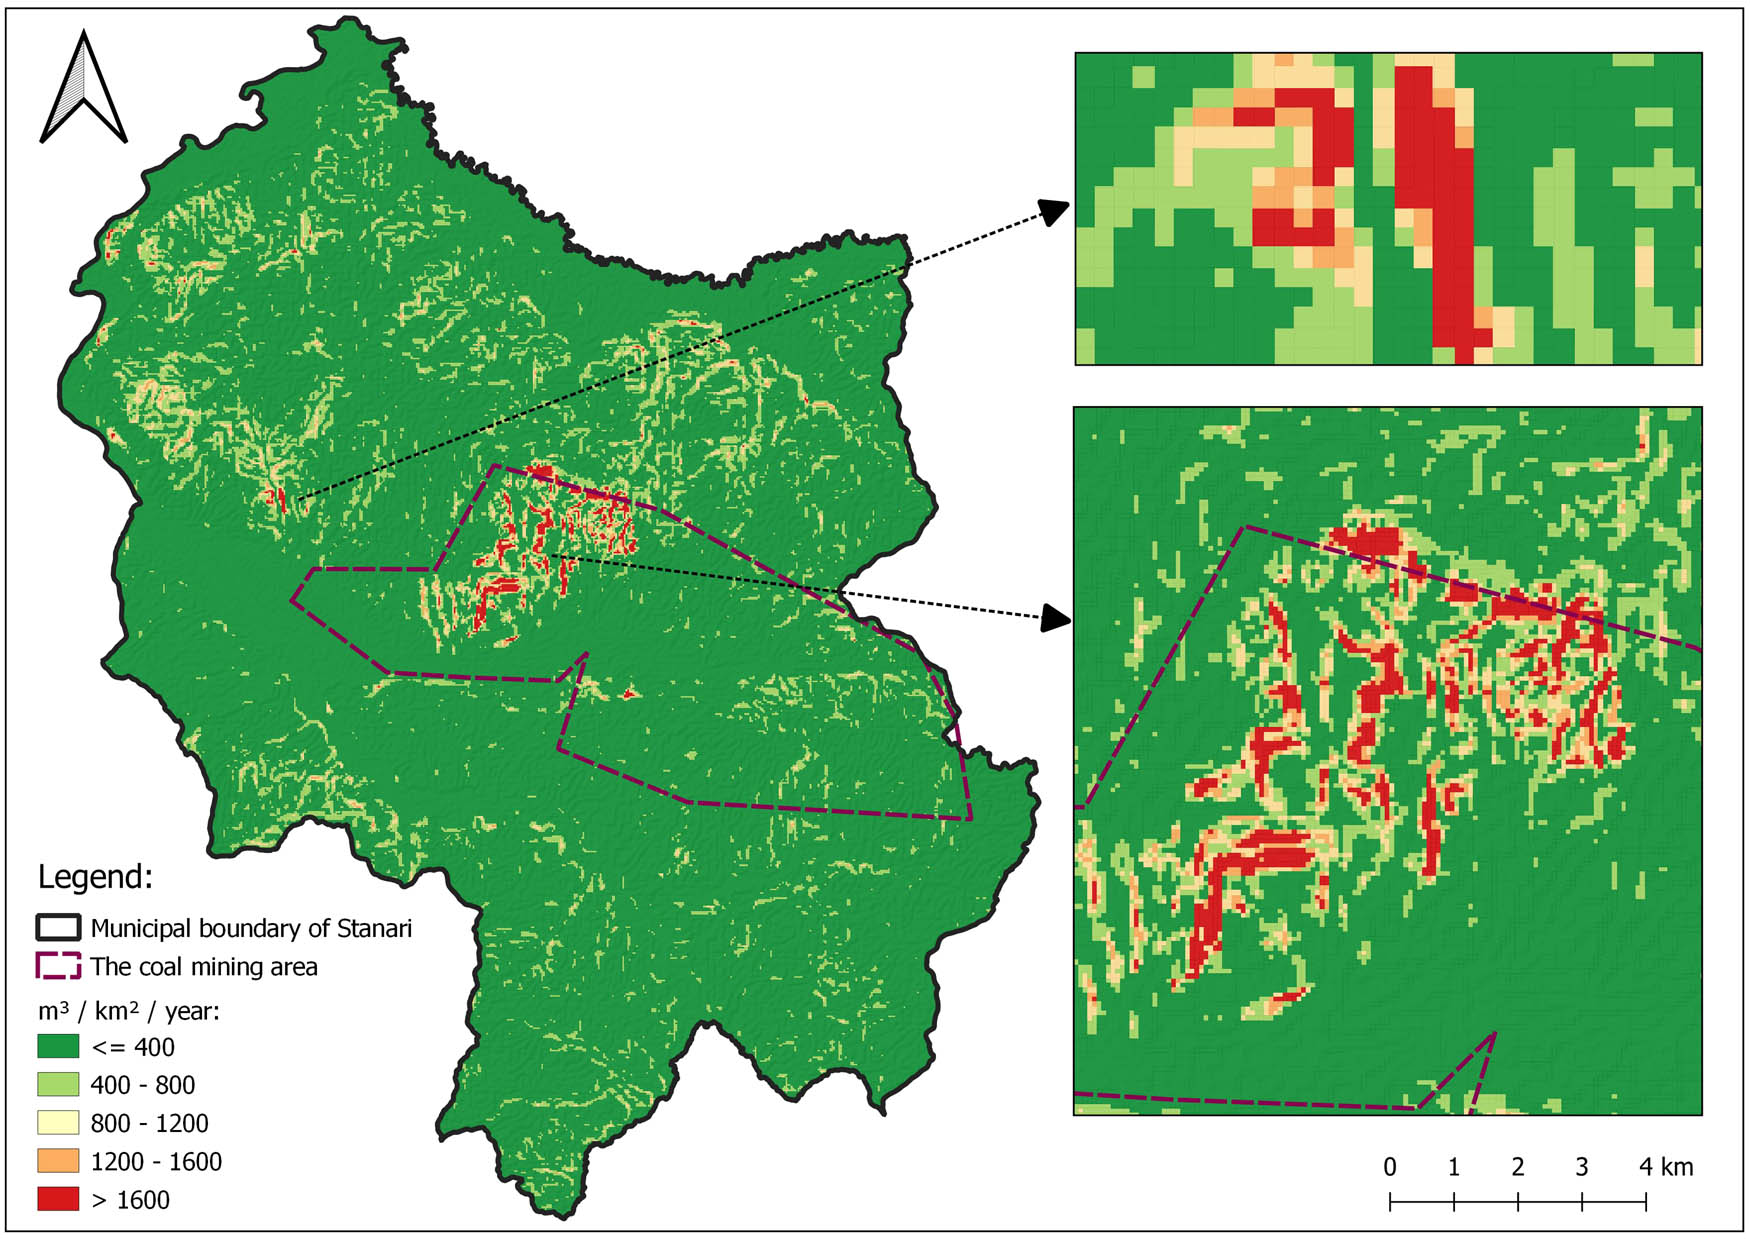
Erosion intensity map of the Stanari municipality.
The results obtained by applying the empirical method for studying mechanical water erosion (W y) at the municipality level indicate a significant share of land with very low and low erosion coefficients (<800), constituting 97.64% of the total municipality area. On the other hand, the share of moderate, high, and very high erosion areas in the municipality amounts to 2.35% (Table 6).
Areas of the Stanari municipality according to the intensity of mechanical water erosion (W y)
| W y | Area (ha) | Percentage (%) |
|---|---|---|
| 0–400 | 14162.69 | 88.42 |
| 400–800 | 1478.38 | 9.22 |
| 800–1,200 | 227.51 | 1.42 |
| 1,200–16,00 | 63.90 | 0.40 |
| >1,600 | 84.77 | 0.53 |
| Total | 16,098 | 100 |
Analyzing the data from Tables 5 and 6, it can be concluded that, in terms of percentage, the share of moderate, high, and very high erosion at the municipal level is almost negligible. However, observing the spatial representation and distribution of the erosion coefficient Z (Figure 13) and the intensity of mechanical water erosion (W y) at the municipal level (Figure 15), it can be inferred that the share of these erosion classes is significantly present within the approved surface mining area. Additionally, through field observations, visible erosion processes with attempts to prevent them have been identified within the mining area (Figure 16a–d).
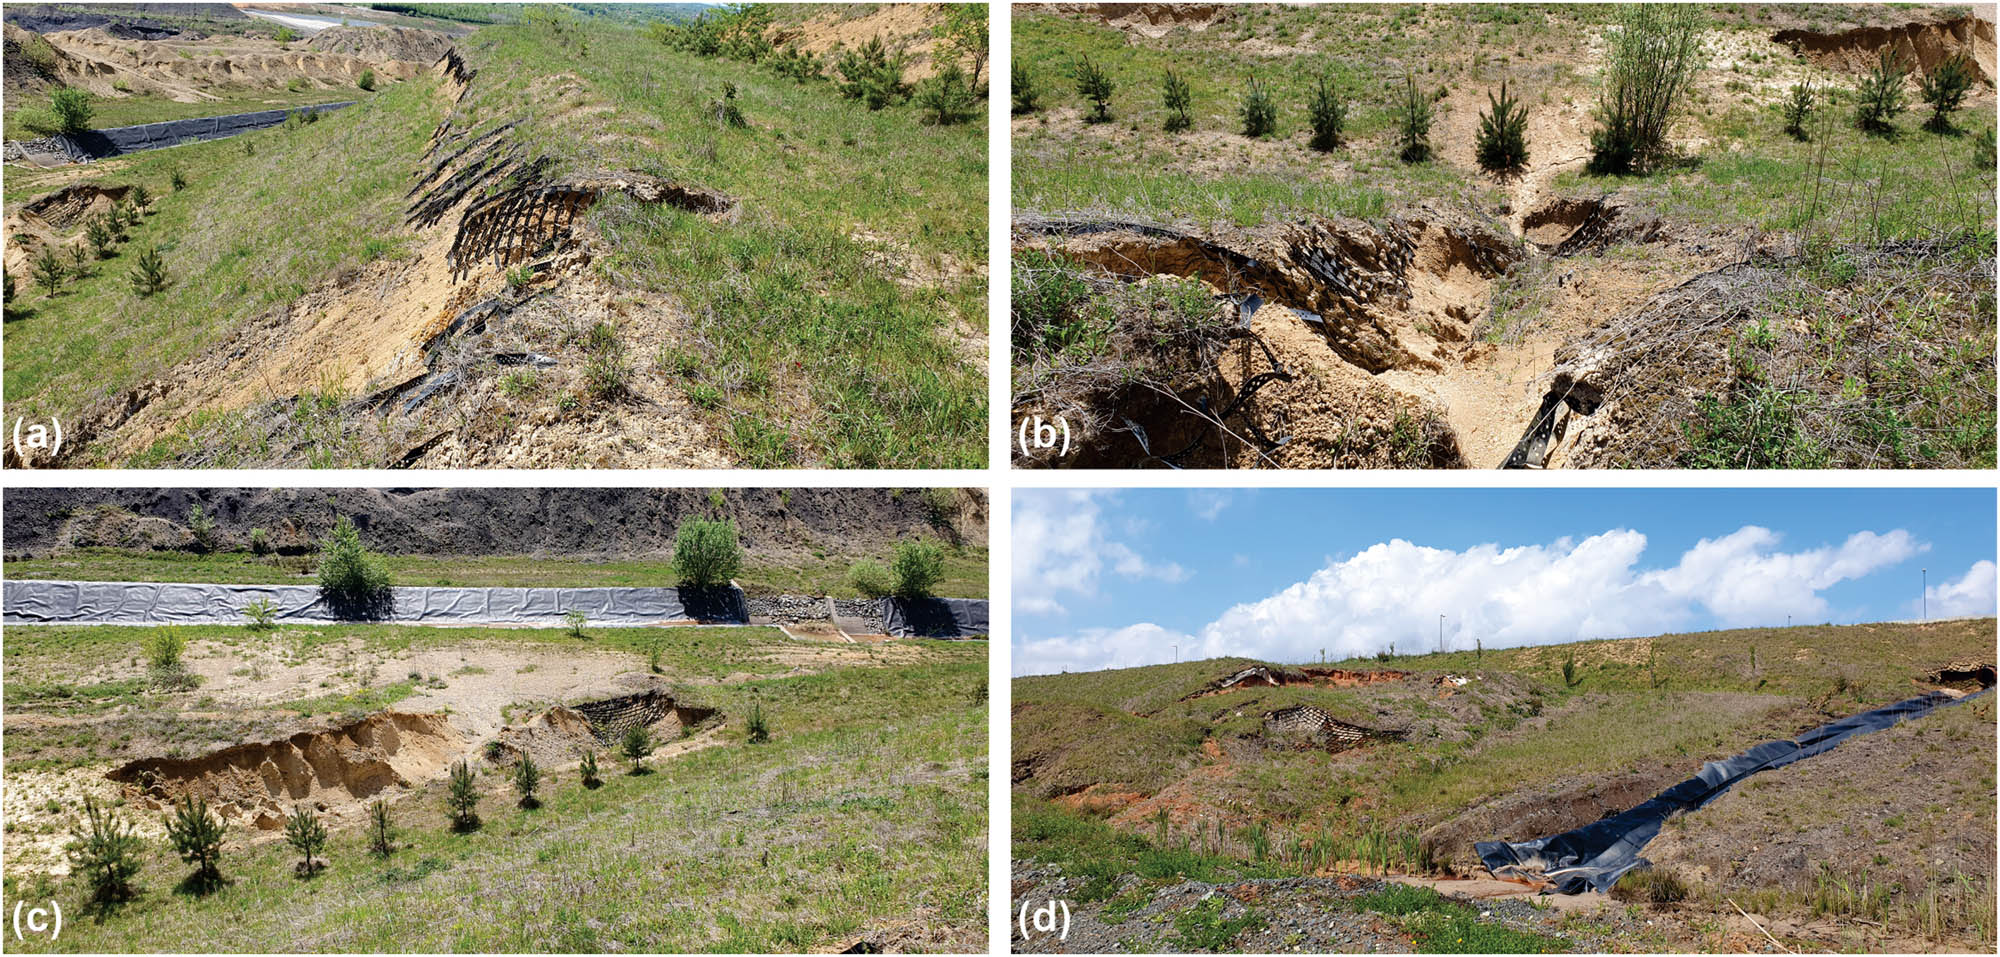
(a)–(d) Visible forms of erosion and measures to control them in the exploitation area of the municipality of Stanari.
Therefore, within the research framework, an analysis was conducted regarding the percentage contribution of Z and W y areas from the approved mining area concerning their total area at the study area level. The obtained results were compared (Figure 17). The participation of the very low and low classes (Z < 0.8; W y < 800;) within the approved mining area, in relation to the total area of these classes at the municipal level, is less than 20%. The Moderate class has a more significant contribution with 55.74% (Z) and 32.05% (W y). Substantial involvement is evident in the high class with 81.65% (Z) and 60.79% (W y), and the jointly highest participation of both parameters is observed in the very high class with 77.48% (Z) and 78.23% (W y). The results indicate a high representation of moderate, high, and very high erosion occurrences (Z > 0.8; W y > 800) within the approved mining area. The area previously identified as deforestation largely aligns with high and very high erosion in the approved mining area. It is concluded that deforestation, as a consequence of mining activities, has caused and intensified erosion processes in the study area. Similar to the presented results, Potić et al. [102] highlighted the impact of deforestation on erosive processes in their research for the southern Serbia region.
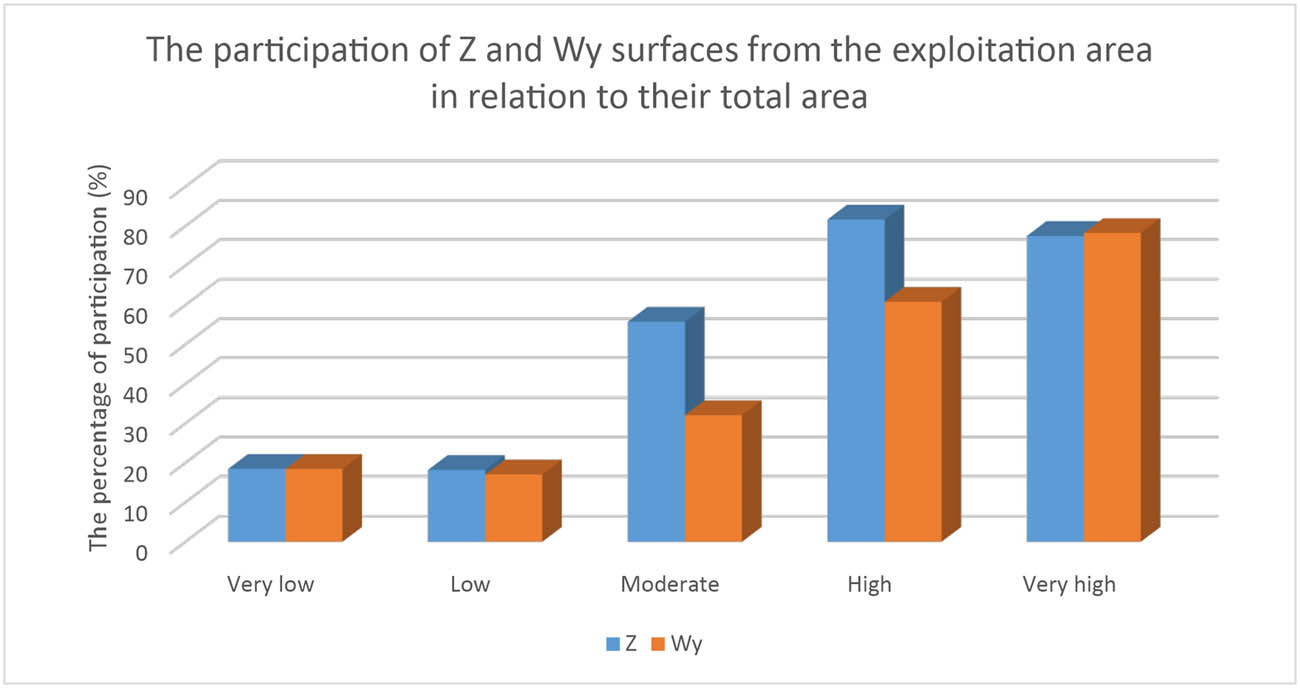
The percentage participation of Z and W y surface areas in relation to their total area within the exploitation area at the level of the study area.
4.4 Reclamation
Due to the consequences caused by mining activities within the project from opening to closing the mine, the process of reclamation and remediation, i.e., the renewal process of degraded land, plays a very important role. According to the current legal regulations (Mining Law of the RS, “Official Gazette of the Republic of Srpska,” No. 62/18), such projects are referred to as Mining Projects. Within the aforementioned law, the area of reclamation is regulated by the Regulation on the Content of Remediation and Reclamation Projects.
The subject of reclamation at the study area level comprises degraded surfaces within the area of the SM “Raškovac.” According to Malić et al. [103], the reclamation process is divided into three phases: technical, agrotechnical, and biological. Braunović [104] emphasizes that technical works encompass the construction of transverse structures (such as thresholds, barriers, rustic fences, and wattle fences) and longitudinal structures (regulations, shore reinforcements, and similar structures). Considering that the subject area is specific, due to surface mining of mineral resources taking place there, the reclamation process is regulated by the Supplementary Mining Project of the SM “Raškovac” in Stanari, Technical Reclamation Project 2016–2021 [105]. The mentioned project involves technical works for the arrangement of final slopes, leveling of final plateaus, and application of humus material. Depending on the phase of technical works, biological works are simultaneously conducted. The arrangement of final slopes aims to create even slope surfaces. Technical activities involve filling erosive channels formed as a consequence of precipitation. Subsequently, anti-erosion nets (AENs) are placed on inclined surfaces to reduce the intensity of water erosion. Specifically, within the area of the SM “Raškovac,” the following AENs were used: 3D polypropylene geomesh – Multimat, coconut coir matting – Hasura, polyethylene (PEHD) geomesh – Geosacks (h = 5 cm), and geomesh with a central organic layer [106]. Also, Malić et al. [103] emphasized that besides AENs, the slope angle (up to 30°) and the length of the slope (maximum 10–12 m) play a significant role in achieving a full effect in reducing water erosion on the final slopes of the disposal site. An essential part of these activities also involves technical works aimed at decreasing the gradient of the slopes. The primary goal of these works is to decrease the intensity of negative consequences of water erosion caused by surface and rainfall waters (such as the formation of erosive channels, nutrient material runoff, seed movement, etc.).
The Supplementary Mining Project for the SM “Raškovac” [105] anticipates carrying out works on arranging the slope of the bench level in such a way that the slope is formed toward the inner slope (counter slope). The goal of these works is to achieve organized and controlled drainage of rainwater toward the ultimate recipient. An integral part of these works involves construction and arrangement of channels for diverting surface water. Previous experiences and positive effects [107] indicate that the channels need to be planned along the slope edges of the deposit, across the terraces, and in the direction of the terrain’s descent, including the creation of drainage and tubular passages. According to the current project, the constructed channels need to be directed toward appropriate receptors at lower levels so that rainfall waters would not accumulate and spill uncontrollably over the recultivated surfaces. It’s possible to partially fill the channels with drainage materials (e.g., gravel) to enable better water and sediment filtration moving through the channels. All mentioned activities are conducted not only along the slopes but also during the final plateau arrangement and stabilization. The purpose of the described process is to reduce the possibility of water erosion occurrence. Specifically, the counter slope is intended to prevent uncontrolled runoff of rainwater down the slope, particularly during heavy downpours, which might lead to water erosion on the same, further complicating the implementation of biological reclamation measures. After the completion of technical works, agrotechnical works are carried out. The goal of these works is to increase the soil fertility level.
The current Supplementary Mining Project [105] foresees the implementation of agrotechnical works using seeding, which is a green fertilizer aimed at enriching the surface layer of the soil with fresh biomass. These works are conducted over larger areas, specifically on final plateaus that can potentially be utilized for agricultural production. After completing the agrotechnical works, biological activities are conducted, which involve the implementation of phytomelioration measures on previously prepared degraded surfaces, with the aim of establishing and maintaining vegetation. The biological activities serve the following functions: revitalization of technogenic soils, defining the permanent purpose of deposits and recultivated lands, environmental protection, contributing to a more appealing appearance of the surroundings, and potentially beneficial use of the reclaimed surface [105]. The primary goal of biological activities is to green the land surfaces, enabling the stabilization of slopes and preventing soil erosion. In this context, it is possible to establish directions for reclamation, such as establishing agricultural and forested areas. Agricultural areas are established on flat terrain, while slopes at different elevations are predisposed to form forested areas. During the implementation of works in biological reclamation, it is necessary to consider the selection of plant species. Within this context, the primary significance lies in previous research studies evaluating the suitability of individual species in the specific area [108,109,110]. The afforestation process according to the Supplementary Mining Project [105] includes: planting time, selection and procurement of seedlings, transportation and protection of seedlings from drying, seedling preparation for planting, digging holes for planting, planting spacing, number of seedlings, and planting technique. Within this project, the positioning of planting holes is envisaged in a triangular form, so that three interrelated seedlings represent the vertices of an equilateral triangle, aiming to reduce the intensity of erosive processes in the initial growth phase of the plants.
The reclamation process has started in the exploitation area “Raškovac,” with some of the previous reclamation works identified and mapped (Figure 18). According to publicly available data from the Stanari TPP (http://www.eft-stanari.net/), in 2006, there was partial reclamation through afforestation on the southeastern and eastern slopes of the external landfill (approximately 10 ha of locust trees were planted). Within the southern slopes of the internal landfill, reclamation has been conducted since 2011. In this area, around 2.5 ha were afforested with deciduous and coniferous species, while on the plateau areas between the reclaimed slopes, direct reclamation (without humus application) was carried out by sowing grass-legume mixtures over an area of approximately 4 ha.
![Figure 18
Identified reclamation within the exploitation area (Sentinel-2 background [RGB] from the year 2023).](/document/doi/10.1515/geo-2022-0671/asset/graphic/j_geo-2022-0671_fig_018.jpg)
Identified reclamation within the exploitation area (Sentinel-2 background [RGB] from the year 2023).
Taking into consideration the previously mentioned points, the exploited area within the research zone, concerning land use, should be restored to its original purpose upon completion of exploitation. Through the reclamation of degraded areas, these should function as agricultural and forested areas in the future.
5 Conclusion
Modern technologies and data collection methods, such as GIS and remote sensing, provide the opportunity for advanced monitoring and timely action in various fields, including environmental and spatial degradation. By utilizing these technologies, it is possible to identify and track changes in space and effectively reduce risks in the geographic environment.
Monitoring changes in land use within the study area over 6 years (2017–2023) has identified significant spatial changes. During this time period, substantial losses of forested areas have been documented, while exploited surfaces have significantly increased.
The primary cause of the occurring spatial changes directly and indirectly represents mining activities. The direct impact of mining activities is visible through deforestation of forested areas and other areas to exploit mineral resources. Pronounced deforestation, “assisted” by mining activities as an indirect factor, has led to other forms of land degradation, such as mechanical soil erosion. In the area of surface exploitation, high and very high values of the erosion coefficient (Z) have been recorded, aligning with spatial patterns of deforestation. Additionally, results obtained by applying the empirical method for studying mechanical soil erosion (W y) indicate a high intensity of erosion in the area of surface exploitation of mineral resources. Besides the mentioned factors, the indirect impact of mining activities can also be traced through population relocation, which is conditioned by the approval of new exploitation areas.
The consequences of direct and indirect impacts of mining activities can be significant. These consequences lead to spatial degradation and environmental disruption. Population displacement has economic and social implications for individuals, such as land loss, infrastructure, jobs, services, cultural heritage, and more. On the other hand, the work of the TPP, which intensifies mining activities in the study area, significantly contributes to economic development. For these reasons, sustainable land use planning is necessary to find a balance between the industry, which drives the municipality’s economic development, and a “healthy environment.” In this process, soil reclamation takes on a fundamental role. Within the study area and exploitation area, various technical (slope leveling, creating counter slopes, and applying AENs), agrotechnical (fertilization and biomass enrichment), and biological (reforestation) methods are evident. The primary objective of these activities is the restoration of degraded areas.
The research emphasizes the significance of datasets obtained through remote sensing in monitoring land use and deforestation, as well as in identifying the intensity of water erosion (mechanical water erosion). Scientific research on monitoring land degradation using remote sensing and GIS in B&H is scarce, which adds extra importance to this research. Satellite datasets available in near real-time enabled efficient monitoring of changes occurring in space with a degrading effect on the environment. A limiting factor of the research was the absence of a unified digital inventory of mines in B&H, which would provide more precise deforestation data than those presented in this study. Moreover, a higher spatial resolution of the digital elevation model (25 m) within EPM would contribute to a more accurate spatial identification of erosive processes in the study area. Results obtained through an innovative approach employing remote sensing and GIS in this scientific research, particularly in the assessment of land use changes and mechanical water erosion, are crucial for addressing various practical issues in sustainable land use planning, spatial planning, forest ecosystem protection, and environmental conservation. Further advancements in research involve a broader analysis of land degradation through multi-criteria modeling in a GIS environment. Besides the presented results, the modeling would include other factors contributing to spatial degradation (e.g., landslides), providing a more comprehensive view of the direct and indirect impacts of mining activities on the overall land degradation processes.
Acknowledgements
The authors are grateful to the anonymous reviewers whose comments and suggestions greatly improved the manuscript. Additionally, the authors express great gratitude to EFT – Mine and Thermal Power Plant Stanari d.o.o. for enabling terrain visits to the exploitation areas and for allowing photography (No. 896/24). T.L. and S.B.M. acknowledge the support of the Ministry of Science, Technological Development and Innovation of the Republic of Serbia (Grant Nos 451-03-66/2024-03/200125 & 451-03-65/2024-03/200125). Furthermore, T.L. and S.B.M. express their gratitude to the Provincial Secretariat for Higher Education and Scientific Research of Vojvodina (Serbia), No. 000871816 2024 09418 003 000 000 001 04 002 (GLOMERO), under Program 0201 and Program Activity 1012.
-
Funding information: The authors state no funding involved.
-
Author contributions: Conceptualization and methodology: L.S., T.L., and D.B.; GIS software and mapping: L.S. and D.D.; remote sensing “products”: L.S. and D.B.; technical editing: T.L., S.B.M., and D.D.; supervision: T.L. and S.B.M.; All authors discussed the results and contributed to the final manuscript. All authors have read and agreed to the published version of the manuscript.
-
Conflict of interest: Authors state no conflict of interest.
References
[1] Nachtergaele F, Petri M, Biancalani R, Van Lynden G, Van Velthuizen H. Global land degradation information system (GLADIS) – Beta version: An Information Database for Land Degradation Assessment at Global Level. Land Degrad Assess Dry Lands Technical Rep. 2010;17:1–56.Search in Google Scholar
[2] Turner B, Lambin E, Reenberg A. The emergence of land change science for global environmental change and sustainability. Proc Natl Acad Sci USA. 2007;104(52):20666–71. 10.1073/pnas.0704119104.Search in Google Scholar PubMed PubMed Central
[3] Foley JA, Defries R, Asner GP, Barford C, Bonan G, Carpenter SR, et al. Global consequences of land Use3. Science. 2005;309(5734):570–4. 10.1126/science.1111772.Search in Google Scholar PubMed
[4] Lambin EF, Turner BL, Geist HJ, Agbola SB, Angelsen A, Bruce JW, et al. The causes of land-use and land-cover change: moving beyond the myths. Glob Environ Change. 2001;11(4):261–9. 10.1016/S0959-3780(01)00007-3.Search in Google Scholar
[5] Derouin S. Deforestation: facts, causes & effects. Live Sci. 2023, https://www.livescience.com/27692-deforestation.html.Search in Google Scholar
[6] Bridge G. Contested terrain: mining and the environment. Annu Rev Env Res. 2004;29:205–59. 10.1146/annurev.energy.28.011503.163434.Search in Google Scholar
[7] Moran CJ, Franks DM, Sonter LJ. Using the multiple capitals framework to connect indicators of regional cumulative impacts of mining and pastoralism in the Murray Darling Basin, Australia. Resour Policy. 2013;38(4):733–44. 10.1016/j.resourpol.2013.01.002.Search in Google Scholar
[8] Sonter LJ, Barrett DJ, Soares-Filho BS. Offsetting the impacts of mining to achieve no-net-loss of native vegetation. Conserv Biol. 2014;28(4):1068–76. 10.1111/cobi.12260.Search in Google Scholar PubMed
[9] Simmons JA, Currie WS, Eshleman KN, Kuers K, Monteleone S, Negley TL, et al. Forest to Reclaimed mine land use change leads to altered ecosystem structure and function. Ecol Appl. 2008;18(1):104–18.10.1890/07-1117.1Search in Google Scholar PubMed
[10] Townsend PA, Helmers DP, Kingdon CC, McNeil BE, de Beurs KM, Eshleman KN. Changes in the extent of surface mining and reclamation in the central Appalachians detected using a 1976–2006 Landsat time series. Remote Sens Environ. 2009;113(1):62–72. 10.1016/j.rse.2008.08.012.Search in Google Scholar
[11] Schueler V, Kuemmerle T, Schröder H. Impacts of surface gold mining on land use systems in Western Ghana. AMBIO. 2011;40(5):528–39. 10.1007/s13280-011-0141-9.Search in Google Scholar PubMed PubMed Central
[12] U.S. Environmental Protection Agency. The effects of mountaintop mines and valley fills on aquatic ecosystems of the central Appalachian coalfields. Washington, DC: US Environ Prot Agency; 2011. EPA/600/R-09/138F.Search in Google Scholar
[13] Perović V, Kadović R, Djurdjević V, Braunović S, Čakmak D, Mitrović M, et al. Effects of changes in climate and land use on soil erosion: a case study of the Vranjska Valley, Serbia. Reg Environ Change. 2019;19:1035–46. 10.1007/s10113-018-1456-x.Search in Google Scholar
[14] Ozsahin E, Duru U, Eroglu I. Land use and land cover changes (LULCC), a key to understand soil erosion intensities in the maritsa basin. Water. 2018;10(3):335. 10.3390/w10030335.Search in Google Scholar
[15] Gocić M, Dragićević S, Radivojević A, Martić Bursać N, Stričević , Lj, Đorđević, M. Changes in soil erosion intensivity caused by land use and demographic changes in the Jablanica river basin, Serbia. Agriculture. 2020;10(8):345. 10.3390/agriculture10080345.Search in Google Scholar
[16] Eswaran H, Lai R, Reich PF. Land degradation: an overview. proceedings of the 2nd international conference on land degradation and desertification. New Dehli, India, Khon Kaen, Thailand: Oxford Press; 2001. p. 20–35.10.1201/9780429187957-4Search in Google Scholar
[17] Vujačić D, Milevski I, Mijanović D, Vujović F, Lukić TI. Initial results of comparative assessment of soil erosion intensity using the WintErO model: a case study of Polimlje and Shirindareh drainage basins. Carpathian J Earth Environ Sci. 2023;18(2):385–404. 10.26471/cjees/2023/018/267.Search in Google Scholar
[18] Bezak N, Borelli P, Mikoš M, Auflič MJ, Panagos P. Towards multi-model soil erosion modelling: An evaluation of the erosion potential method (EPM) for global soil erosion assessments. CATENA. 2024;234:107596. 10.1016/j.catena.2023.107596.Search in Google Scholar
[19] Mitasova H, Hofierka J, Zlocha M, Iverson LR. Modelling topographic potential for erosion and deposition using GIS. Int J Geographic Inf Syst. 1996;10(5):629–41. 10.1080/02693799608902101.Search in Google Scholar
[20] Spalević V. The application of computer-graphic methods in studying runoff and soil erosion intensity in the Berane basin. MSc thesis. Serbia: University of Belgrade: 1999. (in Serbian).Search in Google Scholar
[21] Bakker MM, Govers G, Kosmas C, Vanacker V, van Oost K, Rounsevell M. Soil erosion as a driver of land-use change. Agric, Ecosyst Environ. 2005;105(3):467–81. 10.1016/j.agee.2004.07.009.Search in Google Scholar
[22] Cerdan O, Govers G, Le Bissonnais Y, Van Oost K, Poesen J, Saby N. Rates and spatial variations of soil erosion in Europe: A study based on erosion plot data. Geomorphology. 2010;122(1–2):167–77. 10.1016/j.geomorph.2010.06.011.Search in Google Scholar
[23] Spalević V. Impact of land use on runoff and soil erosion in Polimlje. PhD thesis. Serbia: University of Belgrade; 2011. (in Serbian).Search in Google Scholar
[24] Životić L, Perović V, Jaramaz D, Đorđević A, Petrović R, Todorović M. Application of USLE, GIS, and remote sensing in the assessment of soil erosion rates in Southeastern Serbia. Pol J Environ Stud. 2012;21(6):1929–35.Search in Google Scholar
[25] Leh M, Bajwa S, Chaubey I. Impact of land use change on erosion risk: an integrated remote sensing, geographic information system and modeling methodology. Land Degrad Dev. 2011;24:409–21. 10.1002/ldr.1137.Search in Google Scholar
[26] Zhang L, Bai KZ, Wang MJ, Karthikeyan R. Basin-scale spatial soil erosion variability: Pingshuo opencast mine site in Shanxi Province, Loess Plateau of China. Nat Hazards. 2016;80:1213–30. 10.1007/s11069-015-2019-9.Search in Google Scholar
[27] Khaledian Y, Kiani F, Ebrahimi S, Brevik EC, Aitkenhead-Peterson J. Assessment and monitoring of soil degradation during land use change using multivariate analysis. Land Degrad Dev. 2017;28:128–41. 10.1002/ldr.2541.Search in Google Scholar
[28] Stefanidis S, Chatzichristaki C. Response of soil erosion in a mountainous watershed to temperature and precipitation trends. Carpathian J Earth Environ Sci. 2017;12(1):35–9.Search in Google Scholar
[29] Spalević V, Barovic G, Vujacic D, Curović M, Behzadfar M, Djurovic N, et al. The Impact of land use changes on soil erosion in the river basin of Miocki Potok, Montenegro. Water. 2020;12(11):2973. 10.3390/w12112973.Search in Google Scholar
[30] Morgan RPC. Soil erosion and conservation. Oxford, London UK: Blackwell Publisher; 2005. p. 304.Search in Google Scholar
[31] Lim KJ, Sagong M, Engel BA, Tang Z, Choi J, Kim KS. GIS-based sediment assessment tool. CATENA. 2005;64(1):61–80. 10.1016/j.catena.2005.06.013.Search in Google Scholar
[32] Mohammadi TA, Nikkami D. Methodologies of preparing erosion features map by using RS and GIS. Int J Sediment Res. 2008;23(2):130–7. 10.1016/S1001-6279(08)60012-8.Search in Google Scholar
[33] Toy TJ. Accelerated erosion: process, problems, and prognosis. Geology. 1982;10(10):524–9. 10.1130/0091-7613(1982)10.Search in Google Scholar
[34] Mhaske SN, Pathak K, Dash SS, Nayak DB. Assessment and management of soil erosion in the hilltop mining dominated catchment using GIS integrated RUSLE model. J Environ Manag. 2021;294:112987. 10.1016/j.jenvman.2021.112987.Search in Google Scholar PubMed
[35] Sonter LJ, Moran CJ, Barrett DJ, Soares-Filho BS. Processes of land use change in mining regions. J Clean Prod. 2014;84:494–501. 10.1016/j.jclepro.2014.03.084.Search in Google Scholar
[36] Cragg W, Pearson D, Cooney J. Ethics, surface mining and the environment. Resour Policy. 1995;21(4):229–35. 10.1016/0301-4207(96)85056-2.Search in Google Scholar
[37] Kondratenko L, Gura D, Shaidullina V, Rogulin R, Kondrashev S. Restoration of vegetation around mining enterprises. Saudi J Biol Sci. 2022;29(3):1881–6. 10.1016/j.sjbs.2021.10.034.Search in Google Scholar PubMed PubMed Central
[38] Sato HP, Hasegawa H, Fujiwara S, Tobita M, Koarai M, Une H, et al. Interpretation of landslide distribution triggered by the 2005 Northern Pakistan earthquake using SPOT 5 imagery. Landslides. 2007;4:113–22. 10.1007/s10346-006-0069-5.Search in Google Scholar
[39] Mi J, Yang Y, Zhang S, An S, Hou H, Hua Y, et al. Tracking the Land use/land cover change in an area with underground mining and reforestation via continuous landsat classification. Remote Sens. 2019;11(4):1719. 10.3390/rs11141719.Search in Google Scholar
[40] Wu C, Li X, Chen W, Li X. A review of geological applications of high-spatial-resolution remote sensing data. J Circuits Syst Comput. 2020;29(6):2030006. 10.1142/S0218126620300068.Search in Google Scholar
[41] Republika Srpska Institute of statistics. Census of population. Census of population, households and dwellings in Republika Srpska. 2017, 2013. Banja Luka: Republika Srpska Institute of Statistics; 2017.Search in Google Scholar
[42] Tošić , R. The Balance of deposit in the Ukrina river Basin, Glasnik/Herald. 2005;10:59–75. (in Serbian).Search in Google Scholar
[43] Sofilj R, Marinković D, Đorđević D, Pamić J. Basic geological map SFRY (scale 1:100,000) Derventa L33–120. Sarajevo: RO Geoinženjering - ICA Institute for Geology Sarajevo; 1964–1984.Search in Google Scholar
[44] Basic soil map of Bosnia and Herzegovina in a scale of 1:50,000. Sarajevo: Institute of AgroPedology; 1990.Search in Google Scholar
[45] Transon J, D’Andrimont R, Maugnard A, Defourny P. Survery of hyperspectral earth observation applications from space in the Sensinel-2 Context. Remote Sens. 2018;10(2):157. 10.3390/rs10020157.Search in Google Scholar
[46] Brown CF, Brumby SP, Guzder-Wiliams B, Birch T, Hyde SB, Mazzariello J, et al. Dynamic World, Near real-time global 10 m land use land cover mapping. Nat – Sci Data. 2022;9:251. 10.1038/s41597-022-01307-4.Search in Google Scholar
[47] Hansen MC, Potapov PV, Moore R, Hancher M, Turubanova SA, Tyukavina A, et al. High-resolution global maps of 21st-century forest cover change. Science. 2013;342(6160):850–3. 10.1126/science.1244693.Search in Google Scholar PubMed
[48] Durlević U, Novković I, Lukić T, Valjarević A, Samardžić I, Krstić F, et al. Multihazard susceptibility assessment: a case study – municipality of Štrpce (Southern Serbia). Open Geosci. 2021;13(1):1414–31. 10.1515/geo-2020-0314.Search in Google Scholar
[49] Micić Ponjiger T, Lukić T, Wilby RL, Marković SB, Valjarević A, Dragićević S, et al. Evaluation of rainfall erosivity in the western Balkans by mapping and clustering ERA5 reanalysis data. Atmosphere. 2023;14(1):104. 10.3390/atmos14010104.Search in Google Scholar
[50] Gavrilović S. Engineering of flash floods and erosion. 292, Izgradnja, Belgrade, Serbia: 1972. (in Serbian).Search in Google Scholar
[51] Vujačić D. Calculation of soil erosion intensity in the Polimlje (Montenegro and Serbia) and Shirindareh Watershed (Iran) using the WintErO Model. PhD Thesis. Serbia: University of Novi Sad; 2019. (in Serbian).Search in Google Scholar
[52] Lazarević R. Maps of erosion in the Republic of Bosnia and Herzegovina (1:25,000). Sarajevo, Bosnia and Herzegovina: RO, Vodoprivreda (Final Report for1985). 1985;2–43. (in Serbian).Search in Google Scholar
[53] Lazarević R. New procedure for determining the erosion coefficient (Z). Erozija-stručno informativni Bilt. 1985;13:53–61. (in Serbian).Search in Google Scholar
[54] Tošić R, Dragićević S, Lovrić N. Assessment of soil erosion and sediment yield changes using erosion potential model – case study: Republic of Srpska (BiH). Carpathian J Earth Environ Sci. 2012;7(4):147–54.Search in Google Scholar
[55] Tošić R, Lovrić N, Dragićević S. Assesment of the impact of depopulation on soil erosion: case study – Republika Srpska (Bosnia and Herzegovina). Carpathian J Earth Environ Sci. 2019;14(2):505–18. 10.26471/cjees/2019/014/099.Search in Google Scholar
[56] Lovrić N, Tošić R. Assessment of soil erosion and sediment yield using erosion potential method: case study – Vrbas River Basin (B&H). Bull Serbian Geographical Soc. 2018;98(1):1–14. 10.2298/GSGD180215002L.Search in Google Scholar
[57] Golijanin J, Nikolić G, Valjarević A, Ivanović R, Tunguz V, Bojić S, et al. Estimation of potential soil erosion reduction using GIS-based RUSLE under different land cover management models: A case study of Pale Municipality, B&H. Front Environ Sci. 2022;10:945789. 10.3389/fenvs.2022.945789.Search in Google Scholar
[58] Dragićević S, Novković I, Milutinović M. The erosion intensity changes in Zaječar municipality. Bull Serbian Geographical Soc. 2009;89(4):3–16. 10.2298/GSGD0904003D.Search in Google Scholar
[59] Perović V, Životić L, Kadović R, Đorđević A, Jaramaz D, Mrvić V. Spatial modelling of soil erosion potential in mountainous watershed of South-eastern Serbia. Environ Earth Sci. 2013;68:115–28. 10.1007/s12665-012-1720-1.Search in Google Scholar
[60] Manojlović S, Antić M, Šantić D, Sibinović M, Carević I, Srejić T. Anthropogenic Impact on erosion intensity: case study of rural areas of Pirot and Dimitrovgrad municipalities, Serbia. Sustainability. 2018;10(3):826. org/10.3390/su10030826.Search in Google Scholar
[61] Kalkan KS, Forkapić SM, Marković SB, Bikit KI, Tošić RS, Mrđa DS, et al. Study of hanging valley in loess-paleosoil sediments with soil erosion assessment using nuclear and erosion potential methods. Nucl Technol & Radiat Prot. 2022;37(1):65–77. 10.2298/NTRP2201065K.Search in Google Scholar
[62] Kostadinov S, Braunović S, Dragićević S, Zlatić M, Dragović N, Rakonjac N. Effects of erosion control works: case study – Grdelica Gorge, the South Morava River (Serbia). Water. 2018;10(8):1094. 10.3390/w10081094.Search in Google Scholar
[63] Spalevic V, Curovic M, Barovic G, Vujacic D, Tunguz V, Djurovic N. Soil erosion in the river basin of Provala. Monten Agricu For. 2015;61(4):133–43.10.17707/AgricultForest.61.4.14Search in Google Scholar
[64] Spalevic V, Vujacic D, Barovic G, Simunic I, Moteva M, Tanaskovikj V. Soil erosion evaluation in the Rastocki Potok watershed of Montenegro using the erosion potential method. J Agric Food Environ Sci. 2016;69:32–40.Search in Google Scholar
[65] Dragičević N, Karleuša B, Ožanić N. Effect of land cover/use change on soil erosion assessment in Dubračina catchment (Croatia). Eur Water. 2017;57:171–7.Search in Google Scholar
[66] Dragičević N, Karleuša B, Ožanić N. Erosion potential method (Gavrilović method) sensitivity analysis. Soil Water Res. 2017;12(1):51–9. 10.17221/27/2016-SWR.Search in Google Scholar
[67] Milevski I, Dragićević S, Kostadinov S. Digital elevation model and satellite images: an assessment of soil erosion potential in the Pcinja catchment. Bull Serbian Geogr Soc. 2007;87(2):11–20.10.2298/GSGD0702011MSearch in Google Scholar
[68] Milevski I. Factors, forms, assessment and human impact on excess erosion and deposition in upper Bregalnica watershed (Republic of Macedonia). Z Geomorphol. 2011;55(1):77–94. 10.1127/0372-8854/2011/0055S1-0039.Search in Google Scholar
[69] Aleksova B, Lukić T, Milevski I, Spalević V, Marković SB. Modelling water erosion and mass movements (wet) by using GIS-based multi-hazard susceptibility assessment approaches: a case study–Kratovska Reka catchment (North Macedonia). Atmosphere. 2023;14(7):1139. 10.3390/atmos14071139.Search in Google Scholar
[70] Tazioli A. Evaluation of erosion in equipped basins. Preliminary results of a comparison between the Gavrilovic model and direct measurements of sediment transport. Environ Geol. 2009;56(5):825–31. 10.1007/s00254-007-1183-y.Search in Google Scholar
[71] Dominici R, Larosa S, Viscomi A, Mao L, De Rosa R, Cianflone G. Yield erosion sediment (YES): a PyQGIS plugin-in for the sediments production claculation based on the erosion potential method. Geosciences. 2020;10(8):324. 10.3390/geosciences10080324.Search in Google Scholar
[72] Zorn M, Komarc B. The importance of measuring erosion processes on the example of Slovenia. Hrvatski Geografski Glas. 2011;73(2):19–34. 10.21861/hgg.2011.73.02.02.Search in Google Scholar
[73] Mallinis G, Maris F, Kalinderis I, Koutsias N. Assessment of post-fire soil erosion risk in fire affected watersheds using remote sensing and GIS. GISci Remote Sens. 2009;46(4):388–410. 10.2747/1548-1603.46.4.388.Search in Google Scholar
[74] Efthimiou N, Lykoudi E. Soil erosion estimation using the EPM model. Bull Geol Soc Greece. 2016;50(1):305–14. 10.12681/bgsg.11731.Search in Google Scholar
[75] Stefanidis S, Stathis D. Effect of climate change on soil erosion in a mountainous mediterranean catchment (Central Pindus, Greece). Water. 2018;10(10):1469. 10.3390/w10101469.Search in Google Scholar
[76] Kazimierski LD, Irigoyen M, Re M, Menendez AN, Spalletti P, Brea JD. Impact of Climate Change on sediment yield from the Upper Plata Basin. Int J River Basin Manag. 2013;11(4):411–21. 10.1080/15715124.2013.828066.Search in Google Scholar
[77] Tavares AS, Spalevic V, Avanzi JC, Nogueira DA, Silva MLN, Mincato RL. Modelagem da erosão hídrica pelo método de erosão potencial em uma sub-bacia hidrográfica de referência no sul de Minas Gerais. Semina: Ciências Agrárias. 2019;40(2):555–72. 10.5433/1679-0359.2019v40n2p555.Search in Google Scholar
[78] Tavares AS, Uagoda RES, Spalevic V, Mincato RL. Analysis of the erosion potential and sediment yield using the IntErO model in an experimental watershed dominated by karst in Brazil. Agric For. 2021;67(2):153–62. 10.17707/AgricultForest.67.2.11.Search in Google Scholar
[79] da Silva RM, Santos CAG, Silva AM. Predicting Soil Erosion and Sediment Yield in the Tapacurá Catchment, Brazil. J Urban Environ Eng. 2014;8(1):75–82. 10.4090/juee.2014.v8n1.75-82.Search in Google Scholar
[80] Lense GHE, Parreiras TC, Moreira RS, Avanzi JC, Mincato RL. Estimates of soil losses by the erosion potential method in tropical latosols. Ciência e Agrotecnologia. 2019;43:e012719. 10.1590/1413-7054201943012719.Search in Google Scholar
[81] Rodrigues Neto MR, Musselli DG, Lense GHE, Servidoni LE, Stefanidis S, Spalevic V, et al. Soil loss modelling by the IntErO model – Erosion Potential Method in the Machado River Watershed, Minas Gerais, Brazil. Agric For. 2022;68(2):7–21. 10.17707/AgricultForest.68.2.01.Search in Google Scholar
[82] Ali SS, Al-Umary FA, Salar SG, Al-Ansari N, Knutsson S. GIS Based Soil Erosion Estimation Using EPM Method, Garmiyan Area, Kurdistan Region, Iraq. J Civ Eng Archit. 2016;10:291–308. 10.17265/1934-7359/2016.03.004.Search in Google Scholar
[83] Behzadfar M, Tazioli A, Vukelic-Shutoska M, Simunic I, Spalevic V. Calculation of Sediment yield in the S-1 watershed, Shirindareh watershed, Iran. Agric For. 2014;60(4):207–16.Search in Google Scholar
[84] Barovic G, Leandro Naves Silva M, Veloso Gomes Batista P, Vujacic D, Soares Souza W, Cesar Avanzi J, et al. Estimation of sediment yield using the IntErO model in the S1-5 watershed of the Shirindareh river Basin, Iran. Agric For. 2015;61(3):233–43. 10.17707/AgricultForest.61.3.23.Search in Google Scholar
[85] Hazbavi Z, Azizi E, Sharifi Z, Alaei N, Mostafazadeh R, Behzadfar M, et al. Comprehensive estimation of erosion and sediment components using intErO model in the KoozehTopraghi Watershed. Ardabil Province Environ Eros Res J. 2020;10(1):92–110.Search in Google Scholar
[86] Poornazari N, Khalilimoghadam B, Hazbavi Z, Bagheri Bodaghabadi M. Land degradation assessment in the dust hotspot of southeastern Ahvaz, Iran. Land Degrad Dev. 2021;32(2):896–913. 10.1002/ldr.3748.Search in Google Scholar
[87] Abdullah M, Feagin R, Musawi L. The use of spatial empirical models to estimate soil erosion in arid ecosystems. Environ Monit Assess. 2017;189:78. 10.1007/s10661-017-5784-y.Search in Google Scholar PubMed
[88] Sabri EM, Boukdir A, Karaoui I, Skataric G, Nacka M, Khaledi Darvishan A, et al. Modelling of soil erosion processes and runoff for sustainable watershed management: case study Oued El Abid watershed, Morocco. Agric For. 2019;65(4):241–50. 10.17707/AgricultForest.65.4.22.Search in Google Scholar
[89] Ouallali A, Aassoumi H, Moukhchane M, Moumou A, Houssni M, Spalevic V. Sediment mobilization study on cretaceous, tertiary and quaternary lithological formations of an external Rif catchment, Morocco. Hydrol Sci J. 2020;65(9):1568–82. 10.1080/02626667.2020.1755435.Search in Google Scholar
[90] Sabri E, Spalevic V, Boukdir A, Karaoui I, Ouallali A, Mincato RL, et al. Estimation of soil losses and reservoir sedimentation: a case study in Tillouguite Sub-basin (High Atlas-Morocco). Agric For. 2022;68(2):207–20. 10.17707/AgricultForest.68.2.15.Search in Google Scholar
[91] Chalise D, Kumar L, Spalevic V, Skataric G. Estimation of sediment yield and maximum outflow using the IntErO model in the Sarada river basin of Nepal. Water. 2019;11(5):952. 10.3390/w11050952.Search in Google Scholar
[92] Elbadaoui E, Mensour S, Ikirri M, Abdelrahman K, Abu-Alam T, Abioui M. Integrating erosion potential model (EPM) and PAP/RAC guidelines for water erosion mapping and detection of vulnerable areas in the Toudgha river watershed of the central high Atlas, Morocco. Land. 2023;12(4):837. 10.3390/land12040837.Search in Google Scholar
[93] Veličković N, Todosijević M, Šulić D. Erosion map reliability using a geographic information system (GIS) and erosion potential method (EPM): a comparison of mapping methods, BELGRADE peri-urban area, Serbia. Land. 2022;11(7):1096. 10.3390/land11071096.Search in Google Scholar
[94] Milanović M, Tomić M, Perović V, Radovanović M, Mukherjee S, Jakšić D, et al. Land degradation analysis of mine-impacted zone of Kolubara in Serbia. Environ Earth Sci. 2017;76:580. 10.1007/s12665-017-6896-y.Search in Google Scholar
[95] Milevski I, Dragicevic S, Radevski I. GIS and remote sensing based natural hazard modelling of Kriva river catchment, Republic of Macedonia. Z Geomorphol. 2017;61(2):213–28. 10.1127/zfg_suppl/2016/0364.Search in Google Scholar
[96] Landis JR, Koch GG. The measurement of observer agreement for categorical data. Biometrics. 1977;33(1):150–74.10.2307/2529310Search in Google Scholar
[97] Yang X, Lo CP. Using a time series of satellite imagery to detect land use and land cover changes in the Atlanta, Georgia metropolitan area. Int J Remote Sens. 2002;23(9):1775–98. 10.1080/01431160110075802.Search in Google Scholar
[98] Van Vliet J, Bregt AK, Hagen-Zanker A. Revisiting Kappa to account for change in the accuracy assessment of land-use change models. Ecol Model. 2011;222(8):1367–75. 10.1016/j.ecolmodel.2011.01.017.Search in Google Scholar
[99] Hong F, He G, Wang G, Zhang Z, Peng Y. Monitoring of land cover and vegetation changes in Juhugeng coal mining area based on multi-source remote sensing data. Remote Sens. 2023;15(13):3439. 10.3390/rs15133439.Search in Google Scholar
[100] Gbedzi DD, Ofosu EA, Mortey EM, Obiri-Yeboah A, Nyantakyi EK, Siabi EK, et al. Impact of mining on land use land cover change and water quality in the Asutifi North District of Ghana, West Africa. Environ Chall. 2022;6:100441. 10.1016/j.envc.2022.100441.Search in Google Scholar
[101] Sabljić L, Pavić D, Savić S, Bajić D. Extreme precipitations and their influence on the river flood hazards – a case study of the Sana river basin in Bosnia and Herzegovina. Geograp Pannonica. 2023;27(3):184–98. 10.5937/gp27-45600.Search in Google Scholar
[102] Potić I, Mihajlović LjM, Šimunić V, Ćurčić NB, Milinčić M. Deforestation as a cause of increased surface runoff in the catchment: remote sensing and SWAT approach – a case study of Southern Serbia. Front Environ Sci. 2022;10:896404. 10.3389/fenvs.2022.896404.Search in Google Scholar
[103] Malić N, Kotoran R, Kovačević G. Positive examples of reclamation of technogenic areas at the SM Raškovac – Stanari. Proceedings from the II Mining-Geological Forum. Prijedor, Bosnia Herzeg. 2016;60–9. (in Serbian).Search in Google Scholar
[104] Braunović S. Effects of erosion control works on the state of erosion in Grdelicka Gorge and Vranjska Valley, PhD thesis. Belgrade, Serbia: University of Belgrade; 2013. (in Serbian)Search in Google Scholar
[105] Mining Institute Banja Luka. Supplementary mining project SM “Raškovac” Stanari 2016–2021. Technical project for reclamation. 2015, (in Serbian).Search in Google Scholar
[106] Malić N, Jakovljević I. Stabilization and reclamation of slopes at mine dump sites by application of anti-erosion grids. Proc VI Int Conf “Coal”. 2013;171–80. Zlatibor, Serbia. in Serbian.Search in Google Scholar
[107] Mining Institute Banja Luka. Supplementary mining project SM “Raškovac” Stanari 2011–2015. Technical project for reclamation. 2010, (in Serbian).Search in Google Scholar
[108] Malić N, Lakić Ž. Probability breeding of tall fescue (Festuca arrundinaceaae Schreb.) in reclamation of deposol of Stanari. Agro-knowledge J. 2011;12(1):57–65. (in Serbian).Search in Google Scholar
[109] Malić N. Reclamation of Stanari deposits using agromeliorative measures and sowing grass-legume mixtures. PhD thesis. Bosnia and Herzegovina: University of Banja Luka; 2015. (in Serbian).Search in Google Scholar
[110] Malić N, Matko Stamenković U. Effect of nitrogen fertilizer on growth of seeded grassland dry biomass in process of deposol: biological reclamation. Zemljište i biljka. 2019;68(2):12–23. 10.5937/ZemBilj1902012M.Search in Google Scholar
© 2024 the author(s), published by De Gruyter
This work is licensed under the Creative Commons Attribution 4.0 International License.
Articles in the same Issue
- Regular Articles
- Theoretical magnetotelluric response of stratiform earth consisting of alternative homogeneous and transitional layers
- The research of common drought indexes for the application to the drought monitoring in the region of Jin Sha river
- Evolutionary game analysis of government, businesses, and consumers in high-standard farmland low-carbon construction
- On the use of low-frequency passive seismic as a direct hydrocarbon indicator: A case study at Banyubang oil field, Indonesia
- Water transportation planning in connection with extreme weather conditions; case study – Port of Novi Sad, Serbia
- Zircon U–Pb ages of the Paleozoic volcaniclastic strata in the Junggar Basin, NW China
- Monitoring of mangrove forests vegetation based on optical versus microwave data: A case study western coast of Saudi Arabia
- Microfacies analysis of marine shale: A case study of the shales of the Wufeng–Longmaxi formation in the western Chongqing, Sichuan Basin, China
- Multisource remote sensing image fusion processing in plateau seismic region feature information extraction and application analysis – An example of the Menyuan Ms6.9 earthquake on January 8, 2022
- Identification of magnetic mineralogy and paleo-flow direction of the Miocene-quaternary volcanic products in the north of Lake Van, Eastern Turkey
- Impact of fully rotating steel casing bored pile on adjacent tunnels
- Adolescents’ consumption intentions toward leisure tourism in high-risk leisure environments in riverine areas
- Petrogenesis of Jurassic granitic rocks in South China Block: Implications for events related to subduction of Paleo-Pacific plate
- Differences in urban daytime and night block vitality based on mobile phone signaling data: A case study of Kunming’s urban district
- Random forest and artificial neural network-based tsunami forests classification using data fusion of Sentinel-2 and Airbus Vision-1 satellites: A case study of Garhi Chandan, Pakistan
- Integrated geophysical approach for detection and size-geometry characterization of a multiscale karst system in carbonate units, semiarid Brazil
- Spatial and temporal changes in ecosystem services value and analysis of driving factors in the Yangtze River Delta Region
- Deep fault sliding rates for Ka-Ping block of Xinjiang based on repeating earthquakes
- Improved deep learning segmentation of outdoor point clouds with different sampling strategies and using intensities
- Platform margin belt structure and sedimentation characteristics of Changxing Formation reefs on both sides of the Kaijiang-Liangping trough, eastern Sichuan Basin, China
- Enhancing attapulgite and cement-modified loess for effective landfill lining: A study on seepage prevention and Cu/Pb ion adsorption
- Flood risk assessment, a case study in an arid environment of Southeast Morocco
- Lower limits of physical properties and classification evaluation criteria of the tight reservoir in the Ahe Formation in the Dibei Area of the Kuqa depression
- Evaluation of Viaducts’ contribution to road network accessibility in the Yunnan–Guizhou area based on the node deletion method
- Permian tectonic switch of the southern Central Asian Orogenic Belt: Constraints from magmatism in the southern Alxa region, NW China
- Element geochemical differences in lower Cambrian black shales with hydrothermal sedimentation in the Yangtze block, South China
- Three-dimensional finite-memory quasi-Newton inversion of the magnetotelluric based on unstructured grids
- Obliquity-paced summer monsoon from the Shilou red clay section on the eastern Chinese Loess Plateau
- Classification and logging identification of reservoir space near the upper Ordovician pinch-out line in Tahe Oilfield
- Ultra-deep channel sand body target recognition method based on improved deep learning under UAV cluster
- New formula to determine flyrock distance on sedimentary rocks with low strength
- Assessing the ecological security of tourism in Northeast China
- Effective reservoir identification and sweet spot prediction in Chang 8 Member tight oil reservoirs in Huanjiang area, Ordos Basin
- Detecting heterogeneity of spatial accessibility to sports facilities for adolescents at fine scale: A case study in Changsha, China
- Effects of freeze–thaw cycles on soil nutrients by soft rock and sand remodeling
- Vibration prediction with a method based on the absorption property of blast-induced seismic waves: A case study
- A new look at the geodynamic development of the Ediacaran–early Cambrian forearc basalts of the Tannuola-Khamsara Island Arc (Central Asia, Russia): Conclusions from geological, geochemical, and Nd-isotope data
- Spatio-temporal analysis of the driving factors of urban land use expansion in China: A study of the Yangtze River Delta region
- Selection of Euler deconvolution solutions using the enhanced horizontal gradient and stable vertical differentiation
- Phase change of the Ordovician hydrocarbon in the Tarim Basin: A case study from the Halahatang–Shunbei area
- Using interpretative structure model and analytical network process for optimum site selection of airport locations in Delta Egypt
- Geochemistry of magnetite from Fe-skarn deposits along the central Loei Fold Belt, Thailand
- Functional typology of settlements in the Srem region, Serbia
- Hunger Games Search for the elucidation of gravity anomalies with application to geothermal energy investigations and volcanic activity studies
- Addressing incomplete tile phenomena in image tiling: Introducing the grid six-intersection model
- Evaluation and control model for resilience of water resource building system based on fuzzy comprehensive evaluation method and its application
- MIF and AHP methods for delineation of groundwater potential zones using remote sensing and GIS techniques in Tirunelveli, Tenkasi District, India
- New database for the estimation of dynamic coefficient of friction of snow
- Measuring urban growth dynamics: A study in Hue city, Vietnam
- Comparative models of support-vector machine, multilayer perceptron, and decision tree predication approaches for landslide susceptibility analysis
- Experimental study on the influence of clay content on the shear strength of silty soil and mechanism analysis
- Geosite assessment as a contribution to the sustainable development of Babušnica, Serbia
- Using fuzzy analytical hierarchy process for road transportation services management based on remote sensing and GIS technology
- Accumulation mechanism of multi-type unconventional oil and gas reservoirs in Northern China: Taking Hari Sag of the Yin’e Basin as an example
- TOC prediction of source rocks based on the convolutional neural network and logging curves – A case study of Pinghu Formation in Xihu Sag
- A method for fast detection of wind farms from remote sensing images using deep learning and geospatial analysis
- Spatial distribution and driving factors of karst rocky desertification in Southwest China based on GIS and geodetector
- Physicochemical and mineralogical composition studies of clays from Share and Tshonga areas, Northern Bida Basin, Nigeria: Implications for Geophagia
- Geochemical sedimentary records of eutrophication and environmental change in Chaohu Lake, East China
- Research progress of freeze–thaw rock using bibliometric analysis
- Mixed irrigation affects the composition and diversity of the soil bacterial community
- Examining the swelling potential of cohesive soils with high plasticity according to their index properties using GIS
- Geological genesis and identification of high-porosity and low-permeability sandstones in the Cretaceous Bashkirchik Formation, northern Tarim Basin
- Usability of PPGIS tools exemplified by geodiscussion – a tool for public participation in shaping public space
- Efficient development technology of Upper Paleozoic Lower Shihezi tight sandstone gas reservoir in northeastern Ordos Basin
- Assessment of soil resources of agricultural landscapes in Turkestan region of the Republic of Kazakhstan based on agrochemical indexes
- Evaluating the impact of DEM interpolation algorithms on relief index for soil resource management
- Petrogenetic relationship between plutonic and subvolcanic rocks in the Jurassic Shuikoushan complex, South China
- A novel workflow for shale lithology identification – A case study in the Gulong Depression, Songliao Basin, China
- Characteristics and main controlling factors of dolomite reservoirs in Fei-3 Member of Feixianguan Formation of Lower Triassic, Puguang area
- Impact of high-speed railway network on county-level accessibility and economic linkage in Jiangxi Province, China: A spatio-temporal data analysis
- Estimation model of wild fractional vegetation cover based on RGB vegetation index and its application
- Lithofacies, petrography, and geochemistry of the Lamphun oceanic plate stratigraphy: As a record of the subduction history of Paleo-Tethys in Chiang Mai-Chiang Rai Suture Zone of Thailand
- Structural features and tectonic activity of the Weihe Fault, central China
- Application of the wavelet transform and Hilbert–Huang transform in stratigraphic sequence division of Jurassic Shaximiao Formation in Southwest Sichuan Basin
- Structural detachment influences the shale gas preservation in the Wufeng-Longmaxi Formation, Northern Guizhou Province
- Distribution law of Chang 7 Member tight oil in the western Ordos Basin based on geological, logging and numerical simulation techniques
- Evaluation of alteration in the geothermal province west of Cappadocia, Türkiye: Mineralogical, petrographical, geochemical, and remote sensing data
- Numerical modeling of site response at large strains with simplified nonlinear models: Application to Lotung seismic array
- Quantitative characterization of granite failure intensity under dynamic disturbance from energy standpoint
- Characteristics of debris flow dynamics and prediction of the hazardous area in Bangou Village, Yanqing District, Beijing, China
- Rockfall mapping and susceptibility evaluation based on UAV high-resolution imagery and support vector machine method
- Statistical comparison analysis of different real-time kinematic methods for the development of photogrammetric products: CORS-RTK, CORS-RTK + PPK, RTK-DRTK2, and RTK + DRTK2 + GCP
- Hydrogeological mapping of fracture networks using earth observation data to improve rainfall–runoff modeling in arid mountains, Saudi Arabia
- Petrography and geochemistry of pegmatite and leucogranite of Ntega-Marangara area, Burundi, in relation to rare metal mineralisation
- Prediction of formation fracture pressure based on reinforcement learning and XGBoost
- Hazard zonation for potential earthquake-induced landslide in the eastern East Kunlun fault zone
- Monitoring water infiltration in multiple layers of sandstone coal mining model with cracks using ERT
- Study of the patterns of ice lake variation and the factors influencing these changes in the western Nyingchi area
- Productive conservation at the landslide prone area under the threat of rapid land cover changes
- Sedimentary processes and patterns in deposits corresponding to freshwater lake-facies of hyperpycnal flow – An experimental study based on flume depositional simulations
- Study on time-dependent injectability evaluation of mudstone considering the self-healing effect
- Detection of objects with diverse geometric shapes in GPR images using deep-learning methods
- Behavior of trace metals in sedimentary cores from marine and lacustrine environments in Algeria
- Spatiotemporal variation pattern and spatial coupling relationship between NDVI and LST in Mu Us Sandy Land
- Formation mechanism and oil-bearing properties of gravity flow sand body of Chang 63 sub-member of Yanchang Formation in Huaqing area, Ordos Basin
- Diagenesis of marine-continental transitional shale from the Upper Permian Longtan Formation in southern Sichuan Basin, China
- Vertical high-velocity structures and seismic activity in western Shandong Rise, China: Case study inspired by double-difference seismic tomography
- Spatial coupling relationship between metamorphic core complex and gold deposits: Constraints from geophysical electromagnetics
- Disparities in the geospatial allocation of public facilities from the perspective of living circles
- Research on spatial correlation structure of war heritage based on field theory. A case study of Jinzhai County, China
- Formation mechanisms of Qiaoba-Zhongdu Danxia landforms in southwestern Sichuan Province, China
- Magnetic data interpretation: Implication for structure and hydrocarbon potentiality at Delta Wadi Diit, Southeastern Egypt
- Deeply buried clastic rock diagenesis evolution mechanism of Dongdaohaizi sag in the center of Junggar fault basin, Northwest China
- Application of LS-RAPID to simulate the motion of two contrasting landslides triggered by earthquakes
- The new insight of tectonic setting in Sunda–Banda transition zone using tomography seismic. Case study: 7.1 M deep earthquake 29 August 2023
- The critical role of c and φ in ensuring stability: A study on rockfill dams
- Evidence of late quaternary activity of the Weining-Shuicheng Fault in Guizhou, China
- Extreme hydroclimatic events and response of vegetation in the eastern QTP since 10 ka
- Spatial–temporal effect of sea–land gradient on landscape pattern and ecological risk in the coastal zone: A case study of Dalian City
- Study on the influence mechanism of land use on carbon storage under multiple scenarios: A case study of Wenzhou
- A new method for identifying reservoir fluid properties based on well logging data: A case study from PL block of Bohai Bay Basin, North China
- Comparison between thermal models across the Middle Magdalena Valley, Eastern Cordillera, and Eastern Llanos basins in Colombia
- Mineralogical and elemental analysis of Kazakh coals from three mines: Preliminary insights from mode of occurrence to environmental impacts
- Chlorite-induced porosity evolution in multi-source tight sandstone reservoirs: A case study of the Shaximiao Formation in western Sichuan Basin
- Predicting stability factors for rotational failures in earth slopes and embankments using artificial intelligence techniques
- Origin of Late Cretaceous A-type granitoids in South China: Response to the rollback and retreat of the Paleo-Pacific plate
- Modification of dolomitization on reservoir spaces in reef–shoal complex: A case study of Permian Changxing Formation, Sichuan Basin, SW China
- Geological characteristics of the Daduhe gold belt, western Sichuan, China: Implications for exploration
- Rock physics model for deep coal-bed methane reservoir based on equivalent medium theory: A case study of Carboniferous-Permian in Eastern Ordos Basin
- Enhancing the total-field magnetic anomaly using the normalized source strength
- Shear wave velocity profiling of Riyadh City, Saudi Arabia, utilizing the multi-channel analysis of surface waves method
- Effect of coal facies on pore structure heterogeneity of coal measures: Quantitative characterization and comparative study
- Inversion method of organic matter content of different types of soils in black soil area based on hyperspectral indices
- Detection of seepage zones in artificial levees: A case study at the Körös River, Hungary
- Tight sandstone fluid detection technology based on multi-wave seismic data
- Characteristics and control techniques of soft rock tunnel lining cracks in high geo-stress environments: Case study of Wushaoling tunnel group
- Influence of pore structure characteristics on the Permian Shan-1 reservoir in Longdong, Southwest Ordos Basin, China
- Study on sedimentary model of Shanxi Formation – Lower Shihezi Formation in Da 17 well area of Daniudi gas field, Ordos Basin
- Multi-scenario territorial spatial simulation and dynamic changes: A case study of Jilin Province in China from 1985 to 2030
- Review Articles
- Major ascidian species with negative impacts on bivalve aquaculture: Current knowledge and future research aims
- Prediction and assessment of meteorological drought in southwest China using long short-term memory model
- Communication
- Essential questions in earth and geosciences according to large language models
- Erratum
- Erratum to “Random forest and artificial neural network-based tsunami forests classification using data fusion of Sentinel-2 and Airbus Vision-1 satellites: A case study of Garhi Chandan, Pakistan”
- Special Issue: Natural Resources and Environmental Risks: Towards a Sustainable Future - Part I
- Spatial-temporal and trend analysis of traffic accidents in AP Vojvodina (North Serbia)
- Exploring environmental awareness, knowledge, and safety: A comparative study among students in Montenegro and North Macedonia
- Determinants influencing tourists’ willingness to visit Türkiye – Impact of earthquake hazards on Serbian visitors’ preferences
- Application of remote sensing in monitoring land degradation: A case study of Stanari municipality (Bosnia and Herzegovina)
- Optimizing agricultural land use: A GIS-based assessment of suitability in the Sana River Basin, Bosnia and Herzegovina
- Assessing risk-prone areas in the Kratovska Reka catchment (North Macedonia) by integrating advanced geospatial analytics and flash flood potential index
- Analysis of the intensity of erosive processes and state of vegetation cover in the zone of influence of the Kolubara Mining Basin
- GIS-based spatial modeling of landslide susceptibility using BWM-LSI: A case study – city of Smederevo (Serbia)
- Geospatial modeling of wildfire susceptibility on a national scale in Montenegro: A comparative evaluation of F-AHP and FR methodologies
- Geosite assessment as the first step for the development of canyoning activities in North Montenegro
- Urban geoheritage and degradation risk assessment of the Sokograd fortress (Sokobanja, Eastern Serbia)
- Multi-hazard modeling of erosion and landslide susceptibility at the national scale in the example of North Macedonia
- Understanding seismic hazard resilience in Montenegro: A qualitative analysis of community preparedness and response capabilities
- Forest soil CO2 emission in Quercus robur level II monitoring site
- Characterization of glomalin proteins in soil: A potential indicator of erosion intensity
- Power of Terroir: Case study of Grašac at the Fruška Gora wine region (North Serbia)
- Special Issue: Geospatial and Environmental Dynamics - Part I
- Qualitative insights into cultural heritage protection in Serbia: Addressing legal and institutional gaps for disaster risk resilience