Selection of Euler deconvolution solutions using the enhanced horizontal gradient and stable vertical differentiation
-
 ,
,

Abstract
Euler deconvolution is widely used for interpreting magnetic anomalies as it estimates the edges and depths of magnetic sources. Since this method was proposed, there has been an intensive effort to mitigate its primary deficiencies, namely, the generation of many spurious solutions and the high noise sensitivity. To select the most significant solutions, we adopt the strategy of constraining the moving window to the source edges, whose locations are estimated using the enhanced horizontal gradient amplitude method. On the other hand, we reduce noise propagation by performing a stable calculation of the vertical derivatives. For this purpose, we use the β-VDR method, a finite-difference method that yields a robust approximation of the vertical derivatives of magnetic data. The accuracy of the proposed technique is demonstrated on synthetic magnetic anomalies, providing the depths more precisely and being insensitive to noise. Application of this technique is also demonstrated on aeromagnetic anomalies from the Olympic Peninsula (USA), where the obtained result is in good agreement with known information of the study region.
1 Introduction
Euler deconvolution is one of the most often used quantitative interpretation techniques for gravity and magnetic datasets [1,2]. Both the source edge location and depth can be obtained from the Euler deconvolution without information on magnetization intensity or density contrast [3]. It was proposed by Thompson [4] for 2D sources and generalized for 3D sources by Reid et al. [5], who described the technique as a deconvolution based on Euler’s homogeneity equation and coined the term “Euler deconvolution.” Recently, the application of the Euler deconvolution to gravity and magnetic datasets has shown great success in mapping geological structures [6,7,8,9,10]. The Euler deconvolution has gained popularity mostly as a result of how easy it is to use and implement, giving it an excellent choice for a quick initial interpretation.
The deconvolution takes place in a user-defined scanning window, where the source location and regional field are determined by solving a linear least-squares problem [4]. As the window is usually much smaller than the study area, many least-square solutions are generated, most of them being spurious [1,11].
A great deal of research has been devoted to filtering out spurious Euler solutions, among other aspects, for instance, choosing the structural index relating to the source geometry [12] and the deconvolution of other fields than the gravity/magnetic anomaly [13,14]. The approaches for selecting solutions may be classified into two branches, namely, the use of error estimates [4,15,16] and an a-priori selection of horizontal locations based on enhancement filters [1,11,14,17,18].
We focus on the latter class, which takes advantage of an extensive literature on edge-detection methods [19,20,21,22,23,24,25,26,27,28] and has a lower computational cost as the scanning window works on a reduced set of points from the study area grid. In this scope, we use the peaks of the enhanced horizontal gradient amplitude (EHGA) filter that has been applied to map structural boundaries in many recent studies [29,30,31,32], to remove spurious solutions from the Euler deconvolution. In addition, we use the vertical derivative obtained from the β-VDR method [33] instead of those from the usual frequency domain method to provide more stable results for the Euler deconvolution, analogously to Pašteka and Kušnirák [34]. We remark that data with low signal-to-noise ratio can be denoised before applying the Euler deconvolution, as long as the filtering is carefully performed to avoid producing incorrect depth estimates [16].
The accuracy and effectiveness of the presented technique are demonstrated on both synthetic magnetic datasets and a real dataset of the Olympic Peninsula (USA). We compare the proposed approach with other constraining approaches based on the peaks of the analytic signal (AS) and horizontal gradient amplitude (HGA).
2 Method
The 3D Euler deconvolution was introduced to determine the edges and depths of magnetization structures [5]. The 3D form of Euler’s homogeneity equation is given by
where
In general, the vertical derivative of magnetic anomaly is calculated in the frequency domain [35]. However, this approach is sensitive to noise [33]. Here it is suggested to use the vertical derivative obtained from the β-VDR method [33] to provide more stable values than the usual frequency domain technique. According to this method, the vertical derivative of magnetic data is given by
where c 1,…, c 5 are given by
and
Since the Euler deconvolution method tends to generate many spurious solutions, Ruppel et al. [18] used the located Euler deconvolution to remove spurious solutions. Their method uses the peak locations in the AS map for selecting the window locations. The AS is created by combining derivatives of magnetic data, and is given by [37]
However, its peaks are moved inward from the borders for deeper bodies, so that the window locations are not located over the true boundaries in this case. A related approach is to use the peak locations of the HGA [14,38].
Likewise, the HGA is not able to accurately delineate the borders of deep sources. Moreover, peak detection methods are usually not able to detect all maxima of the HGA [39,40].
In this study, we used the peak locations of the EHGA to select the window locations. The method is given by [25]
where k is a constant defined by the researcher. Here we used k = 2 to compute the EHGA [25]. Similar to other methods based on the HGA [41,42], the EHGA works best for reduced to pole (RTP) anomalies. For this reason, magnetic data should be reduced to pole before applying the proposed approach. Moreover, depth estimates by the Euler deconvolution are usually more accurate for data which have been reduced to pole [4].
A remarkable difference between the EHGA and HGA or AS is that the EHGA is able to balance the anomaly of shallow and deep sources, which allows us to use a threshold value to select for selecting the centers of the sliding window. We used the locations of the grid values where the EHGA is greater than or equal to 0.5 for the proposed method. On the other hand, since the HGA and AS are not balanced filters, it is difficult to use a threshold value for detecting the peak locations. In these cases, we use the Blakely and Simpson technique [43] to locate their peaks, then use the locations of these peaks to select the windows for the Euler deconvolution, discarding the peaks whose value is lower than 1% of the maximum value of the HGA (AS).
3 Results and discussion
The efficacy of the technique, which we refer to as ED-EHGA from here on, is demonstrated with a synthetic example and a real field dataset from the Olympic Peninsula (USA). The Euler method was performed through a window containing 10 × 10 grid points, which is a commonly used size for this type of calculation [1], and a structural index of zero because our target structures are contacts. We also compared the proposed method with the located Euler deconvolution [18], the Euler deconvolution with window locations at the peaks of the HGA [14], which we refer to as ED-HGA, and Tilt-depth technique [44]. In all the methods, we remove the isolated solutions, which are more than five grid points away from other solutions [45].
3.1 Theoretical example
We consider a model with two prisms located at depths of 3 km (source A) and 5 km (source B). The parameters of the prisms are given in Table 1. Figure 1a and b present 3D and plan views of the bodies. Figure 2a presents the magnetic anomaly of the sources. Figure 2b and c shows the HGA and the AS of the magnetic anomaly. We can see that these filters do not clearly delineate the deeper prism, although the edges in the HGA are slightly more clear than AS. Figure 2d shows the EHGA of magnetic data. It can be observed that the EHGA yields more accurate edges than the HGA and AS. For this reason, the use of the EHGA can provide better window locations for the Euler deconvolution. Figure 3a–d depict the results of applying the located Euler deconvolution, ED-HGA, Tilt-depth, and the proposed method, respectively. One can see that the located Euler deconvolution and ED-HGA generate smaller values for the depths of both sources, while the Tilt-depth technique produces false solutions between the sources and larger depth values compared to the real values (Figure 3c). In this case, the location and depth of the bodies mapped by the proposed technique are consistent with the real values. According to these results, we can say that the ED-EHGA (Figure 3d) provides much better performance in locating magnetic sources compared with other methods.
Parameters of the synthetic model
| Parameters | A | B |
|---|---|---|
| x-coordinates of center (km) | 65 | 135 |
| y-coordinates of center (km) | 120 | 80 |
| Width (km) | 40 | 40 |
| Length (km) | 40 | 40 |
| Depth (km) | 3 | 5 |
| Declination (°) | 0 | 0 |
| Inclination (°) | 90 | 90 |
| Magnetization (A/m) | 0.4 | −0.2 |

3D view (a) and plan view (b) of the synthetic model.

Magnetic anomaly calculated from the theoretical model from Figure 1a (a) and transformed anomaly maps obtained using the enhancement filters HGA (b), AS (c), and EHGA (d).
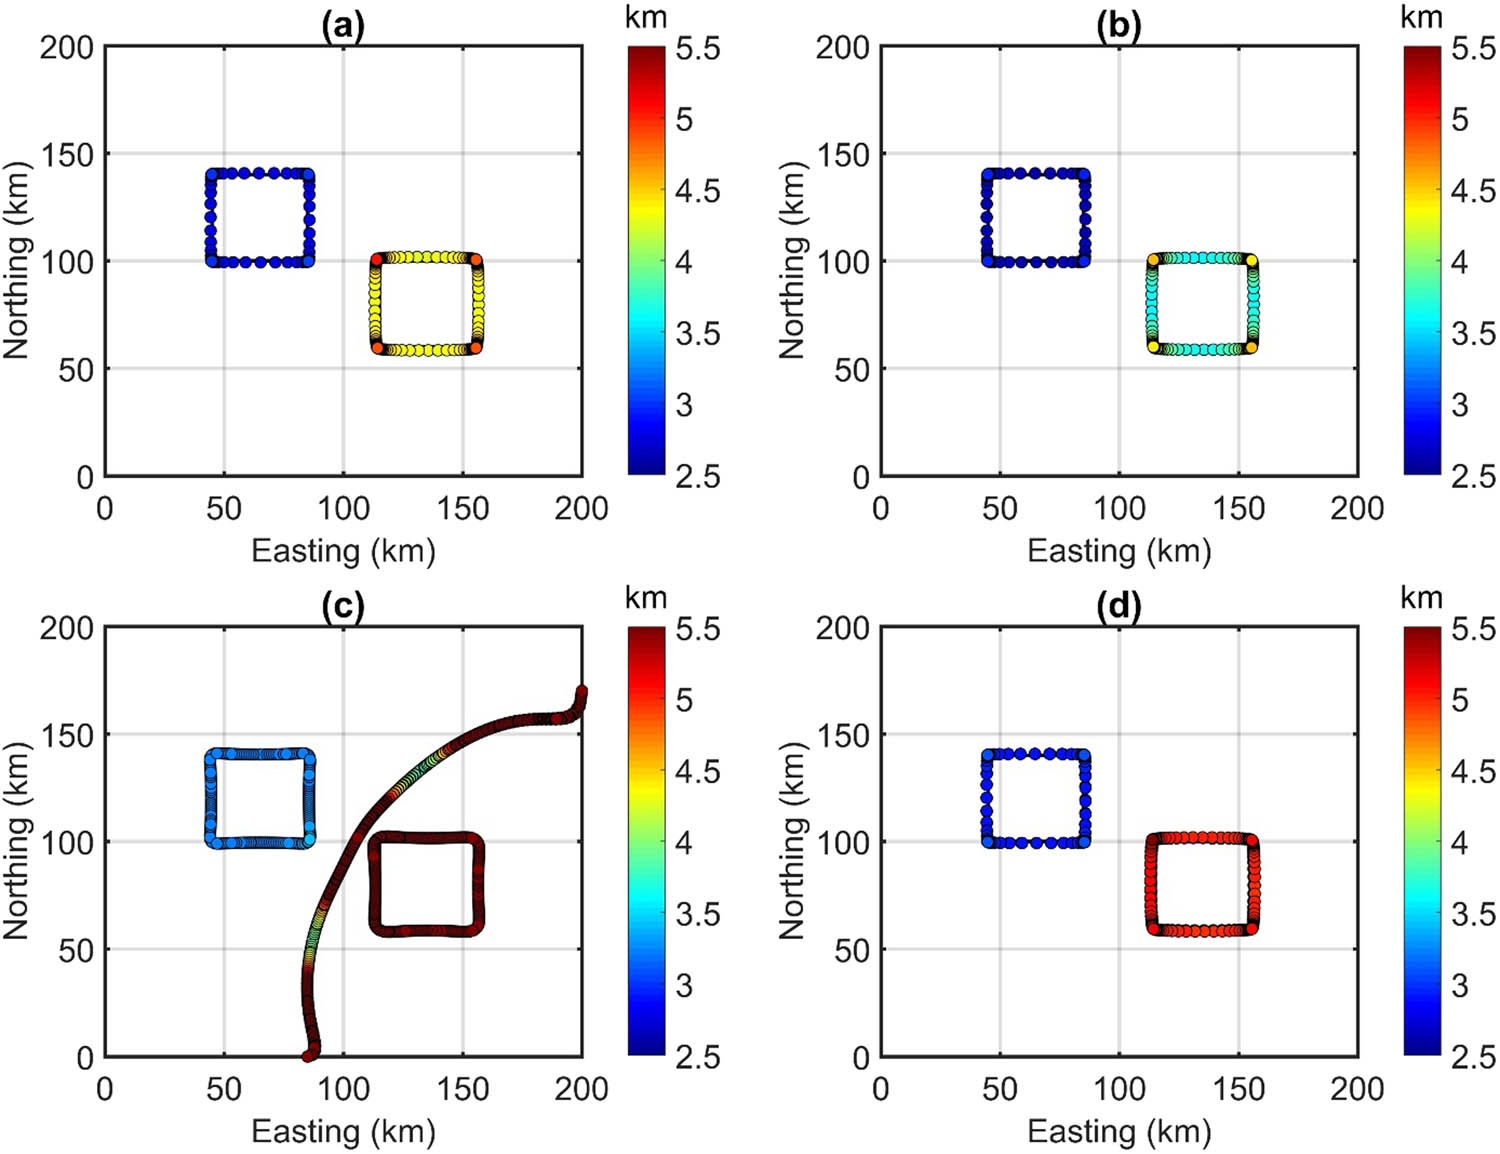
Depth estimates obtained for the data in Figure 2a using the ED-HGA (a), located Euler deconvolution (b), tilt-depth (c), and ED-EHGA (d).
To verify the stability of the suggested approach, magnetic data in Figure 2a were contaminated with Gaussian noise with a standard deviation of 1 nT. This amount corresponds to about 0.5% of the maximum absolute amplitude of the data, similar to Melo and Barbosa [16]. Figure 4a displays the noise-corrupted magnetic data. Figure 4b–d shows the results of using the HGA, AS, and EHGA to noise-corrupted magnetic data, respectively. Even though EHGA is more affected by noise than the HGA and AS, it is still able to delineate the border of both prisms. Figure 5a–d shows the depths obtained from the application of the located Euler deconvolution, Tilt-depth, and proposed technique, respectively. For the chosen noise level, there are too many less significant maxima in the HGA and AS maps that are related to noise, leading to many spurious windows for the located Euler deconvolution. For this reason, the ED-HGA and the located Euler deconvolution bring many false solutions (Figure 5a and b). Since the Tilt-depth technique is based on the Tilt angle filter that produces balanced signals for both magnetic data and noise, it is also sensitive to noise (Figure 5c). In this case, the estimates shown in Figure 5d indicate that the presented technique is less noise sensitive than others. The obtained depths from the presented technique are close to the real depths. Clearly, the use of the vertical derivative from the β-VDR and the window locations from the EHGA peaks for the Euler deconvolution allows us to reduce the noise and to determine magnetic sources more accurately. The spurious solutions from the other three methods could be eliminated using auxiliary selection criteria, while the ED-EHGA method does not need these additional resources.

Magnetic anomaly from Figure 2a contaminated with Gaussian noise with a standard deviation of 1 nT (a) and transformed anomaly maps obtained using the enhancement filters HGA (b), AS (c), and EHGA (d).

Depth estimates obtained for the data in Figure 4a using the ED-HGA (a), located Euler deconvolution (b), tilt-depth (c), and ED-EHGA. (d)
3.2 Real example
We applied the suggested technique to aeromagnetic dataset of the Olympic Peninsula (USA) (Figure 6a). The study region is situated in the forearc of the Cascadia subduction zone involving the northeastward subduction of the Juan de Fuca plate beneath North [46]. Figure 6b presents the geology of the Olympic Peninsula. The region is an east-plunging anticlinorium and is dominated by two major geologic terranes: a non-magnetic tertiary sedimentary core and a peripheral terrane of early Eocene basalts and marine sedimentary rocks wrapping around the eastern portion of the mountains [47]. The peripheral belt is primarily composed of Crescent Formation basalts of early to middle Eocene age and associated volcanic rocks and sediments [48]. The Crescent Formation includes a lower member of massive submarine basalts and an upper member consisting of subaerial basalts with sparse interbeds of sediments [49].

(a) Location map and (b) Geological map (UTM coordinates, zone 10N) of the study area.
Aeromagnetic data (Figure 7) of the study region were measured in 1997 by the United States Geological Survey with flight lines of 0.4 km spacing [50]. The nominal flight altitude was 0.3 km over flat to moderate terrain, but much higher over mountainous territory [50]. The data were reduced to pole using I and D of 69.399° and 18.975°, respectively. The RTP aeromagnetic data are displayed in Figure 8a. Figure 8c–d shows the HGA, AS, and EHGA of RTP aeromagnetic data, respectively. The high amplitude responses from the large anomalies caused by the basalts of the Eocene Crescent Formation dominate the HGA and AS, while the EHGA can determine all edges of the magnetized structures with different anomalies.

Aeromagnetic anomaly map of the study area.

RTP data (a) and transformed anomaly maps obtained using the enhancement filters HGA (b), AS (c), and EHGA (d).
Figure 9a shows the result of the ED-HGA. The ED-HGA uses the windows determined from the locations of the HGA peaks. Since the Blakely and Simpson technique is usually not able to map all peaks of the HGA [40], the structures determined by the ED-HGA are discontinuous. Figure 9b shows the result of the located Euler deconvolution. This method uses the windows determined from the AS peak locations. The AS map (Figure 8c) of RTP aeromagnetic data does not always provide peaks over the magnetization contrasts. In fact, the AS often has a single bell-shaped anomaly over the center of the magnetized structures, as is the case with the field over the Eocene Crescent Formation. For this reason, the structures determined by the located Euler deconvolution are discontinuous. Figure 9c presents the result of the Tilt-depth. We can see that the technique is useful in mapping a wide range of magnetized structures in the study region. However, several nearby structures found using this technique are linked, leading to spurious small circular-shaped bodies. Additionally, as demonstrated by the second synthetic model, the Tilt-depth technique yields some incorrect results, making geologic interpretation more complex. The reason for producing false solutions is that the Tilt-depth is based on the tilt derivative filter that generates spurious structures in the output map [51,52]. Figure 9d shows the result of the proposed technique. The technique uses the windows determined from the peak locations in the EHGA map (Figure 8d). Since the EHGA can provide the edge locations more accurately than the traditional methods, it is helpful to select the appropriate area to be scanned. Figure 9d shows that the majority of the magnetic sources found using the suggested method had depths of less than 3 km, which is similar to the depths estimated by the ED-HGA (Figure 9a), located Euler deconvolution (Figure 9b), and Tilt-depth method (Figure 9c). However, the solutions of the proposed technique show more continuous linear features and is less susceptible to noise than the located Euler deconvolution. The proposed method can also avoid bringing the spurious sources that appear in the output map of the Tilt-depth method. Using the proposed technique, the boundaries of the Eocene Crescent Formation were also detected. The solutions of the proposed technique also show that most of the contacts along the Eocene Crescent Formation are very shallow. This is consistent with the geological data demonstrating the surface exposure of this Formation. In addition, the results of the proposed technique also show a linear structure at the northwest corner, while the Tilt-depth method does not provide any solutions for this region, and those from the located Euler deconvolution are less continuous. Moreover, the estimates of the proposed method demonstrate the existence of structures with high susceptibilities in the eastern part, which generate the anomaly with a fairly circular shape. These structures are not observed on the surface, and cannot be determined by the Tilt-depth method, but they can be determined by applying some enhancement filters to magnetic data, as reported by some other studies [27,33,48]. We also note that the estimates obtained from the proposed technique ED-EHGA have revealed the presence of additional magnetized sources located at depths from 1 to 3.5 km, which are obscured by the sediments in the western edge, and just yield only subtle magnetic signals. Again, the use of the Euler deconvolution with the vertical derivative from the β-VDR and the window locations from the EHGA peaks allows for more accurate identification of source locations.

Depth estimates obtained for the data in Figure 8a using the ED-HGA (a), located Euler deconvolution (b), tilt-depth (c), and ED-EHGA (d).
4 Conclusion
We verified that the Euler deconvolution can provide sharper results if the vertical derivatives are computed from the stable β-VDR method and the window locations are determined from the peaks of the EHGA filter, especially for locating geological features from magnetic anomalies. The findings of the application of the presented method on model studies indicate that it can successfully estimate the locations and depths of magnetization structures. We compared our method with the Euler deconvolution constrained by HGA peaks, the located Euler deconvolution, and the Tilt-depth technique, showing that the proposed method can identify source locations more clearly and with higher accuracy. Moreover, the method is less sensitive to noise and avoids introducing any artifacts into the output map. We applied the technique to RTP magnetic dataset from the Olympic Peninsula, USA. The findings show that the Euler deconvolution based on the β-VDR and EHGA methods is not only able to provide source locations more clearly and with higher accuracy, but also reveals the presence of some additional magnetized sources which are obscured by sediments.
Acknowledgements
Deep thanks and gratitude to the Researchers Supporting Project number (RSP2024R351), King Saud University, Riyadh, Saudi Arabia, for funding this research article. S. P. Oliveira is grateful to CNPq, Brazil (316376/2021-3).
-
Author contributions: L.T.P. and S.P.O. contributed to the conceptualization and preparation of the manuscript. K.A. contributed to the preparation of the manuscript. D.G.O. contributed to the manuscript preparation and revision process. D.V.N., Q.T.V., and A.M.E. carried out the data selection and discussion. The authors applied the SDC approach for the sequence of authors.
-
Conflict of interest: The authors declare no conflict of interest.
-
Data availability statement: The datasets are available from the corresponding author on reasonable request.
References
[1] Castro FR, Oliveira SP, de Souza J, Ferreira FJF. Constraining Euler deconvolution solutions through combined tilt derivative filters. Pure Appl Geophys. 2020;177(10):4883–95.10.1007/s00024-020-02533-wSuche in Google Scholar
[2] Aprina PU, Santoso D, Alawiyah S, Prasetyo N, Ibrahim K. Delineating geological structure utilizing integration of remote sensing and gravity data: a study from Halmahera, North Molucca, Indonesia. Vietnam J Earth Sci. 2024;46(2):147–68. 10.15625/2615-9783/20010.Suche in Google Scholar
[3] Ekinci YL, Balkaya Ç, Şeren A, Kaya MA, Lightfoot CS. Geomagnetic and geoelectrical prospection for buried archaeological remains on the Upper City of Amorium, a Byzantine city in midwestern Turkey. J Geophys Eng. 2014;11(1):015012.10.1088/1742-2132/11/1/015012Suche in Google Scholar
[4] Thompson DT. EULDPH: A new technique for making computer-assisted depth estimates from magnetic data. Geophysics. 1982;47(1):31–7.10.1190/1.1441278Suche in Google Scholar
[5] Reid AB, Allsop JM, Granser H, Millett AJ, Somerton IW. Magnetic interpretation in three dimensions using Euler deconvolution. Geophysics. 1990;55(1):80–91.10.1190/1.1442774Suche in Google Scholar
[6] Saibi H, Azizi M, Mogren S. Structural investigations of Afghanistan deduced from remote sensing and potential field data. Acta Geophys. 2016;64(4):978–1003.10.1515/acgeo-2016-0046Suche in Google Scholar
[7] Fofie KAD, Koumetio F, Kenfack JV, Yemele D. Lineament characteristics using gravity data in the Garoua Zone, North Cameroon: Natural risks implications. Earth Planet Phys. 2019;3(1):33–44.10.26464/epp2019009Suche in Google Scholar
[8] Ouchchen M, Boutaleb S, Abia EH, El Azzab D, Abioui M, et al. Structural interpretation of the Igherm region (Western Anti Atlas, Morocco) from an aeromagnetic analysis: Implications for copper exploration. J Afr Earth Sci. 2021;176:104140.10.1016/j.jafrearsci.2021.104140Suche in Google Scholar
[9] Ekwok SE, Achadu OIM, Akpan AE, Eldosouky AM, Ufuafuonye CH, Abdelrahman K, et al. Depth estimation of sedimentary sections and basement rocks in the Bornu Basin, Northeast Nigeria using high-resolution airborne magnetic data. Minerals. 2022;12:285.10.3390/min12030285Suche in Google Scholar
[10] Hispagnol NR, Fries M, Lourenço J, Papa ARR. Aeromagnetometric data application to investigate the magnetic basement – Caçapava do Sul, RS. J South Am Earth Sci. 2023;124:104274.10.1016/j.jsames.2023.104274Suche in Google Scholar
[11] Catalán M, Martín Davila J. A magnetic anomaly study offshore the Canary Archipelago. Mar Geophys Res. 2003;24(1):129–48.10.1007/s11001-004-5442-ySuche in Google Scholar
[12] Essa KS, Diab ZE. Magnetic data interpretation for 2D dikes by the metaheuristic bat algorithm: sustainable development cases. Sci Rep. 2022;12:14206.10.1038/s41598-022-18334-1Suche in Google Scholar PubMed PubMed Central
[13] Florio G, Fedi M, Pašteka R. On the application of Euler deconvolution to the analytic signal. Geophysics. 2006;71(6):L87–93.10.1190/1.2360204Suche in Google Scholar
[14] Huang L, Zhang H, Li CF, Feng J. Ratio‐Euler deconvolution and its applications. Geophys Prospect. 2022;70(6):1016–32.10.1111/1365-2478.13201Suche in Google Scholar
[15] Barbosa VCF, Silva JBC, Medeiros WE. Stability analysis and improvement of structural index estimation in Euler deconvolution. Geophysics. 1999;64(1):48–60.10.1190/1.1444529Suche in Google Scholar
[16] Melo FF, Barbosa VCF. Reliable Euler deconvolution estimates throughout the vertical derivatives of the total-field anomaly. Comput Geosci. 2020;138:104436.10.1016/j.cageo.2020.104436Suche in Google Scholar
[17] Beiki M. Analytic signals of gravity gradient tensor and their application to estimate source location. Geophysics. 2010;75(6):I59–74.10.1190/1.3493639Suche in Google Scholar
[18] Ruppel A, Jacobs J, Eagles G, Läufer A, Jokat W. New geophysical data from a key region in East Antarctica: Estimates for the spatial extent of the Tonian Oceanic Arc Super Terrane (TOAST). Gondwana Res. 2018;59:97–107.10.1016/j.gr.2018.02.019Suche in Google Scholar
[19] Nasuti Y, Nasuti A. NTilt as an improved enhanced tilt derivative filter for edge detection of potential field anomalies. Geophys J Int. 2018;214(1):36–45.10.1093/gji/ggy117Suche in Google Scholar
[20] Ghiasi SM, Hosseini SH, Afshar A, Abedi M. A novel magnetic interpretational perspective on Charmaleh iron deposit through improved edge detection techniques and 3D inversion approaches. Nat Resour Res. 2023;32:147–70.10.1007/s11053-022-10135-7Suche in Google Scholar
[21] Jorge VT, Oliveira SP, Pham LT, Duong VH. A balanced edge detector for aeromagnetic data. Vietnam J Earth Sci. 2023;45(3):326–37.10.3997/2214-4609.202310176Suche in Google Scholar
[22] Nasuti Y, Nasuti A, Moghadas D. STDR: A novel approach for enhancing and edge detection of potential field data. Pure Appl Geophys. 2019;176(2):827–41.10.1007/s00024-018-2016-5Suche in Google Scholar
[23] Hamimi Z, Eldosouky AM, Hagag W, Kamh SZ. Large-scale geological structures of the Egyptian Nubian Shield. Sci Rep. 2023;13:1923.10.1038/s41598-023-29008-xSuche in Google Scholar PubMed PubMed Central
[24] Alvandi A, Su K, Ai H, Ardestani VE, Lyu C. Enhancement of potential field source boundaries using the hyperbolic domain (Gudermannian Function). Minerals. 2023;13:1312.10.3390/min13101312Suche in Google Scholar
[25] Pham LT, Eldosouky AM, Oksum E, Saada SA. A new high resolution filter for source edge detection of potential field data. Geocarto Int. 2022;37(11):3051–68.10.1080/10106049.2020.1849414Suche in Google Scholar
[26] Pham LT, Prasad KND. Analysis of gravity data for extracting structural features of the northern region of the Central Indian Ridge. Vietnam J Earth Sci. 2023;45(2):147–63.Suche in Google Scholar
[27] Prasad KND, Pham LT, Singh AP, Eldosouky AM, Abdelrahman K, Fnais MS, et al. A novel enhanced total gradient (ETG) for interpretation of magnetic data. Minerals. 2022;12:1468.10.3390/min12111468Suche in Google Scholar
[28] Prasad KND, Pham LT, Singh AP. A novel filter “ImpTAHG” for edge detection and a case study from Cambay Rift Basin, India. Pure Appl Geophys. 2022;179(6–7):2351–64.10.1007/s00024-022-03059-zSuche in Google Scholar
[29] Ekwok SE, Eldosouky AM, Achadu OIM, Akpan AE, Pham LT, Abdelrahman K, et al. Application of the enhanced horizontal gradient amplitude (EHGA) filter in mapping of geological structures involving magnetic data in southeast Nigeria. J King Saud Univ Sci. 2022;34:102288.10.1016/j.jksus.2022.102288Suche in Google Scholar
[30] Pham LT, Ghomsi FFK, Vu TV, Oksum E, Steffen R, Tenzer R. Mapping the structural configuration of the western Gulf of Guinea using advanced gravity interpretation methods. Phys Chem Earth. 2023;129:103341.10.1016/j.pce.2022.103341Suche in Google Scholar
[31] Kharbish S, Eldosouky AM, Amer O. Integrating mineralogy, geochemistry and aeromagnetic data for detecting Fe–Ti ore deposits bearing layered mafic intrusion, Akab El-Negum, Eastern Desert, Egypt. Sci Rep. 2022;12:15474.10.1038/s41598-022-19760-xSuche in Google Scholar PubMed PubMed Central
[32] Pham LT, Oksum E, Kafadar O, Trinh PT, Nguyen DV, Vo QT, et al. Determination of subsurface lineaments in the Hoang Sa islands using enhanced methods of gravity total horizontal gradient. Vietnam J Earth Sci. 2022;44(3):395–409.Suche in Google Scholar
[33] Oliveira SP, Pham LT. A stable finite difference method based on upward continuation to evaluate vertical derivatives of potential field data. Pure Appl Geophys. 2022;179(12):4555–66.10.1007/s00024-022-03164-zSuche in Google Scholar
[34] Pašteka R, Kušnirák D. Role of Euler deconvolution in near surface gravity and magnetic applications. In: Biswas A, Sharma SP, editors. Advances in modeling and interpretation in near surface geophysics. Cham: Springer; 2020. p. 223–62.10.1007/978-3-030-28909-6_9Suche in Google Scholar
[35] Blakely RJ. Potential theory in gravity and magnetic applications. Cambridge: Cambridge University Press; 1996.10.1017/CBO9780511549816Suche in Google Scholar
[36] Tran KV, Nguyen TN. A novel method for computing the vertical gradients of the potential field: application to downward continuation. Geophys J Int. 2020;220(2):1316–29.10.1093/gji/ggz524Suche in Google Scholar
[37] Roest WR, Verhoef J, Pilkington M. Magnetic interpretation using the 3-D analytic signal. Geophysics. 1992;57(1):116–25.10.1190/1.1443174Suche in Google Scholar
[38] Ekinci YL. On the drape and level flying aeromagnetic survey modes with terrain effects, and data reduction between arbitrary surfaces. Turkish J Earth Sci. 2021;30(3):409–24.10.3906/yer-2007-18Suche in Google Scholar
[39] Kha VT, Vuong VH, Thanh DD, Hung QD, Anh DL. Improving a maximum horizontal gradient algorithm to determine geological body boundaries and fault systems based on gravity data. J Appl Geophys. 2018;152:161–6.10.1016/j.jappgeo.2018.03.023Suche in Google Scholar
[40] Pham LT, Kafadar O, Oksum E, Hoang-Minh T. A comparative study on the peak detection methods used to interpret potential field data: a case study from Vietnam. Geocarto Int. 2022;37(13):3679–96.10.1080/10106049.2021.2007297Suche in Google Scholar
[41] Fedi M, Florio G. Detection of potential fields source boundaries by enhanced horizontal derivative method. Geophys Prospect. 2001;49(1):40–58.10.1046/j.1365-2478.2001.00235.xSuche in Google Scholar
[42] Ferreira FJF, de Souza J, de Bongiolo ABS, de Castro LG. Enhancement of the total horizontal gradient of magnetic anomalies using the tilt angle. Geophysics. 2013;78(3):J33–41.10.1190/geo2011-0441.1Suche in Google Scholar
[43] Blakely R, Simpson R. Approximating edges of source bodies from magnetic or gravity anomalies. Geophysics. 1986;51(7):1494–8.10.1190/1.1442197Suche in Google Scholar
[44] Salem A, Williams S, Fairhead J, Ravat D, Smith R. Tilt-depth method: a simple depth estimation method using first-order magnetic derivatives. Lead Edge. 2007;26:1502–5.10.1190/1.2821934Suche in Google Scholar
[45] Huang L, Zhang H, Sekelani S, Wu Z. An improved Tilt-Euler deconvolution and its application on a Fe-polymetallic deposit. Ore Geol Rev. 2019;114:103114.10.1016/j.oregeorev.2019.103114Suche in Google Scholar
[46] Bodmer M, Toomey DR, Hooft EEE, Schmandt B. Buoyant asthenosphere beneath Cascadia influences megathrust segmentation. Geophys Res Lett. 2018;45:6954–62.10.1029/2018GL078700Suche in Google Scholar
[47] Mace CG, Keranen KM. Oblique fault systems crossing the Seattle Basin: Geophysical evidence for additional shallow fault systems in the central Puget Lowland. J Geophys Res: Solid Earth. 2012;117:B3.10.1029/2011JB008722Suche in Google Scholar
[48] Blakely RJ, Sherrod BL, Hughes JF, Anderson ML, Wells RE, Weaver CS. Saddle Mountain fault deformation zone, Olympic Peninsula, Washington: Western boundary of the Seattle uplift. Geosphere. 2009;5:105–25.10.1130/GES00196.1Suche in Google Scholar
[49] Lamb AP, Liberty LM, Blakely RJ, Pratt TL, Sherrod BL, van Wijk K. Western limits of the Seattle fault zone and its interaction with the Olympic Peninsula. Wash Geosph. 2012;8(4):915–30.10.1130/GES00780.1Suche in Google Scholar
[50] Blakely RJ, Wells RE, Weaver CS. Puget Sound aeromagnetic maps and data, U.S. Geological Survey Open-File Report 99–514; 1999. https://pubs.usgs.gov/of/1999/of99-514.10.3133/ofr99514Suche in Google Scholar
[51] Eldosouky AM, Pham LT, Duong VH, Ghomsi FEK, Henaish A. Structural interpretation of potential field data using the enhancement techniques: a case study. Geocarto Int. 2022;37(27):16900–25.10.1080/10106049.2022.2120548Suche in Google Scholar
[52] Eldosouky AM, Pham LT, Henaish A. High precision structural mapping using edge filters of potential field and remote sensing data: A case study from Wadi Umm Ghalqa area, South Eastern Desert, Egypt. Egypt J Remote Sens Space Sci. 2022;25(2):501–13.10.1016/j.ejrs.2022.03.001Suche in Google Scholar
© 2024 the author(s), published by De Gruyter
This work is licensed under the Creative Commons Attribution 4.0 International License.
Artikel in diesem Heft
- Regular Articles
- Theoretical magnetotelluric response of stratiform earth consisting of alternative homogeneous and transitional layers
- The research of common drought indexes for the application to the drought monitoring in the region of Jin Sha river
- Evolutionary game analysis of government, businesses, and consumers in high-standard farmland low-carbon construction
- On the use of low-frequency passive seismic as a direct hydrocarbon indicator: A case study at Banyubang oil field, Indonesia
- Water transportation planning in connection with extreme weather conditions; case study – Port of Novi Sad, Serbia
- Zircon U–Pb ages of the Paleozoic volcaniclastic strata in the Junggar Basin, NW China
- Monitoring of mangrove forests vegetation based on optical versus microwave data: A case study western coast of Saudi Arabia
- Microfacies analysis of marine shale: A case study of the shales of the Wufeng–Longmaxi formation in the western Chongqing, Sichuan Basin, China
- Multisource remote sensing image fusion processing in plateau seismic region feature information extraction and application analysis – An example of the Menyuan Ms6.9 earthquake on January 8, 2022
- Identification of magnetic mineralogy and paleo-flow direction of the Miocene-quaternary volcanic products in the north of Lake Van, Eastern Turkey
- Impact of fully rotating steel casing bored pile on adjacent tunnels
- Adolescents’ consumption intentions toward leisure tourism in high-risk leisure environments in riverine areas
- Petrogenesis of Jurassic granitic rocks in South China Block: Implications for events related to subduction of Paleo-Pacific plate
- Differences in urban daytime and night block vitality based on mobile phone signaling data: A case study of Kunming’s urban district
- Random forest and artificial neural network-based tsunami forests classification using data fusion of Sentinel-2 and Airbus Vision-1 satellites: A case study of Garhi Chandan, Pakistan
- Integrated geophysical approach for detection and size-geometry characterization of a multiscale karst system in carbonate units, semiarid Brazil
- Spatial and temporal changes in ecosystem services value and analysis of driving factors in the Yangtze River Delta Region
- Deep fault sliding rates for Ka-Ping block of Xinjiang based on repeating earthquakes
- Improved deep learning segmentation of outdoor point clouds with different sampling strategies and using intensities
- Platform margin belt structure and sedimentation characteristics of Changxing Formation reefs on both sides of the Kaijiang-Liangping trough, eastern Sichuan Basin, China
- Enhancing attapulgite and cement-modified loess for effective landfill lining: A study on seepage prevention and Cu/Pb ion adsorption
- Flood risk assessment, a case study in an arid environment of Southeast Morocco
- Lower limits of physical properties and classification evaluation criteria of the tight reservoir in the Ahe Formation in the Dibei Area of the Kuqa depression
- Evaluation of Viaducts’ contribution to road network accessibility in the Yunnan–Guizhou area based on the node deletion method
- Permian tectonic switch of the southern Central Asian Orogenic Belt: Constraints from magmatism in the southern Alxa region, NW China
- Element geochemical differences in lower Cambrian black shales with hydrothermal sedimentation in the Yangtze block, South China
- Three-dimensional finite-memory quasi-Newton inversion of the magnetotelluric based on unstructured grids
- Obliquity-paced summer monsoon from the Shilou red clay section on the eastern Chinese Loess Plateau
- Classification and logging identification of reservoir space near the upper Ordovician pinch-out line in Tahe Oilfield
- Ultra-deep channel sand body target recognition method based on improved deep learning under UAV cluster
- New formula to determine flyrock distance on sedimentary rocks with low strength
- Assessing the ecological security of tourism in Northeast China
- Effective reservoir identification and sweet spot prediction in Chang 8 Member tight oil reservoirs in Huanjiang area, Ordos Basin
- Detecting heterogeneity of spatial accessibility to sports facilities for adolescents at fine scale: A case study in Changsha, China
- Effects of freeze–thaw cycles on soil nutrients by soft rock and sand remodeling
- Vibration prediction with a method based on the absorption property of blast-induced seismic waves: A case study
- A new look at the geodynamic development of the Ediacaran–early Cambrian forearc basalts of the Tannuola-Khamsara Island Arc (Central Asia, Russia): Conclusions from geological, geochemical, and Nd-isotope data
- Spatio-temporal analysis of the driving factors of urban land use expansion in China: A study of the Yangtze River Delta region
- Selection of Euler deconvolution solutions using the enhanced horizontal gradient and stable vertical differentiation
- Phase change of the Ordovician hydrocarbon in the Tarim Basin: A case study from the Halahatang–Shunbei area
- Using interpretative structure model and analytical network process for optimum site selection of airport locations in Delta Egypt
- Geochemistry of magnetite from Fe-skarn deposits along the central Loei Fold Belt, Thailand
- Functional typology of settlements in the Srem region, Serbia
- Hunger Games Search for the elucidation of gravity anomalies with application to geothermal energy investigations and volcanic activity studies
- Addressing incomplete tile phenomena in image tiling: Introducing the grid six-intersection model
- Evaluation and control model for resilience of water resource building system based on fuzzy comprehensive evaluation method and its application
- MIF and AHP methods for delineation of groundwater potential zones using remote sensing and GIS techniques in Tirunelveli, Tenkasi District, India
- New database for the estimation of dynamic coefficient of friction of snow
- Measuring urban growth dynamics: A study in Hue city, Vietnam
- Comparative models of support-vector machine, multilayer perceptron, and decision tree predication approaches for landslide susceptibility analysis
- Experimental study on the influence of clay content on the shear strength of silty soil and mechanism analysis
- Geosite assessment as a contribution to the sustainable development of Babušnica, Serbia
- Using fuzzy analytical hierarchy process for road transportation services management based on remote sensing and GIS technology
- Accumulation mechanism of multi-type unconventional oil and gas reservoirs in Northern China: Taking Hari Sag of the Yin’e Basin as an example
- TOC prediction of source rocks based on the convolutional neural network and logging curves – A case study of Pinghu Formation in Xihu Sag
- A method for fast detection of wind farms from remote sensing images using deep learning and geospatial analysis
- Spatial distribution and driving factors of karst rocky desertification in Southwest China based on GIS and geodetector
- Physicochemical and mineralogical composition studies of clays from Share and Tshonga areas, Northern Bida Basin, Nigeria: Implications for Geophagia
- Geochemical sedimentary records of eutrophication and environmental change in Chaohu Lake, East China
- Research progress of freeze–thaw rock using bibliometric analysis
- Mixed irrigation affects the composition and diversity of the soil bacterial community
- Examining the swelling potential of cohesive soils with high plasticity according to their index properties using GIS
- Geological genesis and identification of high-porosity and low-permeability sandstones in the Cretaceous Bashkirchik Formation, northern Tarim Basin
- Usability of PPGIS tools exemplified by geodiscussion – a tool for public participation in shaping public space
- Efficient development technology of Upper Paleozoic Lower Shihezi tight sandstone gas reservoir in northeastern Ordos Basin
- Assessment of soil resources of agricultural landscapes in Turkestan region of the Republic of Kazakhstan based on agrochemical indexes
- Evaluating the impact of DEM interpolation algorithms on relief index for soil resource management
- Petrogenetic relationship between plutonic and subvolcanic rocks in the Jurassic Shuikoushan complex, South China
- A novel workflow for shale lithology identification – A case study in the Gulong Depression, Songliao Basin, China
- Characteristics and main controlling factors of dolomite reservoirs in Fei-3 Member of Feixianguan Formation of Lower Triassic, Puguang area
- Impact of high-speed railway network on county-level accessibility and economic linkage in Jiangxi Province, China: A spatio-temporal data analysis
- Estimation model of wild fractional vegetation cover based on RGB vegetation index and its application
- Lithofacies, petrography, and geochemistry of the Lamphun oceanic plate stratigraphy: As a record of the subduction history of Paleo-Tethys in Chiang Mai-Chiang Rai Suture Zone of Thailand
- Structural features and tectonic activity of the Weihe Fault, central China
- Application of the wavelet transform and Hilbert–Huang transform in stratigraphic sequence division of Jurassic Shaximiao Formation in Southwest Sichuan Basin
- Structural detachment influences the shale gas preservation in the Wufeng-Longmaxi Formation, Northern Guizhou Province
- Distribution law of Chang 7 Member tight oil in the western Ordos Basin based on geological, logging and numerical simulation techniques
- Evaluation of alteration in the geothermal province west of Cappadocia, Türkiye: Mineralogical, petrographical, geochemical, and remote sensing data
- Numerical modeling of site response at large strains with simplified nonlinear models: Application to Lotung seismic array
- Quantitative characterization of granite failure intensity under dynamic disturbance from energy standpoint
- Characteristics of debris flow dynamics and prediction of the hazardous area in Bangou Village, Yanqing District, Beijing, China
- Rockfall mapping and susceptibility evaluation based on UAV high-resolution imagery and support vector machine method
- Statistical comparison analysis of different real-time kinematic methods for the development of photogrammetric products: CORS-RTK, CORS-RTK + PPK, RTK-DRTK2, and RTK + DRTK2 + GCP
- Hydrogeological mapping of fracture networks using earth observation data to improve rainfall–runoff modeling in arid mountains, Saudi Arabia
- Petrography and geochemistry of pegmatite and leucogranite of Ntega-Marangara area, Burundi, in relation to rare metal mineralisation
- Prediction of formation fracture pressure based on reinforcement learning and XGBoost
- Hazard zonation for potential earthquake-induced landslide in the eastern East Kunlun fault zone
- Monitoring water infiltration in multiple layers of sandstone coal mining model with cracks using ERT
- Study of the patterns of ice lake variation and the factors influencing these changes in the western Nyingchi area
- Productive conservation at the landslide prone area under the threat of rapid land cover changes
- Sedimentary processes and patterns in deposits corresponding to freshwater lake-facies of hyperpycnal flow – An experimental study based on flume depositional simulations
- Study on time-dependent injectability evaluation of mudstone considering the self-healing effect
- Detection of objects with diverse geometric shapes in GPR images using deep-learning methods
- Behavior of trace metals in sedimentary cores from marine and lacustrine environments in Algeria
- Spatiotemporal variation pattern and spatial coupling relationship between NDVI and LST in Mu Us Sandy Land
- Formation mechanism and oil-bearing properties of gravity flow sand body of Chang 63 sub-member of Yanchang Formation in Huaqing area, Ordos Basin
- Diagenesis of marine-continental transitional shale from the Upper Permian Longtan Formation in southern Sichuan Basin, China
- Vertical high-velocity structures and seismic activity in western Shandong Rise, China: Case study inspired by double-difference seismic tomography
- Spatial coupling relationship between metamorphic core complex and gold deposits: Constraints from geophysical electromagnetics
- Disparities in the geospatial allocation of public facilities from the perspective of living circles
- Research on spatial correlation structure of war heritage based on field theory. A case study of Jinzhai County, China
- Formation mechanisms of Qiaoba-Zhongdu Danxia landforms in southwestern Sichuan Province, China
- Magnetic data interpretation: Implication for structure and hydrocarbon potentiality at Delta Wadi Diit, Southeastern Egypt
- Deeply buried clastic rock diagenesis evolution mechanism of Dongdaohaizi sag in the center of Junggar fault basin, Northwest China
- Application of LS-RAPID to simulate the motion of two contrasting landslides triggered by earthquakes
- The new insight of tectonic setting in Sunda–Banda transition zone using tomography seismic. Case study: 7.1 M deep earthquake 29 August 2023
- The critical role of c and φ in ensuring stability: A study on rockfill dams
- Evidence of late quaternary activity of the Weining-Shuicheng Fault in Guizhou, China
- Extreme hydroclimatic events and response of vegetation in the eastern QTP since 10 ka
- Spatial–temporal effect of sea–land gradient on landscape pattern and ecological risk in the coastal zone: A case study of Dalian City
- Study on the influence mechanism of land use on carbon storage under multiple scenarios: A case study of Wenzhou
- A new method for identifying reservoir fluid properties based on well logging data: A case study from PL block of Bohai Bay Basin, North China
- Comparison between thermal models across the Middle Magdalena Valley, Eastern Cordillera, and Eastern Llanos basins in Colombia
- Mineralogical and elemental analysis of Kazakh coals from three mines: Preliminary insights from mode of occurrence to environmental impacts
- Chlorite-induced porosity evolution in multi-source tight sandstone reservoirs: A case study of the Shaximiao Formation in western Sichuan Basin
- Predicting stability factors for rotational failures in earth slopes and embankments using artificial intelligence techniques
- Origin of Late Cretaceous A-type granitoids in South China: Response to the rollback and retreat of the Paleo-Pacific plate
- Modification of dolomitization on reservoir spaces in reef–shoal complex: A case study of Permian Changxing Formation, Sichuan Basin, SW China
- Geological characteristics of the Daduhe gold belt, western Sichuan, China: Implications for exploration
- Rock physics model for deep coal-bed methane reservoir based on equivalent medium theory: A case study of Carboniferous-Permian in Eastern Ordos Basin
- Enhancing the total-field magnetic anomaly using the normalized source strength
- Shear wave velocity profiling of Riyadh City, Saudi Arabia, utilizing the multi-channel analysis of surface waves method
- Effect of coal facies on pore structure heterogeneity of coal measures: Quantitative characterization and comparative study
- Inversion method of organic matter content of different types of soils in black soil area based on hyperspectral indices
- Detection of seepage zones in artificial levees: A case study at the Körös River, Hungary
- Tight sandstone fluid detection technology based on multi-wave seismic data
- Characteristics and control techniques of soft rock tunnel lining cracks in high geo-stress environments: Case study of Wushaoling tunnel group
- Influence of pore structure characteristics on the Permian Shan-1 reservoir in Longdong, Southwest Ordos Basin, China
- Study on sedimentary model of Shanxi Formation – Lower Shihezi Formation in Da 17 well area of Daniudi gas field, Ordos Basin
- Multi-scenario territorial spatial simulation and dynamic changes: A case study of Jilin Province in China from 1985 to 2030
- Review Articles
- Major ascidian species with negative impacts on bivalve aquaculture: Current knowledge and future research aims
- Prediction and assessment of meteorological drought in southwest China using long short-term memory model
- Communication
- Essential questions in earth and geosciences according to large language models
- Erratum
- Erratum to “Random forest and artificial neural network-based tsunami forests classification using data fusion of Sentinel-2 and Airbus Vision-1 satellites: A case study of Garhi Chandan, Pakistan”
- Special Issue: Natural Resources and Environmental Risks: Towards a Sustainable Future - Part I
- Spatial-temporal and trend analysis of traffic accidents in AP Vojvodina (North Serbia)
- Exploring environmental awareness, knowledge, and safety: A comparative study among students in Montenegro and North Macedonia
- Determinants influencing tourists’ willingness to visit Türkiye – Impact of earthquake hazards on Serbian visitors’ preferences
- Application of remote sensing in monitoring land degradation: A case study of Stanari municipality (Bosnia and Herzegovina)
- Optimizing agricultural land use: A GIS-based assessment of suitability in the Sana River Basin, Bosnia and Herzegovina
- Assessing risk-prone areas in the Kratovska Reka catchment (North Macedonia) by integrating advanced geospatial analytics and flash flood potential index
- Analysis of the intensity of erosive processes and state of vegetation cover in the zone of influence of the Kolubara Mining Basin
- GIS-based spatial modeling of landslide susceptibility using BWM-LSI: A case study – city of Smederevo (Serbia)
- Geospatial modeling of wildfire susceptibility on a national scale in Montenegro: A comparative evaluation of F-AHP and FR methodologies
- Geosite assessment as the first step for the development of canyoning activities in North Montenegro
- Urban geoheritage and degradation risk assessment of the Sokograd fortress (Sokobanja, Eastern Serbia)
- Multi-hazard modeling of erosion and landslide susceptibility at the national scale in the example of North Macedonia
- Understanding seismic hazard resilience in Montenegro: A qualitative analysis of community preparedness and response capabilities
- Forest soil CO2 emission in Quercus robur level II monitoring site
- Characterization of glomalin proteins in soil: A potential indicator of erosion intensity
- Power of Terroir: Case study of Grašac at the Fruška Gora wine region (North Serbia)
- Special Issue: Geospatial and Environmental Dynamics - Part I
- Qualitative insights into cultural heritage protection in Serbia: Addressing legal and institutional gaps for disaster risk resilience