Study of the patterns of ice lake variation and the factors influencing these changes in the western Nyingchi area
-
Mingwei Yu
 ,
Feng Li
,
Feng Li

Abstract
The current ice lake dataset in the western region of Nyingchi requires further improvement. Due to the intricate distribution of ice lakes and imprecise boundary delineation, research tends to overlook small-scale ice lakes in this area. Moreover, most related studies have focused solely on variations in ice lake areas within key regions, such as the Himalayas, with little attention given to changes occurring in southeastern Tibet. The frequency of ice and snow disasters in the study area has been steadily increasing over the years. Therefore, this study utilizes Landsat satellite images and employs visual interpretation methods to generate more precise and comprehensive maps depicting the distribution of ice lakes in the western region of Nyingchi Province for the years 1994, 2010, 2018, and 2022. Additionally, changes in scale and spatial patterns of different types of ice lakes were investigated. Between 1994 and 2022, the ice lake area in the study area significantly increased by 22.5%, reaching a total of 35.8 ± 3.0 km2. This expansion was primarily driven by glacier-fed lakes, which experienced a remarkable growth rate of 30.8%. In contrast, the non-glacier-fed lakes experienced an increase by only 15.6%. Notably, ice lakes at higher elevations exhibited a peak in expansion, with those above 5143.0 m experiencing the most substantial growth rate of 44.8%. The long-term expansion rate of ice lakes is investigated through the measurement of changes in their boundaries, with the aim to understand the factors contributing to their growth. These findings indicate the rapid expansion of the ice lake near the glacier, with an annual growth rate of 1.3% per annum. Specifically, the glacial-fed section exhibited an expansion rate of 1.1% per annum, while the nonglacial-fed section experienced a growth rate of 0.6% per annum. The seasonal variability in marine glaciers is the primary factor influencing the expansion of ice lakes in this region, with temperature and precipitation serving as the principal driving forces impacting the transformation of these lakes. The data provided by the research results will facilitate a comprehensive understanding of the dynamics and mechanisms governing the ice lake in western Nyingchi, thereby contributing to an enhanced scientific comprehension of potential disaster risks associated with this ice lake.
1 Introduction
The Tibetan Plateau, commonly known as the “hydrological hub of Asia” or the “third pole,” represents a significant geographical area characterized by the extensive distribution of glaciers and ice lakes [1,2,3]. These aquatic bodies are formed through the process of ice meltwater, and their dynamic transformations are precise indicators of climate change and glacial movement [4,5]. The observed increase in global temperature in recent decades is evidenced by the widespread retreat of glaciers and the ongoing expansion of ice lakes worldwide [6]. The changes occurring in the high-altitude region of Asia and its branches have sparked significant research interest among scholars.
From 2007 to 2010, Mergili et al. [7] conducted a geographical study in high-mountain Asia (HMA) utilizing Landsat imagery to accurately delineate the boundaries of glacial lakes at the source of the Amu Darya River. A thorough analysis of the research revealed that 652 of the 1,642 lakes surveyed exhibited significant enlargement, indicating an escalating trend towards lake expansion in high-water catchments. The change pattern of the lake interior was interpreted by Zhang et al. [8] using remote sensing images. Although there was a slight decrease in the number and area of individual lakes observed between the 1970s and 1990s, a gradual but consistent increase was observed from the 1990s to the 2010s. The change in continuous ice volume in the Himalayas from 1974 to 2006 along the same path was examined by Maurer et al. [9]. The study concluded that alterations in these glaciers have a significant impact on the quantity and dimensions of glacial lakes. With the advent of the Google Earth Engine (GEE), a cloud computing platform, Chen et al. [10] conducted an analysis on the distribution of glacial lakes in Tibet using Landsat images, considering variables, such as size, category, and elevation. This approach demonstrates the practicality of GEE for large-scale mapping of glacial lakes and also reveals the significant impact of climate warming and glacial retreat on lake changes. The modified normalized differential water index (MNDWI) was combined with the nonlocal active contour modeller by Zhang et al. [11]. The authors utilized the Chinese panchromatic multispectral and GEE platforms for cloud computing to accurately map the spatial distribution of HMA lakes. The study conducted by Wang et al. [12] focused on the HMA region and employed visual interpretation of Google Earth images to delineate the glacial lake boundary within a 10 km buffer zone around the glacier. Additionally, they identified high-density lakes in the Altai, Sayan, and eastern Himalaya regions. The survey also documented the period of rapid expansion in the area covered by high-elevation glacial lakes between the 1990s and 2018. Zhang et al. [13] utilized Landsat satellite imagery and GEE cloud computing to demonstrate that lakes near glaciers underwent rapid expansion between 2008 and 2016, with the Himalayan lakes exhibiting the highest rate of expansion. This method was subsequently validated by Zhao et al. [14], who employed a generative adversarial network to accurately detect and segment complex small glacial lakes, achieving an impressive accuracy rate of 93.19%. The current situation of new geological disasters caused by changes in ice lakes cannot be ignored during the study of ice lake changes.
The formation of ice/rock waterfalls and snow and ice debris flows can be attributed to the robust response of ice lakes and glaciers to climate change or geological movements. Consequently, the continuous occurrence of snow and ice disasters poses a significant risk and hidden danger to downstream infrastructure and communities [15,16,17]. The monsoon temperate glaciers located in the southeastern region of the Tibetan Plateau exhibit a greater degree of sensitivity to climate change than continental glaciers found in other parts of the plateau [18,19]. Additionally, this phenomenon has resulted in a consistent escalation in the rate of ice formation and the occurrence of ice- and snow-related geological disasters within the southeastern Tibetan Plateau. This correlation is closely related to the pace at which glaciers are retreating, thus requiring continuous attention from numerous researchers [20,21,22]. However, the western region, which is situated in southeastern Tibet, harbours several potentially hazardous ice lakes that have not received adequate attention from researchers [23,24,25].
The primary focus of this study is to examine the alterations in ice lakes located within the western region of Nyingchi. The complex terrain in the western region of Nyingchi has led to insufficient attention being given to many of the small ice lakes, necessitating timely supplementation and improvement in the relevant data. The limitations of automated extraction methods in accurately delineating the boundaries of small ice lakes, coupled with the increasing frequency of ice and snow-related geological disasters in the study area, necessitate a deeper understanding of ice lake dynamics, particularly those near densely populated regions. This knowledge is crucial for predicting potential disaster-prone areas and their timing, enabling accurate warnings and timely implementation of preventive measures to safeguard lives and property from large-scale ice lake outburst events. The continuous renewal and expansion of ice lakes holds significant implications for the investigation of current ice lake distributions and temporal-spatial disparities, the evaluation of ice lake dynamics in response to climate change, and the assessment of GLOF disaster risk. Therefore, the objectives of this research are (1) to examine the spatiotemporal distribution patterns and changes in ice lakes in the western Nyingchi region over the past three decades utilizing Landsat satellite imagery. An accurate and comprehensive map depicting the distribution of ice lakes in western Nyingchi was generated by extracting geographic boundaries from 1994, 2010, 2018, and 2022 images through visual interpretation methods. (2) Investigate and analyse the variations in the number and extent of ice lakes within the region while quantifying the annual rates of change for ice lakes across different size categories, administrative divisions, altitudinal gradients, and other relevant dimensions over time. (3) By examining various scenarios of ice lakes, the aim of this study was to investigate and analyse the dynamic relationships between glaciers and ice lakes and to explore the correlations between changes in ice lakes and climate change within the study area.
2 Study area
The western region of Nyingchi is in the Tibet Autonomous Region and includes Bayi District, Gongbujiangda County, Lang County, and Milin city (Figure 1). The location of the area ranges from 1,078 to 7,296 m above sea level, with an average elevation of 3,100 m [26]. The region is influenced by warm and humid air currents originating from the Bay of Bengal in India, resulting in a diverse climate that encompasses tropical, subtropical, temperate, and frigid zones [27]. The mean annual temperature in this region is 8.7°C, while the average annual precipitation is approximately 800 mm [28,29]. The period from June to September experiences the highest amount of rainfall, making this period the most conducive for vegetation growth. The region experiences an average annual sunshine duration of 2022.2 h, accompanied by a frost-free period of 180 days [30]. The study area has abundant natural resources and serves as the confluence of numerous significant rivers, including the Brahmaputra River.
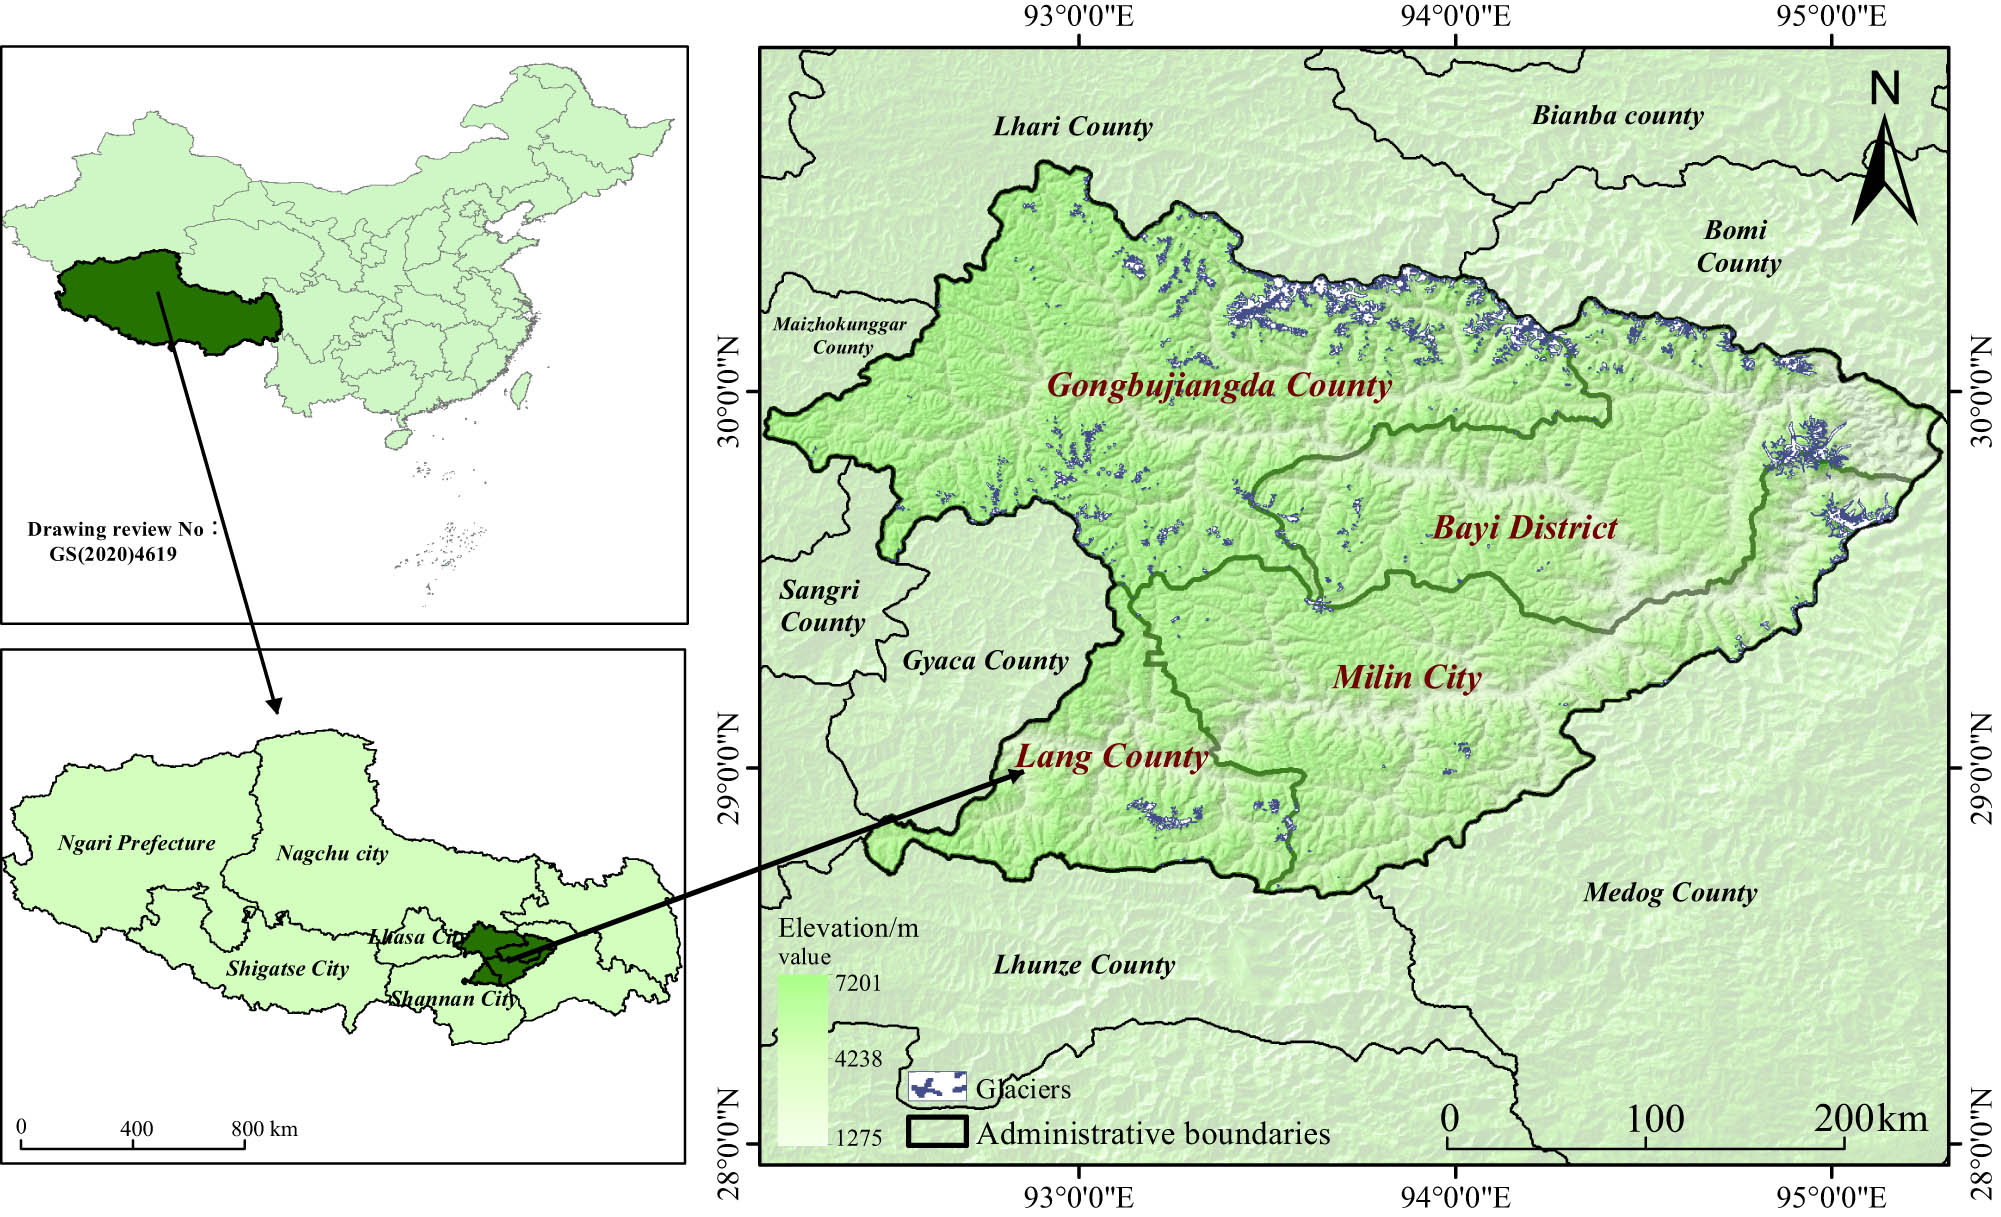
The geographical location of the western region of Nyingchi. The maps are based on the standard map system of the Map Technical Review Center of the Ministry of Natural Resources, PRC, review number GS(2020)4619. The glacier outline is derived from the Randolph Glacier Survey (RGL v6.0) and is depicted as a glacial blue colour, while the study area and its surrounding administrative boundaries are delineated with black outlines.
There are numerous glaciers situated within the study area, including the renowned Laigu Glacier and Haba Glacier. Among them, Gongbujiangda County has the highest concentration of glaciers in the northern region, and these glaciers are predominantly marine glaciers. The altitude range of these glaciers generally exceeds 4,000 m. Influenced by geological activities and a marine monsoon climate, this area experiences significant temperature fluctuations and abundant precipitation, fostering strong glacial activity that facilitates favourable conditions for ice lake expansion. The ice lakes represented by Cuomu-Ri Lake and Basong Lake are classified as glacially formed ice lakes. The distribution characteristics of glaciers and ice lakes exhibit a pattern of “greater prevalence towards the east and lesser prevalence towards the west, with a higher concentration in the northern region than in the southern region.” Among them, Gongbujiangda County has the highest number and largest area of glaciers, accounting for 67.54% of the total glacier count, with a combined area spanning 887.81 km2. Conversely, Milin city, Bayi District, and Lang County exhibit relatively limited distributions of glaciers [31]. The primary classifications of glaciers include hanging glaciers, cirque glaciers, and valley glaciers. The quantity of ice lakes is directly proportional to the quantity of glaciers [32]. In recent years, the warming trend of the climate in the Qinghai-Tibet Plateau has intensified, leading to frequent occurrences of ice lake outbursts in the study area. Therefore, it is crucial to establish a complete and comprehensive distribution map of ice lake outbursts to effectively manage disasters caused by such events. This effort is important for preventing future ice lake outburst disasters and ensuring the safety of people’s property within this region [33,34].
3 Datasets and methods
3.1 Datasets
The study used satellite imagery from 1994 through 2022 to gauge alterations in both the quantity and expansion of ice lakes spanning four counties west of southeastern Tibet. These visuals were sourced from the U.S. Geological Survey (USGS) and subsequently autoaligned using the Shuttle Radar Topography Mission (SRTM) digital elevation models (DEMs). As necessary preparatory tasks, these satellite images were enhanced, aligned, overlaid and blended. The sequences were subsequently aligned to the World Geodetic System 1984 (WGS84) and Universal Transverse Mercator Zone 46 using various visualization tools, such as the ENVI, Erdas Imagine, and ArcMap. The dominant data origins encompassed the thematic mapper, enhanced thematic mapper, and operational land imager (OLI). Cloud interference was assumed to remain under 5% for all visual imagery. A 30 m resolution SRTM DEM was retrieved from the USGS portal.
Table 1 shows the outcomes of evaluating the changes in the quantity and scope of ice lakes across these counties. Several satellite visuals were employed to trace the transitions in these ice water bodies over distinct periods. After these images were secured from the USGS, a series of digital tools facilitated their preparation. Observations indicated noticeable shifts in the quantity and spatial dimension of the ice lakes within those specified counties.
Satellite images used in the study
| Sensor | Image ID | Acquisition date | Resolution (m) | Cloud cover/% |
|---|---|---|---|---|
| LANDSAT_8 | LC81350392022017LGN00 | 2022-01-17 | 30 | 1.20 |
| LANDSAT_9 | LC91360392022016LGN01 | 2022-01-16 | 30 | 1.63 |
| LANDSAT_9 | LC81360402022008LGN00 | 2022-01-08 | 30 | 6.26 |
| LANDSAT_8 | LC81370392022015LGN00 | 2022-01-23 | 30 | 4.78 |
| LANDSAT_8 | LC81350402022017LGN00 | 2022-01-17 | 30 | 4.24 |
| LANDSAT_8 | LC81350392018022LGN00 | 2018-01-22 | 30 | 1.81 |
| LANDSAT_8 | LC81360392018029LGN00 | 2018-01-29 | 30 | 2.36 |
| LANDSAT_8 | LC81360402018029LGN00 | 2018-01-29 | 30 | 3.59 |
| LANDSAT_8 | LC81370392018004LGN00 | 2018-01-04 | 30 | 1.04 |
| LANDSAT_8 | LC81350402018022LGN00 | 2018-01-22 | 30 | 2.71 |
| LANDSAT_7 | LE71350392001015SGS00 | 2001-01-15 | 30 | 2.00 |
| LANDSAT_7 | LE71360392001006SGS00 | 2001-01-06 | 30 | 0.00 |
| LANDSAT_7 | LE71360402001006SGS00 | 2001-01-06 | 30 | 2.00 |
| LANDSAT_7 | LE71370392001029SGS00 | 2001-01-29 | 30 | 0.00 |
| LANDSAT_7 | LE71350402000349SGS00 | 2000-12-14 | 30 | 3.00 |
| LANDSAT_5 | LT51350391994340BJC01 | 1994-12-06 | 30 | 3.00 |
| LANDSAT_5 | LT51360391994347BKT01 | 1994-12-13 | 30 | 1.00 |
| LANDSAT_5 | LT51360401994347BKT01 | 1994-12-13 | 30 | 3.00 |
| LANDSAT_5 | LT51370391994002BKT02 | 1994-01-02 | 30 | 1.00 |
| LANDSAT_5 | LT51350401994356BKT00 | 1994-12-22 | 30 | 5.00 |
The climate data used in this article are sourced from the fifth generation of the European Centre for Medium-Range Weather Forecasts, specifically the Global Climate ERA-5 Atmospheric Reanalysis Data (https://cds.climate.copernicus.eu). The data included temperature, rainfall, humidity, and evaporation data with a monthly temporal resolution. The spatial resolution is set at 0.25°. The focus of this work is within the study area, where monthly data are consolidated into annual data. Subsequently, the analysis encompasses the impact of climate change on ice lake variations within the study area by selecting the annual average temperature, evaporation, and rainfall data from 1992 to 2022.
3.2 Methods
3.2.1 Extraction and classification of ice lake boundaries
In this study, the process of identifying separate ice lake entities was facilitated using a combination of the normalized difference water index (NDWI) and a semiautomated technique, which was later refined by hand-guided discretization [35]. Chosen for their ability to perform ratio analysis, the visible green and near-wave infrared wavelengths have proven useful in delineating water and non-water elements in satellite visual imagery, using a predetermined scale ranging from −0.10 to 0.20 [36]. Pertaining to the complex topographic structure in Nyingchi, we employed manual analysis and reference to historical images from Google Earth to mitigate inaccuracies in identification and more accurately trace the borders of ice lakes in the western sector of southeastern Tibet, especially in the area encompassing four counties.
Using remote sensing imagery and composite false colour visual imagery, we discerned the unique patterns, hues, and characteristics associated with ice lakes. By incorporating the NDWI, historical imagery from Google Earth, and SRTM DEM data, we obtained supplementary geographic details, such as elevation, slope direction, and area gradient. Through manual visual interpretation, the perimeters of the ice lakes were defined. For vectorizing these boundaries, 3D topographic details from Google Earth were used to determine the glaciers’ positions and related data. The ice lakes were categorized into four types: those in contact with the edge or end of the glacier, not in contact but still replenished by ice meltwater or rainfall, formed on glacial surfaces, and distant from modern glaciers without direct replenishment (Figure 2). Notably, the first three lake types are commonly termed ice recharge lakes [12]. Using ArcGIS, we measured attributes, such as the lake’s perimeter, surface area, potential errors, and other specifics. This was followed by manual entry of image sources, timeframes, classifications, and the extent of each ice lake.

The flow chart for ice lake cataloguing (on the left) encompasses phases of remote sensing image preprocessing, visual interpretation, error assessment, and local ice lake mapping. The distribution of local ice lakes in Bayi District is illustrated as an example (on the right). (a) Infrared colour synthesis of the raw data (R/G/B = Band 5/4/3); (b) visual representation of ice lakes in specific regions. (c) The provided threshold range (−0.1−0.20) is utilized for discriminating between water bodies and non-water bodies in the remote sensing image, while the contour range of the ice lake is manually identified. (d) The boundary of the ice lake was determined through artificial labelling. The remote sensing images utilized in this case were acquired by Landsat-8 OLI during the period from January 8, 2022, to January 23, 2022. The serial numbers (a–d) in the picture on the left correspond to their respective counterparts in the picture on the right.
3.2.2 Ice lake change rate and annual rate of change
To study the range of change in ice lakes, researchers use the change rate and average annual change rate. The formulas for calculating these rates are shown as follows:
where k is the change rate of climate elements, k p is the annual change rate of climate factors, x a is the initial value of climate factor studies, x b is the final value of climate factor studies, and T is the research period.
3.2.3 Trends in meteorological element changes
The changes in trends of meteorological parameters were analysed via linear regression:
where y is the meteorological element (temperature, precipitation, and evaporation), ts is the year, a is the linear trend term, and b is a constant term. a·5 represents the average climatic slope (change trend) of a certain meteorological element every 5 years; the average annual value is 1992–2022.
3.2.4 Error estimation
While mapping out the perimeters of ice lakes, certain inaccuracies might occur and be influenced by several attributes. These include the clarity and resolution of the imagery, the choice of classification cut-off, and the accuracy of the interpretations [37,38]. It was assumed that the region affected by individual interpretation adhered to a Gaussian distribution. This assumption was used to estimate the error in the observed ice lake size by accounting for the pixel count along the ice lake border [39]. The equation used is shown as follows:
where ε is the maximum area error (km2) of the ice lake, σ is the standard deviation, P is the circumference of the ice lake (m), V is the spatial resolution (30 m), and 0.6872 is the correction coefficient of the unit standard deviation.
4 Results
4.1 Spatial distribution and spatiotemporal evolution of ice lakes from 1994 to 2022
As of 2022, the western region of southeastern Tibet experienced the development of ice lakes covering an estimated area of 159.2 ± 10.8 km2. From 1994 to 2022, these lakes experienced an increase by 35.8 ± 3.0 km2, which is an overall 29.0% increase (Table 2). The distribution of ice lakes is concentrated in the northern part of Bayi District and Milin city but sparse in Lang County and Gongbujiangda County (refer to Figure 3). Specifically, the ice recharge lakes and non-ice recharge lakes experienced growths of 44.4 and 18.6%, respectively. Among them, supraice lakes recorded the highest annual expansion rate. Moreover, glacial contact lakes and non-glacier contact lakes exhibited more modest annual growth rates – 1.3% per annum and 0.8% per annum, respectively. In contrast, non-ice recharge lakes expanded at a minimal annual pace of only 0.56% per annum.
Variations in the area/quantity of different types of ice lakes in western Nyingchi
| Area/km2 (quantity) | Ice lake area change rate/(% per annum) | ||||||
|---|---|---|---|---|---|---|---|
| Ice lake type | 1994 | 2010 | 2018 | 2022 | 1994–2010 | 2010–2022 | |
| Glacier feeding lake | Superglacial lake | 12.6 ± 0.1 (69) | 15.7 ± 0.7 (94) | 18.4 ± 0.4 (139) | 22.6 ± 0.5 (157) | 1.2 | 1.5 |
| Ice contact lake | 7.3 ± 0.6 (36) | 8.5 ± 0.7 (46) | 9.4 ± 0.7 (68) | 11.5 ± 0.7 (86) | 0.9 | 1.1 | |
| Ice uncontact lake | 25.4 ± 4.2 (143) | 26.4 ± 3.9 (206) | 27.4 ± 3.6 (216) | 31.3 ± 3.2 (248) | 0.2 | 0.8 | |
| Non-glacial feeding lake | 79.1 ± 5.1 (547) | 84.3 ± 7.8 (617) | 89.3 ± 6.3 (729) | 93.8 ± 6.3 (768) | 0.4 | 0.3 | |
| Total | 123.4 ± 13.8 (795) | 140.9 ± 7.4 (963) | 148.6 ± 7.8 (1152) | 159.2 ± 10.8 (1259) | 0.5 | 0.4 | |
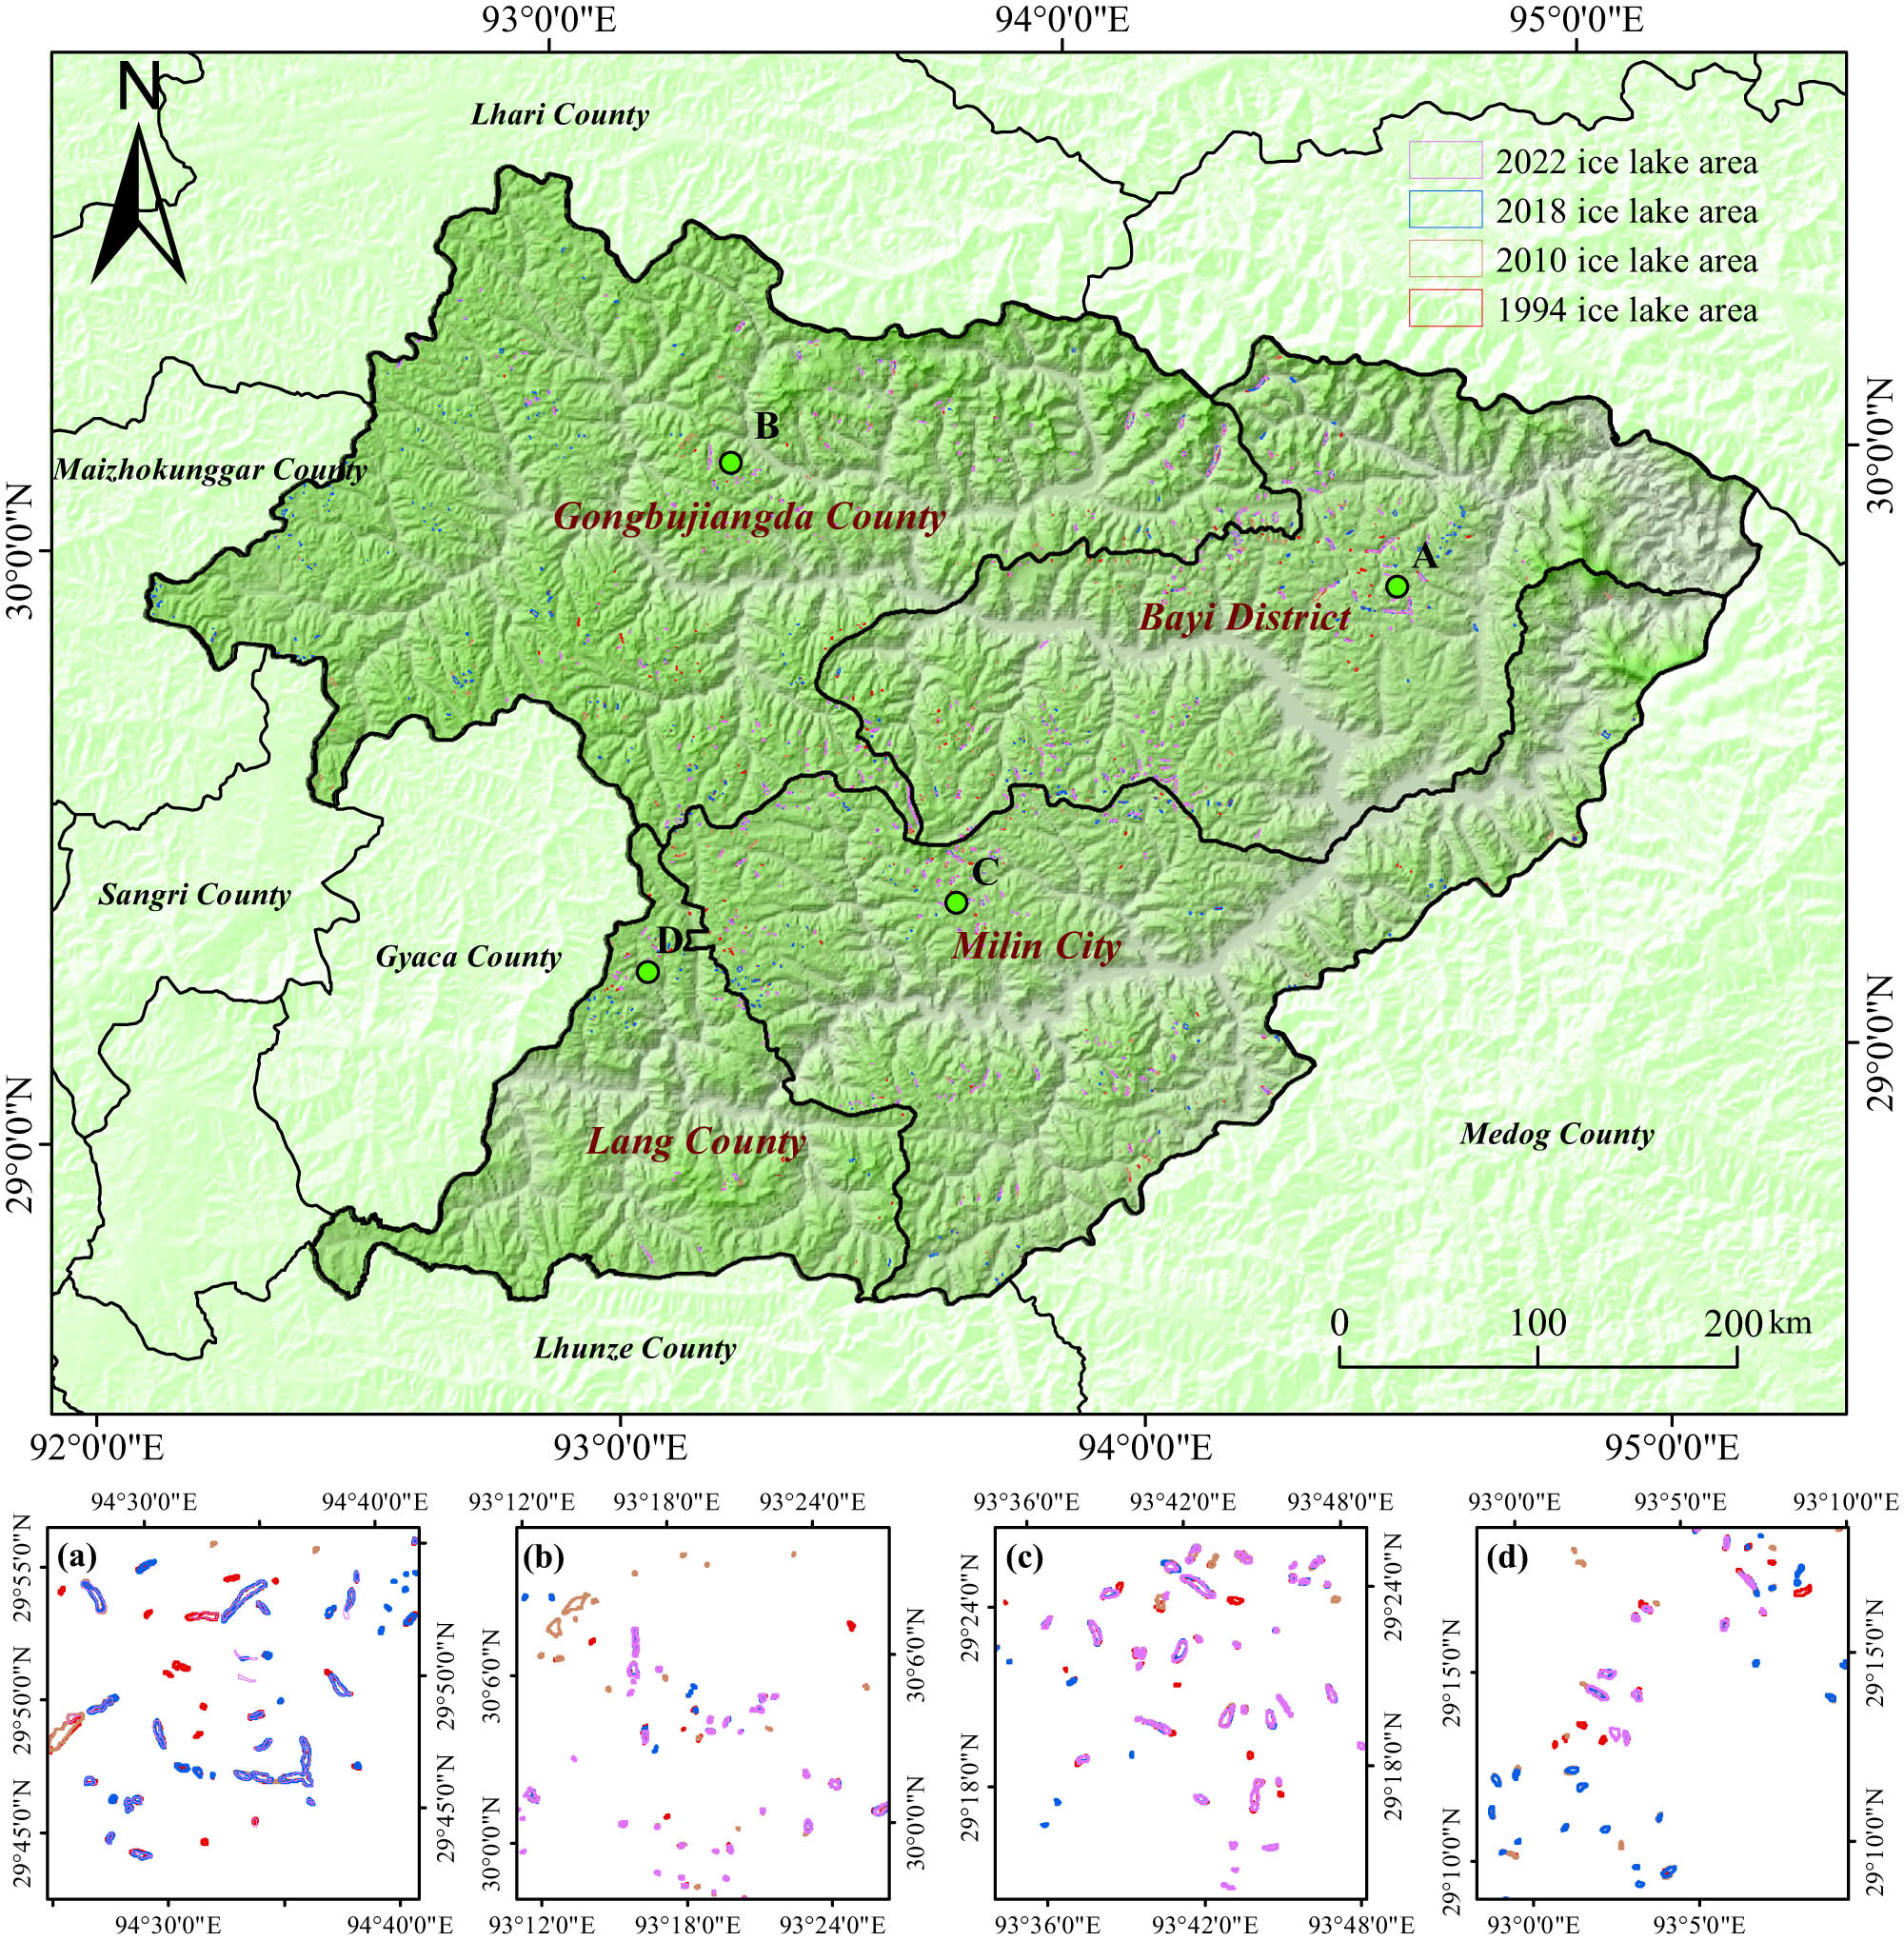
Distribution of ice lakes in the study area in 1994, 2010, 2018, and 2022. This map was produced using a visual interpretation method and Landsat images collected throughout the year. The four zoom-in maps (a)–(d) show local detail in different regions, including the Bayi District (a), Gongbujiangda County (b), Milin City (c), and Lang County (d).
From 1994 to 2022, an upward trend in the expansion of ice recharge lakes was recorded, with an annual average increase of 1.1%, a rate that is 1.8 times greater than the 0.6% found in non-ice recharge lakes. The investigation of interdecadal changes revealed clear fluctuations in the yearly expansion rates of ice lake areas before and after the 2010s. In pre-2010s, an expansion rate of 0.4% per year was registered for ice recharge lakes, outpacing the 0.2% per year rate of non-ice recharge lakes that began in the 1990s. However, from 2010 to 2022, both ice and non-ice recharge lakes showed signs of expansion, with yearly incremental rates of 1.1 and 0.3%, respectively. Interestingly, the complete area of ice lakes within our research zone expanded at a rate of 0.5% per year from 1994 to 2010. A decline in the annual rate of expansion manifested after the 2010s, falling marginally to 0.4% per annum, as shown in Table 2. This slowdown reflects the intricate ecological dynamics and the interplay among these factors, which have manipulated the development and shape of ice lakes over time.
4.2 Change characteristics of ice lakes at different scales
The study area in the 2022s had a total of 1,259 ice lakes, covering an area of 158.9 km2, with wide variation in size and number. There were 434 lakes larger than 0.01 km2, covering 125.9 km2 or 79.2% of the total lake area. In contrast, 298 lakes between 0.05 km2 and 0.1 km2 occupied 21.3 km2 or 13.4% of the total area. Lakes smaller than 0.05 km2 numbered 527, with a coverage of 11.7 km2, representing only 7.4% of the overall count. This group’s share was notably less than that of the other two groups, comprising only 20.8% of the total lake area.
As of 2022, the study area contained 1,259 ice lakes, which varied greatly in size and number, covering a total area of 158.9 km2. The larger lakes were greater than 0.01 km2, numbered 434 and covered 125.9 km2, accounting for 79.2% of the total lake area. In contrast, the smaller lakes, which were between 0.05 and 0.1 km2, numbered 298 and occupied 21.3 km2, representing 13.4% of the total area. The smallest lakes were less than 0.05 km2, numbered 527 and covered 11.7 km2, comprising only 7.4% of the total lake area. This group’s share was notably less than that of the other two groups, accounting for only 20.8% of the total lake area.
Between 1994 and 2022, the number and size of ice lakes in four counties in the western southeast Tibet increased (Table 3). Over 28 years, the lake area grew by 35.5 km2, with the most significant growth observed in lakes larger than 0.1 km2, expanding by 26.4 km2, which is a 26.5% change. Lakes between 0.05 and 0.1 km2 grew by 4.8 km2, while those smaller than 0.05 km2 expanded by 4.3 km2. The most pronounced expansion was observed in lakes over 0.1 km2 in size, which grew by 26.4 km2.
Area and number of ice lakes of different sizes for different periods from 1994 to 2022
| Year | 1994 | 2010 | 2018 | 2022 | Area change | |||||
|---|---|---|---|---|---|---|---|---|---|---|
| Area classification | Number | Area/km2 | Number | Area/km2 | Number | Area/km2 | Number | Area/km2 | Area/km2 | % |
| <0.05 km2 | 230 | 7.4 | 361 | 11.0 | 509 | 11.5 | 527 | 11.7 | 4.3 | 58.2 |
| ≥0.05 km2 and <0.1 km2 | 231 | 16.5 | 251 | 17.6 | 258 | 18.6 | 298 | 21.3 | 4.8 | 29.0 |
| ≥0.1 km2 | 334 | 99.5 | 351 | 112.3 | 385 | 118.5 | 434 | 125.9 | 26.4 | 26.5 |
| Total | 795 | 123.4 | 963 | 140.9 | 1152 | 148.6 | 1259 | 158.9 | 35.5 | 28.8 |
In the study area, the number and coverage of ice lakes exhibited significant variation, with larger lakes occupying most of the lake area. Over the 28-year period, the growth in lake area was most pronounced in larger lakes, while smaller lakes experienced only minor growth. It is important to note these differences in the distribution and growth of ice lakes in the study area.
4.3 Changes in ice lake characteristics at different altitudes
This study investigated the dimensions and population of ice lakes within a specific altitude range in the western region of southeastern Tibet. The findings revealed a consistent pattern for both measured dimensions, as depicted in Figure 4. The elevation range of all the ice lakes ranged from 2700.0 to 7427.0 m during 1994, 2010, 2018, and 2022. Most of the lakes (over 74.59%) were densely populated between 4386.0 and 5143.0 m. The study showed that elevation had a significant impact on the variability in ice lakes. The expansion areas of ice lakes at altitudes ranging from 5143.0 to 7427.0 m were the largest, accounting for 44.8% of the total expansion area of ice lakes from 1994 to 2022.

(a) Elevation number and area distribution of ice lakes. (b) Changes in ice lake areas at different altitudes from 1994 to 2022.
The western region of southeastern Tibet receives an annual average precipitation of 802.7 mm, which is notably higher than the average annual evaporation of 666.2 mm. This is largely due to accelerated melting of glaciers in the HMA region. However, during the accumulation season, the evaporation rate (352.4 mm) exceeded the rainfall rate (159.1 mm). In contrast, during the melting period, rainfall (1262.2 mm) prevailed over evaporation (928.9 mm), contributing significantly to the increase in the distribution of densely populated lakes (as illustrated in Figure 7a, b, e, and f).
The analysis revealed that the ice lake distribution area expanded significantly within the altitude range of 4768.0∼5143.0 m. This is mainly because the mountains and valleys of favourable environments, such as widespread environments coupled with high-elevation rainfall, are rich and have low evaporation (refer to Figure 4b), promoting the growth of many ice lakes.
4.4 Distribution of ice lakes in different areas of the county
During 1994 to 2022, a gradual increase in the average altitude of the ice lake was observed across various regions and counties. Among these, Gongbujiangda County registered a hike from 4801.3 to 4957.7 m, the most considerable increase in the average altitude of ice lake settlement. In contrast, the average altitude in Baiyi District decreased, shifting from 4545.9 to 4485.5 m.
An interesting pattern was observed in Gongbujiangda County, where ice lakes extending above the average altitude expanded at a significantly quicker pace (1.8% per annum) than did their counterparts situated below the average altitude (0.9% per annum). A similar trend was identified in Baiyi District with different figures. Therein, the ice lakes positioned above the average altitude swelled at a rate of 1.2% per annum, which is double that of the ice lakes positioned below the average altitude (0.6% per annum).
Comparatively, Milin city exhibited minimal variation in the average elevation change associated with ice lake distribution (from 4611.0 m in 1994 to 4599.0 m in 2022). Notably, the lakes above the average altitude expanded at a rate of 0.6% per annum, which is nearly 0.7 times slower than those below the average altitude (0.9% per annum).
Within the study area, a significant increase in the maximum elevation of the ice lake was noted in inland counties, increasing from 5233.0 m in 1994 to 5762.0 m in 2022. The underlying expansion rate of ice lakes beneath the average elevation was more prominent (2.0% per annum) than that of lakes extending above the average elevation (1.6%).
In summary, the study revealed that in the four counties examined in southeastern and western Tibet, the ice lakes extending above the average elevation tended to increase more swiftly than their equivalents situated beneath the average elevation, as shown in Figure 5.

Different districts and counties have different altitudes in the western region of Nyingchi city (the natural breakpoint method is used to distinguish the band). The red line represents the mean altitude of the ice lake in 1994; the blue line represents the average elevation of the same lake in 2022. (a) Bayi District, (b) Lang County, (c) Gongbujiangda County, and (d) Milin City.
4.5 Variation characteristics of ice lakes with different aspects
To better understand the connection between the distribution of ice lakes and the surrounding topography, we used SRTM DEM data to construct a slope direction map. A statistical analysis of the slope direction of the ice lakes was conducted in 8 main directions, as shown in Figure 6.

Changes in various aspects of the ice lake in western Nyingchi from 1994–2022. (a) The count of ice lakes. (b) Area of ice lakes/km2.
Our investigation revealed a consistent expansion of the ice lake area in all directions from 1994 to 2022. When evaluating both the quantity and extent of the ice lakes, we observe that their growth is primarily concentrated in the N, NE, and W directions. This finding implies that the main areas of expansion, as well as the number of ice lakes, are commonly found on the shaded side of the mountains. This observation suggests that regions with a greater occurrence of ice interactions within the study area are likely to undergo significant transformations. The expansion rate of ice lakes in various orientations within the study area is predominantly influenced by the regional climate. The northern direction, characterized by abundant precipitation and minimal evaporation, contributed to a high expansion rate. Hence, because most ice lake formations occur in this direction, the overall expansion rate of the area tends to be considerably high.
5 Discussion
5.1 Reliability analysis of ice lake data
Meteorological data reveal that a significant portion of Nyingchi’s rainfall occurs between June and September, peaking from July to August. To ensure that transient environmental factors causing variations in ice lake sizes are considered and to circumvent the effect of snow on the vector results of ice lakes, this study employed 16 remote sensing images from January (Table 1). These images account for 80% of the complete imagery used in this study, with images from other months providing additional data.
Research on ice lake disaster distribution characteristics in southeastern and western Tibetan counties is important due to potential geological risks. The 2021 High Asian Ice catalogue, which uses remote sensing images from 2018, records 495 ice lakes, each exceeding 0.02 km2 within a 2 km glacier radius [40]. In contrast, according to the dataset of this study, another 389 existing or new ice lakes of 0.02 km2 or smaller were identified by 2022. The High Asian Ice catalogue reported 517 ice lakes of 0.02 km2 or less, while this study recorded 923 lakes larger than 0.02 km2. The inaccuracies for smaller lakes are primarily due to the quality of remote sensing images and ice and snow coverage, based on the 2018 High Asian Research ice lake data. Thus, the 2018 count of ice lakes in the southeastern and western regions was adjusted to 1,152, which is consistent with the findings of this study. The two databases collectively include 513 ice lakes with total areas of 148.6 ± 7.8 km2 and 159.2 ± 10.8 km2 in 2018 and 2022, respectively. These results corroborate the yearly enlargement trend of ice lakes in southeastern and western Tibet and are well within the acceptable error range. Hence, the ice lake vectorization outcomes of this study can precisely represent changes in size and distribution over time, providing reliable data for the study of ice lake disasters in southeastern Tibet.
5.2 Impacts of climate change on ice lake change
Various climatic parameters, encompassing precipitation, temperature, and evaporation, are reflective of climate alterations. These parameters are crucial in determining the dynamics of ice lakes. Shifts in these elements influence both the advance and retreat of glaciers. With glacial retreat, the combined effect of meltwater and rainfall largely initiates the formation of ice lakes. Lakes that do not receive glacial input depend largely on rain, snowmelt, and evaporation [5]. An examination illustrated in Figure 7 showcases a significant shift in precipitation over time. Between 1992 and 2007, the annual average precipitation (853 mm) increased at a rate of 2.31 mm/a. However, this trend reversed from 2007 to 2022, with the average falling to 804 mm and decreasing at a rate of 2.60 mm/a. This reduction relates to a slower expansion in ice lake areas after 2007, as depicted in Figure 7a. Furthermore, from the 1992s to the 2022s, the annual average rainfall rates underwent changes. During 1992–2007, the ablation phase increased by 4.04 mm/a, but from 2007 to 2022, there was a decrease by 0.30 mm/a during the cumulative season. This finding translates into a yearly rainfall decrease by 3.98 mm/a during ablation and 0.65 mm/a during the cumulative phase, as shown in Figure 7b. The data in Table 2 corroborate these trends, showing a faster annual expansion rate in the ice lake region from 1994–2008 (0.5% per annum) than from 2008–2022 (0.4% per annum). This study suggested that notable temperature shifts highly influence ice lakes [41]. The data reveal a consistent increase in temperature in the glaciated southeastern Tibetan region from 1992 to 2022 at a rate of 0.02°C/a (Figure 7c). When temperatures rise, regional glaciers recede, but yearly evaporation continues to increase at 0.82 mm/a (Figure 7e).

Trends in precipitation, temperature, and evaporation in the four counties west of Nyingchi from 1992 to 2022. (a) Mean annual precipitation in millimetres/year. (b) Seasonal precipitation trend: ablation seasonal temperature (April, May, June, July, August, September, October) and cumulative seasonal precipitation (November, December, January, February, March). (c) Annual average temperature. (d) Seasonal temperature trend: ablation seasonal temperature (AMJJASO) and cumulative seasonal temperature (NDJFM). (e) Average annual evaporation in millimetres/year. (f) Seasonal evaporation trend: ablation seasonal evaporation (AMJJASO) and cumulative seasonal evaporation (NDJFM).
Although the glaciers in southeastern Tibet are retreating, the precipitation level (780.2 mm) is higher than the evaporation level (668.7 mm), which led to the expansion of ice lakes. This trend is consistent with the observations made in the HMA regions. An in-depth study of temperature and evaporation from 1992 to 2007 during the accumulation and ablation seasons revealed a positive correlation in the accumulation season, with temperature and evaporation increasing by 0.08°C/a and 3.04 mm/a, respectively. However, during the ablation season, the temperature increased by 0.03°C/a, and the evaporation rate decreased (−0.04°C/a), suggesting a negative correlation (Figure 7d and f). From 1992–2010, the ice lake area expanded by 35.8 ± 3.0 km2 at an annual rate of 0.5% per annum. In contrast, from 2007–2022, there were decreases in temperature and evaporation during the accumulation season, at rates of 0.01°C/a and 0.78 mm/a, respectively. A negative correlation was observed during the ablation season between a temperature increase of 0.02°C/a and a decrease in the evaporation rate by −0.15 mm/a. The ice lake area grew by 10.6 ± 3.0 km2 from 2010 to 2022, at an expansion rate of 0.4% per annum. In summary, ice lakes expand when precipitation increases (2.31 mm/a), evaporation increases (1.19 mm/a), and temperature increases significantly (0.07°C/a). Conversely, lake areas reduce when precipitation decreases (−2.60 mm/a) beyond evaporation (1.33% per annum), with slower temperature increases (0.003°C/a). These findings confirm the research emphasizing the dominant role of rainfall and evaporation in shaping lake changes on the Qinghai-Tibet Plateau [42]. However, ice lake alterations are also influenced by other factors, such as catchment area, lake runoff, and the melting of snow and permafrost. Therefore, further quantitative studies on ice lakes are essential.
5.3 Changes in glaciers and ice lakes
The authors of the study categorized ice lakes based on their proximity to glaciers and analysed the variable characteristics of these diverse lake types. They scrutinized the transformation process of three representative ice lakes located in the western region of southeastern Tibet, which are referred to as ice lakes A, B, and C. These lakes are positioned at geographical coordinates 94°20′39.51″E, 29°59′01.66″N; 94°20′29.51″E, 29°59′06.40″N; and 94°16′38.10″E, 30°01′49.85″N, respectively (refer to Figure 8). The authors predicted that the area of ice lake A will increase from 0.09 ± 0.002 km² to 0.12 ± 0.002 km² by 2022, that of ice lake B will increase from 0.08 ± 0.001 km² to 0.11 ± 0.001 km², and that of ice lake C will increase from 0.02 ± 0.002 km² to 0.08 ± 0.002 km².

Change process of ice lakes A, B, and C (Both images are remote sensing images from September 10, 2022).
The study showed that ice lakes have undergone various degrees of expansion, with alterations in ice lakes and primary glaciers within the same climatic conditions being noteworthy. The melting of glaciers contributes to the water supply of these lakes, while factors, such as evaporation, temperature, and precipitation in the research area have resulted in the enlargement of ice lakes. Furthermore, the ongoing expansion of ice lakes initiates the regression of glaciers, signifying a reciprocal relationship between ice lake enlargement and ice retreat.
6 Conclusion
Based on Landsat satellite images and survey data collected in 1994, 2010, 2018, and 2022, the distribution of ice lakes in four counties in southeastern and western Tibet, combined with cataloguing data on ice lakes, was analysed to determine the change characteristics and factors influencing ice lakes in the four counties in southeastern and western Tibet from 1994 to 2022. The following conclusions were reached as a result of this study:
The year 2022 marked the emergence of 1,259 ice lakes, covering an estimated area of 159.2 ± 10.8 km2. Tracking the changes from 1994 to 2022, the ice lakes expanded by approximately 35.8 ± 3.0 km2, averaging an annual increase by nearly 0.8%. During the decades spanning from 1994 to 2010 and from 2010 to 2022, the generation rate of these ice lakes accelerated at a quicker pace (0.5% per annum) in comparison to their overall area growth (0.4% per annum). When examining the period from 1994 to 2022, the increase rate of ice recharge lakes (1.1% per annum) outpaced that of non-ice recharge lakes (0.6% per annum) by nearly 1.8 times. Aspects, such as regional climate patterns, specifically precipitation and evaporation, play pivotal roles in inducing changes in ice lakes. The increase in ice recharge lakes mainly originated from increased rainfall, decreased evaporation, and ice retreat. Simultaneously, changes in non-ice recharge lakes can be largely related to variations in precipitation and evaporation, particularly when the accumulated seasonal evaporation surpasses rainfall, causing considerable area transformations in these lakes.
The ice lakes in the region under study exhibit significant spatial and temporal variability, which can be attributed to climate change and distribution effects. Since the early 1990s, there has been a consistent acceleration in the rate of change in these ice lakes, and their spatial arrangement follows a normal curve. Ice lakes located above the average altitude experienced faster growth than those below, particularly in the four western counties of southeastern Tibet from the mid-1990s to the 2022s. By the 2022s, the average altitude of the ice lakes reached 4760.4 m, representing an increase by approximately 98.0 m compared to the average altitude of 4662.4 m in the mid-1990s. The maximum recorded altitudes where ice lake distribution occurred ranged from 5586.0 m in the mid-1990s to 5790.0 m by 2022. Notably, Gongbujiangda County and Lang County exhibited significant increases in the average altitude of the ice lake, with increases in elevation by 156.4 and 113.9 m, respectively. These increases are closely linked to the rise of the HMA region, which extends into high-elevation areas and is supported by a rapid increase in regional precipitation records.
Disaster management and prevention of ice lake outbursts have always been challenging in high-elevation areas. This study suggested that enhancing the level of ice lake disaster risk management can be achieved through the implementation of early warning and prediction systems, the establishment of isolated danger safety zones, the implementation of disaster prevention and reduction projects, the improvement of local medical and health conditions, the strengthening of training for emergency management personnel, and the establishment of a government-led disaster insurance system. The establishment of the disaster disposal links enables the creation of a comprehensive system integrating disaster prevention and treatment, thereby mitigating and potentially eradicating threats to human lives and property posed by hazardous areas. Moreover, in regions with a fragile economic foundation, it is imperative for the government to lead relevant disaster experts in conducting risk and hazard assessments of ice lake outbursts based on the most up-to-date local distribution map of such lakes. This information should be accounted for during major decision-making processes, such as engineering construction and urban planning in high-altitude areas, ensuring proactive avoidance of areas with high disaster risk. Therefore, we can effectively minimize and prevent property losses for individuals.
Acknowledgements
We thank NASA and the USGS for supplying Landsat images and the European Space Agency and the Water and Power Development Authority for their contributions to the climate data and the datasets are provided by National Cryosphere Desert Data Center (http://www.ncdc.ac.cn).
-
Funding information: This study was supported by the Key Research and Development Project of the Tibet Autonomous Region (Grant no. XZ202201ZY0034G), the Major Science and Technology Projects in the Tibet Autonomous Region (Grant no. XZ202201ZD0003G03), and the National Natural Science Foundation Joint Fund Project (Grant no. U22A20596).
-
Author contributions: Mingwei YU conducted a comprehensive review of the literature, meticulously compiled and analysed the research data, and successfully finalized the manuscript; Yonggang GUO conducted a thorough review and revision of the article’s content, assuming the role of the corresponding author for this publication; Feng LI conducted a comprehensive mapping of ice lakes in the western Nyingchi region for both 1994 and 2010; Libin SU completed the mapping and data download of the ice lake map in the western region of Nyingchi for 2018; and Deshun QIN completed the ice lake map in the western region of Nyingchi for 2022.
-
Conflict of interest: The authors declare that they have no competing interests.
-
Ethical approval Not applicable.
-
Consent to participate Not applicable.
-
Consent for publication Not applicable.
-
Data availability statement: The data presented in this study are available on request from the corresponding author.
References
[1] Immerzeel WW, Lutz AF, Andrade M, Bahl A, Biemans H, Bolch T, et al. Importance and vulnerability of the world’s water towers. Nature. 2020;577:364–9.10.1038/s41586-019-1822-ySearch in Google Scholar PubMed
[2] Immerzeel WW, Van Beek LP, Bierkens MF. Climate change will affect the Asian water towers. Science. 2010;328:1382–5.10.1126/science.1183188Search in Google Scholar PubMed
[3] ChenDeliang X. Assessmentof past, present and future environmental changes on the Tibetan Plateau. Chin Sci Bull. 2015;60:3025–35.Search in Google Scholar
[4] Cui Y, Zhu L, Ju J, Luo L, Wang Y. Climate change and hydrological response in the Ranwu Lake Basin of Southeastern Tibet Plateau. Water. 2023;15:2119.10.3390/w15112119Search in Google Scholar
[5] Wang X, Liu Q, Liu S, Wei J, Jiang Z. Heterogeneity of glacial lake expansion and its contrasting signals with climate change in Tarim Basin, Central Asia. Environ Earth Sci. 2016;75:1–11.10.1007/s12665-016-5498-4Search in Google Scholar
[6] Shugar DH, Burr A, Haritashya UK, Kargel JS, Watson CS, Kennedy MC, et al. Rapid worldwide growth of glacial lakes since 1990. Nat Clim Change. 2020;10:939–45.10.1038/s41558-020-0855-4Search in Google Scholar
[7] Mergili M, Müller JP, Schneider JF. Spatio-temporal development of high-mountain lakes in the headwaters of the Amu Darya River (Central Asia). Glob Planet Change. 2013;107:13–24.10.1016/j.gloplacha.2013.04.001Search in Google Scholar
[8] Zhang G, Yao T, Xie H, Zhang K, Zhu F. Lakes’ state and abundance across the Tibetan Plateau. Chin Sci Bull. 2014;59:3010–21.10.1007/s11434-014-0258-xSearch in Google Scholar
[9] Maurer JM, Rupper SB, Schaefer JM. Quantifying ice loss in the eastern Himalayas since 1974 using declassified spy satellite imagery. Cryosphere. 2016;10:2203–15.10.5194/tc-10-2203-2016Search in Google Scholar
[10] Chen F, Zhang M, Tian B, Li Z. Extraction of glacial lake outlines in Tibet Plateau using Landsat 8 imagery and Google Earth Engine. IEEE J Sel Top Appl Earth Observ Remote Sens. 2017;10:4002–9.10.1109/JSTARS.2017.2705718Search in Google Scholar
[11] Zhang M-M, Chen F, Tian B-S. An automated method for glacial lake mapping in High Mountain Asia using Landsat 8 imagery. J Mt Sci. 2018;15:13–24.10.1007/s11629-017-4518-5Search in Google Scholar
[12] Wang X, Guo X, Yang C, Liu Q, Wei J, Zhang Y, et al. Glacial lake inventory of high-mountain Asia in 1990 and 2018 derived from Landsat images. Earth Syst Sci Data. 2020;12:2169–82.10.5194/essd-12-2169-2020Search in Google Scholar
[13] Zhang M, Chen F, Zhao H, Wang J, Wang N. Recent changes of glacial lakes in the high mountain Asia and its potential controlling factors analysis. Remote Sens. 2021;13:3757.10.3390/rs13183757Search in Google Scholar
[14] Zhao H, Zhang M, Chen F. GAN-GL: Generative adversarial networks for glacial lake mapping. Remote Sens. 2021;13:4728.10.3390/rs13224728Search in Google Scholar
[15] Chai B, Tao Y, Du J, Huang P, Wang W. Hazard assessment of debris flow triggered by outburst of Jialong Glacial Lake in Nyalam County, Tibet. Earth Sci. 2020;45:4630–9.Search in Google Scholar
[16] Liu J, Zhang J, Gao B, et al. An overview of glacial lake outburst flood in Tibet. China J Glaciol Geocryol. 2019;41:1335–47.Search in Google Scholar
[17] Zhou Z, Cheng X, Shangguan D, Li W, Li D, He B, et al. A comparative study of a typical glacial lake in the himalayas before and after engineering management. Remote Sens. 2022;15:214.10.3390/rs15010214Search in Google Scholar
[18] Liu Q, Liu S, Zhang Y, Wang X, Zhang Y, Guo W, et al. Recent shrinkage and hydrological response of Hailuogou glacier, a monsoon temperate glacier on the east slope of Mount Gongga, China. J Glaciol. 2010;56:215–24.10.3189/002214310791968520Search in Google Scholar
[19] Yang W, Yao T, Guo X, Zhu M, Li S, Kattel DB. Mass balance of a maritime glacier on the southeast Tibetan Plateau and its climatic sensitivity. J Geophys Res: Atmos. 2013;118:9579–94.10.1002/jgrd.50760Search in Google Scholar
[20] An B, Wang W, Yang W, Wu G, Guo Y, Zhu H, et al. Process, mechanisms, and early warning of glacier collapse-induced river blocking disasters in the Yarlung Tsangpo Grand Canyon, Southeastern Tibetan Plateau. Sci Total Environ. 2022;816:151652.10.1016/j.scitotenv.2021.151652Search in Google Scholar PubMed
[21] Gao Y, Yang W, Guo R, Jiang L. Remote sensing monitoring and analysis of Jinwuco lateral moraine landslide-glacial lake outburst in Southeast Tibet. Remote Sens. 2023;15:1475.10.3390/rs15061475Search in Google Scholar
[22] Jiang L, Fan X, Deng Y, Zou C, Feng Z, Djukem D, et al. Combining geophysics, remote sensing and numerical simulation to assess GLOFs: Case study of the Namulacuo lake in the Southeastern Tibetan Plateau. Sci Total Environ. 2023;880:163262.10.1016/j.scitotenv.2023.163262Search in Google Scholar PubMed
[23] Allen SK, Zhang G, Wang W, Yao T, Bolch T. Potentially dangerous glacial lakes across the Tibetan Plateau revealed using a large-scale automated assessment approach. Sci Bull. 2019;64:435–45.10.1016/j.scib.2019.03.011Search in Google Scholar PubMed
[24] Wang W, Yao T, Gao Y, Yang X, Kattel DB. A first-order method to identify potentially dangerous glacial lakes in a region of the Southeastern Tibetan Plateau. Mt Res Dev. 2011;31:122–30.10.1659/MRD-JOURNAL-D-10-00059.1Search in Google Scholar
[25] Zhang M, Chen F, Tian B, Liang D, Yang A. High-frequency glacial lake mapping using time series of Sentinel-1A/1B SAR imagery: An assessment for the southeastern Tibetan Plateau. Int J Environ Res Public Health. 2020;17:1072.10.3390/ijerph17031072Search in Google Scholar PubMed PubMed Central
[26] Fu C-c LiX-q, Cheng X. Unraveling the mechanisms underlying lake expansion from 2001 to 2020 and its impact on the ecological environment in a typical Alpine basin on the Tibetan Plateau. China Geol. 2023;6:216–27.10.31035/cg2023015Search in Google Scholar
[27] Yang D. Analysis of main engineering geological problems in Changdu to Linzhi section of Sichuan-Tibet Railway. Railw Stand Des. 2019;63:16–22.Search in Google Scholar
[28] Deng M, Chen N, Wang T, Ding H. Fluctuation of daily rainfall extreme in Southeastern Tibet. J Nat Disasters. 2017;26:152–9.Search in Google Scholar
[29] Li X, Wang L, Chen D, Thompson L, Yang K, Zhong S, et al. Large-scale circulation dominated precipitation variation and its effect on potential water availability across the Tibetan Plateau. Environ Res Lett. 2023;18:074018.10.1088/1748-9326/acdd15Search in Google Scholar
[30] Wei D. Temporal and spatial variation of snow cover in Southeast Tibet Based on Landsat – a case study of Linzhi area [D]. Master’s thesis. Sichuan Normal University; 6, 2022.Search in Google Scholar
[31] Li Y, Li F, Shangguan D, Ding Y. A new global gridded glacier dataset based on the Randolph Glacier Inventory version 6.0. J Glaciol. 2021;67:773–6.10.1017/jog.2021.28Search in Google Scholar
[32] Ke L, Song C, Wang J, Sheng Y, Ding X, Yong B, et al. Constraining the contribution of glacier mass balance to the Tibetan lake growth in the early 21st century. Remote Sens Environ. 2022;268:112779.10.1016/j.rse.2021.112779Search in Google Scholar
[33] Peng D, Zhang L, Jiang R, Zhang S, Shen P, Lu W, et al. Initiation mechanisms and dynamics of a debris flow originated from debris-ice mixture slope failure in Southeast Tibet, China. Eng Geol. 2022;307:1067–83.10.1016/j.enggeo.2022.106783Search in Google Scholar
[34] Zhao F, Long D, Li X, Huang Q, Han P. Rapid glacier mass loss in the Southeastern Tibetan Plateau since the year 2000 from satellite observations. Remote Sens Environ. 2022;270:1128–53.10.1016/j.rse.2021.112853Search in Google Scholar
[35] Sekertekin A. A survey on global thresholding methods for mapping open water body using Sentinel-2 satellite imagery and normalized difference water index. Arch Comput Methods Eng. 2021;28:1335–47.10.1007/s11831-020-09416-2Search in Google Scholar
[36] Aravena RA, Lyons MB, Keith DA. Holistic reduction to compare and create new indices for global inter-seasonal monitoring: Case study for high resolution surface water mapping. Remote Sens. 2023;15:2063.10.3390/rs15082063Search in Google Scholar
[37] Hall DK, Bayr KJ, Schöner W, Bindschadler RA, Chien JY. Consideration of the errors inherent in mapping historical glacier positions in Austria from the ground and space (1893–2001). Remote Sens Environ. 2003;86:566–77.10.1016/S0034-4257(03)00134-2Search in Google Scholar
[38] Paul F, Huggel C, Kääb A. Combining satellite multispectral image data and a digital elevation model for mapping debris-covered glaciers. Remote Sens Environ. 2004;89:510–8.10.1016/j.rse.2003.11.007Search in Google Scholar
[39] Hanshaw MN, Bookhagen B. Glacial areas, lake areas, and snow lines from 1975 to 2012: status of the Cordillera Vilcanota, including the Quelccaya Ice Cap, northern central Andes, Peru. Cryosphere. 2014;8:359–76.10.5194/tc-8-359-2014Search in Google Scholar
[40] Xin W, Xiaoyu G, Chengde Y. Cataloging data set of high Asian ice lakes. National Cryosphere Desert Data Center (www.ncdc.ac.cn).Search in Google Scholar
[41] Imrit MA, Sharma S. Climate change is contributing to faster rates of lake ice loss in lakes around the Northern Hemisphere. J Geophys Res: Biogeosci. 2021;126:e2020JG006134.10.1029/2020JG006134Search in Google Scholar
[42] Liu W, Xie C, Zhao L, Li R, Liu G, Wang W, et al. Rapid expansion of lakes in the endorheic basin on the Qinghai-Tibet Plateau since 2000 and its potential drivers. Catena. 2021;197:104942.10.1016/j.catena.2020.104942Search in Google Scholar
© 2024 the author(s), published by De Gruyter
This work is licensed under the Creative Commons Attribution 4.0 International License.
Articles in the same Issue
- Regular Articles
- Theoretical magnetotelluric response of stratiform earth consisting of alternative homogeneous and transitional layers
- The research of common drought indexes for the application to the drought monitoring in the region of Jin Sha river
- Evolutionary game analysis of government, businesses, and consumers in high-standard farmland low-carbon construction
- On the use of low-frequency passive seismic as a direct hydrocarbon indicator: A case study at Banyubang oil field, Indonesia
- Water transportation planning in connection with extreme weather conditions; case study – Port of Novi Sad, Serbia
- Zircon U–Pb ages of the Paleozoic volcaniclastic strata in the Junggar Basin, NW China
- Monitoring of mangrove forests vegetation based on optical versus microwave data: A case study western coast of Saudi Arabia
- Microfacies analysis of marine shale: A case study of the shales of the Wufeng–Longmaxi formation in the western Chongqing, Sichuan Basin, China
- Multisource remote sensing image fusion processing in plateau seismic region feature information extraction and application analysis – An example of the Menyuan Ms6.9 earthquake on January 8, 2022
- Identification of magnetic mineralogy and paleo-flow direction of the Miocene-quaternary volcanic products in the north of Lake Van, Eastern Turkey
- Impact of fully rotating steel casing bored pile on adjacent tunnels
- Adolescents’ consumption intentions toward leisure tourism in high-risk leisure environments in riverine areas
- Petrogenesis of Jurassic granitic rocks in South China Block: Implications for events related to subduction of Paleo-Pacific plate
- Differences in urban daytime and night block vitality based on mobile phone signaling data: A case study of Kunming’s urban district
- Random forest and artificial neural network-based tsunami forests classification using data fusion of Sentinel-2 and Airbus Vision-1 satellites: A case study of Garhi Chandan, Pakistan
- Integrated geophysical approach for detection and size-geometry characterization of a multiscale karst system in carbonate units, semiarid Brazil
- Spatial and temporal changes in ecosystem services value and analysis of driving factors in the Yangtze River Delta Region
- Deep fault sliding rates for Ka-Ping block of Xinjiang based on repeating earthquakes
- Improved deep learning segmentation of outdoor point clouds with different sampling strategies and using intensities
- Platform margin belt structure and sedimentation characteristics of Changxing Formation reefs on both sides of the Kaijiang-Liangping trough, eastern Sichuan Basin, China
- Enhancing attapulgite and cement-modified loess for effective landfill lining: A study on seepage prevention and Cu/Pb ion adsorption
- Flood risk assessment, a case study in an arid environment of Southeast Morocco
- Lower limits of physical properties and classification evaluation criteria of the tight reservoir in the Ahe Formation in the Dibei Area of the Kuqa depression
- Evaluation of Viaducts’ contribution to road network accessibility in the Yunnan–Guizhou area based on the node deletion method
- Permian tectonic switch of the southern Central Asian Orogenic Belt: Constraints from magmatism in the southern Alxa region, NW China
- Element geochemical differences in lower Cambrian black shales with hydrothermal sedimentation in the Yangtze block, South China
- Three-dimensional finite-memory quasi-Newton inversion of the magnetotelluric based on unstructured grids
- Obliquity-paced summer monsoon from the Shilou red clay section on the eastern Chinese Loess Plateau
- Classification and logging identification of reservoir space near the upper Ordovician pinch-out line in Tahe Oilfield
- Ultra-deep channel sand body target recognition method based on improved deep learning under UAV cluster
- New formula to determine flyrock distance on sedimentary rocks with low strength
- Assessing the ecological security of tourism in Northeast China
- Effective reservoir identification and sweet spot prediction in Chang 8 Member tight oil reservoirs in Huanjiang area, Ordos Basin
- Detecting heterogeneity of spatial accessibility to sports facilities for adolescents at fine scale: A case study in Changsha, China
- Effects of freeze–thaw cycles on soil nutrients by soft rock and sand remodeling
- Vibration prediction with a method based on the absorption property of blast-induced seismic waves: A case study
- A new look at the geodynamic development of the Ediacaran–early Cambrian forearc basalts of the Tannuola-Khamsara Island Arc (Central Asia, Russia): Conclusions from geological, geochemical, and Nd-isotope data
- Spatio-temporal analysis of the driving factors of urban land use expansion in China: A study of the Yangtze River Delta region
- Selection of Euler deconvolution solutions using the enhanced horizontal gradient and stable vertical differentiation
- Phase change of the Ordovician hydrocarbon in the Tarim Basin: A case study from the Halahatang–Shunbei area
- Using interpretative structure model and analytical network process for optimum site selection of airport locations in Delta Egypt
- Geochemistry of magnetite from Fe-skarn deposits along the central Loei Fold Belt, Thailand
- Functional typology of settlements in the Srem region, Serbia
- Hunger Games Search for the elucidation of gravity anomalies with application to geothermal energy investigations and volcanic activity studies
- Addressing incomplete tile phenomena in image tiling: Introducing the grid six-intersection model
- Evaluation and control model for resilience of water resource building system based on fuzzy comprehensive evaluation method and its application
- MIF and AHP methods for delineation of groundwater potential zones using remote sensing and GIS techniques in Tirunelveli, Tenkasi District, India
- New database for the estimation of dynamic coefficient of friction of snow
- Measuring urban growth dynamics: A study in Hue city, Vietnam
- Comparative models of support-vector machine, multilayer perceptron, and decision tree predication approaches for landslide susceptibility analysis
- Experimental study on the influence of clay content on the shear strength of silty soil and mechanism analysis
- Geosite assessment as a contribution to the sustainable development of Babušnica, Serbia
- Using fuzzy analytical hierarchy process for road transportation services management based on remote sensing and GIS technology
- Accumulation mechanism of multi-type unconventional oil and gas reservoirs in Northern China: Taking Hari Sag of the Yin’e Basin as an example
- TOC prediction of source rocks based on the convolutional neural network and logging curves – A case study of Pinghu Formation in Xihu Sag
- A method for fast detection of wind farms from remote sensing images using deep learning and geospatial analysis
- Spatial distribution and driving factors of karst rocky desertification in Southwest China based on GIS and geodetector
- Physicochemical and mineralogical composition studies of clays from Share and Tshonga areas, Northern Bida Basin, Nigeria: Implications for Geophagia
- Geochemical sedimentary records of eutrophication and environmental change in Chaohu Lake, East China
- Research progress of freeze–thaw rock using bibliometric analysis
- Mixed irrigation affects the composition and diversity of the soil bacterial community
- Examining the swelling potential of cohesive soils with high plasticity according to their index properties using GIS
- Geological genesis and identification of high-porosity and low-permeability sandstones in the Cretaceous Bashkirchik Formation, northern Tarim Basin
- Usability of PPGIS tools exemplified by geodiscussion – a tool for public participation in shaping public space
- Efficient development technology of Upper Paleozoic Lower Shihezi tight sandstone gas reservoir in northeastern Ordos Basin
- Assessment of soil resources of agricultural landscapes in Turkestan region of the Republic of Kazakhstan based on agrochemical indexes
- Evaluating the impact of DEM interpolation algorithms on relief index for soil resource management
- Petrogenetic relationship between plutonic and subvolcanic rocks in the Jurassic Shuikoushan complex, South China
- A novel workflow for shale lithology identification – A case study in the Gulong Depression, Songliao Basin, China
- Characteristics and main controlling factors of dolomite reservoirs in Fei-3 Member of Feixianguan Formation of Lower Triassic, Puguang area
- Impact of high-speed railway network on county-level accessibility and economic linkage in Jiangxi Province, China: A spatio-temporal data analysis
- Estimation model of wild fractional vegetation cover based on RGB vegetation index and its application
- Lithofacies, petrography, and geochemistry of the Lamphun oceanic plate stratigraphy: As a record of the subduction history of Paleo-Tethys in Chiang Mai-Chiang Rai Suture Zone of Thailand
- Structural features and tectonic activity of the Weihe Fault, central China
- Application of the wavelet transform and Hilbert–Huang transform in stratigraphic sequence division of Jurassic Shaximiao Formation in Southwest Sichuan Basin
- Structural detachment influences the shale gas preservation in the Wufeng-Longmaxi Formation, Northern Guizhou Province
- Distribution law of Chang 7 Member tight oil in the western Ordos Basin based on geological, logging and numerical simulation techniques
- Evaluation of alteration in the geothermal province west of Cappadocia, Türkiye: Mineralogical, petrographical, geochemical, and remote sensing data
- Numerical modeling of site response at large strains with simplified nonlinear models: Application to Lotung seismic array
- Quantitative characterization of granite failure intensity under dynamic disturbance from energy standpoint
- Characteristics of debris flow dynamics and prediction of the hazardous area in Bangou Village, Yanqing District, Beijing, China
- Rockfall mapping and susceptibility evaluation based on UAV high-resolution imagery and support vector machine method
- Statistical comparison analysis of different real-time kinematic methods for the development of photogrammetric products: CORS-RTK, CORS-RTK + PPK, RTK-DRTK2, and RTK + DRTK2 + GCP
- Hydrogeological mapping of fracture networks using earth observation data to improve rainfall–runoff modeling in arid mountains, Saudi Arabia
- Petrography and geochemistry of pegmatite and leucogranite of Ntega-Marangara area, Burundi, in relation to rare metal mineralisation
- Prediction of formation fracture pressure based on reinforcement learning and XGBoost
- Hazard zonation for potential earthquake-induced landslide in the eastern East Kunlun fault zone
- Monitoring water infiltration in multiple layers of sandstone coal mining model with cracks using ERT
- Study of the patterns of ice lake variation and the factors influencing these changes in the western Nyingchi area
- Productive conservation at the landslide prone area under the threat of rapid land cover changes
- Sedimentary processes and patterns in deposits corresponding to freshwater lake-facies of hyperpycnal flow – An experimental study based on flume depositional simulations
- Study on time-dependent injectability evaluation of mudstone considering the self-healing effect
- Detection of objects with diverse geometric shapes in GPR images using deep-learning methods
- Behavior of trace metals in sedimentary cores from marine and lacustrine environments in Algeria
- Spatiotemporal variation pattern and spatial coupling relationship between NDVI and LST in Mu Us Sandy Land
- Formation mechanism and oil-bearing properties of gravity flow sand body of Chang 63 sub-member of Yanchang Formation in Huaqing area, Ordos Basin
- Diagenesis of marine-continental transitional shale from the Upper Permian Longtan Formation in southern Sichuan Basin, China
- Vertical high-velocity structures and seismic activity in western Shandong Rise, China: Case study inspired by double-difference seismic tomography
- Spatial coupling relationship between metamorphic core complex and gold deposits: Constraints from geophysical electromagnetics
- Disparities in the geospatial allocation of public facilities from the perspective of living circles
- Research on spatial correlation structure of war heritage based on field theory. A case study of Jinzhai County, China
- Formation mechanisms of Qiaoba-Zhongdu Danxia landforms in southwestern Sichuan Province, China
- Magnetic data interpretation: Implication for structure and hydrocarbon potentiality at Delta Wadi Diit, Southeastern Egypt
- Deeply buried clastic rock diagenesis evolution mechanism of Dongdaohaizi sag in the center of Junggar fault basin, Northwest China
- Application of LS-RAPID to simulate the motion of two contrasting landslides triggered by earthquakes
- The new insight of tectonic setting in Sunda–Banda transition zone using tomography seismic. Case study: 7.1 M deep earthquake 29 August 2023
- The critical role of c and φ in ensuring stability: A study on rockfill dams
- Evidence of late quaternary activity of the Weining-Shuicheng Fault in Guizhou, China
- Extreme hydroclimatic events and response of vegetation in the eastern QTP since 10 ka
- Spatial–temporal effect of sea–land gradient on landscape pattern and ecological risk in the coastal zone: A case study of Dalian City
- Study on the influence mechanism of land use on carbon storage under multiple scenarios: A case study of Wenzhou
- A new method for identifying reservoir fluid properties based on well logging data: A case study from PL block of Bohai Bay Basin, North China
- Comparison between thermal models across the Middle Magdalena Valley, Eastern Cordillera, and Eastern Llanos basins in Colombia
- Mineralogical and elemental analysis of Kazakh coals from three mines: Preliminary insights from mode of occurrence to environmental impacts
- Chlorite-induced porosity evolution in multi-source tight sandstone reservoirs: A case study of the Shaximiao Formation in western Sichuan Basin
- Predicting stability factors for rotational failures in earth slopes and embankments using artificial intelligence techniques
- Origin of Late Cretaceous A-type granitoids in South China: Response to the rollback and retreat of the Paleo-Pacific plate
- Modification of dolomitization on reservoir spaces in reef–shoal complex: A case study of Permian Changxing Formation, Sichuan Basin, SW China
- Geological characteristics of the Daduhe gold belt, western Sichuan, China: Implications for exploration
- Rock physics model for deep coal-bed methane reservoir based on equivalent medium theory: A case study of Carboniferous-Permian in Eastern Ordos Basin
- Enhancing the total-field magnetic anomaly using the normalized source strength
- Shear wave velocity profiling of Riyadh City, Saudi Arabia, utilizing the multi-channel analysis of surface waves method
- Effect of coal facies on pore structure heterogeneity of coal measures: Quantitative characterization and comparative study
- Inversion method of organic matter content of different types of soils in black soil area based on hyperspectral indices
- Detection of seepage zones in artificial levees: A case study at the Körös River, Hungary
- Tight sandstone fluid detection technology based on multi-wave seismic data
- Characteristics and control techniques of soft rock tunnel lining cracks in high geo-stress environments: Case study of Wushaoling tunnel group
- Influence of pore structure characteristics on the Permian Shan-1 reservoir in Longdong, Southwest Ordos Basin, China
- Study on sedimentary model of Shanxi Formation – Lower Shihezi Formation in Da 17 well area of Daniudi gas field, Ordos Basin
- Multi-scenario territorial spatial simulation and dynamic changes: A case study of Jilin Province in China from 1985 to 2030
- Review Articles
- Major ascidian species with negative impacts on bivalve aquaculture: Current knowledge and future research aims
- Prediction and assessment of meteorological drought in southwest China using long short-term memory model
- Communication
- Essential questions in earth and geosciences according to large language models
- Erratum
- Erratum to “Random forest and artificial neural network-based tsunami forests classification using data fusion of Sentinel-2 and Airbus Vision-1 satellites: A case study of Garhi Chandan, Pakistan”
- Special Issue: Natural Resources and Environmental Risks: Towards a Sustainable Future - Part I
- Spatial-temporal and trend analysis of traffic accidents in AP Vojvodina (North Serbia)
- Exploring environmental awareness, knowledge, and safety: A comparative study among students in Montenegro and North Macedonia
- Determinants influencing tourists’ willingness to visit Türkiye – Impact of earthquake hazards on Serbian visitors’ preferences
- Application of remote sensing in monitoring land degradation: A case study of Stanari municipality (Bosnia and Herzegovina)
- Optimizing agricultural land use: A GIS-based assessment of suitability in the Sana River Basin, Bosnia and Herzegovina
- Assessing risk-prone areas in the Kratovska Reka catchment (North Macedonia) by integrating advanced geospatial analytics and flash flood potential index
- Analysis of the intensity of erosive processes and state of vegetation cover in the zone of influence of the Kolubara Mining Basin
- GIS-based spatial modeling of landslide susceptibility using BWM-LSI: A case study – city of Smederevo (Serbia)
- Geospatial modeling of wildfire susceptibility on a national scale in Montenegro: A comparative evaluation of F-AHP and FR methodologies
- Geosite assessment as the first step for the development of canyoning activities in North Montenegro
- Urban geoheritage and degradation risk assessment of the Sokograd fortress (Sokobanja, Eastern Serbia)
- Multi-hazard modeling of erosion and landslide susceptibility at the national scale in the example of North Macedonia
- Understanding seismic hazard resilience in Montenegro: A qualitative analysis of community preparedness and response capabilities
- Forest soil CO2 emission in Quercus robur level II monitoring site
- Characterization of glomalin proteins in soil: A potential indicator of erosion intensity
- Power of Terroir: Case study of Grašac at the Fruška Gora wine region (North Serbia)
- Special Issue: Geospatial and Environmental Dynamics - Part I
- Qualitative insights into cultural heritage protection in Serbia: Addressing legal and institutional gaps for disaster risk resilience