Petrogenetic relationship between plutonic and subvolcanic rocks in the Jurassic Shuikoushan complex, South China
-
Dan Wang
 ,
Lie-Meng Chen
,
Qian Hu
,
Lie-Meng Chen
,
Qian Hu

Abstract
There has been a longstanding debate on whether plutonic and subvolcanic rocks have a petrogenetic connection, and the Jurassic Shuikoushan caldera complex in South China serves as an ideal case study for unraveling this geological puzzle. SIMS U–Pb dating of zircon indicates the formation age of plutonic (granodiorite) and subvolcanic rocks (dacite porphyry and rhyolite porphyry) from the Shuikoushan caldera complex at ca.159 Ma. In terms of geochemical composition, granodiorite and dacite porphyry exhibit higher levels of MgO (1.98–3.63%), MnO (0.07–0.11%), FeOt (5.12–6.15%), Sr (342–547 ppm), and Ba (754–1200 ppm) compared to the rhyolite porphyry. Conversely, they show lower concentrations of Rb (2.04–27.1 ppm), as well as lower ratios of Rb/Sr (0.004–0.055) and Rb/Ba (0.004–0.023). The distinct but complementary geochemical characteristics between these rock types are evident in the Shuikoushan caldera complex. Overall, zircon grains from all three rock types exhibit similar negative ε Hf(t) values (–8.1 to –12.4) with high δ 18O values (8.3–9.7‰), suggesting a common source region. Based on lithological and geochemical evidence, it is proposed that the rhyolite porphyry represents extracted melt from the mush reservoir. In contrast, the granodiorite and dacite porphyry are residual melts enriched in cumulates. This interpretation supports the idea that crystal–melt segregation processes were crucial in connecting the late Jurassic subvolcanic and plutonic rocks within the Shuikoushan complex.
1 Introduction
In recent decades, establishing a comprehensive framework connecting plutonic and volcanic rocks has been pivotal for comprehending deeper magmatic processes [1,2]. Nevertheless, substantial questions remain regarding the spatiotemporal and evolutionary relationships in which they undergo or co-evolve. Lately, studies using geochemistry and isotopes, analyzing zircon grains and whole-rock samples, have offered crucial insights into the intricate processes of storage, evolution, recharge, and crystal–melt segregation within magmatic systems [2–5]. The widely accepted notion posits that silicic plutons represent residual melt after volcanic eruptions. This framework needs a complementary cumulate residue in the shallow crust, suggesting a direct link between volcanic and plutonic phases in that geological layer [3,6,7]. However, identifying cumulates in silicic rocks proves challenging due to the cryptic nature of accumulation across geochemical criteria, mineral chemical, microstructural, and outcrop scales [8,9].
To investigate the connection between plutonic and volcanic phases, the coexisted intrusive and volcanic phases within the same igneous complex are essentially important. The Shuikoushan caldera complex in South China consists mainly of granodiorites, associated with well-exposed subvolcanic facies igneous rocks, including the dacite porphyry and rhyolite porphyry, and they thus offer an opportunity to explore the petrogenetic relationship between volcanic and plutonic rocks. In this article, we provide new insights into the above questions through U–Pb ages and Hf–O isotopes of zircon, and bulk rock major-trace element data.
2 Regional geology and sample description
Bounded by the Songpan-Ganzi Terrane to the west, the Dabie-Qinling orogenic belt to the north, and the Indochina Craton to the south, the South China Craton is geographically delineated (Figure 1a). This Craton is composed of the Yangtze and Cathaysia Blocks, which were welted together during the Neoproterozoic time [12]. Voluminous silicic magmatism occurred during the Early Jurassic – Late Cretaceous period in South China. This magmatic activity spans an extensive area, exceeding 90,790 km2 for volcanic rocks and approximately 135,000 km2 granitoids, extending from coastal southeast China through the Wuyi region into the Nanling Range [13]. The majority of the silicic volcanics are temporally and spatially associated with granitoids.
![Figure 1
The South China Craton is composed of Yangtze Block and Cathaysia Block, and the Shuikoushan plutonic-subvolcanic complex is located near the suture zone between the Yangtze Block and Cathaysia Block (a). The Shuikoushan regional geological map showing Shuikoushan caldera complex consists of an unusual coexisting assemblage of plutonic (granodiorite) and subvolcanic rocks (dacite porphyry and rhyolite porphyry) (b). (a) was modified after Mao et al. [10] and (b) was modified after Yang et al. [11].](/document/doi/10.1515/geo-2022-0634/asset/graphic/j_geo-2022-0634_fig_001.jpg)
The South China Craton is composed of Yangtze Block and Cathaysia Block, and the Shuikoushan plutonic-subvolcanic complex is located near the suture zone between the Yangtze Block and Cathaysia Block (a). The Shuikoushan regional geological map showing Shuikoushan caldera complex consists of an unusual coexisting assemblage of plutonic (granodiorite) and subvolcanic rocks (dacite porphyry and rhyolite porphyry) (b). (a) was modified after Mao et al. [10] and (b) was modified after Yang et al. [11].
The Shuikoushan igneous complex is situated at the junction of the Yangtze Block and the Cathaysia Blocks (Figure 1a). The subvolcanic facies of dacite porphyry and rhyolite porphyry, as well as intermediate-acid intrusive body consisting predominantly of granodiorite, have simultaneously exposed in this complex due to continental uplift and erosion. The globally renowned Shuikoushan Zn–Pb–Cu–Au deposit and Kangjiawan Zn–Pb–Ag deposit are believed to be linked to these granodiorites [11,14,15].
The primary exposure of rhyolite porphyry is in the Xinmengshan region, situated to the northwest of the Shuikoushan district (Figure 1b). K-feldspar phenocrysts, varying in size from 5 to 15 mm, coexist with quartz and plagioclase phenocrysts (Figure 2). Accessory minerals in the assemblage contain oxides, zircon, apatite, and titanite. The mean groundmass content reaches up to 80%, and weak Pb–Zn–Ag mineralization has been locally observed in the rhyolites.
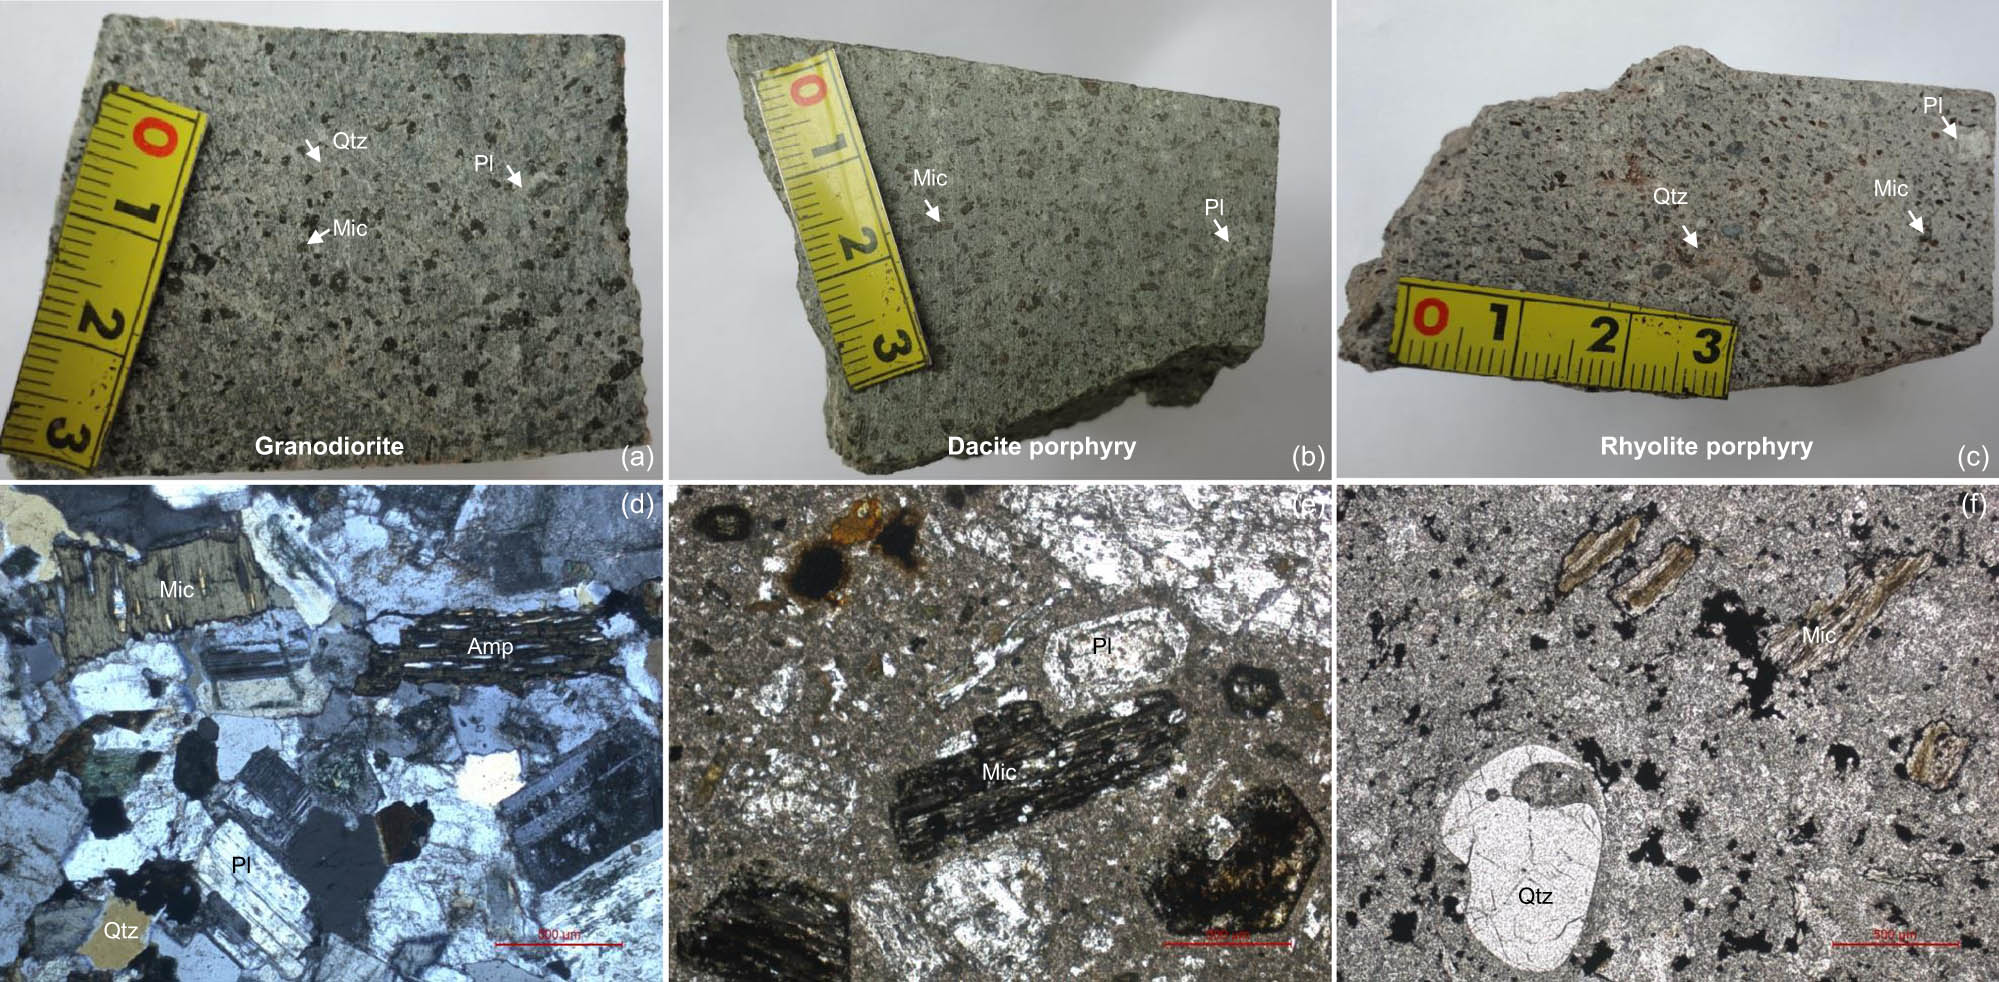
The hand specimens (a–c) and petrographic features (d–f) for both plutonic and subvolcanic rocks. Abbreviations: Mic, mica; Qtz, quartz; Amp, amphibole; Pl, plagioclase.
Granodiorite and its eruptive counterpart, dacite porphyry, are distributed in the Laoyachao and Laomengshan regions, respectively (Figure 1b). Both rock types share similar mineral assemblages, with ubiquitous phenocrysts including plagioclase, biotite, quartz, hornblende, and magnetite, accompanied by accessory minerals like zircon, oxides, apatite, and titanite (Figure 2). The groundmass exhibits textural variability, ranging from granophyric and microcrystalline in granodiorite to glassy in dacite porphyry.
We also collected granodioritic samples from the Laoyachao mining adits in the Shuikoushan district. These samples were taken at locations distanced from ore veins. Rhyolite porphyry and dacite porphyry samples were sourced from Xinmengshan and Laomengshan, respectively. All samples are relatively fresh, and their specific locations are depicted in Figure 1b.
3 Analytical procedures
3.1 Zircon SIMS O isotopes and U–Pb dating
Zircon crystals were obtained from crushed rock samples (1.5 kg) by magnetic and heavy liquid separation techniques at the Bureau of Geology and Mineral Resources (BGMR) in Hebei Province, China. Subsequently, zircon crystals were meticulously chosen under a binocular microscope and embedded within epoxy discs. The epoxy discs were polished to expose the smooth zircon grains. Each zircon grain was meticulously documented using both transmitted and reflected light images, alongside cathodoluminescence (CL) images, to reveal their structures. The specimen mount underwent a vacuum-coating process with a high-purity gold film before SIMS analyses.
Oxygen isotope analysis and U–Pb dating of zircon were conducted on an SIMS (Cameca IMS 1280) at the Institute of Geology and Geophysics (IGG), Chinese Academy of Sciences (Beijing). The methods for analyzing zircon oxygen isotopes remain consistent with the methodology outlined by Li et al. [16]. The Cs+ primary ion beam intensity was adjusted to approximately 2 nA and accelerated at 10 kV. The analytical point had a diameter of about 20 μm. Oxygen isotopes were measured utilizing a multi-collection mode. The measurements were conducted over 20 cycles, each lasting 3 s, achieving in-house precision surpassing 0.2‰ (1σ). Calibration of instrumental mass fractionation utilized the in-house standard (zircon of Penglai) [16]. To evaluate external uncertainties in oxygen isotope measurements, the zircon standard (Qinghu), treated as an unknown, was alternately examined and analyzed alongside the zircon sample. The Qinghu zircon standard yielded a weighted mean δ 18O values of 5.39 ± 0.13‰ for six analyses, in line with the recorded value of δ 18O = 5.4 ± 0.2‰ (2SD) [17].
Following the oxygen isotope analysis, the mounted zircon crystals underwent re-polishing for U–Pb dating. These measurements were conducted in close proximity to the O isotope analysis spot using the same instrument at IGG. The detailed analytical processes closely followed those described by Li et al. [18]. The size of analytical ellipsoidal pits was around 30 μm × 20 μm. Each measurement was comprised 7 cycles with an overall analytical duration of ca. 14 s. Calibration for Pb/U utilized zircon standard (91500) with a Th content of 29 ppm and a U content of 81 ppm [19]. Zircon U–Pb isotope ratios were calculated against the analyzed ratios of the zircon standard (Plésovice) [20]. The long-term uncertainty for 206Pb/238U measurements of the zircon standard applied to the unknown samples was 1.5% (1SD). The measured composition was adjusted for common Pb using non-radiogenic 204Pb. The Isoplot/Ex software was used for data reduction [21]. To evaluate external uncertainties in U–Pb analyses calibrated against the standard (Plésovice), the standard (Qinghu) was alternately measured alongside the unknown zircons. A total of five analyses on Qinghu generated a U–Pb Concordia age of 161.0 ± 1.2 Ma (2SD), in harmony with the recommended value of 159.2 ± 0.2 Ma within the uncertainties [17].
3.2 LA-MC-ICPMS Lu–Hf isotope analyses
Zircon Hf isotope analysis was accomplished at the State Key Laboratory of Geological Processes and Mineral Resources (SKLGRMR), China University of Geosciences (Wuhan), China. The analytical system comprises a laser ablation system (Geolas-2005 excimer Arf) and a Neptune multi-collector ICPMS (LA-MC-ICPMS). Lu–Hf isotope measurements were conducted on the same domains of zircon crystals previously analyzed for U–Pb–O isotopes. A 44-μm diameter ablated pit is used for this study. Each analysis consists of a 3-s background signal collection and a 50-s signal capture. The related procedures closely adhere to those reported by [22]. ICPMSDateCal was used for Offline selection and integration of the signal, as well as mass bias calibrations [23]. Assuming identical fractionation, the value 176Lu/175Lu = 0.02656 was used for interference corrections of 176Lu on 176Hf [24]. The interference of 176Yb on 176Hf was rectified by applying the mass bias acquired online, assuming 176Yb/173Yb = 0.79639 [25]. Zircon (91500) was employed as the external standard. Zircon TEM and GJ-1 were used as unknowns alongside analyzing samples to check external uncertainties of Lu–Hf analyses calibrated against 91500 standards. The external standard zircon 91500 was used for calibration. Zircon TEM and GJ-1 were analyzed alongside the samples as unknowns to monitor external uncertainties in Lu–Hf analysis calibrated against the standard (91500).
3.3 Major-trace elements of whole-rock
The fresh rocks were chosen for analyses of major and trace elements after petrographic examination. The analysis of major element oxides was performed on fused glass beads using a RANalytical Axios-advance (Axios PW4400) X-ray fluorescence spectrometer at the State Key Laboratory of Ore Deposit Geochemistry, Institute of Geochemistry, Chinese Academy of Sciences (IGCAS). Analytical precision, assessed using the National standards GSR-1 and GSR-3, reveals analytical errors within the range of 1–5%. The determination of loss on ignition involved heating powder (1 g) at 1,100°C for 1 h.
The inductively coupled plasma mass spectrometer (Perkin-Elmer Sciex ELAN 6000) was used for trace elements at IGCAS. Related procedures closely follow those delineated by Qi et al. [26]. The powdered sample (ca. 50 mg) was dissolved in a mixture (HNO3 + HF) using a high-pressure Teflon bomb for 48 h at approximately 190°C. Signal drift during counting was monitored by an internal Rh standard solution. The standard of GBPG-1 was employed for measurement quality control. The experimental errors for all elements were within 5%.
4 Results
4.1 Zircon U–Pb dating
Zircon crystals from the dacite porphyry (samples LMS-01) and rhyolite porphyry (samples XMS-01) exhibit identical morphology and internal structures. The majority of zircon crystals exhibit colorless, transparent, and euhedral characteristics, ranging from 50 to 200 μm in length, with varied aspect ratios (2:1 to 4:1). Concentric zoning is prevalent in most grains under CL images. Occasionally, some grains contain mineral inclusions and inherited cores (Figure 4a).
Twenty-two analyses were conducted from dacite porphyry sample LMS-01 (Table 1). These grains exhibit variable U (153–1340 ppm) and Th (13–364 ppm), with high Th/U (0.08–0.33) and relatively low common Pb (f 206 < 0.5%). A concordant age of 159.5 ± 1.4 Ma (2σ, MSWD = 0.97) was obtained, consistent with the weighted mean 206Pb/238U age of 159.5 ± 1.6 Ma (n = 22, MSWD = 0.97) (Figure 3a).
SIMS zircon U–Pb dating of the dacite porphyry and rhyolite porphyry
| Sample/ | [U] | [Th] | Th/U | 207Pb | ±σ | 206Pb | ±σ | 207Pb | ±σ | t 207/206 | ±σ | t 207/235 | ±σ | t 206/238 | ±σ |
|---|---|---|---|---|---|---|---|---|---|---|---|---|---|---|---|
| spot # | ppm | ppm | ratio | 235U | % | 238U | % | 206Pb | % | Ma | Ma | Ma | |||
| Dacite porphyry | |||||||||||||||
| LMS-1@1 | 767 | 302 | 0.394 | 0.17645 | 2.39 | 0.0262 | 1.79 | 0.04892 | 1.58 | 144.0 | 36.7 | 165.0 | 3.7 | 166.5 | 2.9 |
| LMS-1@2 | 372 | 13 | 0.034 | 0.16679 | 2.67 | 0.0254 | 2.06 | 0.04765 | 1.69 | 81.8 | 39.7 | 156.6 | 3.9 | 161.6 | 3.3 |
| LMS-1@3 | 991 | 120 | 0.121 | 0.16754 | 2.06 | 0.0252 | 1.51 | 0.04816 | 1.41 | 107.0 | 33.0 | 157.3 | 3.0 | 160.6 | 2.4 |
| LMS-1@4 | 153 | 108 | 0.704 | 0.17551 | 3.10 | 0.0260 | 1.71 | 0.04896 | 2.58 | 145.7 | 59.5 | 164.2 | 4.7 | 165.5 | 2.8 |
| LMS-1@5 | 1225 | 248 | 0.202 | 0.16518 | 1.78 | 0.0248 | 1.51 | 0.04834 | 0.94 | 116.0 | 22.1 | 155.2 | 2.6 | 157.8 | 2.4 |
| LMS-1@6 | 693 | 223 | 0.322 | 0.15908 | 2.03 | 0.0239 | 1.52 | 0.04822 | 1.36 | 110.0 | 31.7 | 149.9 | 2.8 | 152.4 | 2.3 |
| LMS-1@7 | 884 | 141 | 0.159 | 0.17364 | 1.86 | 0.0256 | 1.51 | 0.04912 | 1.09 | 153.6 | 25.3 | 162.6 | 2.8 | 163.2 | 2.4 |
| LMS-1@8 | 986 | 335 | 0.340 | 0.16535 | 2.31 | 0.0246 | 1.50 | 0.04876 | 1.75 | 136.2 | 40.7 | 155.4 | 3.3 | 156.6 | 2.3 |
| LMS-1@10 | 560 | 89 | 0.159 | 0.18016 | 2.53 | 0.0260 | 1.55 | 0.05033 | 2.00 | 210.2 | 45.8 | 168.2 | 3.9 | 165.2 | 2.5 |
| LMS-1@12 | 371 | 33 | 0.090 | 0.16362 | 3.36 | 0.0249 | 1.64 | 0.04775 | 2.93 | 86.7 | 68.1 | 153.9 | 4.8 | 158.3 | 2.6 |
| LMS-1@13 | 534 | 72 | 0.134 | 0.16818 | 2.35 | 0.0250 | 1.52 | 0.04882 | 1.79 | 139.4 | 41.4 | 157.8 | 3.4 | 159.1 | 2.4 |
| LMS-1@14 | 829 | 128 | 0.154 | 0.16975 | 1.99 | 0.0254 | 1.55 | 0.04851 | 1.25 | 124.1 | 29.1 | 159.2 | 2.9 | 161.6 | 2.5 |
| LMS-1@15 | 451 | 303 | 0.672 | 0.16464 | 2.21 | 0.0247 | 1.50 | 0.04844 | 1.62 | 120.6 | 37.8 | 154.8 | 3.2 | 157.0 | 2.3 |
| LMS-1@16 | 957 | 215 | 0.225 | 0.15945 | 2.34 | 0.0237 | 1.55 | 0.04874 | 1.75 | 135.5 | 40.7 | 150.2 | 3.3 | 151.2 | 2.3 |
| LMS-1@19 | 921 | 102 | 0.111 | 0.17310 | 1.98 | 0.0252 | 1.53 | 0.04979 | 1.26 | 185.4 | 29.2 | 162.1 | 3.0 | 160.5 | 2.4 |
| LMS-1@21 | 493 | 47 | 0.096 | 0.16741 | 2.34 | 0.0251 | 1.50 | 0.04831 | 1.79 | 114.4 | 41.8 | 157.2 | 3.4 | 160.0 | 2.4 |
| LMS-1@22 | 778 | 364 | 0.468 | 0.17028 | 2.08 | 0.0249 | 1.53 | 0.04962 | 1.41 | 177.4 | 32.6 | 159.7 | 3.1 | 158.5 | 2.4 |
| LMS-1@23 | 1340 | 350 | 0.261 | 0.17331 | 1.86 | 0.0257 | 1.50 | 0.04886 | 1.10 | 141.3 | 25.6 | 162.3 | 2.8 | 163.7 | 2.4 |
| LMS-1@24 | 549 | 289 | 0.527 | 0.17309 | 2.30 | 0.0255 | 1.52 | 0.04923 | 1.72 | 159.0 | 39.7 | 162.1 | 3.4 | 162.3 | 2.4 |
| LMS-1@25 | 1007 | 240 | 0.238 | 0.16912 | 2.00 | 0.0251 | 1.52 | 0.04883 | 1.29 | 139.5 | 30.1 | 158.7 | 2.9 | 159.9 | 2.4 |
| LMS-1@26 | 479 | 111 | 0.232 | 0.17209 | 2.39 | 0.0254 | 1.51 | 0.04917 | 1.85 | 155.9 | 42.7 | 161.2 | 3.6 | 161.6 | 2.4 |
| LMS-1@27 | 243 | 166 | 0.681 | 0.17549 | 2.99 | 0.0248 | 1.55 | 0.05137 | 2.56 | 257.4 | 57.8 | 164.2 | 4.5 | 157.8 | 2.4 |
| Rhyolite porphyry | |||||||||||||||
| XMS-1@1 | 274 | 416 | 1.517 | 0.16556 | 2.93 | 0.0249 | 1.60 | 0.04832 | 2.45 | 114.8 | 56.9 | 155.6 | 4.2 | 158.2 | 2.5 |
| XMS-1@2 | 349 | 134 | 0.385 | 0.16771 | 2.67 | 0.0249 | 1.55 | 0.04878 | 2.18 | 137.1 | 50.4 | 157.4 | 3.9 | 158.8 | 2.4 |
| XMS-1@5 | 1584 | 419 | 0.264 | 0.16738 | 2.94 | 0.0250 | 2.68 | 0.04847 | 1.21 | 122.3 | 28.3 | 157.1 | 4.3 | 159.5 | 4.2 |
| XMS-1@6 | 816 | 159 | 0.195 | 0.16510 | 3.92 | 0.0251 | 1.57 | 0.04764 | 3.59 | 81.5 | 83.1 | 155.2 | 5.7 | 160.0 | 2.5 |
| XMS-1@7 | 392 | 459 | 1.170 | 0.17178 | 2.96 | 0.0252 | 1.53 | 0.04949 | 2.54 | 171.2 | 58.2 | 161.0 | 4.4 | 160.3 | 2.4 |
| XMS-1@8 | 1545 | 221 | 0.143 | 0.16888 | 2.08 | 0.0252 | 1.52 | 0.04869 | 1.43 | 132.8 | 33.3 | 158.5 | 3.1 | 160.2 | 2.4 |
| XMS-1@9 | 342 | 332 | 0.971 | 0.16378 | 3.08 | 0.0245 | 1.51 | 0.04850 | 2.69 | 123.9 | 62.1 | 154.0 | 4.4 | 156.0 | 2.3 |
| XMS-1@10 | 822 | 421 | 0.513 | 0.16696 | 2.28 | 0.0249 | 1.56 | 0.04861 | 1.66 | 129.1 | 38.7 | 156.8 | 3.3 | 158.6 | 2.4 |
| XMS-1@12 | 641 | 176 | 0.274 | 0.17507 | 3.28 | 0.0247 | 1.57 | 0.05141 | 2.89 | 259.3 | 65.0 | 163.8 | 5.0 | 157.3 | 2.4 |
| XMS-1@13 | 1327 | 345 | 0.260 | 0.16838 | 2.10 | 0.0248 | 1.51 | 0.04918 | 1.47 | 156.6 | 34.0 | 158.0 | 3.1 | 158.1 | 2.4 |
| XMS-1@14 | 792 | 191 | 0.241 | 0.16813 | 2.45 | 0.0246 | 1.55 | 0.04959 | 1.90 | 175.9 | 43.7 | 157.8 | 3.6 | 156.6 | 2.4 |
| XMS-1@15 | 261 | 215 | 0.825 | 0.16365 | 2.87 | 0.0249 | 1.58 | 0.04761 | 2.39 | 80.1 | 55.8 | 153.9 | 4.1 | 158.7 | 2.5 |
| XMS-1@16 | 988 | 146 | 0.147 | 0.17581 | 2.04 | 0.0259 | 1.55 | 0.04917 | 1.32 | 156.0 | 30.6 | 164.4 | 3.1 | 165.0 | 2.5 |
| XMS-1@21 | 362 | 420 | 1.158 | 0.16941 | 2.90 | 0.0256 | 1.51 | 0.04804 | 2.48 | 101.4 | 57.6 | 158.9 | 4.3 | 162.8 | 2.4 |
| XMS-1@22 | 149 | 124 | 0.833 | 0.18818 | 4.07 | 0.0253 | 1.50 | 0.05399 | 3.78 | 370.7 | 83.0 | 175.1 | 6.6 | 160.9 | 2.4 |
| XMS-1@23 | 484 | 199 | 0.412 | 0.17514 | 2.34 | 0.0255 | 1.51 | 0.04986 | 1.79 | 188.7 | 41.2 | 163.9 | 3.6 | 162.2 | 2.4 |
| XMS-1@24 | 194 | 287 | 1.479 | 0.16879 | 3.63 | 0.0249 | 1.55 | 0.04918 | 3.29 | 156.5 | 75.2 | 158.4 | 5.3 | 158.5 | 2.4 |
| XMS-1@25 | 963 | 396 | 0.412 | 0.17505 | 2.71 | 0.0254 | 1.55 | 0.04996 | 2.22 | 193.1 | 50.9 | 163.8 | 4.1 | 161.8 | 2.5 |
| XMS-1@26 | 1093 | 229 | 0.209 | 0.17073 | 2.19 | 0.0249 | 1.51 | 0.04967 | 1.58 | 179.8 | 36.3 | 160.0 | 3.2 | 158.7 | 2.4 |

Zircon U–Pb Concordia diagrams for dacite porphyry (a) and rhyolite porphyry (b).
Nineteen analyses from rhyolite sample XMS-01 were acquired (Table 1). They exhibit high U (149–1584 ppm) and Th (124–419 ppm) contents with varying Th/U ratios (0.14–1.52). f 206 values are also less than 0.5%. All the examinations are concordant with analytical uncertainties. A Concordia age of 159.5 ± 1.1 Ma (2σ, MSWD of concordance = 0.77) is yielded, consistent within uncertainties with the weighted mean 206Pb/238U age of 159.5 ± 1.8 Ma (n = 19, MSWD = 0.32) (Figure 3b).
The crystallized age of the granodiorite has been dated to 158.3 ± 1.2 Ma and 158.8 ± 1.1 Ma by SIMS U–Pb dating of zircon [11,14], similar to those ages of dacite porphyry and rhyolite in this study (Figure 4a–c).
![Figure 4
SIMS zircon 206Pb/238U age (a–c), plots of zircon ε
Hf(t) values (d–f), and plots of zircon δ
18O values (g–i) for both plutonic and subvolcanic rocks in the Shuikoushan complex. Data source for granodiorite from Yang et al. [11]. The plutonic and subvolcanic rocks were almost synchronously emplaced in the late Jurassic and have similar zircon ε
Hf(t) and δ
18O values.](/document/doi/10.1515/geo-2022-0634/asset/graphic/j_geo-2022-0634_fig_004.jpg)
SIMS zircon 206Pb/238U age (a–c), plots of zircon ε Hf(t) values (d–f), and plots of zircon δ 18O values (g–i) for both plutonic and subvolcanic rocks in the Shuikoushan complex. Data source for granodiorite from Yang et al. [11]. The plutonic and subvolcanic rocks were almost synchronously emplaced in the late Jurassic and have similar zircon ε Hf(t) and δ 18O values.
4.2 Major-trace elements of whole rock
The granodioritic have large variable SiO2 (58–65 wt%) as reported by Yang et al. [11]. The dacite porphyry samples in this research have similar compositions but exhibit relatively narrow ranges of SiO2 (60.9–62.3 wt%), FeOt (5.1–5.5 wt%), and MgO (2.0–2.4 wt%) (Table 2). There is a compositional gap between the rhyolite porphyry and granodiorite-dacite porphyry (∼5 wt% interval for SiO2); some samples within the gap exhibit textural and compositional evidence of mixing. From the granodiorite-dacite porphyry to rhyolite, SiO2 increase, Na2O, MnO, TiO2, and P2O5 gradually decrease, whereas MgO, CaO, and K2O decrease drastically, but Al2O3 and FeOt remain nearly constant (Figure 5).
Major and trace elements of the dacite porphyry and rhyolite porphyry from the Shuikoushan complex Yu and Liu [27]
| Sample | LMS-1 | LMS-2 | LMS-3 | LMS-4 | LMS-5 | LMS-6 | LMS-7 | XMS-1 | XMS-2 | XMS-3 | XMS-4 | XMS-5 | XMS-6 | XMS-7 | ||||||
|---|---|---|---|---|---|---|---|---|---|---|---|---|---|---|---|---|---|---|---|---|
| Yu and Liu [27] | Yu and Liu [27] | |||||||||||||||||||
| Major element (wt%) | ||||||||||||||||||||
| SiO2 | 61.4 | 61.4 | 62.0 | 60.9 | 62.1 | 62.2 | 62.3 | 62.7 | 61.0 | 60.9 | 70.4 | 67.0 | 66.7 | 69.0 | 69.8 | 66.9 | 69.7 | 72.2 | 70.9 | 68.8 |
| Al2O3 | 15.1 | 15.0 | 15.2 | 15.0 | 14.9 | 15.1 | 15.4 | 16.8 | 15.0 | 15.1 | 15.6 | 16.4 | 17.3 | 16.1 | 15.0 | 16.2 | 16.2 | 16.8 | 17.2 | 17.0 |
| Fe2O3 tot | 5.28 | 5.21 | 5.50 | 5.30 | 5.12 | 5.14 | 5.43 | 6.65 | 6.41 | 6.00 | 5.93 | 7.23 | 6.60 | 7.06 | 6.31 | 7.34 | 5.96 | 4.14 | 5.23 | 6.47 |
| MgO | 2.29 | 2.09 | 2.35 | 2.14 | 1.98 | 2.07 | 2.38 | 1.70 | 3.63 | 2.23 | 0.236 | 0.355 | 0.456 | 0.106 | 0.136 | 0.140 | 0.120 | 0.060 | 0.060 | 0.050 |
| CaO | 2.75 | 2.11 | 2.19 | 2.36 | 2.44 | 3.16 | 2.85 | 2.20 | 2.34 | 3.23 | 0.216 | 0.081 | 0.080 | 0.073 | 0.351 | 0.073 | 0.069 | 0.050 | 0.030 | 0.060 |
| Na2O | 4.68 | 4.92 | 4.39 | 4.80 | 4.31 | 4.17 | 4.03 | 2.67 | 3.37 | 3.95 | 0.848 | 0.571 | 0.786 | 0.891 | 0.801 | 0.547 | 1.014 | 0.020 | 0.030 | 0.040 |
| K2O | 4.63 | 4.54 | 4.52 | 4.65 | 4.65 | 4.64 | 4.49 | 3.74 | 4.69 | 4.29 | 0.205 | 0.269 | 0.359 | 0.041 | 0.075 | 0.111 | 0.094 | 0.010 | 0.040 | 0.010 |
| MnO | 0.109 | 0.09 | 0.085 | 0.089 | 0.073 | 0.1 | 0.093 | 0.07 | 0.1 | 0.09 | 0.010 | 0.019 | 0.037 | 0.008 | 0.032 | 0.019 | 0.017 | 0.080 | 0.010 | 0.010 |
| TiO2 | 0.625 | 0.634 | 0.638 | 0.629 | 0.627 | 0.623 | 0.644 | 0.590 | 0.680 | 0.550 | 0.683 | 0.716 | 0.749 | 0.691 | 0.658 | 0.710 | 0.714 | 0.460 | 0.420 | 0.400 |
| P2O5 | 0.301 | 0.299 | 0.310 | 0.297 | 0.298 | 0.300 | 0.309 | 0.210 | 0.250 | 0.174 | 0.106 | 0.094 | 0.300 | 0.319 | 0.088 | 0.082 | 0.040 | 0.040 | 0.150 | |
| L.O.I | 3.02 | 2.79 | 2.92 | 2.70 | 3.24 | 3.26 | 2.28 | 2.04 | 3.22 | 4.09 | 6.51 | 6.95 | 7.27 | 6.70 | 6.23 | 7.16 | 6.98 | 7.20 | 6.33 | 6.30 |
| Total | 100.2 | 99.1 | 100.0 | 98.9 | 99.8 | 100.8 | 100.2 | 99.4 | 100.7 | 100.4 | 100.8 | 99.7 | 100.4 | 101.1 | 99.7 | 99.4 | 100.9 | 101.1 | 100.3 | 99.3 |
| Trace element (in ppm) | ||||||||||||||||||||
| Li | 23.6 | 25.1 | 19.6 | 19.8 | 22.4 | 14 | 24.1 | 54.8 | 37.7 | 37.8 | 39.4 | 34.6 | 33.3 | 24.6 | ||||||
| Be | 1.39 | 1.73 | 2.29 | 1.39 | 1.9 | 1.99 | 1.35 | 2.7 | 1.44 | 0.394 | 0.286 | 0.806 | 0.439 | 0.328 | ||||||
| Sc | 10.9 | 11.3 | 11.1 | 11.5 | 10.7 | 5.37 | 10.5 | 1.6 | 7.4 | 6.71 | 6.44 | 3.82 | 5.48 | 5.35 | ||||||
| V | 92 | 93.6 | 91.3 | 92.3 | 92 | 49.1 | 91.3 | 108 | 131 | 80.6 | 111 | 89.0 | 104 | 91.1 | ||||||
| Cr | 12.3 | 16.4 | 15.1 | 15.2 | 14.1 | 9.31 | 17.7 | 67.9 | 48.9 | 23.9 | 42.1 | 25.4 | 35.9 | 21.1 | ||||||
| Co | 50.8 | 46.5 | 47.3 | 51.7 | 41.9 | 28.1 | 60.8 | 37.3 | 25.6 | 24 | 31.5 | 38.6 | 29.5 | 30.2 | ||||||
| Ni | 5.52 | 6.32 | 5.77 | 5.97 | 6.36 | 3.44 | 6.95 | 6.07 | 3.83 | 7.33 | 7.68 | 6.38 | 5.28 | 5.81 | ||||||
| Cu | 18.8 | 20.3 | 23.1 | 20.6 | 18.1 | 9.0 | 19.9 | 15.5 | 7.9 | 33.2 | 23.6 | 15.0 | 15.8 | 16.7 | ||||||
| Zn | 86.5 | 83.1 | 90.0 | 83.9 | 85.6 | 50.9 | 87.4 | 32.5 | 32.6 | 43.1 | 31.3 | 31.9 | 34.8 | 29.5 | ||||||
| Ga | 17.9 | 17 | 17.5 | 17.9 | 17.1 | 10.7 | 18 | 17.2 | 17.6 | 17.6 | 17.2 | 13.7 | 15.8 | 15.8 | ||||||
| Ge | 2.00 | 1.81 | 1.61 | 1.76 | 2.14 | 0.92 | 1.7 | 1.88 | 1.89 | 1.34 | 1.44 | 1.89 | 1.85 | 1.42 | ||||||
| As | 1.38 | 1.3 | 1.28 | 1.21 | 0.859 | 0.779 | 0.934 | 22.3 | 34 | 17 | 4.31 | 19 | 38.1 | 30.7 | ||||||
| Rb | 13.1 | 17.1 | 27.1 | 2.04 | 4.71 | 7.82 | 4.8 | 143 | 136 | 127 | 141 | 145 | 92.7 | 136 | ||||||
| Sr | 543 | 518 | 496 | 530 | 511 | 342 | 547 | 159 | 469 | 256 | 117 | 240 | 336 | 331 | ||||||
| Y | 22.2 | 20.7 | 22.1 | 22.8 | 21.9 | 13.9 | 21.3 | 24.7 | 14.6 | 16.9 | 23.9 | 16.5 | 13.4 | 13.2 | ||||||
| Zr | 167 | 155 | 160 | 154 | 153 | 94.6 | 140 | 154 | 155 | 160 | 151 | 139 | 173 | 160 | ||||||
| Nb | 15.3 | 15.0 | 15.0 | 14.9 | 15.5 | 9.1 | 14.7 | 15.9 | 15.7 | 16.6 | 15.3 | 14.6 | 16.6 | 16.0 | ||||||
| Mo | 0.435 | 0.334 | 0.293 | 0.374 | 0.301 | 0.097 | 0.455 | 0.633 | 0.638 | 0.411 | 0.277 | 0.584 | 0.64 | 0.413 | ||||||
| Cs | 4.44 | 3.31 | 3.31 | 3.8 | 4.49 | 3.03 | 4.49 | 3.40 | 6.92 | 15.5 | 0.386 | 1.95 | 1.92 | 1.71 | ||||||
| Ba | 1190 | 1170 | 1200 | 1200 | 1190 | 754 | 1100 | 76.3 | 169 | 282 | 196 | 81.9 | 140 | 142 | ||||||
| La | 46.1 | 37.2 | 39.1 | 48.7 | 40.1 | 27.4 | 43.6 | 29.6 | 48.9 | 48.4 | 46.0 | 41.0 | 62.2 | 44.7 | ||||||
| Ce | 87.1 | 73.1 | 74.2 | 93.8 | 80.7 | 51.5 | 82.9 | 65.2 | 101 | 89 | 87.6 | 84.2 | 111 | 91.7 | ||||||
| Pr | 9.91 | 8.36 | 8.68 | 10.8 | 9.29 | 5.37 | 9.53 | 6.22 | 11.4 | 10.7 | 10.5 | 9.05 | 13.8 | 9.64 | ||||||
| Nd | 35.8 | 30.4 | 31.2 | 38.3 | 34.1 | 19.1 | 34.3 | 22.3 | 41.9 | 38.6 | 37.3 | 32.9 | 49 | 33.8 | ||||||
| Sm | 6.43 | 5.79 | 5.95 | 6.64 | 6.17 | 3.64 | 6.16 | 5.16 | 7.11 | 6.71 | 6.72 | 5.70 | 8.46 | 5.83 | ||||||
| Eu | 1.70 | 1.51 | 1.57 | 1.76 | 1.55 | 0.95 | 1.62 | 1.79 | 2.00 | 1.69 | 1.72 | 1.33 | 2.13 | 1.58 | ||||||
| Gd | 5.28 | 4.63 | 4.73 | 5.82 | 5.01 | 3.19 | 5.05 | 7.13 | 6.01 | 5.12 | 5.60 | 4.68 | 6.80 | 4.97 | ||||||
| Tb | 0.855 | 0.727 | 0.782 | 0.854 | 0.81 | 0.491 | 0.788 | 1.4 | 0.867 | 0.737 | 0.878 | 0.683 | 0.885 | 0.748 | ||||||
| Dy | 4.2 | 3.74 | 3.85 | 4.22 | 4.17 | 2.51 | 4.13 | 7.99 | 3.65 | 3.46 | 4.6 | 3.22 | 3.81 | 2.99 | ||||||
| Ho | 0.885 | 0.801 | 0.804 | 0.849 | 0.827 | 0.498 | 0.825 | 1.41 | 0.639 | 0.657 | 0.967 | 0.604 | 0.633 | 0.579 | ||||||
| Er | 2.37 | 2.14 | 2.29 | 2.4 | 2.34 | 1.47 | 2.16 | 3.43 | 1.63 | 1.86 | 2.61 | 1.68 | 1.73 | 1.63 | ||||||
| Tm | 0.347 | 0.318 | 0.345 | 0.339 | 0.37 | 0.22 | 0.319 | 0.423 | 0.222 | 0.266 | 0.383 | 0.25 | 0.212 | 0.214 | ||||||
| Yb | 2.23 | 1.95 | 2.11 | 2.23 | 2.12 | 1.23 | 2.04 | 2.33 | 1.44 | 1.7 | 2.55 | 1.4 | 1.55 | 1.49 | ||||||
| Lu | 0.332 | 0.265 | 0.295 | 0.323 | 0.312 | 0.213 | 0.303 | 0.272 | 0.216 | 0.262 | 0.337 | 0.213 | 0.248 | 0.198 | ||||||
| Hf | 5.08 | 4.52 | 4.35 | 4.53 | 4.06 | 2.65 | 3.8 | 4.19 | 4.07 | 4.28 | 4.08 | 3.88 | 4.89 | 4.8 | ||||||
| Ta | 1.95 | 1.73 | 1.76 | 1.7 | 1.75 | 1 | 1.74 | 2.64 | 1.6 | 1.72 | 1.65 | 1.57 | 1.81 | 1.7 | ||||||
| W | 271 | 228 | 244 | 260 | 195 | 138 | 329 | 155 | 137 | 121 | 185 | 222 | 172 | 184 | ||||||
| Pb | 30.2 | 25.5 | 26.2 | 27.5 | 25 | 15.9 | 25.8 | 27.6 | 47.8 | 29.3 | 18 | 33.5 | 57.4 | 33.8 | ||||||
| Th | 14.2 | 12.1 | 13.2 | 15.8 | 13.1 | 8.39 | 13.3 | 11.3 | 12.8 | 13.5 | 13.1 | 12.8 | 14.5 | 13.3 | ||||||
| U | 2.62 | 2.38 | 2.22 | 2.39 | 2.57 | 1.02 | 2.53 | 1.08 | 1.1 | 1.42 | 1.48 | 1.03 | 1.17 | 1.24 | ||||||
| Zr/Hf | 32.9 | 34.3 | 36.8 | 34.0 | 37.7 | 35.7 | 36.8 | 36.8 | 38.1 | 37.4 | 37.0 | 35.8 | 35.4 | 33.3 | ||||||
| Nb/Ta | 7.87 | 8.68 | 8.53 | 8.79 | 8.86 | 9.09 | 8.44 | 6.03 | 9.79 | 9.68 | 9.30 | 9.31 | 9.19 | 9.41 | ||||||
| Eu/Eu* | 0.89 | 0.89 | 0.90 | 0.87 | 0.85 | 0.85 | 0.89 | 0.90 | 0.94 | 0.88 | 0.86 | 0.79 | 0.86 | 0.89 | ||||||
| Rb/Ba | 0.011 | 0.015 | 0.023 | 0.002 | 0.004 | 0.010 | 0.004 | 1.874 | 0.805 | 0.450 | 0.719 | 1.770 | 0.662 | 0.958 | ||||||
| Rb/Sr | 0.024 | 0.033 | 0.055 | 0.004 | 0.009 | 0.023 | 0.009 | 0.899 | 0.290 | 0.496 | 1.205 | 0.604 | 0.276 | 0.411 | ||||||
| La/Yb | 20.7 | 19.1 | 18.5 | 21.8 | 18.9 | 22.3 | 21.4 | 12.7 | 34.0 | 28.5 | 18.0 | 29.3 | 40.1 | 30.0 | ||||||
![Figure 5
Hark diagrams for both plutonic and subvolcanic rocks (a–i). Data source for granodiorite from Yang et al. [11]. The data related to granodiorite in the following figures are all sourced from Yang et al. [11].](/document/doi/10.1515/geo-2022-0634/asset/graphic/j_geo-2022-0634_fig_005.jpg)
The dacite porphyry, granodiorite, and rhyolite porphyry exhibit coherent linear correlations in the elemental diagrams (Figure 6). Granodiorite samples are located between dacite porphyry and rhyolite porphyry in terms of some trace elements, such as Rb, Sr, and Ba. The three types of intrusive and extrusive felsic igneous rocks share similar chondrite-normalized REE patterns, distinguished by enrichment of LREEs and negative Eu anomalies. They have La/Yb of 13–40 and Eu/Eu* ratios of 0.79–0.94 (Figure 7a). Positive Pb and negative Sr, P, Ti, and Nb anomalies are observed in the spider diagrams normalized by primitive mantle (Figure 7b).
![Figure 6
The binary diagrams of element concentrations and elemental ratios for the Shuikoushan subvolcanic-plutonic complex (a–f). The Rayleigh fractionation modeling (e and f) was evaluated from the granodiorite, dacite porphyry, and rhyolite porphyry by mass balance equation C
o = f
m × C
l + (1 − f
m) × C
s, where C
o, C
l, and C
s are trace element concentrations in the initial melt, extracted melt, and residual solids, respectively, and f
m is the fraction of melt extracted from the mush reservoir. Tick marks are melt fraction increments of 0.1, ranging from f
m = 0.9–0.1. The extracted melt was controlled by plagioclase-apatite-biotite-ilmennite-k-feldspar-quartz-magnetite-zircon mineral assemblage. The solid–melt partition coefficients used for modeling are from Schaen et al. [28] and Rollinson [29].](/document/doi/10.1515/geo-2022-0634/asset/graphic/j_geo-2022-0634_fig_006.jpg)
The binary diagrams of element concentrations and elemental ratios for the Shuikoushan subvolcanic-plutonic complex (a–f). The Rayleigh fractionation modeling (e and f) was evaluated from the granodiorite, dacite porphyry, and rhyolite porphyry by mass balance equation C o = f m × C l + (1 − f m) × C s, where C o, C l, and C s are trace element concentrations in the initial melt, extracted melt, and residual solids, respectively, and f m is the fraction of melt extracted from the mush reservoir. Tick marks are melt fraction increments of 0.1, ranging from f m = 0.9–0.1. The extracted melt was controlled by plagioclase-apatite-biotite-ilmennite-k-feldspar-quartz-magnetite-zircon mineral assemblage. The solid–melt partition coefficients used for modeling are from Schaen et al. [28] and Rollinson [29].
![Figure 7
Chondrite-normalized rare earth element patterns (a) and primitive mantle-normalized trace element diagrams (b) for the subvolcanic and plutonic rocks. Chondrite and primitive mantle values from Rudnick and Gao [30].](/document/doi/10.1515/geo-2022-0634/asset/graphic/j_geo-2022-0634_fig_007.jpg)
Chondrite-normalized rare earth element patterns (a) and primitive mantle-normalized trace element diagrams (b) for the subvolcanic and plutonic rocks. Chondrite and primitive mantle values from Rudnick and Gao [30].
4.3 In situ zircon Hf–O isotope compositions
Hf and O isotope compositions of zircon grains from samples LMS-1 for dacite porphyry and XMS-1 for rhyolite porphyry were obtained by SIMS (Table 3). Zircon crystals from sample LMS-1 have homogenous Hf and O isotope compositions. Their present 176Hf/177Hf ratios range from 0.282327 to 0.282436, matching with ε Hf(t) values of −12.4 to −8.5 with two-stage Hf model ages (T 2DM) of 1.7–1.9 Ga. These zircon grains have high δ 18O values from 8.2 to 9.5‰.
Zircon Hf–O isotope of the dacite porphyry and rhyolite porphyry from the Shuikoushan complex
| Spot | Age (Ma) | 176Hf/177Hf | ±σ | 176Lu/177Hf | ±σ | ε Hf(t) | ±σ | T 2DM | f Lu/Hf | δ 18O (‰) | ±2σ |
|---|---|---|---|---|---|---|---|---|---|---|---|
| Dacite porphyry | |||||||||||
| LMS-1@1 | 166.5 | 0.282405 | 0.000011 | 0.002060 | 0.000096 | −9.6 | 0.7 | 1,610 | −0.94 | 8.84 | 0.31 |
| LMS-1@2 | 161.6 | 0.282436 | 0.000010 | 0.001708 | 0.000143 | −8.5 | 0.6 | 1,548 | −0.95 | 8.91 | 0.35 |
| LMS-1@3 | 160.6 | 0.282409 | 0.000009 | 0.001815 | 0.000022 | −9.5 | 0.6 | 1,602 | −0.95 | 8.34 | 0.21 |
| LMS-1@4 | 165.5 | 0.282367 | 0.000011 | 0.001081 | 0.000024 | −10.8 | 0.7 | 1,679 | −0.97 | 9.43 | 0.29 |
| LMS-1@5 | 157.8 | 0.282395 | 0.000009 | 0.001702 | 0.000057 | −10.1 | 0.6 | 1,631 | −0.95 | 8.87 | 0.34 |
| LMS-1@6 | 152.4 | 0.282387 | 0.000012 | 0.001386 | 0.000066 | −10.4 | 0.7 | 1,647 | −0.96 | 9.13 | 0.32 |
| LMS-1@7 | 163.2 | 0.282398 | 0.000009 | 0.001364 | 0.000032 | −9.8 | 0.6 | 1,620 | −0.96 | 8.20 | 0.26 |
| LMS-1@8 | 156.6 | 0.282383 | 0.000010 | 0.001283 | 0.000008 | −10.4 | 0.6 | 1,651 | −0.96 | 9.03 | 0.31 |
| LMS-1@12 | 158.3 | 0.282415 | 0.000012 | 0.001261 | 0.000103 | −9.3 | 0.7 | 1,589 | −0.96 | 9.31 | 0.31 |
| LMS-1@13 | 159.1 | 0.282395 | 0.000008 | 0.000979 | 0.000033 | −9.9 | 0.6 | 1,626 | −0.97 | 8.58 | 0.38 |
| LMS-1@14 | 161.6 | 0.282417 | 0.000009 | 0.001385 | 0.000048 | −9.2 | 0.6 | 1,584 | −0.96 | 9.07 | 0.35 |
| LMS-1@15 | 157.0 | 0.282397 | 0.000009 | 0.000787 | 0.000009 | −9.9 | 0.6 | 1,622 | −0.98 | 9.34 | 0.27 |
| LMS-1@16 | 151.2 | 0.282354 | 0.000011 | 0.001138 | 0.000021 | −11.6 | 0.7 | 1,710 | −0.97 | 8.42 | 0.38 |
| LMS-1@19 | 160.5 | 0.282414 | 0.000010 | 0.001259 | 0.000059 | −9.3 | 0.6 | 1,590 | −0.96 | 8.85 | 0.26 |
| LMS-1@21 | 160.0 | 0.282372 | 0.000010 | 0.000468 | 0.000011 | −10.7 | 0.6 | 1,668 | −0.99 | 8.87 | 0.26 |
| LMS-1@22 | 158.5 | 0.282369 | 0.000009 | 0.001408 | 0.000010 | −10.9 | 0.6 | 1,679 | −0.96 | 9.18 | 0.29 |
| LMS-1@23 | 163.7 | 0.282385 | 0.000010 | 0.001438 | 0.000017 | −10.2 | 0.6 | 1,645 | −0.96 | 9.06 | 0.37 |
| LMS-1@24 | 162.3 | 0.282368 | 0.000011 | 0.001266 | 0.000057 | −10.9 | 0.7 | 1,679 | −0.96 | 9.18 | 0.47 |
| LMS-1@25 | 159.9 | 0.282390 | 0.000009 | 0.001876 | 0.000024 | −10.2 | 0.6 | 1,641 | −0.94 | 9.05 | 0.25 |
| LMS-1@26 | 161.6 | 0.282365 | 0.000009 | 0.001139 | 0.000021 | −11.0 | 0.6 | 1,684 | −0.97 | 9.06 | 0.33 |
| LMS-1@27 | 157.8 | 0.282372 | 0.000008 | 0.000778 | 0.000012 | −10.8 | 0.6 | 1,670 | −0.98 | 9.51 | 0.30 |
| LMS-1@28 | 159.5 | 0.282327 | 0.000010 | 0.001227 | 0.000009 | −12.4 | 0.6 | 1,760 | −0.96 | ||
| Rhyolite porphyry | |||||||||||
| XMS-1@1 | 158.2 | 0.282388 | 0.000010 | 0.001536 | 0.000013 | −10.3 | 0.6 | 1,643 | −0.95 | 8.40 | 0.36 |
| XMS-1@2 | 158.8 | 0.282413 | 0.000009 | 0.001663 | 0.000118 | −9.4 | 0.6 | 1,594 | −0.95 | 8.97 | 0.22 |
| XMS-1@5 | 159.5 | 0.282427 | 0.000009 | 0.001480 | 0.000049 | −8.9 | 0.6 | 1,567 | −0.96 | 9.62 | 0.22 |
| XMS-1@6 | 160.0 | 0.282387 | 0.000009 | 0.000982 | 0.000027 | −10.2 | 0.6 | 1,641 | −0.97 | 9.24 | 0.26 |
| XMS-1@7 | 160.3 | 0.282390 | 0.000011 | 0.001122 | 0.000013 | −10.1 | 0.7 | 1,636 | −0.97 | 9.36 | 0.33 |
| XMS-1@8 | 160.2 | 0.282406 | 0.000009 | 0.001271 | 0.000019 | −9.6 | 0.6 | 1,605 | −0.96 | 8.98 | 0.33 |
| XMS-1@9 | 156.0 | 0.282375 | 0.000010 | 0.000632 | 0.000030 | −10.7 | 0.6 | 1,664 | −0.98 | 9.43 | 0.46 |
| XMS-1@10 | 158.6 | 0.282400 | 0.000010 | 0.001516 | 0.000008 | −9.8 | 0.6 | 1,620 | −0.95 | 9.06 | 0.33 |
| XMS-1@12 | 157.3 | 0.282392 | 0.000011 | 0.001250 | 0.000037 | −10.1 | 0.6 | 1,634 | −0.96 | 9.16 | 0.63 |
| XMS-1@13 | 158.1 | 0.282419 | 0.000010 | 0.001427 | 0.000015 | −9.2 | 0.6 | 1,582 | −0.96 | 9.12 | 0.26 |
| XMS-1@14 | 156.6 | 0.282391 | 0.000010 | 0.001413 | 0.000024 | −10.2 | 0.6 | 1,638 | −0.96 | 9.14 | 0.29 |
| XMS-1@15 | 158.7 | 0.282414 | 0.000010 | 0.001736 | 0.000030 | −9.3 | 0.6 | 1,592 | −0.95 | 8.99 | 0.35 |
| XMS-1@16 | 165.0 | 0.282414 | 0.000009 | 0.001461 | 0.000007 | −9.2 | 0.6 | 1,589 | −0.96 | 9.40 | 0.41 |
| XMS-1@21 | 162.8 | 0.282367 | 0.000010 | 0.000475 | 0.000033 | −10.8 | 0.6 | 1,676 | −0.99 | 9.09 | 0.34 |
| XMS-1@22 | 160.9 | 0.282427 | 0.000012 | 0.000356 | 0.000058 | −8.7 | 0.7 | 1,559 | −0.99 | 9.38 | 0.36 |
| XMS-1@23 | 162.2 | 0.282390 | 0.000009 | 0.000829 | 0.000019 | −10.0 | 0.6 | 1,634 | −0.98 | 9.34 | 0.43 |
| XMS-1@24 | 158.5 | 0.282383 | 0.000009 | 0.000278 | 0.000014 | −10.3 | 0.6 | 1,645 | −0.99 | 8.69 | 0.33 |
| XMS-1@25 | 161.8 | 0.282405 | 0.000008 | 0.000877 | 0.000061 | −9.5 | 0.6 | 1,605 | −0.97 | 8.98 | 0.33 |
| XMS-1@26 | 158.7 | 0.282255 | 0.000012 | 0.001222 | 0.000036 | −14.9 | 0.7 | 1,900 | −0.96 | 8.75 | 0.29 |
The acquired Hf–O isotopes conform to a normal Gaussian distribution and produced negative mean ε Hf(t) values of −10.2 ± 0.4 (2σ) (Figure 8a) with relatively high δ 18O values (average = 8.9 ± 0.2‰) (2σ) (Figure 8b). Similarly, the zircon grains in sample XMS-1 demonstrate a uniform composition of Hf and O isotopes. Their 176Hf/177Hf ratios differ from 0.282388 to 0.282427, ε Hf(t) values from −10.8 to −8.7, and T 2DM from 1.7 to 1.9 Ga. A normal distribution was observed, with a negative mean ε Hf(t) value of −9.8 ± 0.3 (2σ) (Figure 8c). Additionally, they consistently display high δ 18O values of 8.4–9.6‰, resulting in a mean δ 18O values of 9.1 ± 0.1‰ (2σ) (Figure 8d). The dacite porphyry and rhyolite porphyry have similar zircon H–O isotopic compositions to those of the granodiorites (Figure 4d–i), and the latter show strong negative ε Hf(t) values (−10.2 to −7.4) and high δ 18O values (8.4–9.7‰) [11].

Histogram of zircon ε Hf(t) and δ 18O values for the dacite porphyry (a, b) and rhyolite porphyry (c, d).
5 Discussion
The early studies have dated the plutonic granodiorite nearby the Shuikoushan district using single-grained zircons U–Pb dating technique at 172–181 Ma [31–33]. Zircons may contain mineral inclusions and single-grained mineral dating probably produces unreliable U–Pb ages [34]. The granodiorite was confirmed to have been emplaced at 158–159 Ma through new in situ SIMS zircon U–Pb dating [11,14]. However, ages of the subvolcanic rocks, such as the dacite porphyry and rhyolite porphyry, were not dated and the geochronological framework of subvolcanic and plutonic rocks has not been constructed. The spatiotemporal connection between intrusive and extrusive phases in the region remains unclear.
5.1 Spatiotemporal connection between intrusive and extrusive phases
Our SIMS U–Pb dating of zircon shows that the dacite porphyry and rhyolite porphyry have crystallization ages of 159.5 ± 1.6 and 159.5 ± 1.8 Ma, respectively (Figure 3). These two types of porphyry rocks have the same ages and were synchronously emplaced in the Shuikoushan region. The granodiorite in the region also has a zircon SIMS U–Pb age of 158.3 ± 1.2 Ma [11], nearly similar to those of the dacite porphyry and rhyolite porphyry (Figure 4a), and is more likely to have been formed by produced at the final magmatic stage of the Shuikoushan caldera complex. Therefore, both the plutonic (granodiorite) and subvolcanic (dacite porphyry and rhyolite porphyry) phases of the Shuikoushan caldera complex were emplaced and generated by the same tecno-thermal event (Figure 4a–c).
5.2 Magmatic source of the subvolcanic–plutonic complex
The isotopic composition of magmatic zircon records the nature of the source region and the magma evolution from which they crystallized [35,36]. Magmatic zircons from the granodiorite, dacite porphyry, and rhyolite porphyry have similar ranges of Hf–O isotope compositions (Figures 4 and 9), suggesting that they were derived from similar source regions. All zircon grains show enriched Hf [ε Hf(t) = −8.1 to −12.4)] and relatively high O isotope compositions (δ 18O = 8.3–9.7‰), indicating that the subvolcanic-plutonic rocks were likely derived from fractional melting of crustal materials. Moreover, both the intrusive and extrusive rocks from the Shuikoushan caldera complex are characterized by relatively low MgO (0.05–2.29 wt%), FeOt (4.14–7.34 wt%), Ni (3.44–7.68 ppm), and Cr contents (9.31–67.9 ppm) and relatively high SiO2 (60.9–72.2 wt%) and K2O contents (0.01–4.69%) (Figure 5). These geochemical compositions are identical to those of melts generated by mafic rocks with medium-high K contents in the lower crust [42]. Compared to the Mesozoic supracrustal-derived S-type granites in the Cathaysia Block, the subvolcanic-plutonic rocks in the Shuikoushan district have relatively high zircon ε Hf(t) values (−8.1 to −12.4) and low zircon δ 18O values (8.3–9.7‰) (Figure 9a). Additionally, their zircon ε Hf(t) values are within the evolution range of the lower continental crust (Figure 9b). They also have Mesoproterozoic two-stage Hf model ages (1.75–1.90 Ga), consistent with the peak formation age of the Cathaysia crust at 1.85 Ga [43]. Thus, the subvolcanic–plutonic rocks of the Shuikoushan caldera complex are proposed to have originated from the same pre-existing lower crust. Subsequently, their parental magmas underwent crystal–melt segregation in the upper crust level during the magma emplacement.
![Figure 9
(a) Diagram of Hf vs O isotopes of zircons from Shuikoushan subvolcanic and plutonic rocks. Hf–O isotopes of zircon from supracrustal-derived S-type granite are from Yang et al. [37]. (b) ε
Hf(t)-age diagram for zircon from Shuikoushan subvolcanic-plutonic rocks, implying that these rocks formed by reworking of middle-lower continental crust. The contemporary mantle-derived (Qinghu granite) and mantle–crust mixing magmas (Lisong granite) in adjacent regions are from Li et al. [38]. The evolution of depleted mantle with present-day 176Lu/177Hf = 0.0384 and 176Hf/177Hf = 0.28325 [39]. Chondrite with present-day 176Lu/177Hf = 0.0332 and 176Hf/177Hf = 0.282772, continental upper crust and lower crust with 176Lu/177Hf = 0.0093 and 0.022, respectively [40]. δ
18O values of mantle are from Valley et al. [41].](/document/doi/10.1515/geo-2022-0634/asset/graphic/j_geo-2022-0634_fig_009.jpg)
(a) Diagram of Hf vs O isotopes of zircons from Shuikoushan subvolcanic and plutonic rocks. Hf–O isotopes of zircon from supracrustal-derived S-type granite are from Yang et al. [37]. (b) ε Hf(t)-age diagram for zircon from Shuikoushan subvolcanic-plutonic rocks, implying that these rocks formed by reworking of middle-lower continental crust. The contemporary mantle-derived (Qinghu granite) and mantle–crust mixing magmas (Lisong granite) in adjacent regions are from Li et al. [38]. The evolution of depleted mantle with present-day 176Lu/177Hf = 0.0384 and 176Hf/177Hf = 0.28325 [39]. Chondrite with present-day 176Lu/177Hf = 0.0332 and 176Hf/177Hf = 0.282772, continental upper crust and lower crust with 176Lu/177Hf = 0.0093 and 0.022, respectively [40]. δ 18O values of mantle are from Valley et al. [41].
5.3 Crystal–melt segregation processes
The deciphering of genetic relationships between volcanic and plutonic rocks often involves the widespread application of the crystal mush model [3–5,7]. Melt extraction process has been verified by trace elements of zircon and incompatible elements of highly silicic volcanic rocks in southeast China [4,7]. In the Shuikoushan caldera, the granodiorite, dacite porphyry, and rhyolite porphyry display a liner relationship in the Harker diagrams (Figure 5) and trace elemental binary diagrams (Figure 6), indicating that these rocks were probably connected by crystal fractionation. However, there is an obvious compositional gap in these diagrams (Figures 5 and 6). The granodiorite and dacite porphyry have higher MgO, MnO, FeO, and P2O5 than those of the rhyolite porphyry, which may have resulted from the accumulation of aplite and Fe–Mg minerals. Additionally, the former has lower Rb content and Rb/Sr and Rb/Ba ratios but higher Sr and Ba contents than the rhyolite porphyry (Figure 6). Generally, cumulate rocks are rich in compatible element (e.g., Ba, Sr, Eu, and Zr), but depleted in incompatible elements (e.g. Rb) than the extracted melt due to the crystal–melt segregation process [3,7,44]. The granodiorite and dacite porphyry show distinct but complementary geochemical features in comparison to the rhyolite porphyry. Therefore, the granodiorite and dacite porphyry are inferred to be residual cumulate-rich melts, while the rhyolite porphyry represents the extracted melts. It is worth mentioning that the granodiorite exhibits variable compositions, which may result from further differentiation of the interstitial melts in magma reservoirs after extraction of the rhyolite magma.
The Rayleigh model was employed to further validate the processes of crystal–melt segregation using incompatible trace elements (Figure 6e and f). The starting composition (C o) is assumed to be the average values of the granodiorite samples, including Rb = 106 ppm, Ba = 630 ppm, and Sr = 394 ppm. These values are very similar to those of the bulk continent crust of South China [45]. The bulk partition coefficients (D) are Rb = 0.2–0.5, Ba = 2.8–8.0, and Sr = 1.29–3.9. Published partition coefficients are utilized to establish the range for cumulates and extracted melts through bracketing.
The calculated results are shown in the Rb–Sr vs Rb–Ba binary diagrams (Figure 6). The dacite porphyry falls within the cumulate field, while the rhyolite porphyry is situated within the extracted melt field. Based on the above-mentioned geochemical features of the igneous rocks in the Shuikoushan caldera, the granodiorite and dacite porphyry are residual cumulates, while the rhyolite porphyry is highly silicic melts derived from the mush reservoirs. Crytal–melt segregation is therefore an effective mechanism for connecting plutonic and subvolcanic rocks in mush reservoirs.
6 Conclusions
Zircon SIMS U–Pb dating reveals that the granodiorite, dacite porphyry, and rhyolite porphyry are comagmatic and originated from the same source region at ca. 158 Ma. They were produced by partial remelting of the pre-existing lower crust.
The distinct but complementary geochemical features between the subvolcanic and the plutonic rocks, as well as geochemical modeling results, indicate that the magma system underwent crystal–melt segregation in the Shuikoushan region. The granodiorite and dacite porphyry are residual cumulate-rich melts after melt extraction, whereas the rhyolite porphyry is high silicic melt derived from the mush reservoir. Crytal–melt segregation is an effective mechanism connecting the plutonic and subvolcanic rocks in the mush reservoir.
Acknowledgments
We express our gratitude to the geologists at Shuikoushan Nonferrous-metal Corporation for their valuable assistance throughout our field investigations. We extend our heartfelt gratitude to Prof. Jan Barabach and three anonymous reviewers for their invaluable suggestions that helped to significantly improve the manuscript.
-
Funding information: This work is financially supported by the National Key R&D Program of China (2023YFC2906401) and the National Natural Science Foundation of China (42073046, 42372113).
-
Author contributions: Conceptualization: Dan Wang, Yong Fu, and Lie-Meng Chen; data curation: Dan Wang and Yong Fu; formal analysis: Dan Wang, Yong Fu, and Lie-Meng Chen; investigation: Dan Wang, Yong Fu, Zhi Zhang, and Qian Hu; resource: Dan Wang, Yong Fu, Lie-Meng Chen, Zhi Zhang, and Qian Hu.
-
Conflict of interest: The authors declare that there is no conflict of interest.
-
Data availability statement: Data available on request from the author.
References
[1] Bachmann O, Miller C, De Silva S. The volcanic–plutonic connection as a stage for understanding crustal magmatism. J Volcanol Geotherm Res. 2007;167(1):1–23.10.1016/j.jvolgeores.2007.08.002Search in Google Scholar
[2] Buret Y, Wotzlaw J-F, Roozen S, Guillong M, von Quadt A, Heinrich CA. Zircon petrochronological evidence for a plutonic-volcanic connection in porphyry copper deposits. Geology. 2017;45(7):623–6.10.1130/G38994.1Search in Google Scholar
[3] Liu X-C, Wu F-Y, Kohn MJ, Liu ZC, Ji WQ, Wang JM, et al. Plutonic-subvolcanic connection of the Himalayan leucogranites: Insights from the Eocene Lhunze complex, southern Tibet. Lithos. 2022;(434–435):106939.10.1016/j.lithos.2022.106939Search in Google Scholar
[4] Yan L-L, He Z-Y, Klemd R, Beier C, Xu XS. Tracking crystal-melt segregation and magma recharge using zircon trace element data. Chem Geol. 2020;542:119596.10.1016/j.chemgeo.2020.119596Search in Google Scholar
[5] Yan L, He Z, Beier C, Klemd R. Geochemical constraints on the link between volcanism and plutonism at the Yunshan caldera complex, SE China. Contrib Mineral Petrol. 2018;173(1):4.10.1007/s00410-017-1430-5Search in Google Scholar
[6] Deering CD, Keller B, Schoene B, Bachmann O, Beane R, Ovtcharova M. Zircon record of the plutonic-volcanic connection and protracted rhyolite melt evolution. Geology. 2016;44(4):267–70.10.1130/G37539.1Search in Google Scholar
[7] Liang C, Xu X, He Z. Connected volcanic and plutonic association by crystal-melt segregation in the Daiyunshan volcanic field, SE China. Tectonophysics. 2022;836:229409.10.1016/j.tecto.2022.229409Search in Google Scholar
[8] Barnes CG, Werts K, Memeti V, Ardill K. Most granitoid rocks are cumulates: Deductions from hornblende compositions and zircon saturation. J Petrol. 2020;60(11):2227–40.10.1093/petrology/egaa008Search in Google Scholar
[9] Vernon RH, Collins WJ. Structural criteria for identifying granitic cumulates. J Geol. 2011;119(2):127–42.10.1086/658198Search in Google Scholar
[10] Mao J, Zheng W, Xie G, Lehmann B, Goldfarb R. Recognition of a Middle–Late Jurassic arc-related porphyry copper belt along the southeast China coast: Geological characteristics and metallogenic implications. Geology. 2021;49(5):592–6.10.1130/G48615.1Search in Google Scholar
[11] Yang J-H, Peng J-T, Zheng Y-F, Hu RZ, Bi XW, Zhao JH, et al. Petrogenesis of the Mesozoic Shuikoushan peraluminous I-type granodioritic intrusion in Hunan Province, South China: Middle–lower crustal reworking in an extensional tectonic setting. J Asian Earth Sci. 2016;123:224–42.10.1016/j.jseaes.2016.04.008Search in Google Scholar
[12] Zhao J-H, Zhou M-F, Yan D-P, Zheng JP, Li JW. Reappraisal of the ages of Neoproterozoic strata in South China: No connection with the Grenvillian orogeny. Geology. 2011;39(4):299–302.10.1130/G31701.1Search in Google Scholar
[13] Zhou X, Sun T, Shen W, Shu L, Niu Y. Petrogenesis of Mesozoic granitoids and volcanic rocks in South China: A response to tectonic evolution. Episodes. 2006;29(1):26–33.10.18814/epiiugs/2006/v29i1/004Search in Google Scholar
[14] Huang J-C, Peng J-T, Yang J-H, Zhang BL, Xu CX. Precise zircon U–Pb and molybdenite Re–Os dating of the Shuikoushan granodiorite-related Pb–Zn mineralization, southern Hunan, South China. Ore Geol Rev. 2015;71:305–17.10.1016/j.oregeorev.2015.06.011Search in Google Scholar
[15] Ma LY, Lu YF, Mei YP, Chen XQ. Zircon SHRIMP U-Pb dating of granodiorite from Shuikoushan ore-field, Hunan province and its geological significance. Acta Petrol Sin. 2006;22(10):2475–82.Search in Google Scholar
[16] Li X-H, Long W-G, Li Q-L, Liu Y, Zheng YF, Yang YH, et al. Penglai zircon megacrysts: A potential new working reference material for microbeam determination of Hf–O isotopes and U–Pb age. Geostand Geoanal Res. 2010;34(2):117–34.10.1111/j.1751-908X.2010.00036.xSearch in Google Scholar
[17] Li X, Tang G, Gong B, Yang Y, Hou K, Hu Z, et al. Qinghu zircon: A working reference for microbeam analysis of U-Pb age and Hf and O isotopes. Chin Sci Bull. 2013;58(36):4647–54.10.1007/s11434-013-5932-xSearch in Google Scholar
[18] Li XH, Liu Y, Li QL, Guo CH, Chamberlain KR. Precise determination of Phanerozoic zircon Pb/Pb age by multicollector SIMS without external standardization. Geochem Geophys Geosyst. 2009;10(4):Q04010.10.1029/2009GC002400Search in Google Scholar
[19] Wiedenbeck M, Allé P, Corfu F, Griffin WL, Meier M, Oberli F, et al. Three natural zircon standards for U‐Th‐Pb, Lu‐Hf, trace element and REE analyses. Geostand Newsl. 1995;19(1):1–23.10.1111/j.1751-908X.1995.tb00147.xSearch in Google Scholar
[20] Sláma J, Košler J, Condon DJ, Crowley JL, Gerdes A, Hanchar JM, et al. Plešovice zircon—a new natural reference material for U–Pb and Hf isotopic microanalysis. Chem Geol. 2008;249(1):1–35.10.1016/j.chemgeo.2007.11.005Search in Google Scholar
[21] Ludwig KR. User’s manual for Isoplot 3.70: a geochronological toolkit for Microsoft Excel. Berkeley Geochronology Center Special Publication; 2008. p. 70.Search in Google Scholar
[22] Hu Z, Liu Y, Gao S, Liu W, Zhang W, Tong X, et al. Improved in situ Hf isotope ratio analysis of zircon using newly designed X skimmer cone and jet sample cone in combination with the addition of nitrogen by laser ablation multiple collector ICP-MS. J Anal At Spectrom. 2012;27(9):1391–9.10.1039/c2ja30078hSearch in Google Scholar
[23] Liu Y, Gao S, Hu Z, Gao C, Zong K, Wang D. Continental and oceanic crust recycling-induced melt–peridotite interactions in the trans-North China Orogen: U–Pb dating, Hf isotopes and trace elements in zircons from Mantle Xenoliths. J Petrol. 2010;51(1–2):537–71.10.1093/petrology/egp082Search in Google Scholar
[24] Blichert-Toft J, Chauvel C, Albarède F. Separation of Hf and Lu for high-precision isotope analysis of rock samples by magnetic sector-multiple collector ICP-MS. Contrib Mineral Petrol. 1997;127(3):248–60.10.1007/s004100050278Search in Google Scholar
[25] Fisher CM, Vervoort JD, Hanchar JM. Guidelines for reporting zircon Hf isotopic data by LA-MC-ICPMS and potential pitfalls in the interpretation of these data. Chem Geol. 2014;363:125–33.10.1016/j.chemgeo.2013.10.019Search in Google Scholar
[26] Qi L, Hu J, Gregoire DC. Determination of trace elements in granites by inductively coupled plasma mass spectrometry. Talanta. 2000;51(3):507–13.10.1016/S0039-9140(99)00318-5Search in Google Scholar PubMed
[27] Yu H, Liu J. The characteristic and petrogenesis of the granitic subvolcanic complex in the Shuikoushan orefield (in Chinese with English abstract). Geotecton Metallog. 1997;21(1):32–40.Search in Google Scholar
[28] Schaen AJ, Cottle JM, Singer BS, Keller CB, Garibaldi N, Schoene B. Complementary crystal accumulation and rhyolite melt segregation in a late Miocene Andean pluton. Geology. 2017;45(9):835–8.10.1130/G39167.1Search in Google Scholar
[29] Rollinson HR. Using geochemical data: evaluation, presentation, interpretation. Routledge; 1993. 10.4324/9781315845548.Search in Google Scholar
[30] Rudnick R, Gao S. Composition of the continental crust. In: Holland HD, Turekian KK, editors. Treatise on geochemistry. vol. 3, Amsterdam: Elsevier; 2003. p. 1–64.10.1016/B0-08-043751-6/03016-4Search in Google Scholar
[31] Quan T-J, Kong H, Fei L-D, Wang G, Li H, Wu C-M. Petrogenesis of ranodiorite porphyry in Baoshan eposit: Constraints from geochemistry, zircon UPb chronology and Hf isotopes (in Chinese with English abstract). Chin J Nonferrous Met. 2012;3:611–21.Search in Google Scholar
[32] Wang Y, Fan W, Guo F. Geochemistry of early Mesozoic potassium-rich diorites-granodiorites in southeastern Hunan Province, South China: Petrogenesis and tectonic implications. Geochem J. 2003;37(4):427–48.10.2343/geochemj.37.427Search in Google Scholar
[33] Wang Y, Fan W, Guo F, Li H, Liang X. U-Pb dating of early Mesozoic granodioritic intrusions in southeastern Hunan Province, South China and its petrogenetic implications. Sci China Ser D-Earth Sci. 2002;45(3):280–8.10.1360/02yd9030Search in Google Scholar
[34] Scherer EE, Whitehouse MJ, Munker C. Zircon as a monitor of crustal growth. Elements. 2007;3(1):19–24.10.2113/gselements.3.1.19Search in Google Scholar
[35] Kemp AI, Hawkesworth CJ, Foster GL, Paterson BA, Woodhead JD, Hergt JM, et al. Magmatic and crustal differentiation history of granitic rocks from Hf-O isotopes in zircon. Science. 2007;315(5814):980–3.10.1126/science.1136154Search in Google Scholar PubMed
[36] Zhao J-H, Yang T, Wang W. Orogenic belt resulting from ocean-continent collision. Geology. 2022;50(11):1266–9.10.1130/G50337.1Search in Google Scholar
[37] Yang J-H, Kang L-F, Peng J-T, Zhong H, Gao JF, Liu L. In-situ elemental and isotopic compositions of apatite and zircon from the Shuikoushan and Xihuashan granitic plutons: Implication for Jurassic granitoid-related Cu-Pb-Zn and W mineralization in the Nanling Range, South China. Ore Geol Rev. 2018;93:382–403.10.1016/j.oregeorev.2017.12.023Search in Google Scholar
[38] Li X, Li W, Wang X, Li Q, Liu Y, Tang G. Role of mantle-derived magma in genesis of early Yanshanian granites in the Nanling Range, South China: in situ zircon Hf-O isotopic constraints. Sci China Ser D-Earth Sci. 2009;52(9):1262–78.10.1007/s11430-009-0117-9Search in Google Scholar
[39] Griffin WL, Pearson NJ, Belousova E, Jackson SE, van Achterbergh E, O’Reilly SY, et al. The Hf isotope composition of cratonic mantle: LAM-MC-ICPMS analysis of zircon megacrysts in kimberlites. Geochim Cosmochim Acta. 2000;64(1):133–47.10.1016/S0016-7037(99)00343-9Search in Google Scholar
[40] Wu F-Y, Li X-H, Zheng Y-F, Gao S. Lu–Hf isotopic systematics and their applications in petrology (in Chinese with English abstract). Acta Petrol Sin. 2007;23(2):185–220.Search in Google Scholar
[41] Valley JW, Lackey JS, Cavosie AJ, Clechenko CC, Spicuzza MJ, Basei MAS, et al. 4.4 billion years of crustal maturation: Oxygen isotope ratios of magmatic zircon. Contrib Mineral Petrol. 2005;150(6):561–80.10.1007/s00410-005-0025-8Search in Google Scholar
[42] Beard J, Lofgren G. Dehydration melting and water-saturated melting of basaltic and andesitic greenstones and amphibolites at 1, 3, and 6.9 kb. J Petrol. 1991;32(2):365–401.10.1093/petrology/32.2.365Search in Google Scholar
[43] Chen J. Jahn B-m. Crustal evolution of southeastern China: Nd and Sr isotopic evidence. Tectonophysics. 1998;284(1):101–33.10.1016/S0040-1951(97)00186-8Search in Google Scholar
[44] Mills RD, Coleman DS. Temporal and chemical connections between plutons and ignimbrites from the Mount Princeton magmatic center. Contrib Mineral Petrol. 2013;165(5):961–80.10.1007/s00410-012-0843-4Search in Google Scholar
[45] Chi Q, Yan M. Handbook of elemental abundance for applied geochemistry (in Chinese). Beijing, China: Geological Publishing House; 2007.Search in Google Scholar
© 2024 the author(s), published by De Gruyter
This work is licensed under the Creative Commons Attribution 4.0 International License.
Articles in the same Issue
- Regular Articles
- Theoretical magnetotelluric response of stratiform earth consisting of alternative homogeneous and transitional layers
- The research of common drought indexes for the application to the drought monitoring in the region of Jin Sha river
- Evolutionary game analysis of government, businesses, and consumers in high-standard farmland low-carbon construction
- On the use of low-frequency passive seismic as a direct hydrocarbon indicator: A case study at Banyubang oil field, Indonesia
- Water transportation planning in connection with extreme weather conditions; case study – Port of Novi Sad, Serbia
- Zircon U–Pb ages of the Paleozoic volcaniclastic strata in the Junggar Basin, NW China
- Monitoring of mangrove forests vegetation based on optical versus microwave data: A case study western coast of Saudi Arabia
- Microfacies analysis of marine shale: A case study of the shales of the Wufeng–Longmaxi formation in the western Chongqing, Sichuan Basin, China
- Multisource remote sensing image fusion processing in plateau seismic region feature information extraction and application analysis – An example of the Menyuan Ms6.9 earthquake on January 8, 2022
- Identification of magnetic mineralogy and paleo-flow direction of the Miocene-quaternary volcanic products in the north of Lake Van, Eastern Turkey
- Impact of fully rotating steel casing bored pile on adjacent tunnels
- Adolescents’ consumption intentions toward leisure tourism in high-risk leisure environments in riverine areas
- Petrogenesis of Jurassic granitic rocks in South China Block: Implications for events related to subduction of Paleo-Pacific plate
- Differences in urban daytime and night block vitality based on mobile phone signaling data: A case study of Kunming’s urban district
- Random forest and artificial neural network-based tsunami forests classification using data fusion of Sentinel-2 and Airbus Vision-1 satellites: A case study of Garhi Chandan, Pakistan
- Integrated geophysical approach for detection and size-geometry characterization of a multiscale karst system in carbonate units, semiarid Brazil
- Spatial and temporal changes in ecosystem services value and analysis of driving factors in the Yangtze River Delta Region
- Deep fault sliding rates for Ka-Ping block of Xinjiang based on repeating earthquakes
- Improved deep learning segmentation of outdoor point clouds with different sampling strategies and using intensities
- Platform margin belt structure and sedimentation characteristics of Changxing Formation reefs on both sides of the Kaijiang-Liangping trough, eastern Sichuan Basin, China
- Enhancing attapulgite and cement-modified loess for effective landfill lining: A study on seepage prevention and Cu/Pb ion adsorption
- Flood risk assessment, a case study in an arid environment of Southeast Morocco
- Lower limits of physical properties and classification evaluation criteria of the tight reservoir in the Ahe Formation in the Dibei Area of the Kuqa depression
- Evaluation of Viaducts’ contribution to road network accessibility in the Yunnan–Guizhou area based on the node deletion method
- Permian tectonic switch of the southern Central Asian Orogenic Belt: Constraints from magmatism in the southern Alxa region, NW China
- Element geochemical differences in lower Cambrian black shales with hydrothermal sedimentation in the Yangtze block, South China
- Three-dimensional finite-memory quasi-Newton inversion of the magnetotelluric based on unstructured grids
- Obliquity-paced summer monsoon from the Shilou red clay section on the eastern Chinese Loess Plateau
- Classification and logging identification of reservoir space near the upper Ordovician pinch-out line in Tahe Oilfield
- Ultra-deep channel sand body target recognition method based on improved deep learning under UAV cluster
- New formula to determine flyrock distance on sedimentary rocks with low strength
- Assessing the ecological security of tourism in Northeast China
- Effective reservoir identification and sweet spot prediction in Chang 8 Member tight oil reservoirs in Huanjiang area, Ordos Basin
- Detecting heterogeneity of spatial accessibility to sports facilities for adolescents at fine scale: A case study in Changsha, China
- Effects of freeze–thaw cycles on soil nutrients by soft rock and sand remodeling
- Vibration prediction with a method based on the absorption property of blast-induced seismic waves: A case study
- A new look at the geodynamic development of the Ediacaran–early Cambrian forearc basalts of the Tannuola-Khamsara Island Arc (Central Asia, Russia): Conclusions from geological, geochemical, and Nd-isotope data
- Spatio-temporal analysis of the driving factors of urban land use expansion in China: A study of the Yangtze River Delta region
- Selection of Euler deconvolution solutions using the enhanced horizontal gradient and stable vertical differentiation
- Phase change of the Ordovician hydrocarbon in the Tarim Basin: A case study from the Halahatang–Shunbei area
- Using interpretative structure model and analytical network process for optimum site selection of airport locations in Delta Egypt
- Geochemistry of magnetite from Fe-skarn deposits along the central Loei Fold Belt, Thailand
- Functional typology of settlements in the Srem region, Serbia
- Hunger Games Search for the elucidation of gravity anomalies with application to geothermal energy investigations and volcanic activity studies
- Addressing incomplete tile phenomena in image tiling: Introducing the grid six-intersection model
- Evaluation and control model for resilience of water resource building system based on fuzzy comprehensive evaluation method and its application
- MIF and AHP methods for delineation of groundwater potential zones using remote sensing and GIS techniques in Tirunelveli, Tenkasi District, India
- New database for the estimation of dynamic coefficient of friction of snow
- Measuring urban growth dynamics: A study in Hue city, Vietnam
- Comparative models of support-vector machine, multilayer perceptron, and decision tree predication approaches for landslide susceptibility analysis
- Experimental study on the influence of clay content on the shear strength of silty soil and mechanism analysis
- Geosite assessment as a contribution to the sustainable development of Babušnica, Serbia
- Using fuzzy analytical hierarchy process for road transportation services management based on remote sensing and GIS technology
- Accumulation mechanism of multi-type unconventional oil and gas reservoirs in Northern China: Taking Hari Sag of the Yin’e Basin as an example
- TOC prediction of source rocks based on the convolutional neural network and logging curves – A case study of Pinghu Formation in Xihu Sag
- A method for fast detection of wind farms from remote sensing images using deep learning and geospatial analysis
- Spatial distribution and driving factors of karst rocky desertification in Southwest China based on GIS and geodetector
- Physicochemical and mineralogical composition studies of clays from Share and Tshonga areas, Northern Bida Basin, Nigeria: Implications for Geophagia
- Geochemical sedimentary records of eutrophication and environmental change in Chaohu Lake, East China
- Research progress of freeze–thaw rock using bibliometric analysis
- Mixed irrigation affects the composition and diversity of the soil bacterial community
- Examining the swelling potential of cohesive soils with high plasticity according to their index properties using GIS
- Geological genesis and identification of high-porosity and low-permeability sandstones in the Cretaceous Bashkirchik Formation, northern Tarim Basin
- Usability of PPGIS tools exemplified by geodiscussion – a tool for public participation in shaping public space
- Efficient development technology of Upper Paleozoic Lower Shihezi tight sandstone gas reservoir in northeastern Ordos Basin
- Assessment of soil resources of agricultural landscapes in Turkestan region of the Republic of Kazakhstan based on agrochemical indexes
- Evaluating the impact of DEM interpolation algorithms on relief index for soil resource management
- Petrogenetic relationship between plutonic and subvolcanic rocks in the Jurassic Shuikoushan complex, South China
- A novel workflow for shale lithology identification – A case study in the Gulong Depression, Songliao Basin, China
- Characteristics and main controlling factors of dolomite reservoirs in Fei-3 Member of Feixianguan Formation of Lower Triassic, Puguang area
- Impact of high-speed railway network on county-level accessibility and economic linkage in Jiangxi Province, China: A spatio-temporal data analysis
- Estimation model of wild fractional vegetation cover based on RGB vegetation index and its application
- Lithofacies, petrography, and geochemistry of the Lamphun oceanic plate stratigraphy: As a record of the subduction history of Paleo-Tethys in Chiang Mai-Chiang Rai Suture Zone of Thailand
- Structural features and tectonic activity of the Weihe Fault, central China
- Application of the wavelet transform and Hilbert–Huang transform in stratigraphic sequence division of Jurassic Shaximiao Formation in Southwest Sichuan Basin
- Structural detachment influences the shale gas preservation in the Wufeng-Longmaxi Formation, Northern Guizhou Province
- Distribution law of Chang 7 Member tight oil in the western Ordos Basin based on geological, logging and numerical simulation techniques
- Evaluation of alteration in the geothermal province west of Cappadocia, Türkiye: Mineralogical, petrographical, geochemical, and remote sensing data
- Numerical modeling of site response at large strains with simplified nonlinear models: Application to Lotung seismic array
- Quantitative characterization of granite failure intensity under dynamic disturbance from energy standpoint
- Characteristics of debris flow dynamics and prediction of the hazardous area in Bangou Village, Yanqing District, Beijing, China
- Rockfall mapping and susceptibility evaluation based on UAV high-resolution imagery and support vector machine method
- Statistical comparison analysis of different real-time kinematic methods for the development of photogrammetric products: CORS-RTK, CORS-RTK + PPK, RTK-DRTK2, and RTK + DRTK2 + GCP
- Hydrogeological mapping of fracture networks using earth observation data to improve rainfall–runoff modeling in arid mountains, Saudi Arabia
- Petrography and geochemistry of pegmatite and leucogranite of Ntega-Marangara area, Burundi, in relation to rare metal mineralisation
- Prediction of formation fracture pressure based on reinforcement learning and XGBoost
- Hazard zonation for potential earthquake-induced landslide in the eastern East Kunlun fault zone
- Monitoring water infiltration in multiple layers of sandstone coal mining model with cracks using ERT
- Study of the patterns of ice lake variation and the factors influencing these changes in the western Nyingchi area
- Productive conservation at the landslide prone area under the threat of rapid land cover changes
- Sedimentary processes and patterns in deposits corresponding to freshwater lake-facies of hyperpycnal flow – An experimental study based on flume depositional simulations
- Study on time-dependent injectability evaluation of mudstone considering the self-healing effect
- Detection of objects with diverse geometric shapes in GPR images using deep-learning methods
- Behavior of trace metals in sedimentary cores from marine and lacustrine environments in Algeria
- Spatiotemporal variation pattern and spatial coupling relationship between NDVI and LST in Mu Us Sandy Land
- Formation mechanism and oil-bearing properties of gravity flow sand body of Chang 63 sub-member of Yanchang Formation in Huaqing area, Ordos Basin
- Diagenesis of marine-continental transitional shale from the Upper Permian Longtan Formation in southern Sichuan Basin, China
- Vertical high-velocity structures and seismic activity in western Shandong Rise, China: Case study inspired by double-difference seismic tomography
- Spatial coupling relationship between metamorphic core complex and gold deposits: Constraints from geophysical electromagnetics
- Disparities in the geospatial allocation of public facilities from the perspective of living circles
- Research on spatial correlation structure of war heritage based on field theory. A case study of Jinzhai County, China
- Formation mechanisms of Qiaoba-Zhongdu Danxia landforms in southwestern Sichuan Province, China
- Magnetic data interpretation: Implication for structure and hydrocarbon potentiality at Delta Wadi Diit, Southeastern Egypt
- Deeply buried clastic rock diagenesis evolution mechanism of Dongdaohaizi sag in the center of Junggar fault basin, Northwest China
- Application of LS-RAPID to simulate the motion of two contrasting landslides triggered by earthquakes
- The new insight of tectonic setting in Sunda–Banda transition zone using tomography seismic. Case study: 7.1 M deep earthquake 29 August 2023
- The critical role of c and φ in ensuring stability: A study on rockfill dams
- Evidence of late quaternary activity of the Weining-Shuicheng Fault in Guizhou, China
- Extreme hydroclimatic events and response of vegetation in the eastern QTP since 10 ka
- Spatial–temporal effect of sea–land gradient on landscape pattern and ecological risk in the coastal zone: A case study of Dalian City
- Study on the influence mechanism of land use on carbon storage under multiple scenarios: A case study of Wenzhou
- A new method for identifying reservoir fluid properties based on well logging data: A case study from PL block of Bohai Bay Basin, North China
- Comparison between thermal models across the Middle Magdalena Valley, Eastern Cordillera, and Eastern Llanos basins in Colombia
- Mineralogical and elemental analysis of Kazakh coals from three mines: Preliminary insights from mode of occurrence to environmental impacts
- Chlorite-induced porosity evolution in multi-source tight sandstone reservoirs: A case study of the Shaximiao Formation in western Sichuan Basin
- Predicting stability factors for rotational failures in earth slopes and embankments using artificial intelligence techniques
- Origin of Late Cretaceous A-type granitoids in South China: Response to the rollback and retreat of the Paleo-Pacific plate
- Modification of dolomitization on reservoir spaces in reef–shoal complex: A case study of Permian Changxing Formation, Sichuan Basin, SW China
- Geological characteristics of the Daduhe gold belt, western Sichuan, China: Implications for exploration
- Rock physics model for deep coal-bed methane reservoir based on equivalent medium theory: A case study of Carboniferous-Permian in Eastern Ordos Basin
- Enhancing the total-field magnetic anomaly using the normalized source strength
- Shear wave velocity profiling of Riyadh City, Saudi Arabia, utilizing the multi-channel analysis of surface waves method
- Effect of coal facies on pore structure heterogeneity of coal measures: Quantitative characterization and comparative study
- Inversion method of organic matter content of different types of soils in black soil area based on hyperspectral indices
- Detection of seepage zones in artificial levees: A case study at the Körös River, Hungary
- Tight sandstone fluid detection technology based on multi-wave seismic data
- Characteristics and control techniques of soft rock tunnel lining cracks in high geo-stress environments: Case study of Wushaoling tunnel group
- Influence of pore structure characteristics on the Permian Shan-1 reservoir in Longdong, Southwest Ordos Basin, China
- Study on sedimentary model of Shanxi Formation – Lower Shihezi Formation in Da 17 well area of Daniudi gas field, Ordos Basin
- Multi-scenario territorial spatial simulation and dynamic changes: A case study of Jilin Province in China from 1985 to 2030
- Review Articles
- Major ascidian species with negative impacts on bivalve aquaculture: Current knowledge and future research aims
- Prediction and assessment of meteorological drought in southwest China using long short-term memory model
- Communication
- Essential questions in earth and geosciences according to large language models
- Erratum
- Erratum to “Random forest and artificial neural network-based tsunami forests classification using data fusion of Sentinel-2 and Airbus Vision-1 satellites: A case study of Garhi Chandan, Pakistan”
- Special Issue: Natural Resources and Environmental Risks: Towards a Sustainable Future - Part I
- Spatial-temporal and trend analysis of traffic accidents in AP Vojvodina (North Serbia)
- Exploring environmental awareness, knowledge, and safety: A comparative study among students in Montenegro and North Macedonia
- Determinants influencing tourists’ willingness to visit Türkiye – Impact of earthquake hazards on Serbian visitors’ preferences
- Application of remote sensing in monitoring land degradation: A case study of Stanari municipality (Bosnia and Herzegovina)
- Optimizing agricultural land use: A GIS-based assessment of suitability in the Sana River Basin, Bosnia and Herzegovina
- Assessing risk-prone areas in the Kratovska Reka catchment (North Macedonia) by integrating advanced geospatial analytics and flash flood potential index
- Analysis of the intensity of erosive processes and state of vegetation cover in the zone of influence of the Kolubara Mining Basin
- GIS-based spatial modeling of landslide susceptibility using BWM-LSI: A case study – city of Smederevo (Serbia)
- Geospatial modeling of wildfire susceptibility on a national scale in Montenegro: A comparative evaluation of F-AHP and FR methodologies
- Geosite assessment as the first step for the development of canyoning activities in North Montenegro
- Urban geoheritage and degradation risk assessment of the Sokograd fortress (Sokobanja, Eastern Serbia)
- Multi-hazard modeling of erosion and landslide susceptibility at the national scale in the example of North Macedonia
- Understanding seismic hazard resilience in Montenegro: A qualitative analysis of community preparedness and response capabilities
- Forest soil CO2 emission in Quercus robur level II monitoring site
- Characterization of glomalin proteins in soil: A potential indicator of erosion intensity
- Power of Terroir: Case study of Grašac at the Fruška Gora wine region (North Serbia)
- Special Issue: Geospatial and Environmental Dynamics - Part I
- Qualitative insights into cultural heritage protection in Serbia: Addressing legal and institutional gaps for disaster risk resilience