Petrography and geochemistry of pegmatite and leucogranite of Ntega-Marangara area, Burundi, in relation to rare metal mineralisation
-
Quesnay de Jésus Akabahinga
 ,
Anthony Temidayo Bolarinwa
,
Anthony Temidayo Bolarinwa

Abstract
The Ntega-Marangara area, part of the Kanyaru supergroup, Western Domain of Karagwe Ankole Belt, hosts numerous pegmatite veins related to the leucogranite. This investigation aims to characterise the granitoids, their alteration products, and rare metal mineralisation potentials. Quartz, plagioclase, microcline, albite, and muscovite are the essential minerals in both the pegmatite and leucogranite. The ΣREE of the pegmatite and leucogranite are 147 and 102 ppm, respectively. The greisen with Rb, Cs, Ta, Li, Nb, and Sn of 5,940, 1,015, >2,500, 130, 1,595, and 671 ppm, respectively, is higher than the corresponding values of 636, 62, 32, 74, 58, and 110 ppm of the kaolinised pegmatites. This enrichment classifies them as lithium–caesium–tantalum pegmatite. The mean K/Rb, K/Cs, and Nb/Ta in the leucogranites are 106.86, 2819.24, and 4.30, pegmatite is 35.33, 469.47, and 3.1, and greisen is 14.05, 82.2, and 0.64, respectively, which suggest that greisenisation due to metasomatic reactions of late hydrothermal activity could have increased the potential for rare metal mineralisation of the altered pegmatite. Pegmatite of Ntega-Marangara area is enriched in LREE relative to HREE with K/Rb ratio <100, indicating a high level of fractionation and mineralisation in Ta–Nb, Sn, and Li in contrast to the leucogranite that is less fractionated and barren.
1 Introduction
Pegmatites are coarse-grained crystalline rocks with large crystals of feldspars, quartz, and micas. Apart from their coarse-grained crystals, they are compositionally similar to granites with which they are often contiguous [1]. Research has shown that pegmatites could be formed from the crystallisation of residual melt during the magmatic segregation of andesitic magmas. Pegmatites often contain some rare elements including tantalum, niobium, tin, illtungsten, and beryllium, as well as semiprecious gemstones including garnet, tourmaline, and beryl. That is due to the fact that the residual melt from the magmatic segregation of andesitic magmas may be enriched in heavy metals and rare earth elements [2,3].
Previous studies in the Karagwe Ankole Belt (KAB) have shown that it is a metallogenic province noted for Nb–Ta-, Sn-, and W-bearing granitic pegmatites and quartz veins [4,5,6,7,8,9]. These mineralisations are related to the evolution of KAB in the early Neoproterozoic [10,11]. Many of this research was carried out in the neighbouring country of Rwanda with minor efforts on the rocks of northwestern Burundi and none in the northeast where the Ntega-Marangara area, the current study area is located. The Ntega-Marangara area is located in northeastern Burundi between longitudes 29°54′ and 30°06′E and latitudes 2°30′ and 2°48′S.
The aim of this investigation is to determine the petrology, geochemistry, and trace and rare-earth element mineralisation of the pegmatites within the Ntega-Marangara area. This is expected to contribute geological and geochemical data that would be useful in the preliminary assessment of the rare metal mineralisation of the pegmatite in this part of Burundi, which had hitherto not been investigated.
2 Geological setting
Ntega-Marangara area is located in Burundi within KAB which forms the northeastern continuation of the Kibara Belt (KIB) within the Democratic Republic of Congo (DRC) (Figure 1a). The KAB encompasses Kivu and Maniema, DRC provinces, Burundi and Rwanda, south-west of Uganda (Ankole), and north-west of Tanzania (Karagwe) regions [10,12]. The KAB and KIB show similarities in sedimentation, magmatism, and deformation histories and are structurally separated from each other by the uplifted, NW-SE trending Rusizi-Ubende Belt [10]. They are assimilated in an intracontinental orogeny, which evolved between the Archaean-Palaeoproterozoic Tanzania craton in the East, the Mesoproterozoic Bangueulu block in the South, and the Archaean-Palaeoproterozoic craton in the West, all within the Archaean-Palaeoproterozoic layers extensively affected by the 2.2- and 1.9-Ga Eburnean events [12,13,14]. Investigations using U-Pb SHRIMP data showed that the Palaeo and Mesoproterozoic metasedimentary rocks of the KAB are intruded by two generations of granites, which are the barren granites (1,380 ± 10 Ma) and the tin granites (ca. 986 ± 10 Ma) [5,10,15].
![Figure 1
(a) Location of KAB in Africa modified after Nambaje et al. [55]. (b) Location of Ntega-Marangara area within the KAB in northern Burundi [8].](/document/doi/10.1515/geo-2022-0697/asset/graphic/j_geo-2022-0697_fig_001.jpg)
The KAB is divided into two domains (Figure 1b) namely a Western Domain (WD) with Paleoproterozoic basement and an Eastern Domain (ED) with Archean basement, separated by the mafic and ultra-mafic Kabanga-Musongati (KM) alignment, with each domain representing independent sub-basins [8,10]. Sediments in these intracratonic KAB basins were mostly deposited between 1,800 and 986 Ma [12].
The WD is made of strongly deformed metasedimentary rocks and some small metavolcanic units, which were intruded by numerous S-type granitic associated mafic rocks of 1,375 Ma [10,16,17], A-type granites of 1,205 Ma [10,18], and the late tin-granites (986 ± 10 Ma [10]; 950–1,020 Ma [19] which are considered to be the source of rare metals (Nb–Ta and Sn) bearing pegmatites [20,21,22,23,24,25].
The ED is characterised by a near-to-total absence of granites and progressive reduction of deformation and grade of metamorphism eastward [10]. Mineralisations are absent except for some clues of gold in Cankuzo province, eastern Burundi.
The study area which is located in northeastern Burundi forms a part of the WD of the KAB locally corresponding to the Kanyaru supergroup. Based on their relative ages, three main geological formations are encountered including the Rukago formation, which belongs to the lower group of the Kanyaru supergroup. It consists of greyish-to-greenish phyllites/mica schists and quartzitic intercalations. The mica schists are more pronounced close to the granite intrusions. Next is the Ruganza formation, which belongs to the mid-group of the Kanyaru supergroup. It consists mainly of white metaquartzite consisting of parallel layers of alternating greyish, massive, and homogeneous metaquatzites locally intercalated with phyllites. This is followed by the formation of Ngozi, which consists of schist, phyllites, and mica schist [28]. That formation is marked by discontinuous intercalations of volcano-sedimentary rocks. The formations of Rukago, Ruganza, and Ngozi are mesoproterosoic in age (Figure 2). These rocks are cut across by granite, pegmatites, and mafic plutons [28,29].
![Figure 2
Geological formations within the Ntega-Marangara area modified after Claessens and Dreesen [28] based on field observations.](/document/doi/10.1515/geo-2022-0697/asset/graphic/j_geo-2022-0697_fig_002.jpg)
Geological formations within the Ntega-Marangara area modified after Claessens and Dreesen [28] based on field observations.
3 Ore deposit geology
The central mezoproterozoic KAB hosts a metallogenic province made of numerous granite-related ore deposits [10,12]. The paragenetic association of metals in those deposits is defined by the Nb–Ta, Sn, W, Be, and Li association, whose host minerals are cassiterite (SnO2), columbite-tantalite ((Nb,Ta)2O5), wolframite ((Fe,Mn)WO4), beryl (Be3Al2Si6O18), spodumene (LiAlSi2O6), and amblygonite ((Li,Na)AlFPO4) [6,8,11,25,26]. Those mineralisations are described to be occurring as Nb–Ta–Sn pegmatite, Sn greisen, and W–Sn hydrothermal quartz vein deposits [4,27]. Accessory minerals such as spodumene, apatite, amblygonite, tourmaline, and beryl are found associated with the above-mentioned mineralisations [11]. Additionally, it was mentioned that rare metal-bearing pegmatites are economically exploited in northwestern Burundi for their columbite-tantalite and cassiterite contents [25].
The rare metal-bearing pegmatites in that part of KAB are said to be related to the fertile, alkaline, peraluminous granite dated 986 ± 10 Ma [9,10,30]. The columbite–tantalite-mineralised pegmatites are dated ∼965 Ma [31,32], indicating that they post-dated their parental granite. Their emplacement preceded the cassiterite mineralised quartz veins described as related to the deformation of the Kibara-Karagwe Ankole orogeny in 869 ± 7 Ma [15]. The 40Ar–39Ar age obtained on muscovite associated with the mineralisation, and the associated alterations, including silicification, tourmalinisation, muscovitisation, and sericitisation, within the country rock were reported by [10,15].
4 Methodology
Geological mapping and rock sampling were carried out in the Ntega-Marangara area. Thirteen representative chip, fresh pegmatite, and leucogranite rock samples and their altered derivatives were collected randomly based on the availability of rock outcrops in the area. The samples consist of nine (9) kaolinised pegmatites, two (2) leucogranites, one (1) fresh pegmatite, and one (1) greisen because the focus of the study was to determine the concentration of rare metals in the kaolinised pegmatite compared to the fresh pegmatite and associated leucogranite.
Thin section of the fresh rock samples was produced and observed with a transmitted polarised light microscope equipped with a Nikon D3400 camera which allowed the production of photomicrographs. Split samples were pulverised, packaged, and sent to ALS Laboratory in Johannesburg, South Africa for geochemical analyses. The inductively coupled plasma-mass spectrometry (ICP-MS) analytical method was used to analyse the trace elements except for lithium in the sample by using lithium borate (LiBO2/Li2B4O7) fusion. A prepared sample (0.100 g) is added to lithium metaborate/lithium tetraborate flux, mixed well, and fused in a furnace at 1,025°C. The resulting melt is then cooled and dissolved in an acid mixture of nitric, hydrochloric, and hydrofluoric acids. This solution is then analysed by ICP-MS using the 7700× Agilent.
Pulverised rock samples are added to lithium metaborate/lithium tetraborate flux, mixed, and fused in a furnace at 1,000°C. The resulting melt is then cooled and dissolved in 100 mL of 4% nitric acid/2% hydrochloric acid. This solution is then analysed by inductively coupled plasma-atomic emission spectrometry (ICP-AES) and the results are corrected for spectral inter-element interferences. Major oxide concentration is calculated from the determined elemental concentration. The measured powdered sample (1 g) is weighed, placed in an oven at 1,000°C for 1 h, cooled, and then weighed again. The percent loss on ignition is calculated from the difference in weight before and after ignition.
Lithium as one of the elements of interest in the study was analysed using the ICP-AES method by 4 acid digestion. The house standard and references as well as two duplicates from the submitted samples were used for calibration and quality control. The geochemical data were processed using Office Excel and GCD kit tool for various plots and diagrams used in the data interpretation.
5 Results and discussion
5.1 Field occurrence and petrography of granites and pegmatites
The Ntega-Marangara area is made of geological units including the schist formation of Rukago, the quartzitic formation of Ruganza, the schist formation of Ngozi, the two mica granites, mafic rocks, leucogranite, as well as the dominantly NE-SW trending pegmatite veins (Figure 2). This study is mainly on the geology, geochemistry, and rare metal mineralisation of the leucogranite and the pegmatite.
5.2 Leucogranite
The leucogranite occurs around Mwendo hill, intruding the schist formation of Ngozi. It outcrops as a massif intrusion and is generally not weathered. The leucogranite is in turn intruded by numerous pegmatite veins (Figure 3a). In the hand specimen, leucogranite is marked by the abundance of felsic minerals, such as feldspars, quartz, and muscovite (Figure 3b) coexisting with millimetric crystals of tourmaline in some parts of the outcrop.

(a) Leucogranite intruded by pegmatite veins at Ntega; (b) hand specimen of the leucogranite; photomicrographs of (c) leucogranite showing graphic texture of quartz and plagioclase and (d) crystals of microcline, muscovite plagioclase and quartz. Peg: pegmatite; Ms: muscovite; Qz: quartz; Mi: microcline; Pl: plagioclase; Ab: albite.
Petrographic studies showed that the leucogranite is composed of plagioclase, microcline, quartz, and muscovite (Figure 3c and d). The leucogranite displays a graphic texture. Quartz is recognised by its clear first-order yellow colouration and its weak relief. Plagioclase displays a parallel multiple twinning, whereas microcline presents a cross-hatch polysynthetic twinning. Few un-twinned tabular albite crystals with weak relief occur within the microcline to produce micro-perthite. The leucogranite is also characterised by the intergrowth of xenomorphic quartz crystals into plagioclase (Figure 3c). Sheets and plates of muscovite within the leucogranite lack any definite preferred orientation.
The leucogranite in the Ntega-Marangara area is said to correspond to the 986-Ma granite of the Kasika massif in the Itombwe region, DRC [10]. That age is similar to 950–1,030 Ma measured on similar rock samples from the KAB [19]. The leucogranite has been interpreted to be the feeder of the different pegmatite facies hosting Nb–Ta and Sn in the Ntega-Marangara area. The leucogranite resulted from the late- to post-tectonics kinematic relaxation of the KAB after the compression event around 1 Ga in the Irumid chain in Zambia [10]. Similar granite in the Gatumba region is regarded as the source of the zoned pegmatites of this region exploited for columbite-tantalite and cassiterite [20,26,33].
5.3 Pegmatites
The NE-SW trending pegmatite dykes in the Ntega-Marangara area occur as intrusions in the Rukago, Ruganza, and Ngozi formations. They are mainly concordant with the foliation in the host rock. The variation in size depends on the nature of the host rock in which they have been emplaced. They are mainly fresh pegmatites, kaolinised pegmatites, and greisen.
Fresh pegmatites were found intruding the leucogranite directly (Figure 4c) around Mwendo. They form centimetric folded veins in which large crystals of feldspar, muscovite, quartz, and tourmaline may be identified in hand specimens (Figure 4d). Fresh pegmatite is rare in the study area due to weathering. Petrographic studies revealed that fresh pegmatites are made of very large crystals of plagioclase and microcline, quartz, and muscovite. Inclusions of muscovite in plagioclase were observed in thin sections. Pethitic features, marked by the intergrowth of plagioclase and microcline, were also common (Figure 4e).

(a) A kaolinized pegmatite body crosscut by a quartz vein at Ntega; (b) presence of tourmaline in pegmatite; (c) pegmatite vein cutting across leucogranite; (d) hand specimen of the fresh pegmatite from Ntega; and (e) photomicrograph of pegmatite showing large crystals of plagioclases within the fresh pegmatite and inclusions of muscovite inside plagioclase feldspars. Ms: muscovite; Qz: quartz; Mi: microcline; Pl: plagioclase; Ab: albite.
5.4 Kaolinised pegmatites
Pegmatites were subjected to kaolinisation in some localities namely Ntega, Murehe, Nyunzwe, and Mwendo. Kaolinised pegmatite veins occur in the form of vein-shaped bodies mainly within the metapelitic formations except in the western part of the study area where those pegmatites are hosted in the quartzite. Those pegmatites are, cross-cut by centimetric quartz veins and/or fractures as noted in the pegmatite body around Ntega (Figure 4a). Their width ranged from a few centimetres to metres and may extend to 200 m in length. They are composed of kaolinised feldspars, white micas, as well as milky and saccharoidal quartz grains. Black, elongated, and striated tourmaline (schorl) (Figure 4b) occur as accessory minerals in the kaolinised pegmatites.
5.5 Greisen
The greisen occurs within and/or at the periphery of the kaolinised pegmatite bodies. A typical occurrence at Gisitwe Hill, which was about 1.0 m wide and 10 m long is within a pegmatite body of about 5 m wide but close to the contact with Ngozi schist formation. It occupies a zone roughly N–S trending and is recognised through its greenish colour (Figure 5a), and the high proportion of millimetric white to greenish mica randomly arranged. Petrographic studies revealed that it is mainly made of muscovite, albite, microcline, and some opaque minerals (Figure 5b and c). The muscovite has been highly sericitised.
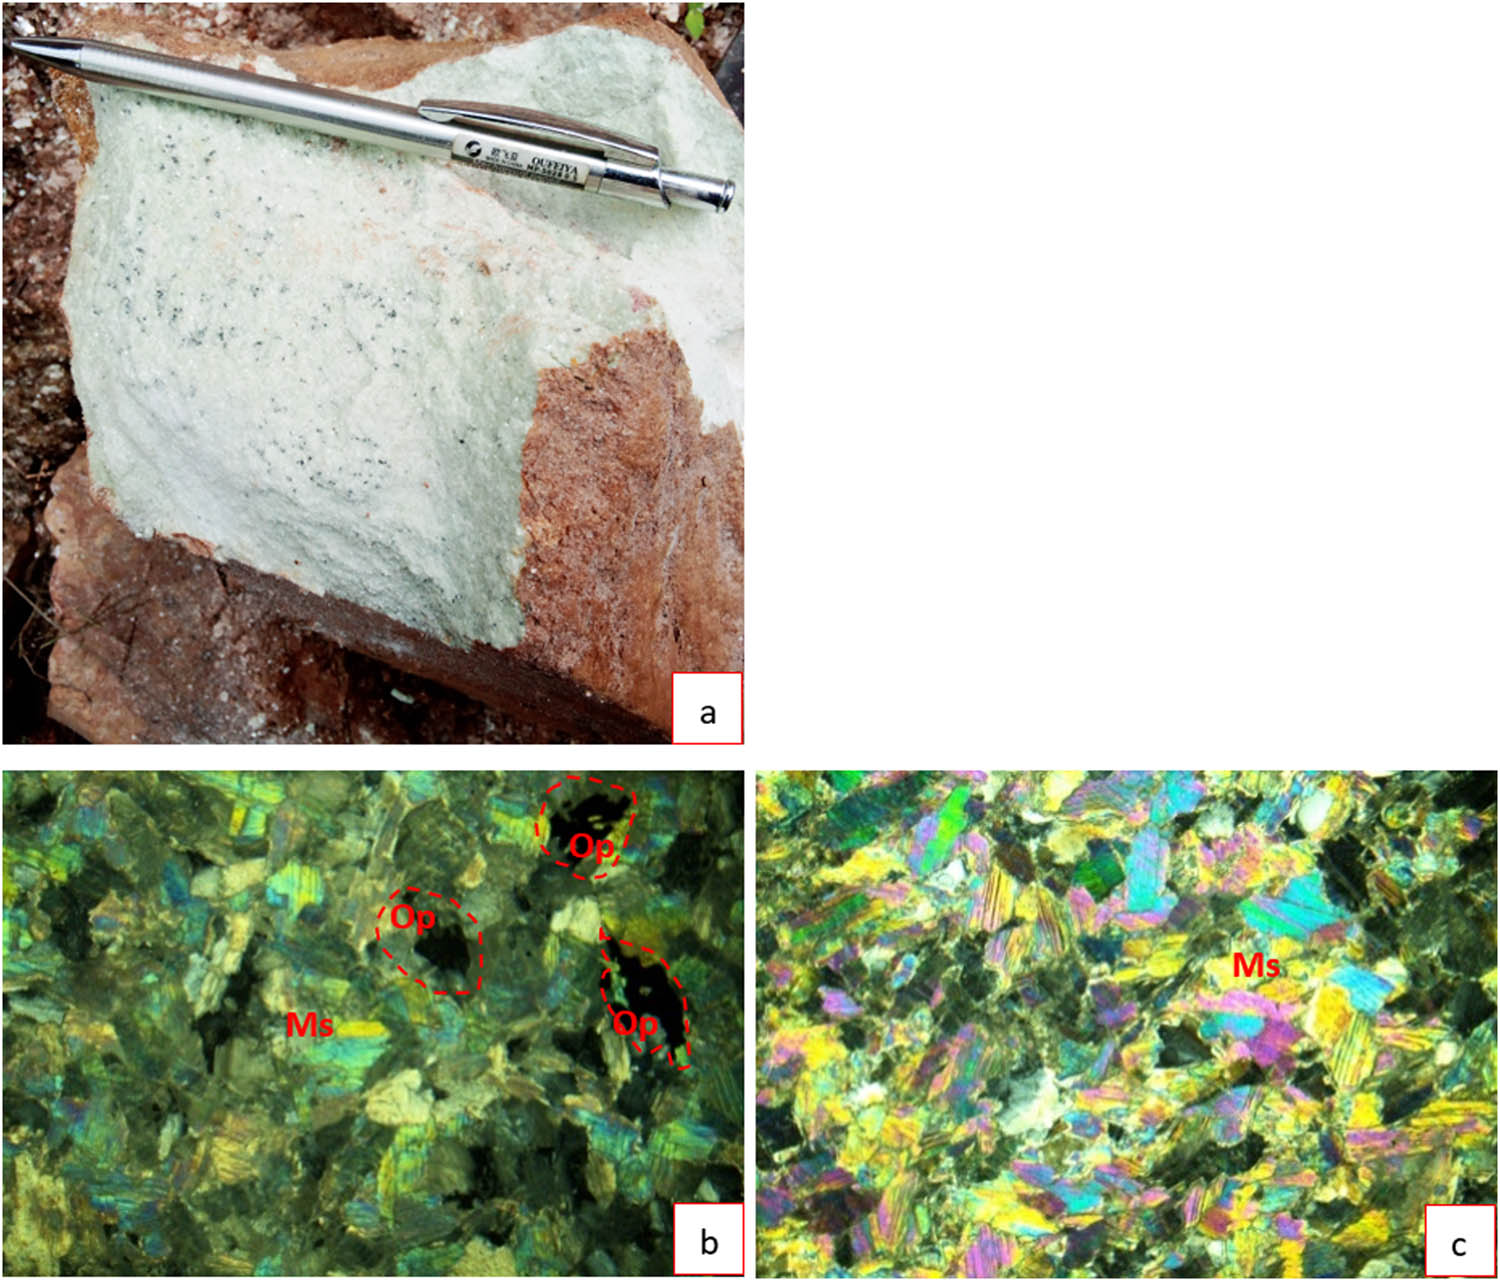
(a) Hand specimen of greisen, the black spots could be Nb–Ta group minerals; photomicrographs of greisen showing: (b) medium sheets of muscovite and opaque minerals and (c) large proportion of muscovite. Ms: muscovite; Op: opaque minerals.
6 Geochemistry of pegmatites and leucogranites
6.1 Major oxides
The major oxide composition of the Ntega-Marangara pegmatites and leucogranites in wt% is presented in Table 1. The results revealed the dominance of SiO2 in the leucogranite, fresh pegmatite, and kaolinised pegmatite with mean values 74.20, 77.40, and 73.24 wt%, respectively, indicating highly siliceous rocks and weathered material, whereas greisenised pegmatite displays a relatively low mean value of SiO2 of 45.50 wt%. The alumina (Al2O3) content was 14.88, 12.65, and 17.52 wt% in the leucogranite, fresh pegmatite, and kaolinised pegmatite, respectively, and 36.80 wt% in the greisen. The mean values of Na2O are 4.11, 6.31, 0.13, and 0.55 wt% for the leucogranite, fresh pegmatite, kaolinised pegmatite, and greisen, correspondingly. Those of K2O are 4.94, 0.40, 2.18, and 10.05 wt% for the leucogranite, fresh pegmatite, kaolinised pegmatite, and greisen, respectively. The rock classification diagram, after Middlemost [34], indicated some alteration of the granitoids (Figure 6). The rock classification diagram of the leucogranite and pegmatite actually showed the low alkalis (Na2O + K2O) of the kaolinised pegmatite compared to the unaltered pegmatite.
Chemical composition (wt%) of the whole rock pegmatite and leucogranite
| WP | LGR | FP | GRS | |||||||||||
|---|---|---|---|---|---|---|---|---|---|---|---|---|---|---|
| BR01 | BU01 | BV02 | GI01 | GI02 | NZ01 | NZ02 | RU01 | RU02 | JA01 | JA02 | JA03 | BV01 | ||
| SiO2 | 70.40 | 78.90 | 66.40 | 69.00 | 76.10 | 74.60 | 75.50 | 66.30 | 82.00 | 72.50 | 75.90 | 77.40 | 45.50 | |
| TiO2 | 0.01 | 0.05 | 0.01 | 0.02 | 0.02 | 0.12 | 0.10 | 0.03 | 0.09 | bdl | 0.01 | bdl | 0.06 | |
| Al2O3 | 18.45 | 14.65 | 23.30 | 20.60 | 16.15 | 17.15 | 15.05 | 22.30 | 10.05 | 14.75 | 15.00 | 12.65 | 36.80 | |
| Fe2O3 | 1.06 | 1.18 | 1.22 | 1.06 | 1.25 | 1.97 | 2.02 | 1.52 | 1.85 | 0.63 | 1.31 | 0.93 | 1.31 | |
| MnO | 0.10 | 0.05 | 0.04 | 0.01 | 0.02 | 0.02 | 0.02 | 0.02 | 0.02 | 0.03 | 0.03 | 0.06 | 0.19 | |
| MgO | 0.09 | 0.17 | 0.10 | 0.10 | 0.12 | 0.07 | 0.06 | 0.07 | 0.05 | 0.05 | 0.09 | 0.08 | 0.16 | |
| CaO | 0.10 | 0.13 | 0.05 | 0.02 | 0.03 | 0.06 | 0.04 | 0.03 | 0.04 | 0.17 | 0.67 | 0.41 | 0.10 | |
| Na2O | 0.09 | 0.25 | 0.15 | 0.10 | 0.08 | 0.12 | 0.13 | 0.13 | 0.11 | 2.22 | 5.99 | 6.31 | 0.55 | |
| K2O | 1.58 | 3.48 | 2.75 | 1.68 | 1.60 | 2.48 | 2.48 | 1.92 | 1.69 | 8.70 | 1.18 | 0.40 | 10.05 | |
| P2O5 | 0.02 | 0.02 | bdl | 0.01 | bdl | bdl | 0.01 | 0.01 | 0.01 | 0.19 | 0.14 | 0.13 | 0.01 | |
| LOI | 6.34 | 2.77 | 6.75 | 6.93 | 5.01 | 4.90 | 4.03 | 7.38 | 3.09 | 0.61 | 1.06 | 0.66 | 4.82 | |
| Total | 98.27 | 101.72 | 100.79 | 99.53 | 100.39 | 101.51 | 99.46 | 99.71 | 99.02 | 99.88 | 101.4 | 99.06 | 99.62 | |
| Trace elements (ppm) | ||||||||||||||
| Ba | 119.0 | 252.0 | 129.0 | 23.3 | 27.2 | 45.9 | 68.0 | 42.5 | 77.6 | 50.4 | 33.8 | 38.7 | 319.0 | |
| Cr | 20.0 | 13.0 | 8.0 | 12.0 | 13.0 | 25.0 | 23.0 | 16.0 | 29.0 | 10.0 | 12.0 | 15.0 | bdl | |
| Cs | 42.7 | 54.7 | 104.0 | 18.8 | 24.2 | 122.5 | 97.2 | 80.5 | 12.9 | 16.7 | 7.5 | 4.9 | 1015.0 | |
| Ga | 33.8 | 40.3 | 52.3 | 28.6 | 22.5 | 25.6 | 23.0 | 27.1 | 15.3 | 9.9 | 18.7 | 14.7 | 99.4 | |
| Hf | 4.6 | 0.6 | 2.3 | 2.6 | 1.3 | 1.7 | 2.3 | 6.0 | 1.5 | 0.2 | 1.4 | 1.2 | 11.1 | |
| Nb | 48.2 | 71.5 | 80.3 | 30.1 | 22.7 | 64.5 | 69.8 | 105.0 | 32.1 | 4.6 | 16.0 | 19.2 | 1595.0 | |
| Rb | 568.0 | 779.0 | 1150.0 | 313.0 | 337.0 | 926.0 | 715.0 | 684.0 | 253.0 | 523.0 | 129.5 | 55.7 | 5940.0 | |
| Sn | 68.3 | 140.5 | 164.0 | 41.6 | 101.0 | 173.5 | 109.0 | 101.0 | 92.0 | 2.9 | 7.7 | 6.6 | 671.0 | |
| Sr | 198.5 | 316.0 | 114.5 | 42.6 | 83.7 | 158.5 | 99.6 | 84.6 | 116.0 | 193.5 | 171.0 | 256.0 | 273.0 | |
| Ta | 14.9 | 8.4 | 35.6 | 14.3 | 4.1 | 19.0 | 47.0 | 123.0 | 23.7 | 1.7 | 2.7 | 8.4 | > 2500 | |
| Th | 1.7 | 0.8 | 1.6 | 1.5 | 1.2 | 6.1 | 3.7 | 4.5 | 3.7 | 0.5 | 2.2 | 3.0 | 1.6 | |
| U | 1.2 | 0.3 | 1.4 | 1.6 | 1.0 | 0.4 | 1.4 | 2.3 | 0.9 | 2.0 | 11.2 | 3.4 | 8.0 | |
| W | 2.6 | 4.4 | 2.7 | 1.9 | 1.9 | 2.8 | 2.3 | 1.6 | 1.8 | 1.1 | 1.4 | 1.1 | 14.2 | |
| Y | 2.6 | 0.6 | 1.4 | 0.7 | 0.6 | 0.8 | 1.2 | 1.9 | 2.0 | 1.7 | 10.8 | 10.4 | 1.0 | |
| Zr | 40.0 | 8.0 | 23.0 | 39.0 | 26.0 | 56.0 | 41.0 | 69.0 | 37.0 | 4.0 | 27.0 | 21.0 | 21.0 | |
| Li | 100.0 | 100.0 | 60.0 | 10.0 | 20.0 | 140.0 | 60.0 | 110.0 | 70.0 | 10.0 | 80.0 | 20.0 | 130.0 | |
| Pb | 25.0 | 8.0 | 16.0 | 9.0 | 8.0 | 27.0 | 86.0 | 70.0 | 23.0 | 197.0 | 42.0 | 15.0 | 80.0 | |
| REEs (ppm) | ||||||||||||||
| La | 65.10 | 57.00 | 26.80 | 11.80 | 17.60 | 32.30 | 25.10 | 27.50 | 21.30 | 28.70 | 28.80 | 42.10 | 44.00 | |
| Ce | 221.00 | 102.50 | 47.30 | 24.20 | 33.20 | 53.50 | 42.10 | 43.10 | 46.40 | 48.30 | 49.10 | 69.20 | 76.80 | |
| Pr | 11.70 | 10.20 | 4.89 | 2.59 | 3.41 | 5.07 | 3.98 | 4.69 | 3.47 | 4.81 | 4.84 | 6.89 | 7.16 | |
| Nd | 33.40 | 30.90 | 16.00 | 8.20 | 10.00 | 14.60 | 12.00 | 14.00 | 9.80 | 13.30 | 15.00 | 19.60 | 20.40 | |
| Sm | 2.72 | 2.13 | 1.90 | 0.86 | 0.94 | 1.04 | 0.77 | 1.57 | 1.08 | 0.90 | 2.03 | 2.50 | 1.49 | |
| Eu | 0.39 | 0.40 | 0.46 | 0.14 | 0.15 | 0.19 | 0.17 | 0.32 | 0.21 | 0.14 | 0.16 | 0.17 | 0.20 | |
| Gd | 1.20 | 0.71 | 1.10 | 0.43 | 0.45 | 0.54 | 0.40 | 0.85 | 0.46 | 0.49 | 1.44 | 1.80 | 0.46 | |
| Tb | 0.15 | 0.07 | 0.14 | 0.05 | 0.05 | 0.06 | 0.05 | 0.11 | 0.09 | 0.09 | 0.36 | 0.39 | 0.05 | |
| Dy | 0.69 | 0.20 | 0.45 | 0.31 | 0.22 | 0.27 | 0.27 | 0.56 | 0.48 | 0.37 | 2.05 | 1.96 | 0.19 | |
| Ho | 0.11 | 0.03 | 0.04 | 0.03 | 0.03 | 0.04 | 0.05 | 0.09 | 0.08 | 0.05 | 0.36 | 0.30 | 0.03 | |
| Er | 0.33 | 0.07 | 0.14 | 0.10 | 0.09 | 0.11 | 0.14 | 0.22 | 0.20 | 0.13 | 0.82 | 0.90 | 0.09 | |
| Tm | 0.07 | bdl | 0.02 | 0.01 | 0.01 | 0.01 | 0.01 | 0.02 | 0.02 | 0.02 | 0.18 | 0.17 | bdl | |
| Yb | 0.48 | 0.04 | 0.12 | 0.05 | 0.05 | 0.09 | 0.16 | 0.22 | 0.19 | 0.18 | 1.34 | 1.22 | 0.07 | |
| Lu | 0.07 | 0.01 | 0.02 | 0.01 | 0.01 | 0.02 | 0.02 | 0.04 | 0.02 | 0.02 | 0.21 | 0.14 | 0.02 | |
| ΣREE | 337.41 | 204.26 | 99.38 | 48.78 | 66.21 | 107.84 | 85.22 | 93.29 | 83.80 | 97.50 | 106.69 | 147.34 | 150.96 | |
bdl: below the detection limit.
![Figure 6
Rock classification diagram of the leucogranite and pegmatite showing the low alkalis (Na2O + K2O) of the kaolinised pegmatite compared to the unaltered pegmatite (modified after [34]). WP: kaolinised pegmatite; FP: fresh pegmatite; GRS: greisen; LGR: leucogranite.](/document/doi/10.1515/geo-2022-0697/asset/graphic/j_geo-2022-0697_fig_006.jpg)
Rock classification diagram of the leucogranite and pegmatite showing the low alkalis (Na2O + K2O) of the kaolinised pegmatite compared to the unaltered pegmatite (modified after [34]). WP: kaolinised pegmatite; FP: fresh pegmatite; GRS: greisen; LGR: leucogranite.
A positive correlation of FeOt, TiO2, Na2O, Ca2O, and P2O5 versus SiO2 and a negative correlation of Al2O3, K2O, and MgO versus SiO2 are demonstrated on Harker’s variation diagrams (Figure 7). This indicated depletion of Na2O, P2O5, and CaO and the enrichment of Al2O3, Fe2O3, and TiO2 in the kaolinised pegmatite.

Harker diagrams of major oxides plotted versus SiO2 for the studied samples, showing depletion of Na2O, P2O5, and CaO and enrichment of Al2O3, Fe2O3, and TiO2 in the kaolinised pegmatite. WP: kaolinised pegmatite; FP: fresh pegmatite; GRS: greisen; LGR: leucogranite.
6.2 Trace elements
The trace elements composition of the Ntega-Marangara pegmatites and leucogranites in ppm is presented in Table 1. Some trace elements, namely, Ba, Cs, Ga, Rb, Nb, Ta, Sn, and Sr, display very high concentrations in greisenised pegmatites compared to those of the kaolinised pegmatite, fresh pegmatite, and leucogranite. Lithium (Li) concentration has been found to be higher in kaolinised pegmatites than in other samples. It ranges between 10 and 140 ppm.
The upper continental crust-normalised multi-element diagrams for the samples after [35] display enrichment in Cs, Rb, U, Nb, Ta, Hf, and Li and show apparent Ba, P, and Ti depletions (Figure 8a) [36]. Such enrichment in incompatible elements implies the superimposition of fluid phase or metasomatism processes involving alkali exchange in pegmatite [21,37]. The Ba-Rb-Sr ternary diagram (Figure 8b) shows strong enrichment in Rb and depletion in Sr of the kaolinised pegmatites. The strong enrichment of Rb suggests alteration to a mineralised pegmatite while the decrease in Sr concentrations from leucogranites to greisen by-passing fresh pegmatites and kaolinised pegmatites suggests progressive differentiation resulting from early crystallisation of Sr in K-rich minerals, which leads to the depletion of Sr in the melt [20,33]. Such elemental enrichment and depletion in the Ntega-Marangara pegmatite and leucogranite samples compare favourably with established data on Li–Cs–Ta (LCT) rare metal pegmatites [38]. The presence and abundance of muscovite in those pegmatites, especially the weathered ones may explain the enrichment in Cs. The enrichment in rare elements in those pegmatites could be linked to the strong fractionation of the parent leucogranites with substantially peraluminous characteristics [39–43].
![Figure 8
(a) Upper continental crust-normalized multi-element diagrams for the samples. Normalizing factors are from Taylor and McLennan [35]. (b) The Ba–Rb–Sr ternary diagram. WP: kaolinised pegmatite; FP: fresh pegmatite; GRS: greisen; LGR: leucogranite/.](/document/doi/10.1515/geo-2022-0697/asset/graphic/j_geo-2022-0697_fig_008.jpg)
(a) Upper continental crust-normalized multi-element diagrams for the samples. Normalizing factors are from Taylor and McLennan [35]. (b) The Ba–Rb–Sr ternary diagram. WP: kaolinised pegmatite; FP: fresh pegmatite; GRS: greisen; LGR: leucogranite/.
6.3 Rare earth elements
The rare earth elements composition of the Ntega-Marangara pegmatites and leucogranites in ppm is presented in Table 1. The mean values of LaN/YbN are 60.32, 23.01, 231.47, and 419.05 for leucogranites, fresh pegmatite, kaolinised pegmatites, and greisenised pegmatite respectively. The mean values of Eu/Eu* are 0.47, 0.25, 0.84, and 0.74 for leucogranites, fresh pegmatite, kaolinised pegmatites, and greisenised pegmatite, respectively (Table 2). The LaN/YbN values, combined with the chondrite-normalised REE distribution patterns after [44] for all the pegmatite and leucogranite samples within the study area (Figure 9), indicate a high enrichment in LREE (La, Ce, Pr, Nd, Sm) relative to the HREE (Tb, Dy, Ho, Er, Tm, Yb, Lu), which implies high level of fractionation. The same diagram reveals that a high level of alteration occurred in the kaolinised pegmatites. In fact, the negative Eu anomaly is very pronounced in fresh leucogranite samples while kaolinised pegmatites display a very weak or no obvious Eu anomaly. The negative Eu anomaly in the fresh leucogranite indicates feldspar crystallisation differentiation while the weak or no anomaly in the kaolinised pegmatite reflects metasomatic effects, greisenisation, and kaolinisation of the pegmatites. The Eu-negative anomaly could be associated with plagioclase fractionation [21,45,46]. The ΣREE in the pegmatites of the Ntega-Marangara area ranged from 48.78 to 337.41 ppm with an average of 125.28 ppm (Table 1). These classified them as rare element pegmatites. The circulating hydrothermal fluids responsible for the greisenisation and kaolinisation could have induced the precipitation of some rare metals in the pegmatite [21]. The use of muscovite in the determination of the more obvious mineralisation characteristics could not be affected in this study due to weathering of the samples.
Selected elemental ratios of the studied samples
| WP | LGR | FP | GRS | ||||||||||
|---|---|---|---|---|---|---|---|---|---|---|---|---|---|
| BR01 | BU01 | BV02 | GI01 | GI02 | NZ01 | NZ02 | RU01 | RU02 | JA01 | JA02 | JA03 | BV01 | |
| K/Rb | 23.09 | 37.08 | 19.85 | 44.56 | 39.41 | 22.23 | 28.79 | 23.3 | 55.45 | 138.09 | 75.64 | 59.61 | 14.05 |
| Nb/Ta | 3.23 | 8.51 | 2.26 | 2.10 | 5.54 | 3.39 | 1.49 | 0.85 | 1.35 | 2.68 | 5.93 | 2.28 | 0.64 |
| K/Cs | 307.17 | 528.13 | 219.51 | 743.80 | 548.85 | 168.06 | 211.8 | 197.99 | 1087.53 | 4337.62 | 1300.87 | 681.83 | 82.2 |
| A/NK | 11.05 | 3.93 | 8.03 | 11.57 | 9.61 | 6.60 | 5.77 | 10.88 | 5.58 | 1.35 | 2.09 | 1.89 | 3.47 |
| A/CNK | 10.42 | 3.80 | 7.90 | 11.44 | 9.44 | 6.45 | 5.68 | 10.72 | 5.46 | 1.33 | 1.91 | 1.78 | 3.44 |
| K2O/Na2O | 17.56 | 13.92 | 18.33 | 16.80 | 20.00 | 20.67 | 19.08 | 14.77 | 15.36 | 3.92 | 0.20 | 0.06 | 18.27 |
| Na2O/Al2O3 | 0.00 | 0.02 | 0.01 | 0.00 | 0.00 | 0.01 | 0.01 | 0.01 | 0.01 | 0.15 | 0.40 | 0.50 | 0.01 |
| K2O/Al2O3 | 0.09 | 0.24 | 0.12 | 0.08 | 0.10 | 0.14 | 0.16 | 0.09 | 0.17 | 0.59 | 0.08 | 0.03 | 0.27 |
| REE ratios | |||||||||||||
| LaN/SmN | 14.72 | 16.46 | 8.68 | 8.44 | 11.52 | 19.11 | 20.05 | 10.77 | 12.13 | 19.62 | 8.73 | 10.36 | 18.17 |
| CeN/YbN | 117.10 | 651.73 | 100.25 | 123.10 | 168.88 | 151.19 | 66.92 | 49.83 | 62.11 | 68.25 | 9.32 | 14.43 | 279.04 |
| CeN/SmN | 19.07 | 11.29 | 5.84 | 6.60 | 8.29 | 12.07 | 12.83 | 6.44 | 10.08 | 12.59 | 5.68 | 6.50 | 12.10 |
| EuN/YbN | 2.32 | 28.57 | 10.95 | 8.00 | 8.57 | 6.03 | 3.04 | 4.16 | 3.16 | 2.22 | 0.34 | 0.40 | 8.16 |
| Eu/Eu* | 0.66 | 1.00 | 0.98 | 0.71 | 0.71 | 0.78 | 0.94 | 0.85 | 0.92 | 0.65 | 0.29 | 0.25 | 0.74 |
| LaN/YbN | 90.42 | 950 | 148.89 | 157.33 | 234.67 | 239.26 | 104.58 | 83.33 | 74.74 | 106.3 | 14.33 | 23.01 | 419.05 |
WP: kaolinised pegmatite; FP: fresh pegmatite; GRS: greisen; LGR: leucogranite.
![Figure 9
Chondrite-normalized rare earth element diagram for the studies samples after Nakamura [44]. WP: kaolinised pegmatite; FP: fresh pegmatite; GRS: greisen; LGR: leucogranite.](/document/doi/10.1515/geo-2022-0697/asset/graphic/j_geo-2022-0697_fig_009.jpg)
Chondrite-normalized rare earth element diagram for the studies samples after Nakamura [44]. WP: kaolinised pegmatite; FP: fresh pegmatite; GRS: greisen; LGR: leucogranite.
6.4 Economic potential of the pegmatites within the Ntega-Marangara area
Trace-element ratios, such as K/Rb, K/Cs, and Nb/Ta (Table 2), could be used to show the degree of fractionation in granites/pegmatites. In the fertile pegmatites/granites, these ratios are expected to be significantly lower than the average upper continental crust of Taylor and McLennan [35]. They are therefore expected to be comparable to bulk trace element contents ratios of Černý [47] according to Selway and Breaks [41]. The average ratios of K/Rb, K/Cs, and Nb/Ta in the pegmatite are 35.33, 469.47, and 3.1, respectively, while their average ratio in greisen is 14.05, 82.2, and 0.64, respectively, and for the leucogranite 106.86, 2819.24, and 4.30. These values suggest a late-stage progressive fractional crystallisation and potential mineralisation in the kaolinised pegmatites and greisen. However, the greisen within this study area is considered strongly fractionated with a stronger potential for rare metals than the pegmatites [35,47–49].
The economic aspect of pegmatites from the Ntega-Marangara area was assessed using the diagrams K/Rb versus Rb [50], K/Rb versus Cs [51], Ta versus Ga, and Ta versus Cs + Rb [52,53]. The K/Rb values for pegmatites and greisen of the Ntega-Marangara area ranged from 14.05 to 59.61 but with lower values in the greisen sample while those of leucogranite samples were relatively higher (138.09 and 75.64, respectively). According to [50], the pegmatites whose K/Rb ratios are less than 100 are globally accepted as mineralised. The pegmatite and leucogranite samples from the study area were plotted using the K/Rb versus Rb diagram of Straurov et al. [50] (Figure 10a) and the Kb/Rb versus Cs diagram (Figure 10b). The latter discriminates the rare metal pegmatites from the barren pegmatites [51]. The majority of pegmatite samples were plotted within the mineralised field on the K/Rb versus Rb diagram while the leucogranite samples were plotted in the barren field. The K/Rb versus Cs diagram showed that the pegmatite samples are the rare element class pegmatite (Figure 10b). These demonstrate the potential columbo-tantalite and cassiterite mineralisation in pegmatites and greisen of the study area in consonance with the study of Hulsbosch et al. [33] and Ndikumana et al. [21,22,23] in the kaolinised pegmatites in the Gatumba area and [25] in the pegmatite of the Kabarore-Mparamirundi area. The Ta versus Cs + Rb (Figure 10c) and Ta versus Ga (Figure 10d) diagrams [52,53] further indicated that the pegmatites from the Ntega-Marangara area are Ta mineralised. The leucogranite and pegmatite samples have also been plotted on the Rb versus K/Cs diagram to discriminate the barren rocks from those with significant Li–Be–Ta after [54] (Figure 10e). The diagram demonstrated that the pegmatite is LCT-Be mineralised while leucogranite is barren. The use of muscovite and feldspar extract could shed more light on the mineralisation potential.
![Figure 10
(a) K/Rb versus Rb plot showing the fractionation trend in the studied rocks [50]; (b) K/Rb versus Cs plot showing the discrimination of barren and mineralized pegmatites [51,56]; (c) Ta versus Cs + Rb plot; and (d) Ta versus Ga plots of [52,53] showing the Ta mineralisation; (e) Rb versus K/Cs plot of the whole rock pegmatite and leucogranite of from Ntega-Marangara Area (the lines discriminating barren pegmatites and granites from those with significant Li–Be–Ta mineralization are given according to Trueman and Cerny [54]). WP: kaolinised pegmatite; FP: fresh pegmatite; GRS: greisen; LGR: leucogranite.](/document/doi/10.1515/geo-2022-0697/asset/graphic/j_geo-2022-0697_fig_010.jpg)
(a) K/Rb versus Rb plot showing the fractionation trend in the studied rocks [50]; (b) K/Rb versus Cs plot showing the discrimination of barren and mineralized pegmatites [51,56]; (c) Ta versus Cs + Rb plot; and (d) Ta versus Ga plots of [52,53] showing the Ta mineralisation; (e) Rb versus K/Cs plot of the whole rock pegmatite and leucogranite of from Ntega-Marangara Area (the lines discriminating barren pegmatites and granites from those with significant Li–Be–Ta mineralization are given according to Trueman and Cerny [54]). WP: kaolinised pegmatite; FP: fresh pegmatite; GRS: greisen; LGR: leucogranite.
7 Conclusions
Petrography and geochemistry of the pegmatite and leucogranite of the Ntega-Marangara area indicated enrichment of Li, Cs, and Rb, which is commonly used as a marker of a magmatic-hydrothermal alteration and thus classified the pegmatite of this study area as LCT pegmatite. The same enrichment also suggests that the magmatic hydrothermal alteration process could have occurred in the rare metal pegmatite bodies. The assessment of the mineralisation trend that was conducted through K/Rb versus Rb, Ta versus Ga, K/Rb versus Cs, and Ta versus Cs + Rb showed that the majority of pegmatite samples are highly fractionated with the mineralisation trend increasing with the fractionation. The leucogranites within the Ntega-Marangara area are barren while the fresh pegmatites intruding the leucogranites, which showed a relatively low fractionation, are also not mineralised. The kaolinised pegmatite samples, especially those distal to the granite pluton which were the most differentiated, are mineralised. The high values in Rb and Cs contents suggest that there could have been a process of muscovitisation after the primary emplacement of the pegmatites. Thus, the kaolinised pegmatite and greisen show evidence of Ta–Nb–Sn and Be mineralisation which increases substantially from the kaolinised pegmatite to the greisen. However, the petrogenetic relationships between the greisen and the pegmatite; the genesis of Nb–Ta and Sn mineralisation, as well as, Geo-tectonic events that post-dated the primary emplacement of those ores remain questionable. Further research could be carried out using the geochemical signature of mineral extracts, such as muscovite or feldspars, to properly assess the fractionation trend and mineralisation potential. Oxygen and hydrogen stable isotopes and fluid inclusion studies could be used to unravel the nature of the fluids involved in the ore deposition processes and mobilisation.
Acknowledgements
The African Union is acknowledged for granting the scholarship and research grant for this work, which is a part of the first author’s master’s thesis at the Life and Earth Science Institute of the Pan African University.
-
Funding information: This work has been sponsored by the African Union through the Pan African University, Life and Earth Sciences (Including Health and Agriculture) by providing the research grant for fieldwork and laboratory analyses.
-
Author contributions: Conception: Q.J. Akabahinga and A.T. Bolarinwa; methodology: Q.J. Akabahinga, A.T. Bolarinwa, and S. Ntiharirizwa; field investigation: Q.J. Akabahinga and S. Ntiharirizwa; data processing and interpretation: Q.J. Akabahinga, A.T. Bolarinwa, and S. Ntiharirizwa; writing – original draft: Q.J. Akabahinga; writing – review and editing: Q.J. Akabahinga and A.T. Bolarinwa; and funding acquisition and management: Q.J. Akabahinga and A.T. Bolarinwa. All authors have read and agreed to the published version of the article.
-
Conflict of interest: The authors declare no potential competing interests for this article.
-
Data availability statement: The data involved during the present study are available from the corresponding author upon reasonable request.
References
[1] Dill HG. Pegmatites and aplites: Their genetic and applied ore geology. Ore Geol Rev. 2015;69:417–561. 10.1016/j.oregeorev.2015.02.022.Search in Google Scholar
[2] Pan Y, Breaks WF. Rare-earth elements in fluorapatite, separation lake area, ontario; evidence for s-type granite-rare-element pegmatite linkage. Can Mineralogist. 1997;35:659–71.Search in Google Scholar
[3] Tindle AG, Breaks FW. Columbite-tantalite mineral chemistry from rare-element granitic pegmatites: Separation Lakeh area, N.W. Ontario, Canada. Miner Pet. 2000;70:165–98. 10.1007/s007100070002.Search in Google Scholar
[4] Mutima J, Wei LJ. Au, Sn, W and Nb/Ta mineralization in Northern and Northeastern Burundi. Acad Arena. 2010;2:55–65.Search in Google Scholar
[5] Ngaruye J-C. Petrographic and geochemical investigation of Sn-W-Nb-Ta- pegmatites and mineralized quartz veins in southeastern Rwanda. University of the Free State. Bloemfontein, South Africa: 2011.Search in Google Scholar
[6] Dewaele S, Hulsbosch N, Cryns Y, Boyce A, Burgess R, Muchez P. Geological setting and timing of the world-class Sn, Nb-Ta and Li mineralization of Manono-Kitotolo (Katanga, Democratic Republic of Congo). Ore Geol Rev. 2016;72:373–90. 10.1016/j.oregeorev.2015.07.004.Search in Google Scholar
[7] Oyediran IA, Nzolang C, Mupenge MP, Idakwo SO. Structural control and Sn–Ta–Nb mineralization potential of pegmatitic bodies in Numbi, South Kivu Eastern D.R Congo. Lithos. 2020;368–9. 10.1016/j.lithos.2020.105601.Search in Google Scholar
[8] Van Daele J. Tectono-metamorphic evolution of the Kibuye-Gitarama-Gatumba area (Rwanda): implications for the geodynamic framework of Nb-Ta-Sn-W granite-related mineralization in the Karagwe-Ankole Belt. vol. PhD Thesis. KU Leuven, Science, Engineering & Technology; 2020.Search in Google Scholar
[9] Villeneuve M, Wazi N, Kalikone C, Gärtner A. A review of the G4 “Tin Granites” and associated mineral occurrences in the kivu belt (eastern democratic republic of the congo) and their relationships with the last kibaran tectono-thermal events. Minerals. 2022;12:737. 10.3390/min12060737.Search in Google Scholar
[10] Tack L, Wingate MTD, De Waele B, Meert J, Belousova E, Griffin B, et al. The 1375 Ma “Kibaran event” in Central Africa: Prominent emplacement of bimodal magmatism under extensional regime. Precambrian Res. 2010;180:63–84. 10.1016/j.precamres.2010.02.022.Search in Google Scholar
[11] Pohl WL, Biryabarema M, Lehmann B. Early Neoproterozoic rare metal (Sn, Ta, W) and gold metallogeny of the Central Africa Region: a review. Trans Inst Min Metall, Sect B: Appl Earth Sci. 2013;122:66–82. 10.1179/1743275813Y.0000000033.Search in Google Scholar
[12] Fernandez-Alonso M, Cutten H, De Waele B, Tack L, Tahon A, Baudet D, et al. The mesoproterozoic karagwe-Ankole Belt (formerly the NE Kibara Belt): The result of prolonged extensional intracratonic basin development punctuated by two short-lived far-field compressional events. Precambrian Res. 2012;216–219:63–86. 10.1016/j.precamres.2012.06.007.Search in Google Scholar
[13] Clercq FD, Muchez P, Dewaele S, Boyce A. The tungsten mineralisation at Nyakabingo and Gifurwe (Rwanda): preliminary results. Geologica Belgica; 2008.Search in Google Scholar
[14] Dewaele B, Johnson SP, Pisarevsky SA. Palaeoproterozoic to Neoproterozoic growth and evolution of the eastern Congo Craton: Its role in the Rodinia puzzle. Precambrian Res. 2008;1–2:127–41. 10.1016/J.PRECAMRES.2007.04.020.Search in Google Scholar
[15] Dewaele S, De Clerq F, Muchez P, Schneider J, Burgess R, Boyce A, et al. Geology of the cassiterite mineralisation in the Rutongo area, Rwanda (Central Africa): current state of knowledge. Geol Belg. 2010;13:91–112.Search in Google Scholar
[16] Koegelenberg C, Kisters AFM. Tectonic wedging, back-thrusting and basin development in the frontal parts of the Mesoproterozoic Karagwe-Ankole belt in NW Tanzania. J Afr Earth Sci. 2014;97:87–98. 10.1016/j.jafrearsci.2014.04.018.Search in Google Scholar
[17] Koegelenberg C, Kisters AFM, Kramers JD, Frei D. U–Pb detrital zircon and 39Ar–40Ar muscovite ages from the eastern parts of the Karagwe-Ankole Belt: Tracking Paleoproterozoic basin formation and Mesoproterozoic crustal amalgamation along the western margin of the Tanzania Craton. Precambrian Res. 2015;269:147–61. 10.1016/j.precamres.2015.08.014.Search in Google Scholar
[18] Klerkx J, Lavreau J, Liégeois JP, Theunissen K. Granitoïdes kibariens précoces et tectonique tangentielle au Burundi: magmatisme bimodal lié à une distension crustale. Afr Geol. 1984;26:29–46.Search in Google Scholar
[19] De Clercq S, Chew D, O’Sullivan G, De Putter T, De Grave J, Dewaele S. Characterisation and geodynamic setting of the 1 Ga granitoids of the Karagwe-Ankole belt (KAB), Rwanda. Precambrian Res. 2021;356:106–24. 10.1016/j.precamres.2021.106124.Search in Google Scholar
[20] Hulsbosch N. Chemical fractionation in granite-related ore systems - Evidence from Nb-Ta-Sn pegmatite-type and Sn-W quartz vein-type mineralisation in the Karagwe-Ankole Belt (Rwanda). Unpublished PhD-thesis. KU Leuven; 2016.Search in Google Scholar
[21] Ndikumana J, de D, Bolarinwa AT, Adeyemi GO. Neoproterozoic rare element pegmatites from gitarama and gatumba areas, rwanda: understanding Their Nb-Ta and Sn mineralisation. Open J Geol. 2019;09:1069–83. 10.4236/ojg.2019.913106.Search in Google Scholar
[22] Ndikumana J, de D, Bolarinwa AT, Adeyemi GO, Olajide-Kayode J, Nambaje C. Geochemistry of feldspar and muscovite from pegmatite of the Gatumba area, Karagwe Ankole Belt: implications for Nb–Ta–Sn mineralisation and associated alterations. SN Appl Sci. 2020;2:1568. 10.1007/S42452-020-03370-1.Search in Google Scholar
[23] Ndikumana JD, Mupenge PM, Nambaje C, Raoelison IL, Bolarinwa AT, Adeyemi GO. Structural control on the Sn–Ta–Nb mineralisation and geochemistry of the pegmatites of Gitarama and Gatumba areas (Rwanda), Karagwe–Ankole Belt. Arab J Geosci. 2021;14:2660. 10.1007/s12517-021-09033-8.Search in Google Scholar
[24] Turimumahoro D. Etude tectono-métamorphique, magmatique et minéralisations de columbite-tantalite et de cassitérite de la chaîne Karagwe-Ankole (KAB). Cas de de la région de Kabarore-Mparamirundi, nord-ouest du Burundi, PhD Thesis. Leuven, Belgium: 2022.Search in Google Scholar
[25] Turimumahoro D, Hulsbosch N, Nahimana L, Dewaele S, Muchez P. Geochemical signature of muscovites as pathfinder for fractionation of pegmatites in the kabarore-mparamirundi area (Northwestern Burundi, Central Africa). Geol Belg. 2020;23:53–67. 10.20341/GB.2020.005.Search in Google Scholar
[26] Dewaele S, Henjes-Kunst F, Melcher F, Sitnikova M, Burgess R, Gerdes A, et al. Late neoproterozoic overprinting of the cassiterite and columbite-tantalite bearing pegmatites of the Gatumba area, Rwanda (Central Africa. J Afr Earth Sci. 2011;61:10–26. 10.1016/J.JAFREARSCI.2011.04.004.Search in Google Scholar
[27] Ndikumana J, de D, Nguimatsia Dongmo FW, Bolarinwa AT, Nambaje C. A perspective view of origins and occurrences of Niobium-Tantalum. Tungsten Miner Rwanda Int Res J Earth Sci. 2018;6:20–9.Search in Google Scholar
[28] Claessens W, Dreesen R. Carte géologique du Burundi, feuille Ngozi, Echelle: 1/100000, S3/29-SE: Musée Royal Afrique Centrale. Tervuren: 1983.Search in Google Scholar
[29] Laghmouch M, Nimpagaritse G, Mudende L, Minani M, Ndereyimana J, Nahimana A, et al. Carte géologique du Burundi (1/250000). Musée Royale de l’Afrique Centrale (MRAC). Tervuren, Belgique: 2019.Search in Google Scholar
[30] Ndikumana J, de D, Nguimatsia Dongmo FW, Bolarinwa AT, Nambaje C. A review of origins and occurrences of Niobium-Tantalum, Tin and Tungsten mineralization in Rwanda. J Appl Geol Geophys. 2017;5:09–18.Search in Google Scholar
[31] Brinckmann J, Lehmann B, Hein U, Höhndorf A, Mussallam K, Weiser T, et al. La Géologie et la Minéralisation Primaire de l’Or de la - Chaîne Kibarienne, Nord-ouest du Burundi, Afrique Orientale. Geol Jahrb Reihe. 2001;500:101.Search in Google Scholar
[32] Romer RL, Lehmann B. U-Pb columbite age of Neoproterozoic Ta–Nb mineralization in Burundi. Econ Geol. 1995;90:2303–9. 10.2113/GSECONGEO.90.8.2303.Search in Google Scholar
[33] Hulsbosch N, Hertogen J, Dewaele S, André L, Muchez P. Alkali metal and rare earth element evolution of rock-forming minerals from the Gatumba area pegmatites (Rwanda): Quantitative assessment of crystal-melt fractionation in the regional zonation of pegmatite groups. Geochim Cosmochim Acta. 2014;132:349–74. 10.1016/j.gca.2014.02.006.Search in Google Scholar
[34] Middlemost EAK. Naming materials in the magma/igneous rock system. Earth Sci Rev. 1994;37:215–24. 10.1016/0012-8252(94)90029-9.Search in Google Scholar
[35] Taylor SR, McLennan SM. The continental crust: its composition and evolution. Geol Mag. 1985;122:673–4. 10.1017/S0016756800032167.Search in Google Scholar
[36] Zhu YF, Zeng Y, Gu L. Geochemistry of the rare metal-bearing pegmatite No. 3 vein and related granites in the Keketuohai region, Altay Mountains, northwest China. J Asian Earth Sci. 2006;27:61–77. 10.1016/J.JSEAES.2005.01.007.Search in Google Scholar
[37] Pitfield PEJ. Report on the geochemistry of the granites of Thailand. BGS Report WC. Vol. 88, Nottingham, United Kingdom: 1988. p. 178.Search in Google Scholar
[38] Cerny P, London D, Novak M. Granitic pegmatites as reflections of their sources. Elements. 2012;8:289–94. 10.2113/gselements.8.4.289.Search in Google Scholar
[39] Černý P, Meintzer RE. Fertile granites in the archean and proterozoic fields of rare element pegmatites: crustal environment, geochemistry and petrogenetic relationships. Recent advances in the geology of granite-related mineral deposits. Canadian Institute of Mining and Metallurgy. Vol. 39, Special Publication; 1988. p. 170–206.Search in Google Scholar
[40] Breaks FW, John M. The ghost lake batholith, Superior Province of northwestern Ontario; a fertile, S-type, peraluminous granite-rare-element pegmatite system. Can Miner. 1992;30:835–75.Search in Google Scholar
[41] Selway J, Breaks F. A review of rare-element (Li-Cs-Ta) pegmatite exploration techniques for the superior province, canada, and large worldwide tantalum deposits. Exploration Min Geol. 2005;14:1–30.10.2113/gsemg.14.1-4.1Search in Google Scholar
[42] Černý P, Ercit TS. The classification of granitic pegmatites revisited. Can Miner. 2005;43:2005–26. 10.2113/GSCANMIN.43.6.2005.Search in Google Scholar
[43] Černý P, Blevin PL, Cuney M, London D. Granite-related ore deposits. One Hundredth Anniversary Volume, Society of Economic Geologists; 2005. 10.5382/AV100.12.Search in Google Scholar
[44] Nakamura N. Determination of REE, Ba, Fe, Mg, Na and K in carbonaceous and ordinary chondrites. Geochim Cosmochim Acta. 1974;38:757.10.1016/0016-7037(74)90149-5Search in Google Scholar
[45] Taylor SR, Rudnick RL, McLennan SM, Eriksson KA. Rare earth element patterns in Archean high-grade metasediments and their tectonic significance. Geochim Cosmochim Acta. 1986;50:2267–79. 10.1016/0016-7037(86)90081-5.Search in Google Scholar
[46] Weill DF, Drake MJ. Europium anomaly in plagioclase feldspar: experimental results and semiquantitative model. Science (1979). 1973;180:1059–60. 10.1126/science.180.4090.1059.Search in Google Scholar PubMed
[47] Černý P. Exploration Strategy and Methods for Pegmatite Deposits of Tantalum. Lanthanides, Tantalum and Niobium. Berlin, Heidelberg: Springer; 1989. p. 274–302. 10.1007/978-3-642-87262-4_13.Search in Google Scholar
[48] Chukwu A, Obiora SC. Petrogenetic characterization of pegmatites and their host rocks in southern Akwanga, North-Central Basement Complex, Nigeria. J Earth Syst Sci. 2021;130:18. 10.1007/S12040-020-01498-7.Search in Google Scholar
[49] Kuster D. Rare-metal pegmatite of wamba, central nigeria – their formation in relation to late pan-african granites. Miner Deposita. 1990;25:25–33.10.1007/BF03326380Search in Google Scholar
[50] Straurov OD, Stolyarov IS, Isocheva EI. Geochemistry and origin of verkh iset granitoid massif in Central Ural. Geochem Int. 1969;6:1138–48.Search in Google Scholar
[51] Moeller P, Morteani G. Geochemical exploration guide for tantalum pegmatites. Econ Geol. 1987;82:1888–97. 10.2113/gsecongeo.82.7.1888.Search in Google Scholar
[52] Gordiyenko VV. Concentrations of Li, Rb, and Cs in potash feldspar and muscovite as criteria for assessing the rare-metal mineralization in granite pegmatites. Int Geol Rev. 1971;13:134–42. 10.1080/00206817109475411.Search in Google Scholar
[53] Beus AA. Distribution of tantalum and niobium in muscovites from granitic pegmatites. Geokhimiya. 1966;10:1216–20.Search in Google Scholar
[54] Trueman DL, Cerny P. Exploration for rare-element granitic pegmatites. Mineral Assoc Can. 1982;8:463–94.Search in Google Scholar
[55] Nambaje C, Williams IS, Satish-Kumar M, Sajeev K. Direct evidence for Archean crust in the Western Domain of the Karagwe Ankole Belt, Rwanda: Implications for Neoarchean to Paleoproterozoic crustal evolution. Precambrian Res. 2020;350:105851. 10.1016/j.precamres.2020.105851.Search in Google Scholar
[56] Mohamed SK, Moghazy NM, Saleh GM. Pan-African rare metals bearing pegmatites in Wadi Ghadir, South Eastern desert, Egypt: the geochemical evolution and implications for mineralization. SN Appl Sci. 2021;3:427. 10.1007/S42452-021-04414-W.Search in Google Scholar
© 2024 the author(s), published by De Gruyter
This work is licensed under the Creative Commons Attribution 4.0 International License.
Articles in the same Issue
- Regular Articles
- Theoretical magnetotelluric response of stratiform earth consisting of alternative homogeneous and transitional layers
- The research of common drought indexes for the application to the drought monitoring in the region of Jin Sha river
- Evolutionary game analysis of government, businesses, and consumers in high-standard farmland low-carbon construction
- On the use of low-frequency passive seismic as a direct hydrocarbon indicator: A case study at Banyubang oil field, Indonesia
- Water transportation planning in connection with extreme weather conditions; case study – Port of Novi Sad, Serbia
- Zircon U–Pb ages of the Paleozoic volcaniclastic strata in the Junggar Basin, NW China
- Monitoring of mangrove forests vegetation based on optical versus microwave data: A case study western coast of Saudi Arabia
- Microfacies analysis of marine shale: A case study of the shales of the Wufeng–Longmaxi formation in the western Chongqing, Sichuan Basin, China
- Multisource remote sensing image fusion processing in plateau seismic region feature information extraction and application analysis – An example of the Menyuan Ms6.9 earthquake on January 8, 2022
- Identification of magnetic mineralogy and paleo-flow direction of the Miocene-quaternary volcanic products in the north of Lake Van, Eastern Turkey
- Impact of fully rotating steel casing bored pile on adjacent tunnels
- Adolescents’ consumption intentions toward leisure tourism in high-risk leisure environments in riverine areas
- Petrogenesis of Jurassic granitic rocks in South China Block: Implications for events related to subduction of Paleo-Pacific plate
- Differences in urban daytime and night block vitality based on mobile phone signaling data: A case study of Kunming’s urban district
- Random forest and artificial neural network-based tsunami forests classification using data fusion of Sentinel-2 and Airbus Vision-1 satellites: A case study of Garhi Chandan, Pakistan
- Integrated geophysical approach for detection and size-geometry characterization of a multiscale karst system in carbonate units, semiarid Brazil
- Spatial and temporal changes in ecosystem services value and analysis of driving factors in the Yangtze River Delta Region
- Deep fault sliding rates for Ka-Ping block of Xinjiang based on repeating earthquakes
- Improved deep learning segmentation of outdoor point clouds with different sampling strategies and using intensities
- Platform margin belt structure and sedimentation characteristics of Changxing Formation reefs on both sides of the Kaijiang-Liangping trough, eastern Sichuan Basin, China
- Enhancing attapulgite and cement-modified loess for effective landfill lining: A study on seepage prevention and Cu/Pb ion adsorption
- Flood risk assessment, a case study in an arid environment of Southeast Morocco
- Lower limits of physical properties and classification evaluation criteria of the tight reservoir in the Ahe Formation in the Dibei Area of the Kuqa depression
- Evaluation of Viaducts’ contribution to road network accessibility in the Yunnan–Guizhou area based on the node deletion method
- Permian tectonic switch of the southern Central Asian Orogenic Belt: Constraints from magmatism in the southern Alxa region, NW China
- Element geochemical differences in lower Cambrian black shales with hydrothermal sedimentation in the Yangtze block, South China
- Three-dimensional finite-memory quasi-Newton inversion of the magnetotelluric based on unstructured grids
- Obliquity-paced summer monsoon from the Shilou red clay section on the eastern Chinese Loess Plateau
- Classification and logging identification of reservoir space near the upper Ordovician pinch-out line in Tahe Oilfield
- Ultra-deep channel sand body target recognition method based on improved deep learning under UAV cluster
- New formula to determine flyrock distance on sedimentary rocks with low strength
- Assessing the ecological security of tourism in Northeast China
- Effective reservoir identification and sweet spot prediction in Chang 8 Member tight oil reservoirs in Huanjiang area, Ordos Basin
- Detecting heterogeneity of spatial accessibility to sports facilities for adolescents at fine scale: A case study in Changsha, China
- Effects of freeze–thaw cycles on soil nutrients by soft rock and sand remodeling
- Vibration prediction with a method based on the absorption property of blast-induced seismic waves: A case study
- A new look at the geodynamic development of the Ediacaran–early Cambrian forearc basalts of the Tannuola-Khamsara Island Arc (Central Asia, Russia): Conclusions from geological, geochemical, and Nd-isotope data
- Spatio-temporal analysis of the driving factors of urban land use expansion in China: A study of the Yangtze River Delta region
- Selection of Euler deconvolution solutions using the enhanced horizontal gradient and stable vertical differentiation
- Phase change of the Ordovician hydrocarbon in the Tarim Basin: A case study from the Halahatang–Shunbei area
- Using interpretative structure model and analytical network process for optimum site selection of airport locations in Delta Egypt
- Geochemistry of magnetite from Fe-skarn deposits along the central Loei Fold Belt, Thailand
- Functional typology of settlements in the Srem region, Serbia
- Hunger Games Search for the elucidation of gravity anomalies with application to geothermal energy investigations and volcanic activity studies
- Addressing incomplete tile phenomena in image tiling: Introducing the grid six-intersection model
- Evaluation and control model for resilience of water resource building system based on fuzzy comprehensive evaluation method and its application
- MIF and AHP methods for delineation of groundwater potential zones using remote sensing and GIS techniques in Tirunelveli, Tenkasi District, India
- New database for the estimation of dynamic coefficient of friction of snow
- Measuring urban growth dynamics: A study in Hue city, Vietnam
- Comparative models of support-vector machine, multilayer perceptron, and decision tree predication approaches for landslide susceptibility analysis
- Experimental study on the influence of clay content on the shear strength of silty soil and mechanism analysis
- Geosite assessment as a contribution to the sustainable development of Babušnica, Serbia
- Using fuzzy analytical hierarchy process for road transportation services management based on remote sensing and GIS technology
- Accumulation mechanism of multi-type unconventional oil and gas reservoirs in Northern China: Taking Hari Sag of the Yin’e Basin as an example
- TOC prediction of source rocks based on the convolutional neural network and logging curves – A case study of Pinghu Formation in Xihu Sag
- A method for fast detection of wind farms from remote sensing images using deep learning and geospatial analysis
- Spatial distribution and driving factors of karst rocky desertification in Southwest China based on GIS and geodetector
- Physicochemical and mineralogical composition studies of clays from Share and Tshonga areas, Northern Bida Basin, Nigeria: Implications for Geophagia
- Geochemical sedimentary records of eutrophication and environmental change in Chaohu Lake, East China
- Research progress of freeze–thaw rock using bibliometric analysis
- Mixed irrigation affects the composition and diversity of the soil bacterial community
- Examining the swelling potential of cohesive soils with high plasticity according to their index properties using GIS
- Geological genesis and identification of high-porosity and low-permeability sandstones in the Cretaceous Bashkirchik Formation, northern Tarim Basin
- Usability of PPGIS tools exemplified by geodiscussion – a tool for public participation in shaping public space
- Efficient development technology of Upper Paleozoic Lower Shihezi tight sandstone gas reservoir in northeastern Ordos Basin
- Assessment of soil resources of agricultural landscapes in Turkestan region of the Republic of Kazakhstan based on agrochemical indexes
- Evaluating the impact of DEM interpolation algorithms on relief index for soil resource management
- Petrogenetic relationship between plutonic and subvolcanic rocks in the Jurassic Shuikoushan complex, South China
- A novel workflow for shale lithology identification – A case study in the Gulong Depression, Songliao Basin, China
- Characteristics and main controlling factors of dolomite reservoirs in Fei-3 Member of Feixianguan Formation of Lower Triassic, Puguang area
- Impact of high-speed railway network on county-level accessibility and economic linkage in Jiangxi Province, China: A spatio-temporal data analysis
- Estimation model of wild fractional vegetation cover based on RGB vegetation index and its application
- Lithofacies, petrography, and geochemistry of the Lamphun oceanic plate stratigraphy: As a record of the subduction history of Paleo-Tethys in Chiang Mai-Chiang Rai Suture Zone of Thailand
- Structural features and tectonic activity of the Weihe Fault, central China
- Application of the wavelet transform and Hilbert–Huang transform in stratigraphic sequence division of Jurassic Shaximiao Formation in Southwest Sichuan Basin
- Structural detachment influences the shale gas preservation in the Wufeng-Longmaxi Formation, Northern Guizhou Province
- Distribution law of Chang 7 Member tight oil in the western Ordos Basin based on geological, logging and numerical simulation techniques
- Evaluation of alteration in the geothermal province west of Cappadocia, Türkiye: Mineralogical, petrographical, geochemical, and remote sensing data
- Numerical modeling of site response at large strains with simplified nonlinear models: Application to Lotung seismic array
- Quantitative characterization of granite failure intensity under dynamic disturbance from energy standpoint
- Characteristics of debris flow dynamics and prediction of the hazardous area in Bangou Village, Yanqing District, Beijing, China
- Rockfall mapping and susceptibility evaluation based on UAV high-resolution imagery and support vector machine method
- Statistical comparison analysis of different real-time kinematic methods for the development of photogrammetric products: CORS-RTK, CORS-RTK + PPK, RTK-DRTK2, and RTK + DRTK2 + GCP
- Hydrogeological mapping of fracture networks using earth observation data to improve rainfall–runoff modeling in arid mountains, Saudi Arabia
- Petrography and geochemistry of pegmatite and leucogranite of Ntega-Marangara area, Burundi, in relation to rare metal mineralisation
- Prediction of formation fracture pressure based on reinforcement learning and XGBoost
- Hazard zonation for potential earthquake-induced landslide in the eastern East Kunlun fault zone
- Monitoring water infiltration in multiple layers of sandstone coal mining model with cracks using ERT
- Study of the patterns of ice lake variation and the factors influencing these changes in the western Nyingchi area
- Productive conservation at the landslide prone area under the threat of rapid land cover changes
- Sedimentary processes and patterns in deposits corresponding to freshwater lake-facies of hyperpycnal flow – An experimental study based on flume depositional simulations
- Study on time-dependent injectability evaluation of mudstone considering the self-healing effect
- Detection of objects with diverse geometric shapes in GPR images using deep-learning methods
- Behavior of trace metals in sedimentary cores from marine and lacustrine environments in Algeria
- Spatiotemporal variation pattern and spatial coupling relationship between NDVI and LST in Mu Us Sandy Land
- Formation mechanism and oil-bearing properties of gravity flow sand body of Chang 63 sub-member of Yanchang Formation in Huaqing area, Ordos Basin
- Diagenesis of marine-continental transitional shale from the Upper Permian Longtan Formation in southern Sichuan Basin, China
- Vertical high-velocity structures and seismic activity in western Shandong Rise, China: Case study inspired by double-difference seismic tomography
- Spatial coupling relationship between metamorphic core complex and gold deposits: Constraints from geophysical electromagnetics
- Disparities in the geospatial allocation of public facilities from the perspective of living circles
- Research on spatial correlation structure of war heritage based on field theory. A case study of Jinzhai County, China
- Formation mechanisms of Qiaoba-Zhongdu Danxia landforms in southwestern Sichuan Province, China
- Magnetic data interpretation: Implication for structure and hydrocarbon potentiality at Delta Wadi Diit, Southeastern Egypt
- Deeply buried clastic rock diagenesis evolution mechanism of Dongdaohaizi sag in the center of Junggar fault basin, Northwest China
- Application of LS-RAPID to simulate the motion of two contrasting landslides triggered by earthquakes
- The new insight of tectonic setting in Sunda–Banda transition zone using tomography seismic. Case study: 7.1 M deep earthquake 29 August 2023
- The critical role of c and φ in ensuring stability: A study on rockfill dams
- Evidence of late quaternary activity of the Weining-Shuicheng Fault in Guizhou, China
- Extreme hydroclimatic events and response of vegetation in the eastern QTP since 10 ka
- Spatial–temporal effect of sea–land gradient on landscape pattern and ecological risk in the coastal zone: A case study of Dalian City
- Study on the influence mechanism of land use on carbon storage under multiple scenarios: A case study of Wenzhou
- A new method for identifying reservoir fluid properties based on well logging data: A case study from PL block of Bohai Bay Basin, North China
- Comparison between thermal models across the Middle Magdalena Valley, Eastern Cordillera, and Eastern Llanos basins in Colombia
- Mineralogical and elemental analysis of Kazakh coals from three mines: Preliminary insights from mode of occurrence to environmental impacts
- Chlorite-induced porosity evolution in multi-source tight sandstone reservoirs: A case study of the Shaximiao Formation in western Sichuan Basin
- Predicting stability factors for rotational failures in earth slopes and embankments using artificial intelligence techniques
- Origin of Late Cretaceous A-type granitoids in South China: Response to the rollback and retreat of the Paleo-Pacific plate
- Modification of dolomitization on reservoir spaces in reef–shoal complex: A case study of Permian Changxing Formation, Sichuan Basin, SW China
- Geological characteristics of the Daduhe gold belt, western Sichuan, China: Implications for exploration
- Rock physics model for deep coal-bed methane reservoir based on equivalent medium theory: A case study of Carboniferous-Permian in Eastern Ordos Basin
- Enhancing the total-field magnetic anomaly using the normalized source strength
- Shear wave velocity profiling of Riyadh City, Saudi Arabia, utilizing the multi-channel analysis of surface waves method
- Effect of coal facies on pore structure heterogeneity of coal measures: Quantitative characterization and comparative study
- Inversion method of organic matter content of different types of soils in black soil area based on hyperspectral indices
- Detection of seepage zones in artificial levees: A case study at the Körös River, Hungary
- Tight sandstone fluid detection technology based on multi-wave seismic data
- Characteristics and control techniques of soft rock tunnel lining cracks in high geo-stress environments: Case study of Wushaoling tunnel group
- Influence of pore structure characteristics on the Permian Shan-1 reservoir in Longdong, Southwest Ordos Basin, China
- Study on sedimentary model of Shanxi Formation – Lower Shihezi Formation in Da 17 well area of Daniudi gas field, Ordos Basin
- Multi-scenario territorial spatial simulation and dynamic changes: A case study of Jilin Province in China from 1985 to 2030
- Review Articles
- Major ascidian species with negative impacts on bivalve aquaculture: Current knowledge and future research aims
- Prediction and assessment of meteorological drought in southwest China using long short-term memory model
- Communication
- Essential questions in earth and geosciences according to large language models
- Erratum
- Erratum to “Random forest and artificial neural network-based tsunami forests classification using data fusion of Sentinel-2 and Airbus Vision-1 satellites: A case study of Garhi Chandan, Pakistan”
- Special Issue: Natural Resources and Environmental Risks: Towards a Sustainable Future - Part I
- Spatial-temporal and trend analysis of traffic accidents in AP Vojvodina (North Serbia)
- Exploring environmental awareness, knowledge, and safety: A comparative study among students in Montenegro and North Macedonia
- Determinants influencing tourists’ willingness to visit Türkiye – Impact of earthquake hazards on Serbian visitors’ preferences
- Application of remote sensing in monitoring land degradation: A case study of Stanari municipality (Bosnia and Herzegovina)
- Optimizing agricultural land use: A GIS-based assessment of suitability in the Sana River Basin, Bosnia and Herzegovina
- Assessing risk-prone areas in the Kratovska Reka catchment (North Macedonia) by integrating advanced geospatial analytics and flash flood potential index
- Analysis of the intensity of erosive processes and state of vegetation cover in the zone of influence of the Kolubara Mining Basin
- GIS-based spatial modeling of landslide susceptibility using BWM-LSI: A case study – city of Smederevo (Serbia)
- Geospatial modeling of wildfire susceptibility on a national scale in Montenegro: A comparative evaluation of F-AHP and FR methodologies
- Geosite assessment as the first step for the development of canyoning activities in North Montenegro
- Urban geoheritage and degradation risk assessment of the Sokograd fortress (Sokobanja, Eastern Serbia)
- Multi-hazard modeling of erosion and landslide susceptibility at the national scale in the example of North Macedonia
- Understanding seismic hazard resilience in Montenegro: A qualitative analysis of community preparedness and response capabilities
- Forest soil CO2 emission in Quercus robur level II monitoring site
- Characterization of glomalin proteins in soil: A potential indicator of erosion intensity
- Power of Terroir: Case study of Grašac at the Fruška Gora wine region (North Serbia)
- Special Issue: Geospatial and Environmental Dynamics - Part I
- Qualitative insights into cultural heritage protection in Serbia: Addressing legal and institutional gaps for disaster risk resilience