Vertical high-velocity structures and seismic activity in western Shandong Rise, China: Case study inspired by double-difference seismic tomography
-
Zhengshuai Zhang
 ,
Jianchang Zheng
,
Jianchang Zheng

Abstract
In this article, we collected the seismic phase arrival data (115°–120°E, 34°–39°N) of 2,833 local natural earthquakes above magnitude 1.0 recorded by 128 seismograph stations provided by the China Earthquake Networks Center covering the period from January 2008 to October 2023. We extracted the first arrival P- and S-wave arrival time data and obtained 26,351 P- and 26,349 S-wave absolute arrival times and 99,627 P-differential and 99,625 S-differential arrival times. Then, we determined 3-D P and S wave velocity structures under the Luxi region by using the double-difference tomography method. The results show lateral heterogeneities under the Luxi region, and the distribution of surface basins and uplift zones is associated with seismic velocities within the crust. The vertical section shows the widespread presence of vertical high-velocity bodies within the crust of the Luxi region, indicating seismological evidence of mantle upwelling in the region. Meanwhile, our imaging results also clearly indicate the presence of a significant low-velocity anomaly at depths of 13–17 km, which corresponds to the presence of a high-conductivity layer at that depth obtained from electromagnetic bathymetry. The transition zone between high and low velocities exists at a depth of 7–13 km, which plays an important role in the transfer of lithospheric stresses from the deep to the shallow part of the lithosphere. Combined with the results of the previous deep seismic wave velocity structure, petrology, and geological investigations, the deep dynamical background of the formation of slip tectonics and seismic mechanism in the Luxi area can be attributed to the go-slip activity of the Tan-Lu fault Zone, the subduction of the Pacific Plate, and the magmatism generated by mantle upwelling.
1 Introduction
Shandong, located in the eastern part of mainland China, is divided into eastern and western regions by the Tancheng–Lujiang fault zone oriented in the NNE direction (Figure 1a). The eastern part is primarily composed of the Jiaobei uplift, Jiaolai basin, and Jiaonan uplift (Figure 1b). The western region of Shandong, referred to as the Luxi region is further divided into the Luxi uplift zone and Jiyang depression zone by the Qihe-Guangrao fault [1,2]. The Jiyang depression is a significant oil-bearing basin in China, making the western Shandong area a focus of attention among geologists due to its unique geological features and abundant mineral resources. The Luxi uplift zone is one of the most important tectonic units in the eastern part of the North China Craton (NCC), bounded by the Tancheng-Lujiang fault to the east, the Liaohe-Lankao fault to the west, the Chengning uplift to the north, and the Fengpei fault to the south (Figure 1b). Surrounding the Luxi uplift zone are basins or plains, and the internal main fault structures in the basins on both the eastern and western sides are oriented in the NE-NNE direction. In contrast, the western Shandong area is a topographic uplift zone, with its main faults oriented in the NW–NWW direction, controlling the distribution of Cenozoic and Neogene sedimentary landforms, topography, and stratigraphic sequences [3,4]. We collected the focal mechanisms of 49 M ≥ 6.5 earthquakes in and around the study area, which are mainly of the strike-slip type, as shown in Figure 1a [5].
![Figure 1
Earthquakes and tectonics on a topographic map. (a) Seismicity in the study region (black pane) and surrounding regions. The focal mechanisms were obtained from the previous studies [5]. (b) Simplified geological map of Western Shandong, modified after [4,6]. The black lines indicate the faults. F1: Taishan-Tongyedian fault; F2: Xintai-Duozhuang fault; F3: Mengshan fault; F4: Wensi fault; F5: Ganlin fault and F6: Nishan fault. The thin black dotted line represents depression. B1: Laiwu Basin; B2: Feicheng Basin; B3: Wenkou Basin; B4: Mengyin Basin; B5: Ningyang Basin; B6: Sishui Basin; and B7: Pingyi Basin; B8: Jiyang depression.](/document/doi/10.1515/geo-2022-0699/asset/graphic/j_geo-2022-0699_fig_001.jpg)
Earthquakes and tectonics on a topographic map. (a) Seismicity in the study region (black pane) and surrounding regions. The focal mechanisms were obtained from the previous studies [5]. (b) Simplified geological map of Western Shandong, modified after [4,6]. The black lines indicate the faults. F1: Taishan-Tongyedian fault; F2: Xintai-Duozhuang fault; F3: Mengshan fault; F4: Wensi fault; F5: Ganlin fault and F6: Nishan fault. The thin black dotted line represents depression. B1: Laiwu Basin; B2: Feicheng Basin; B3: Wenkou Basin; B4: Mengyin Basin; B5: Ningyang Basin; B6: Sishui Basin; and B7: Pingyi Basin; B8: Jiyang depression.
The Luxi area is situated in the eastern part of the NCC, and belongs to the first-level tectonic unit within the NCC. It has a typical North China-type crystalline basement structure. The crystalline basement comprises metamorphic rocks of the Archean Taishan Complex, while the sedimentary cover includes Paleozoic, Mesozoic, and Cenozoic carbonate rocks or clastic rocks. In particular, the Paleozoic strata are predominantly marine carbonate rocks, while the Mesozoic and Cenozoic basins are characterized by terrestrial clastic rocks, volcaniclastic rocks, and lacustrine mudstones [7,8]. The western Shandong region has undergone a highly complex tectonic evolution, particularly since the Late Mesozoic. Tectonic activity in the study area has been dynamic, coupled with regional geotectonic changes and structural deformations in surrounding basin groups. The region has primarily experienced three tectonic evolution stages during the Indosinian, Yanshanian, and Himalayan periods [9,10]. The Indosinian period is the initial stage of the formation of the geotectonic pattern of the Chinese continent. In the Middle and Late Triassic, the Yangzi plate was subducted along the NNE to the North China plate, which suffered from uplift and denudation under the strong near-SN extrusion and produced a series of reverse faults spreading in the near-EW direction [9,11]. Since the Early-Middle Jurassic, as the collision and extrusion activities between the Yangzi Plate and the North China Plate began to gradually weaken, North China entered the Yanshan Movement stage. In the Late Jurassic-Early Cretaceous, the Izanagi Plate began to subduct the Eurasian Plate at a high speed and low angle, resulting in mantle upwelling in the Early Cretaceous, and the study area changed from a weakly extruded to a back-arc extensional environment [12]. During the Himalayan orogeny, under the subduction of the Pacific Plate, the remote effect of the collision of the Indian Plate on the Eurasian Plate, and the conversion of the Tan-Lu fault from left-rotation strike-slip to right-rotation strike-slip and other stresses, the lithosphere of eastern China was thinned, and the Luxi Rise was rapidly uplifted at this time, and at the end of the Eocene, the Rise and the Jiyang Depression separated from each other [13,14,15]. The Luxi region development and evolution of Mesozoic–Cenozoic extensional structures share a similar tectonic background with the NCC. The development is mainly controlled by three stress interactions: interplate interactions along the periphery, manifested by the post-arc extension caused by the subduction of the Western Pacific Plate beneath the Eurasian Plate, forming a trench-arc-basin system [16,17]; local stress fields generated by boundary faults, particularly the strike-slip activity along the Tancheng–Lujiang Fault Zone in the eastern boundary, inducing block movements and generating an extensional-strike-slip deformation field in its hinterland [18,19]; and the gravitational tension on the overlying lithosphere generated by upwelling and convection of deep mantle material [20]. Since the Mesozoic, the crust in the western Shandong region has undergone compression, extension, shearing, and other tectonic processes, resulting in the structural combination of the Luxi uplift and the Jiyang depression, forming the overall tectonic pattern of the western Shandong region. Therefore, the Luxi region has become one of the optimal study areas for researching continental internal dynamics.
In recent years, significant progress has been made in geophysical exploration in the eastern part of China [21,22,23]. Abundant exploration results have provided a basis for the study of lithospheric structure and deep structures in the NCC, also supporting the evidence for lithospheric thinning in the Mesozoic in the North China region. Zhang inferred the thickness of the lithosphere in the Bohai Bay Basin and surrounding areas using geothermal field data and electromagnetic deep sounding, revealing the correspondence between the basin and the crust-mantle regional uplift [24]. Gong et al. calculated the current average geothermal gradient of the Jiyang depression based on temperature data from over 700 wells, obtaining a value of 35.5°C/km [25]. Jiang et al. used large-scale Bouguer gravity data to invert the crustal structure of the Bohai Bay Basin and adjacent areas [26]. The middle and upper crust are controlled by NNE-oriented structures, and many faults extend down to the middle crust. Shear wave splitting is one of the effective means to study the anisotropic characteristics of crustal media [27]. The fast-wave polarization in the crust is always a few degrees above ten with the SKS fast-wave in the Shandong area. This difference may show the decoupling of crustal movement and mantle deformation in the Shandong region [28]. Seismic tomography can obtain the velocity structure characteristics of the study area, which is important for understanding the geodynamic background and the environment of seismicity [29]. The S-wave velocity structure at a resolution of 2° × 2° reveals key evidence that the lithosphere of the overlying plate in the NCC region has been subjected to thermochemical erosion/transformation, leading to lithospheric destruction [30]. Tang et al. analyzed the crustal structure of the Jiyang depression based on a V p velocity structure diagram along the Yiyuan–Laoling–Dacheng profile [31]. They identified a three-layered structure: the upper crust with V p ranging from 5.7 to 6.3 km/s and V s from 3.0 to 3.7 km/s, dominated by brittle fractures; the middle crust with V p ranging from 6.45 to 6.55 km/s and V s from 3.8 to 3.9 km/s, representing a low-velocity zone, suggesting the possible presence of magma chambers, magma sheets, or fluids, and serving as the boundary layer where the upper crustal fractures detach [31,32]. Based on a wide-angle reflection seismic profile, Wang et al. identified near-vertical, high-velocity anomalies in the crust of western Shandong [33]. Wang et al. inverted the 3D velocity structure of the crust and upper mantle in NCC and analyzed the differences in velocity structure between different tectonic blocks [34]. Li et al. utilized natural seismic P-wave arrival time data in the circum-Bohai Sea region. Employing a grid with dimensions of 0.5° × 0.6° in latitude and longitude, they inverted the three-dimensional P-wave velocity structure of the crust and upper mantle in the region [35]. Su et al. inverted the P-wave velocity structure of the Shandong region using a 0.5° × 0.5° grid. They identified large-scale low-velocity anomalies at depths below 20 km in the Luxi fault block, which is related to the large-scale detachment tectonics that occurred in the Eocene [36].
The deployment of numerous digitized seismic stations and the acquisition of high-precision seismic wave time arrival data have positioned seismic stratigraphic imaging as a crucial tool for investigating the structure of the Earth’s crust and mantle. With strong tectonic activity and active magmatic activity, the Luxi area is an important study area for analyzing the destruction of the NCC. Most of the previous research results have focused on large-scale tomography of the NCC, and the resolution of the velocity structures is only about 0.5° due to constraints such as station distribution and data sample limitations. A comprehensive understanding of the crustal velocity structure in the Luxi area is still insufficient, and there is a need to improve the imaging resolution. The systematic geophysical interpretation of the deep structure, crustal morphology, and media properties in the Luxi area needs further clarification and discussion. In this work, we have made great efforts to collect a large number of high-quality seismic phase data that covers the Luxi area densely and uniformly. We applied the advanced double-difference tomography method to obtain a more detailed model of the three-dimensional P- and S-wave velocity structure of the Luxi region. Focusing on the characteristics of the crustal structure of typical tectonic structures such as uplifts and faults in the Luxi region, the deep tectonic environment, and controlling factors of seismicity, this provides new information for understanding the deep structure and dynamic evolution of the Luxi region.
2 Data and method
In this article, we collected the seismic phase data of earthquakes above magnitude 1.0 recorded by 128 seismometers in the research region (115°–120°E, 34°–39°N) and covered the period from January 2008 to October 2023 provided by China Digital Seismic Network (Figure 2a). After excluding non-natural seismic events such as explosions and collapses, a total of 2,833 natural earthquake events were identified. To ensure the reliability of the inversion results, a preliminary screening was applied to the obtained phase arrival times. This involved selecting events with travel time residuals (TRES) TRES ≤ 0.5 s and requiring a minimum of 8 seismic stations to have observed each seismic event. Furthermore, based on the travel time distance curves, we eliminated the data that deviated significantly from the theoretical travel time. Figure 2b shows the travel-time distance curves of P-wave and S-wave. Then, we use ph2dt executable program in the HypoDD software to combine seismic events into seismic pairs and extract relative travel-time data [37]. It is required that the interval between event pairs should be within the range of 0.1–10 km and the maximum distance between events and stations should be no more than 500 km. Finally, we obtained a total of 26,351 absolute P- and 26,349 absolute S-wave arrivals and 99,627 P- and 99,625 S-differential arrival times from 2,429 local earthquakes.
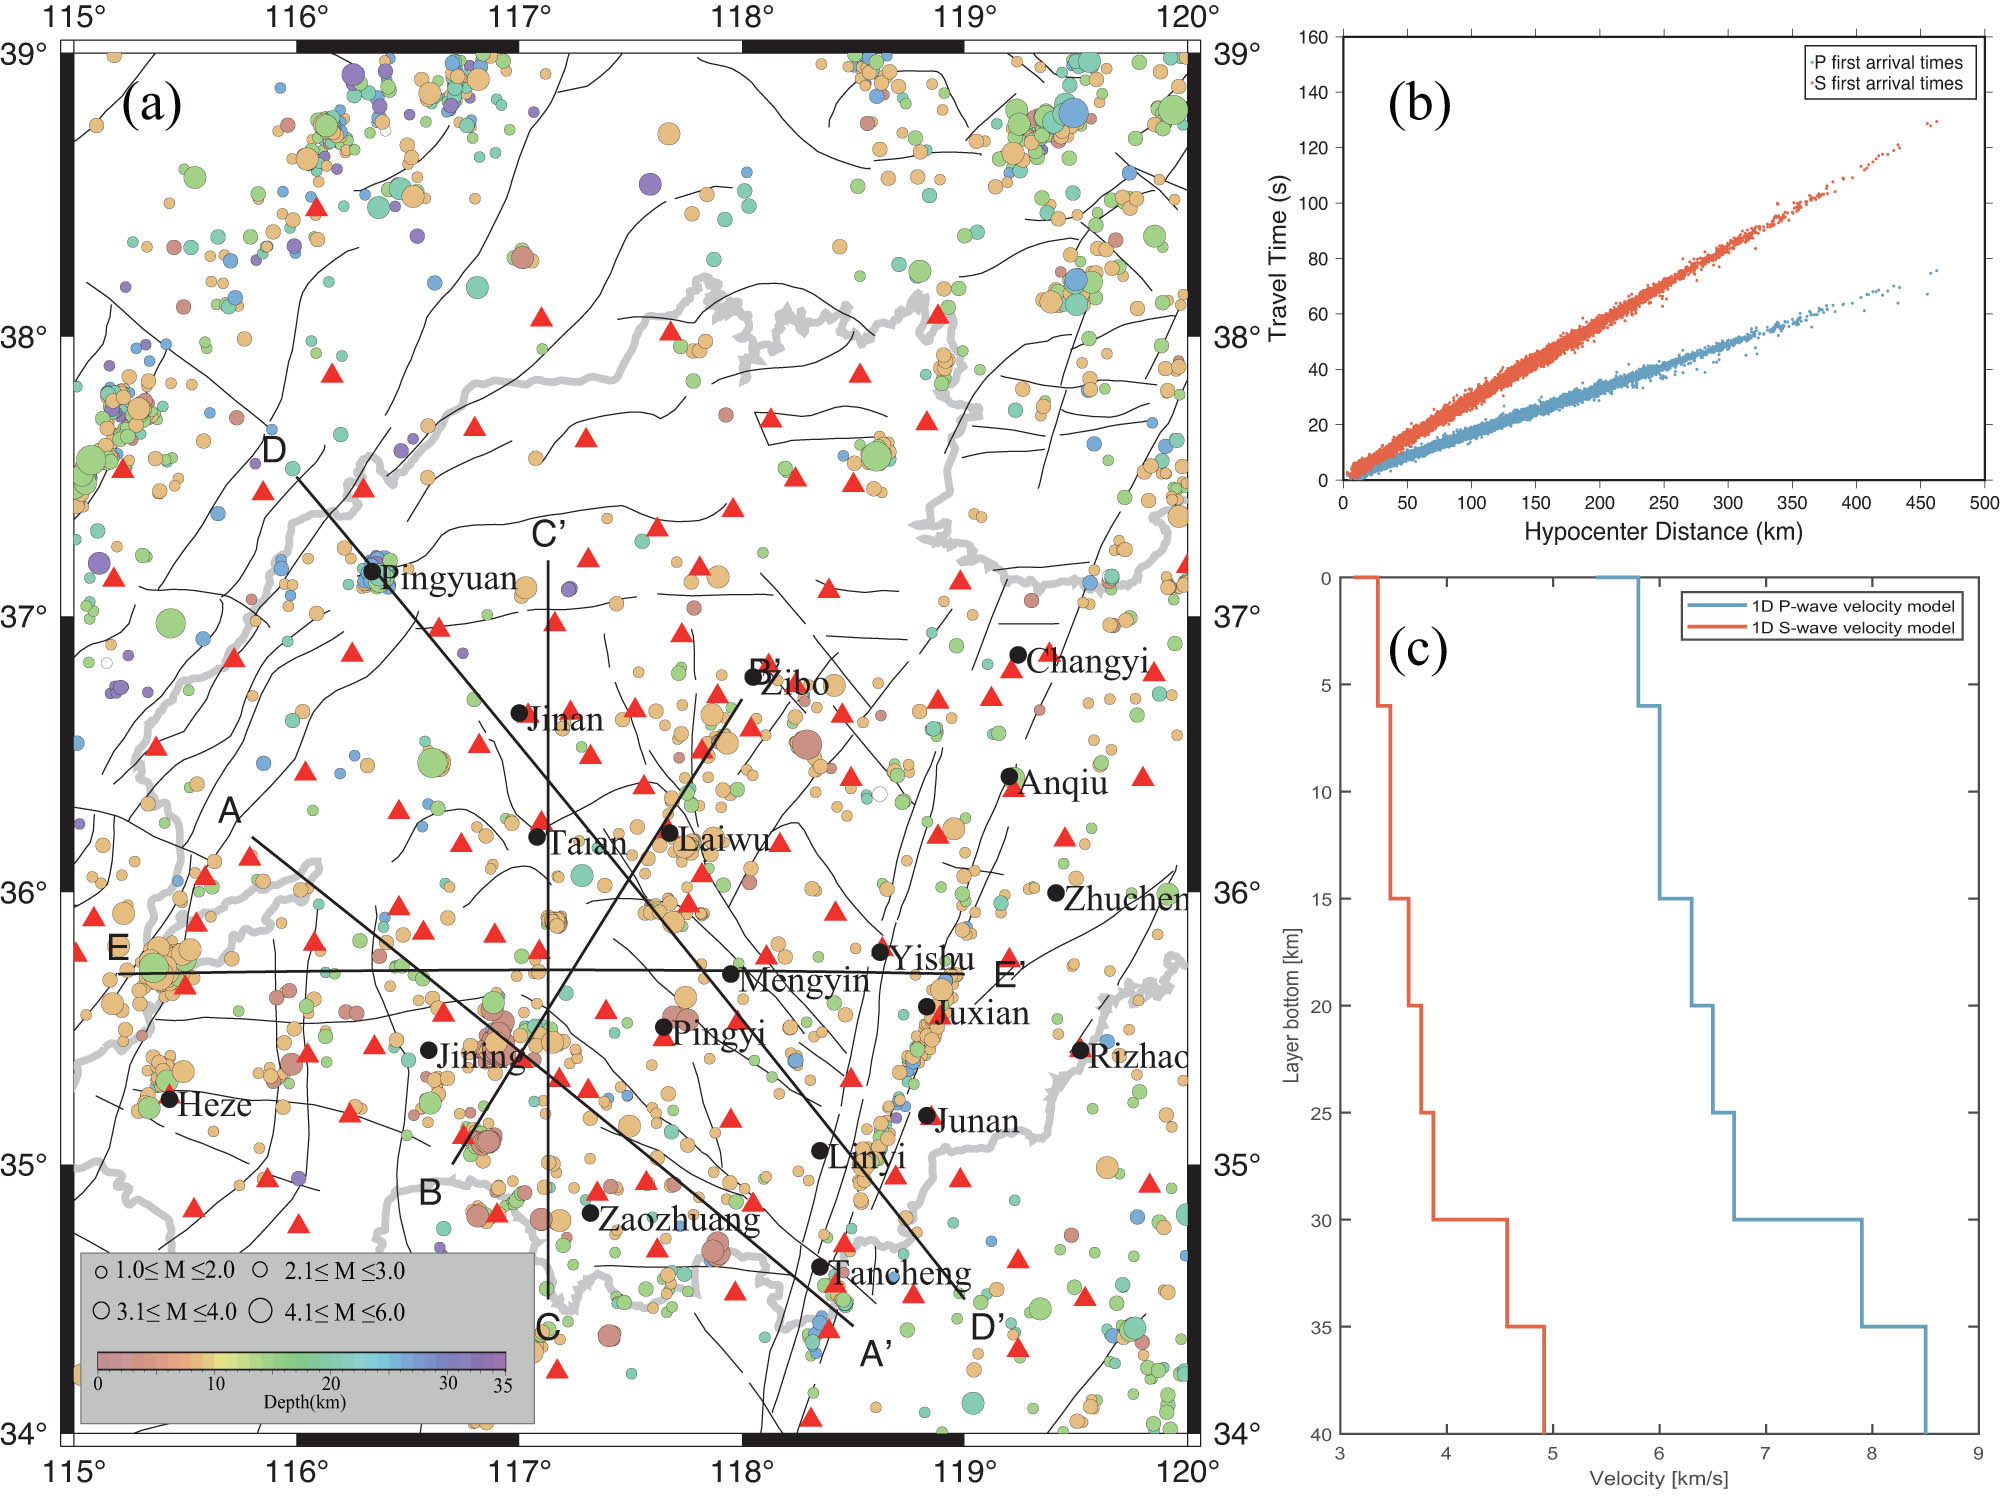
Seismic events and initial velocity model in this study. (a) Spatial distribution of the data set and five profile location. Red triangles indicate seismic stations. (b) Travel time distance curves of P and S wave. (c) The one-dimensional initial velocity model.
The tomoDD is an efficient method for characterizing the local and regional velocity structures and earthquake hypocenters [38,39]. As the name suggests, the tomoDD integrates the double-difference seismic location technique into tomographic inversion. This approach involves jointly inverting seismic source location parameters and three-dimensional velocity structures by utilizing both relative travel time data and absolute travel time data. In accordance with ray theory, the residual between the observed arrival time at seismic station k from seismic source i and the theoretical arrival time is expressed as:
where
Equation (1) is employed to establish the large-scale velocity structure of the study area and the absolute seismic source location using absolute arrival time data. Equation (2) is utilized to characterize the fine-scale velocity structure near the seismic source zone and the relative location based on arrival time data. In the double-difference relocation algorithm, it is assumed that neighboring events arriving at the same station share similar paths. However, when the distance between neighboring events exceeds the scale of velocity changes, the differences in paths caused by velocity heterogeneity become pronounced with significant variations in the seismic source locations. The tomoDD incorporates absolute arrival time data and accounts for spatial variations in the medium’s velocity structure, reducing errors caused by assuming constant velocity between station–event pairs in double-difference relocation. This approach allows for greater accuracy in seismic event localization, without imposing distance constraints on earthquake pairs [17,38].
3 Inversion details and regularization parameter
The double-difference tomography algorithm relies fundamentally on linear inversion, emphasizing the critical necessity of a robust initial velocity model [40]. In order to minimize the influence of the initial one-dimensional velocity model on the inversion results, a comprehensive analysis was performed based on the initial model and results used in previous seismic stratigraphic imaging studies in the region [33,34,41]. Finally, we employed the wide-angle reflection seismic profile across the western Shandong region, specifically the Liaocheng-Lianyungang, as the initial P-wave velocity model [33]. Within the depth range of 0–30 km, we set the P-wave to S-wave velocity ratio to 1.73. The initial P and S velocity model is shown in Figure 2c. The tomoDD is based on parameterizing the model using a three-dimensional regular grid. We transformed the initial one-dimensional velocity model into a series of 3D grid points. The grid nodes of the velocity model are spaced at intervals of 0.2° in both latitude and longitude directions (shown in Figure 3 in the blue cross grid), and inversion nodes in the vertical direction are located at 2, 6, 10, 15, 20, and 25 km depth. To minimize occurrences of seismic events at depths less than 0 km, the depth of the uppermost layer is set to −100 km, with a P-wave velocity assigned to 0.3 km/s. In the current version of tomoDD, we use the pseudo-bending ray-tracing algorithm to find the rays and calculate the travel-times between events and stations [42]. The model is represented as a regular set of 3-D nodes, and the velocity values are interpolated by using the trilinear interpolation method.
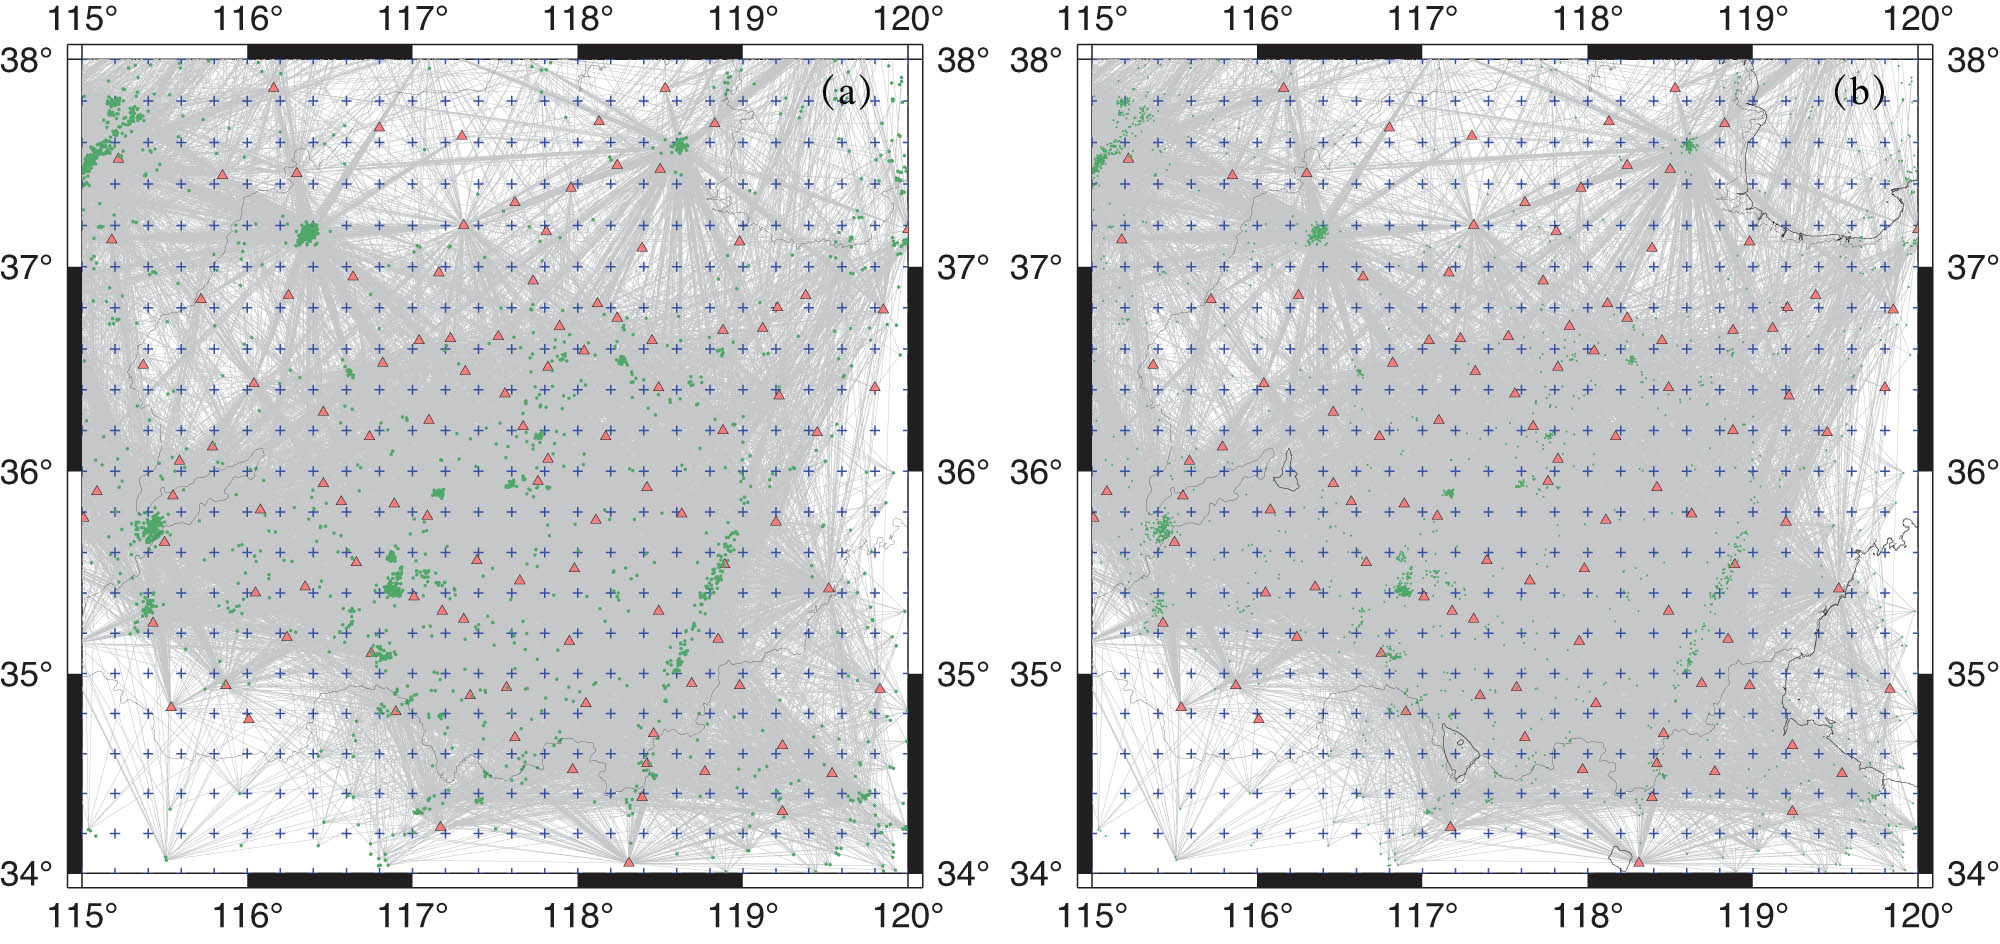
Seismic ray paths of P-wave (a) and S-wave (b) in the studied. Red triangles indicate seismic stations, green solid dots indicate earthquake locations, and blue crosses indicate inversion grid points.
Two types of data, namely absolute arrival times and catalog differential arrival times, are utilized in the inversion process. To amalgamate these data types into unified data, we implement a hierarchical weighting scheme akin to hypoDD [43]. Initially, greater weight is assigned to the absolute data, facilitating the determination of large-scale velocity structures. Subsequently, we systematically diminish the weight of the absolute data while concurrently increasing the weight assigned to the differential data. This approach enables the extraction of fine-scale velocity structures within the source region. The tomoDD algorithm alternates between joint inversion of hypocenter parameters and velocity; however, the convergence rate of the velocity structure is faster than that of the hypocenter. To balance the inversion coordination between the two, it is customary to add a separate positioning inversion after each joint inversion. In this article, a total of 10 iterations are carried out in the whole inversion process, with two simultaneous seismic relocation and velocity tomography and one seismic relocation only performing alternately. The tomoDD inverts iteratively for hypocenter locations and velocity structure using Least Square QR factorization (LSQR) [44]. It takes the second-order norm of the travel-time residual as the objective function and iterates many times until a stable solution is obtained.
In the tomoDD, the LSQR algorithm is employed, utilizing the two-norm of the total travel-time residuals as the objective function for an iterative solution. The trade-off of damping and smoothing weight parameters has a greater impact on the stability of the inversion results [45,46,47]. Therefore, in order to make the inversion more stable, we tested the damping factor (from 10 to 1,500) and the smoothing weight factor (from 0.001 to 10,000), and the equilibrium curve of the data variance and the model variance is drawn. The smoothing factor is utilized to restrict variations in slowness. Consequently, a balance analysis is conducted by weighing the two-norm of slowness variation against the two-norm of total travel-time residuals (refer to Figure 4a). The damping parameter concurrently imposes constraints on changes in both earthquake locations and slowness. Hence, a balance analysis for the damping parameter is carried out by considering the two-norms of earthquake locations, slowness variation, and total travel-time residuals (refer to Figure 4b). The optimal regularization parameter corresponds to the point on the L-curve with the maximum curvature, referred to as the L-corner. We solve for the numerical gradient of the discrete points and then find the point with the largest change in the maximum gradient, from which we determine the location of the L-corner. In this article, we have ultimately selected a smoothing factor of 40 and a damping factor of 150 as control parameters for the inversion process.
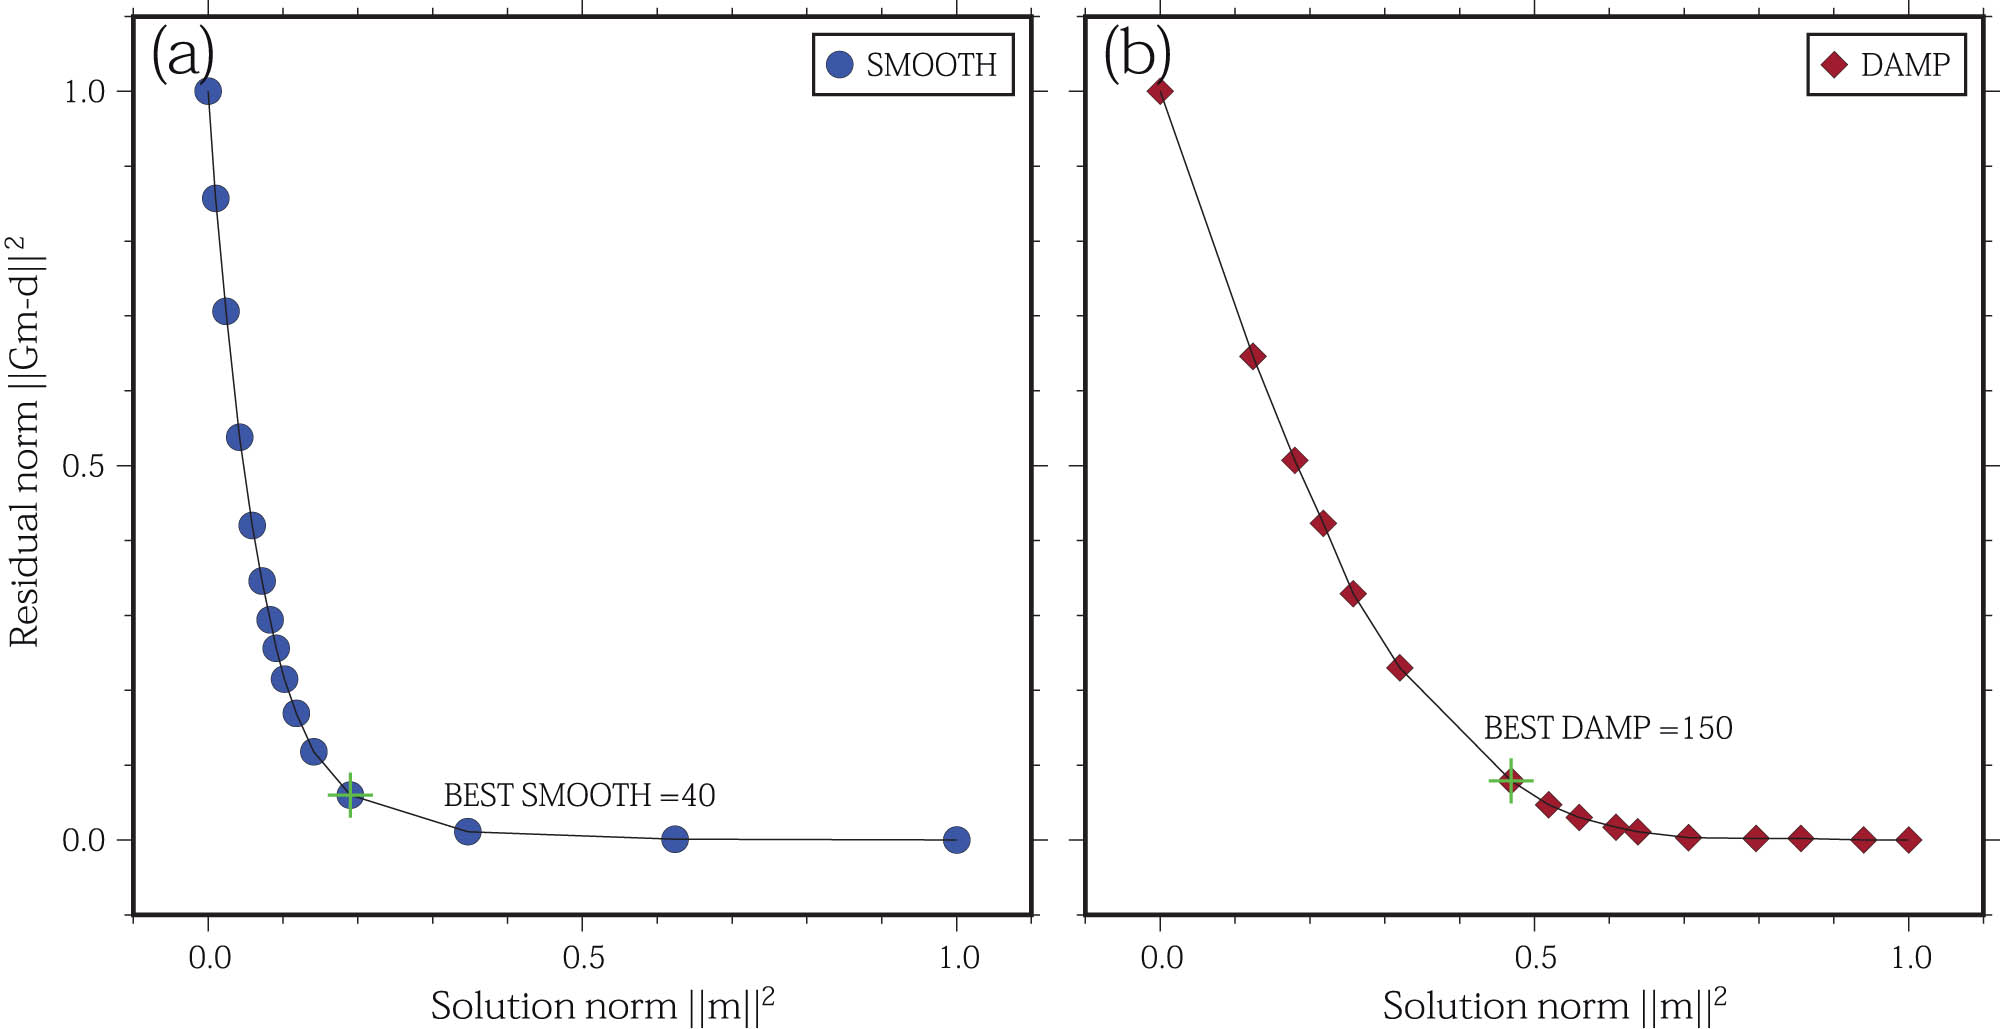
Trade-off curves of (a) smoothing and (b) damping weight parameters. The horizontal axis represents the normalized norm of slowness variation, and the vertical axis represents the normalized norm of the overall travel-time residual.
4 Results and discussion
The resolution of inversion results is influenced by factors such as the spatial distribution of earthquakes, station coverage, seismic ray density, and intersections among rays. To assess the reliability and spatial resolution capability of the velocity structure inversion, we conducted a checkerboard test [48,49]. In this test, velocity model nodes were arranged in a spatially alternating “checkerboard” pattern, and random errors were introduced during the computation of theoretical travel times to examine the stability under this model configuration. Positive and negative velocity anomalies of ±5% are assigned to the grid nodes adjacent to each other for P and S velocity. Figures 5 and 6 show the results of the checkerboard tests for P- and S-wave tomography with a grid spacing of 0.2° × 0.2°. Both the checkerboard pattern and velocity anomaly amplitudes at different depths are well reconstructed. In contrast, the northern part of the study area is not well restored to the checkerboard test. The northern segment of the study area is predominantly characterized by a faulted basin featuring a substantial cover layer. Compounded by a limited number of permanent stations (as depicted in Figure 2a), the recorded seismic phases from existing stations are notably unclear, resulting in poor data quality and the consequent absence of seismic phase travel time data. This absence, in turn, diminishes the resolution for the area. The distribution of seismic wave rays in Figure 3 also shows a clear lack of ray coverage in the northern region. In order to quantitatively assess the reliability of the inversion results, we chose the Distribution of Derivative Weight Sum (DWS) parameters to evaluate. The parameter DWS is an indicator of the average relative ray density surrounding a given node. Evidently, the relationship graph between model resolution values and DWS values illustrates that higher DWS values correspond to a denser distribution of rays, thereby leading to enhanced resolution [39,50]. In this study, we adopted parameter selections from prior research on double-difference tomography, and in conjunction with chessboard test results, we ultimately opted to retain regions where the DWS values exceeded 100. This meticulous criterion ensures the reliability of our imaging results [51,52,53,54].
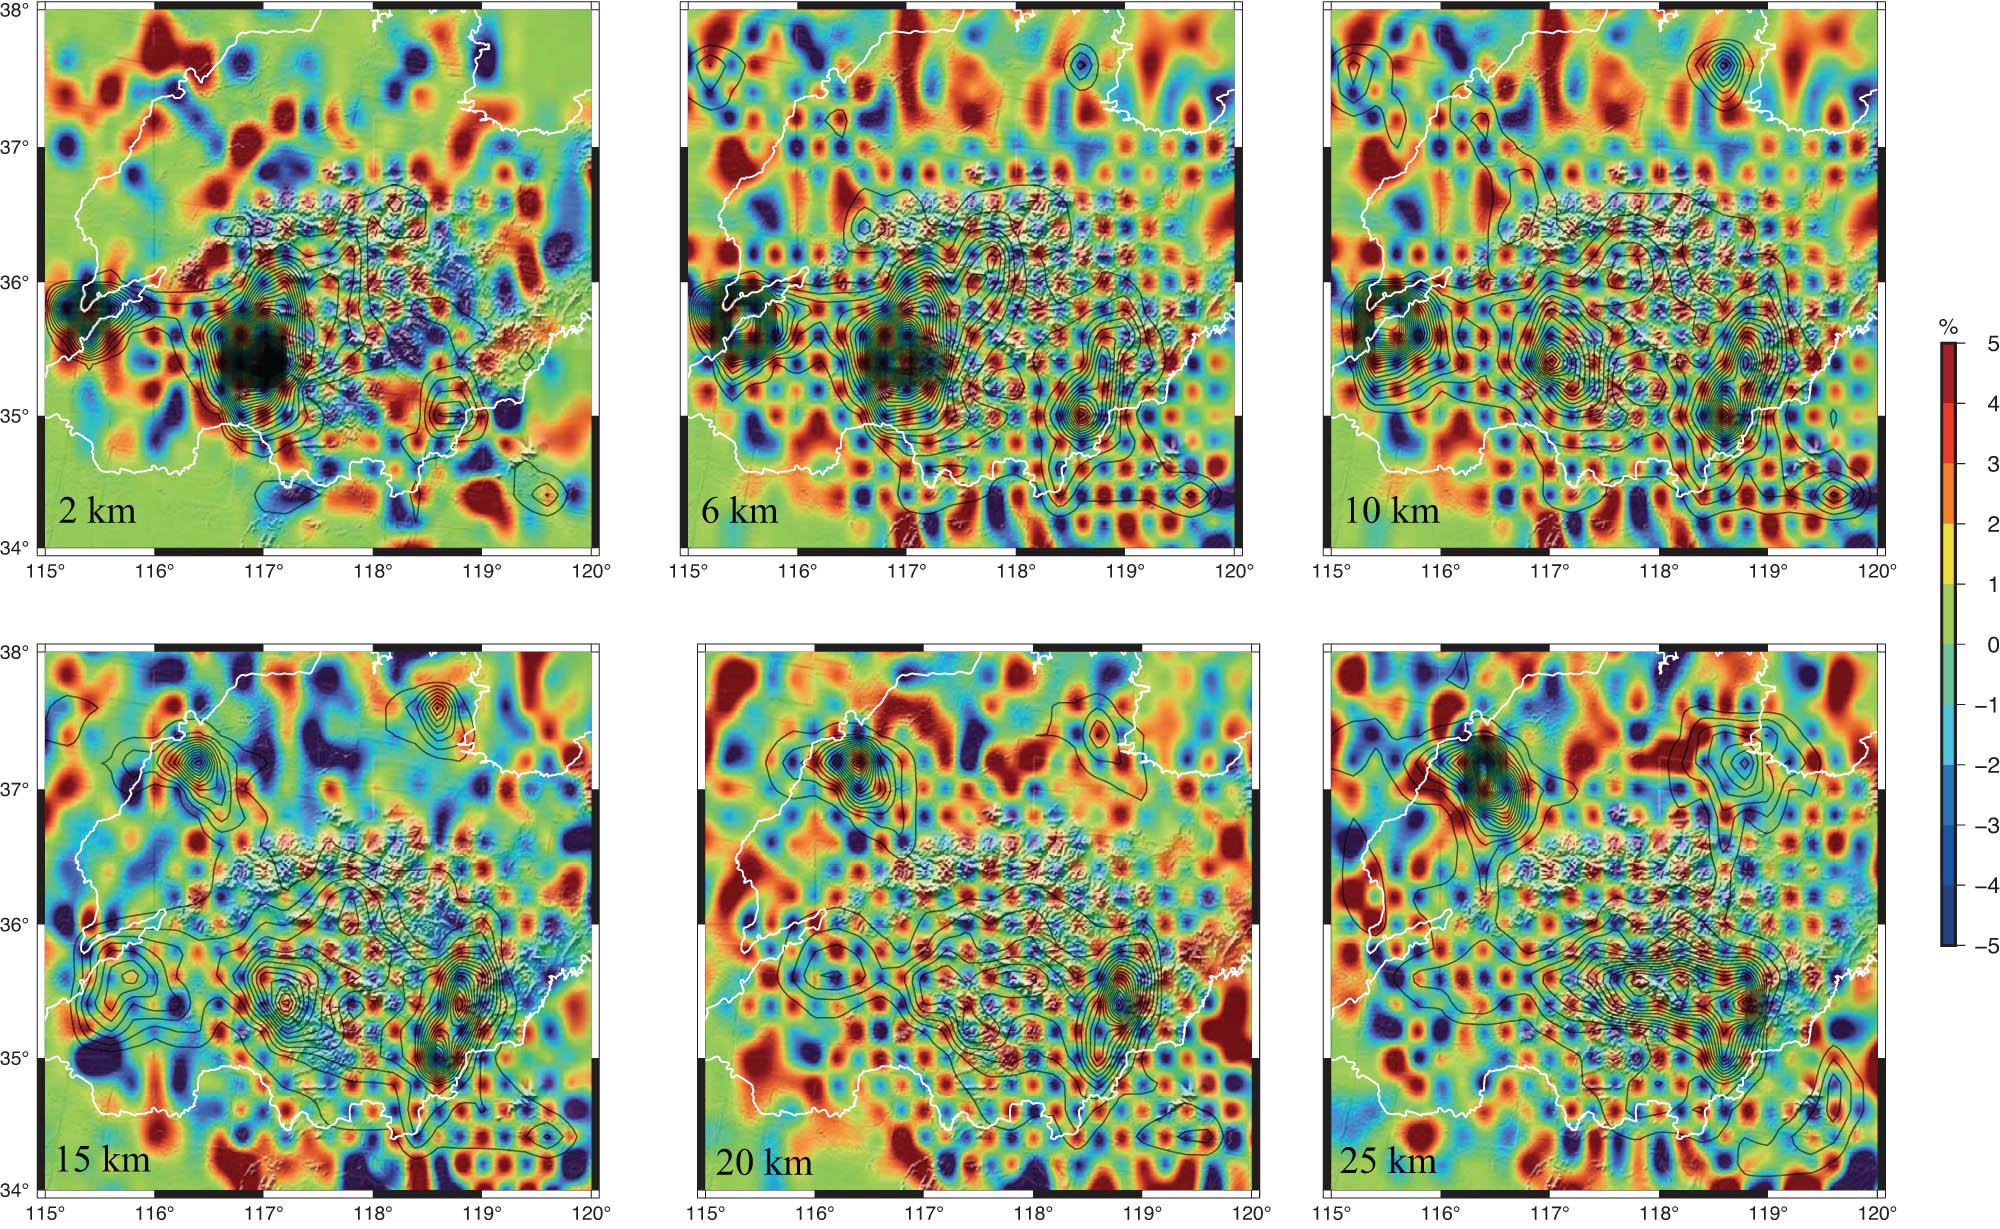
Results of a checkerboard resolution test for P-wave tomography. The velocity perturbation scale is shown at the right. The amplitude of velocity perturbations is 5 percent in the input model. The layer depth is shown at the lower-left corner of each map. The white line indicates the provincial boundary of Shandong Province. The black contours represent DWS > 100 distribution.
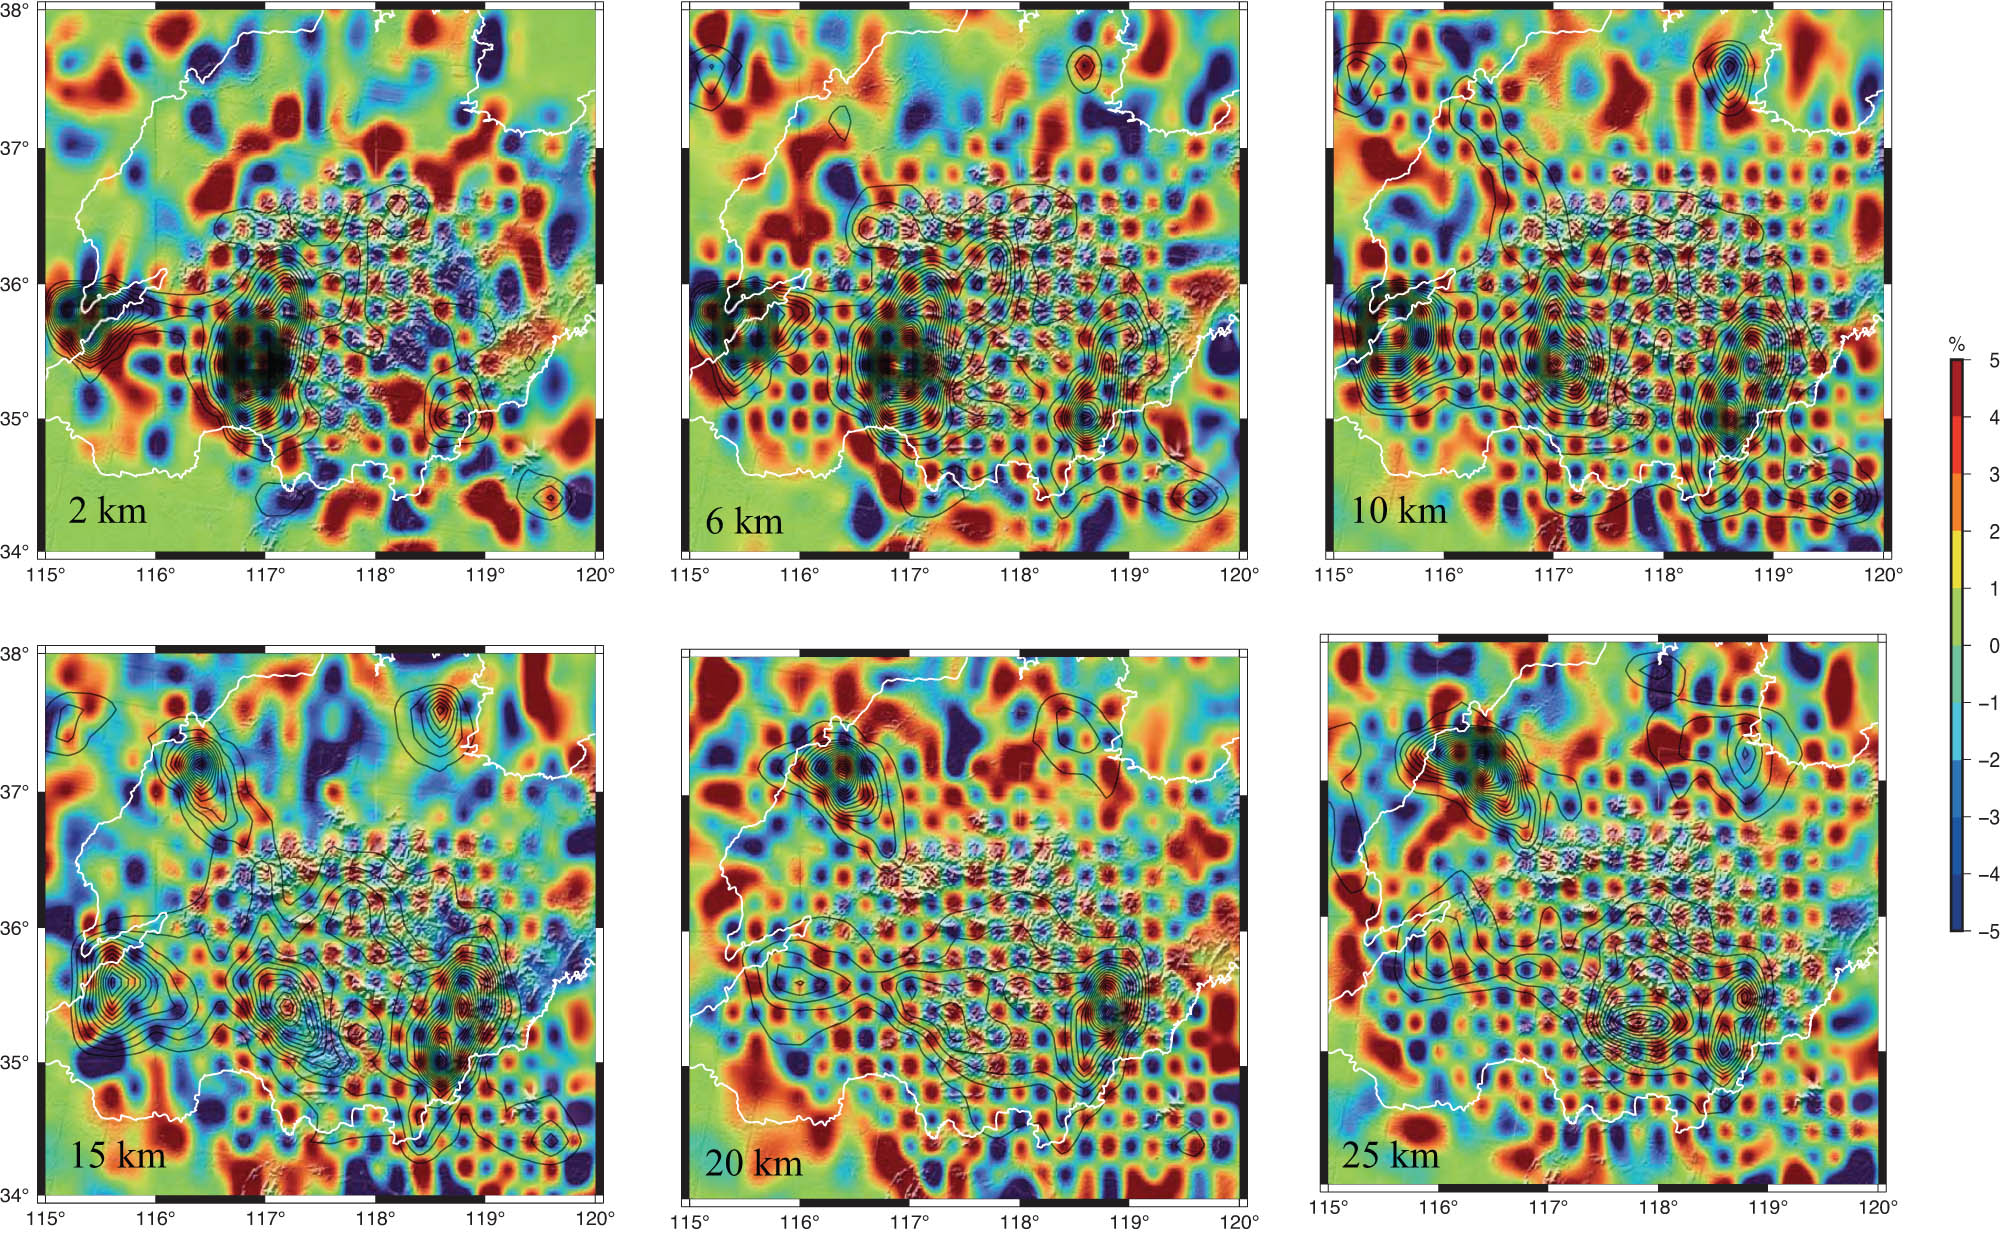
The same as Figure 5 but for the S-wave checkerboard test.
Figure 7 shows the RMS histogram of travel-time residuals before and after earthquake relocation. Notably, seismic phase travel time residuals exhibit a considerable increase for stations located in the northern part of the study area relative to those in the southern part. This discrepancy is primarily attributed to the thicker cover layer in the northern basin. Importantly, there is a discernible and significant reduction in residuals for each station after relocation. In addition, Figure 7b and c give the distribution of the traveled residuals for the P- and S-waves, respectively. Before the inversion, the travel-time residuals are mainly in the range of −2 to 2 s. After the inversion, most of the seismic wave travel-time residuals are concentrated in a narrow range of −0.3 to 0.3 s. The root mean square (rms) P-wave travel-time residual is reduced to 0.06 s from 0.54 s. Similarly, the rms of the S-wave travel-time is reduced from 0.71 to 0.10 s.
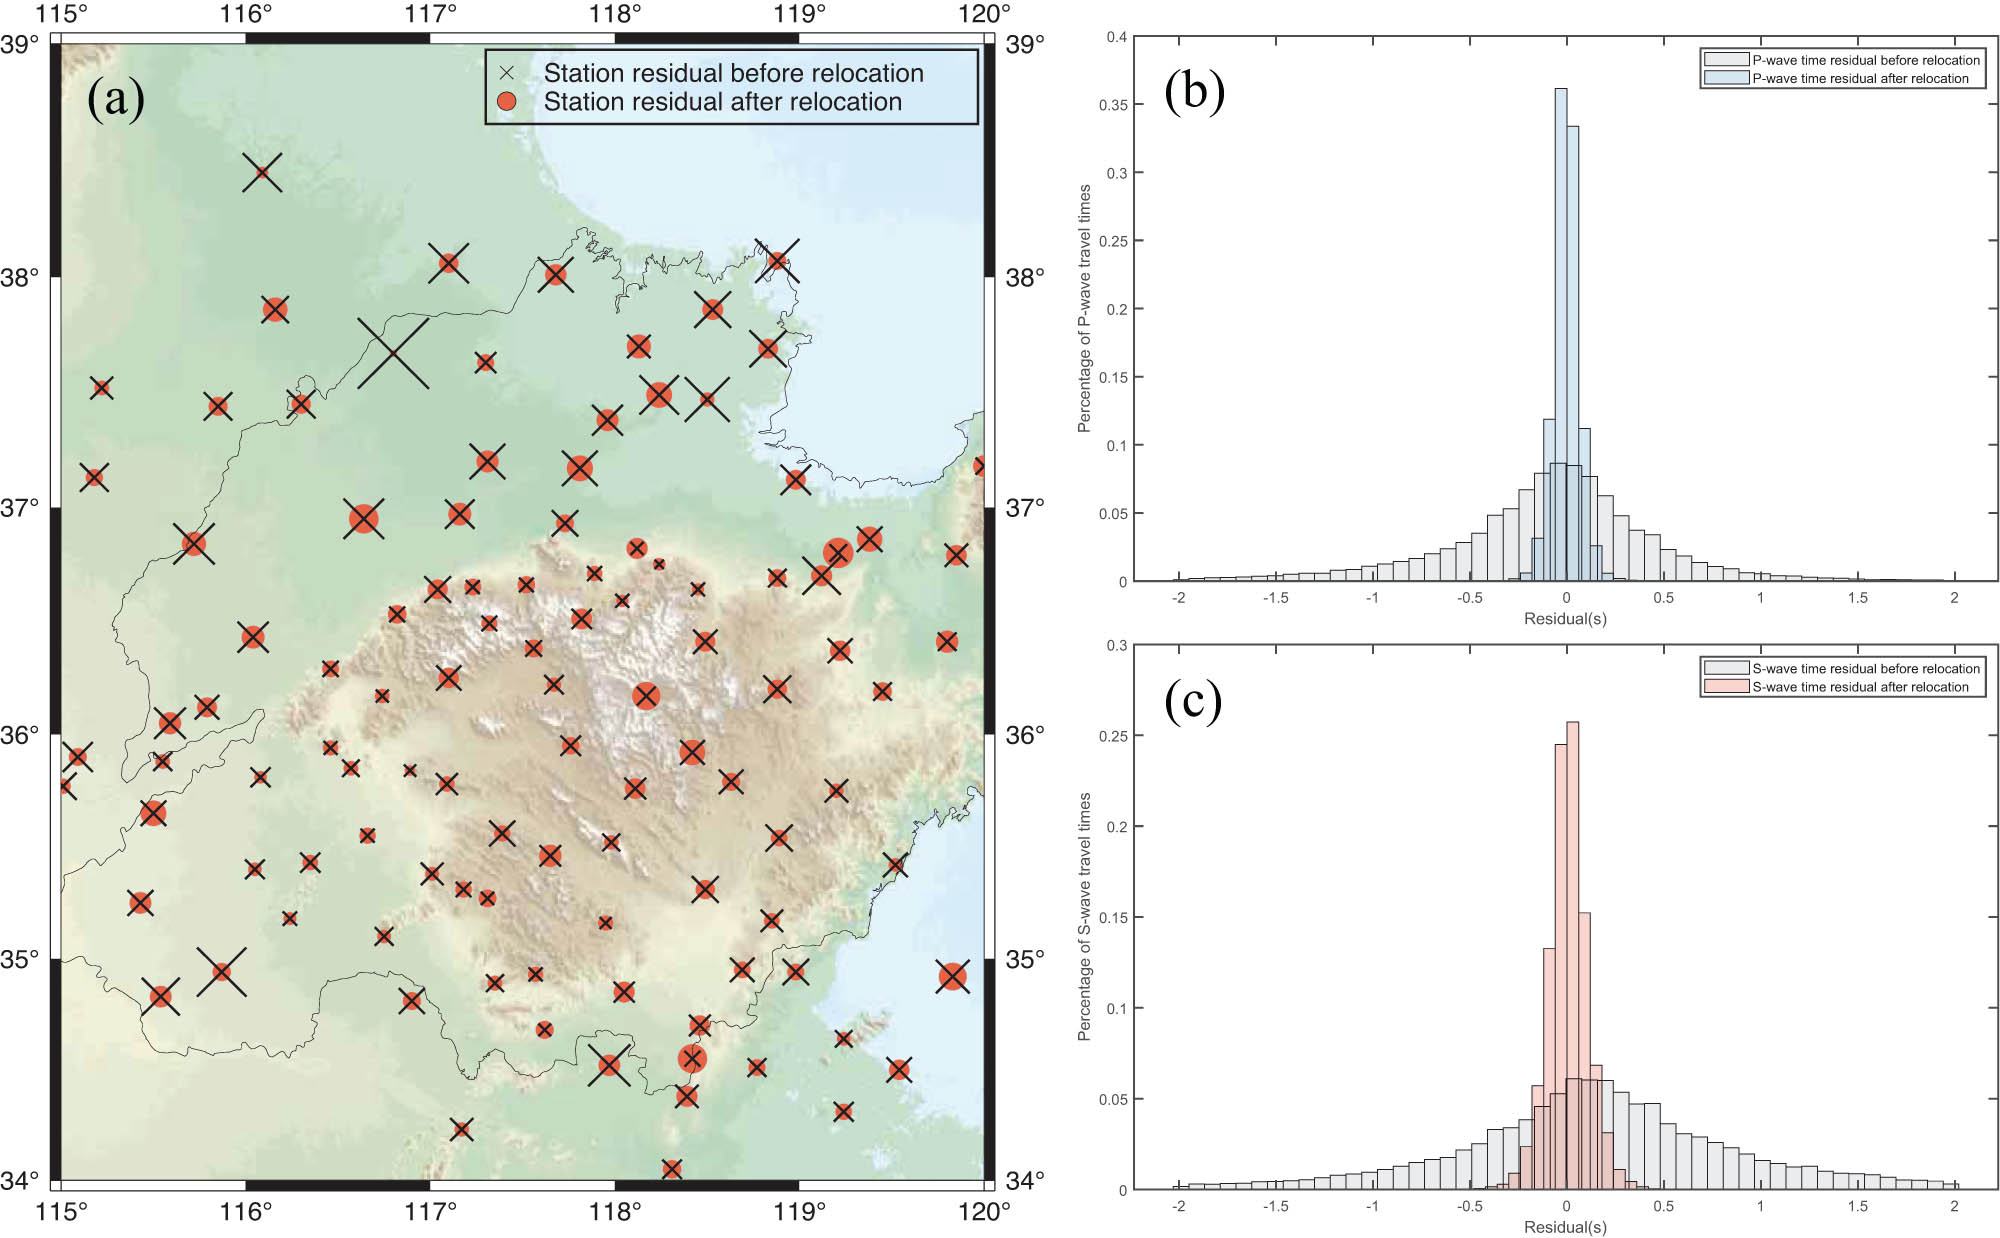
(a) The travel-time errors of seismic stations before and after inversion; (b) The histogram of P-wave and (c) S-wave travel-time residuals before (gray) and after (colored) inversion.
4.1 Crustal structural features
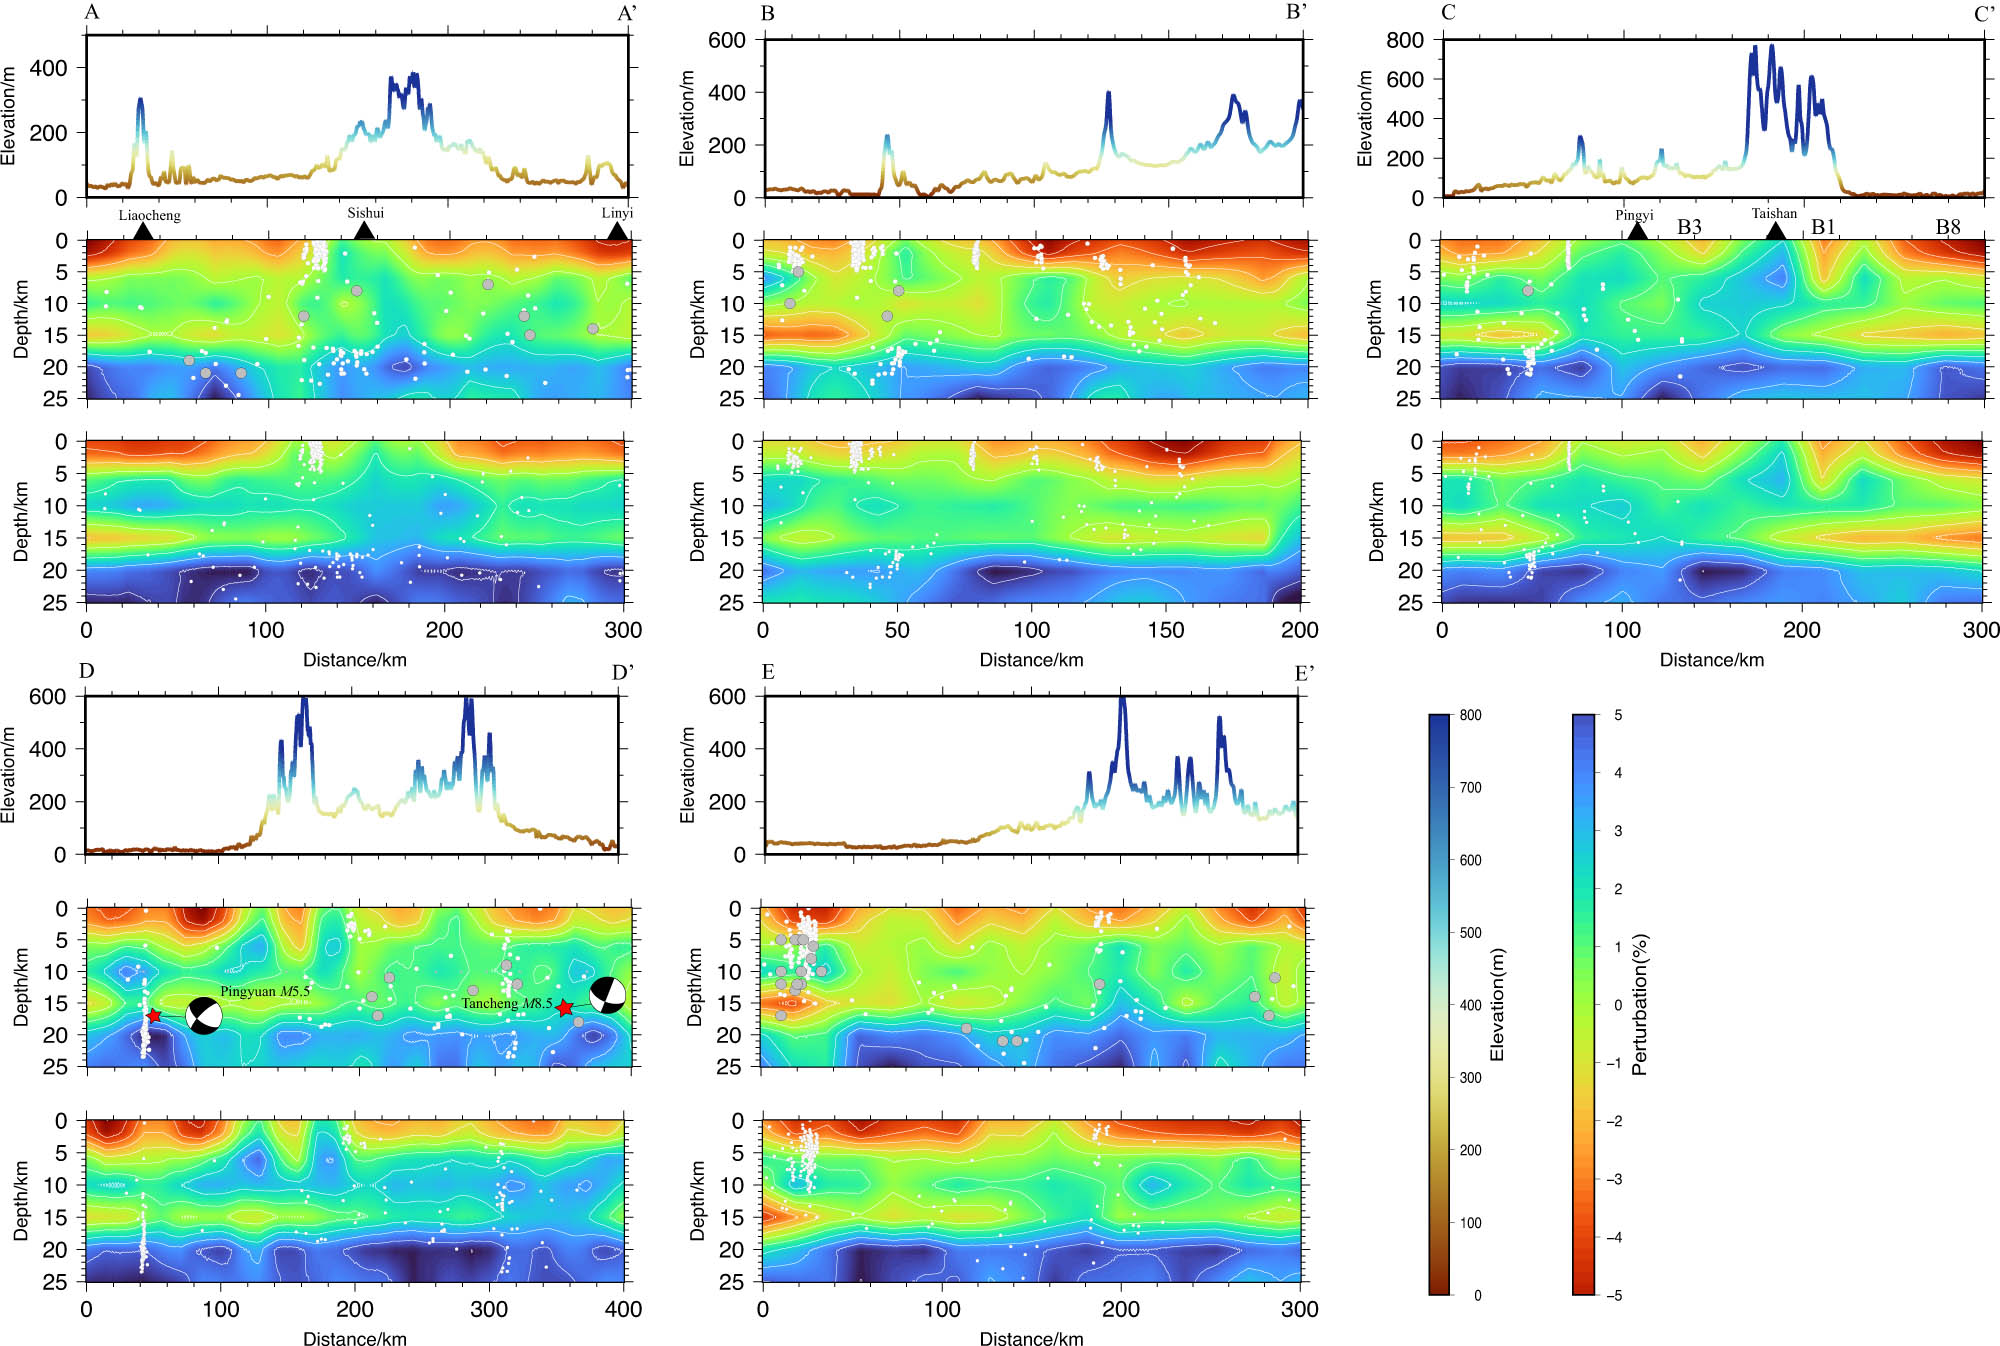
Figures 8 and 9 show the results of high-resolution 3D stratigraphic imaging of P- and S-wave velocities within the middle and upper crust of western Shandong. Only the distribution of velocity structures with DWS >100 is plotted in the figures. These maps also depict the distribution of earthquakes that occurred within a layer of 10 km thickness bound to each slice. From the overall analysis, the crustal velocity structure in the study area shows obvious unevenness in the horizontal directions. The distribution of surface basins and uplifted areas often correlates with variations in seismic velocities within the crust. The results of the horizontal stratigraphic imaging at a depth of 2 km represent a shallow velocity structure that agrees well with known geologic formations. The delineation between the uplift zone and the basin is relatively obvious. For instance, in Figure 1b, the Laiwu Basin, Feicheng Basin, and Ningyang Basin all exhibit discernible low-velocity body anomalies, a characteristic attributed to the substantial thickness of sedimentary layers. In order to more intuitively recognize the relationship between seismic wave velocity structure and geomorphology, we obtained the vertical velocity structure distribution of the CC’ profile along the longitudinal direction vertically from south to north through the Luxi region, as shown in Figure 10CC’. We can clearly see that the faulted basins correspond to low-velocity zones within the crust, while there is a clear intrusion of high-velocity anomalies beneath Taishan and Pingyi. The Liaocheng–Lianyungang deep seismic sounding (DSS) profile reveals the presence of a nearly upright, high-speed anomaly in the crustal velocity structure in the Luxi region [33,55]. We found velocity structure features similar to the DSS using natural seismic tomography. We extracted the vertical cross-sections of velocity by following the location of the DSS profile from Liaocheng to Lianyungang (as shown in Figure 10AA′). The crustal structure section (Figure 10AA′) shows that there are near-upright high velocity bodies in the crust, which extend from the lower crust into the upper crust, and the top reaches almost to the base of the sedimentary basin. The high-velocity bodies are about 40 km wide between Liaocheng and Sishui, and about 60 km wide between Sishui and Linyi. In addition, our results reveal the existence of vertical high-velocity bodies beneath Linyi with a width of about 25 km. The other profiles are also characterized by high-velocity body intrusion. These high-velocity bodies may be taken as the seismological evidence for the uprising of lower crust material into the upper crust and reaching the bottom of the crystalline basement.
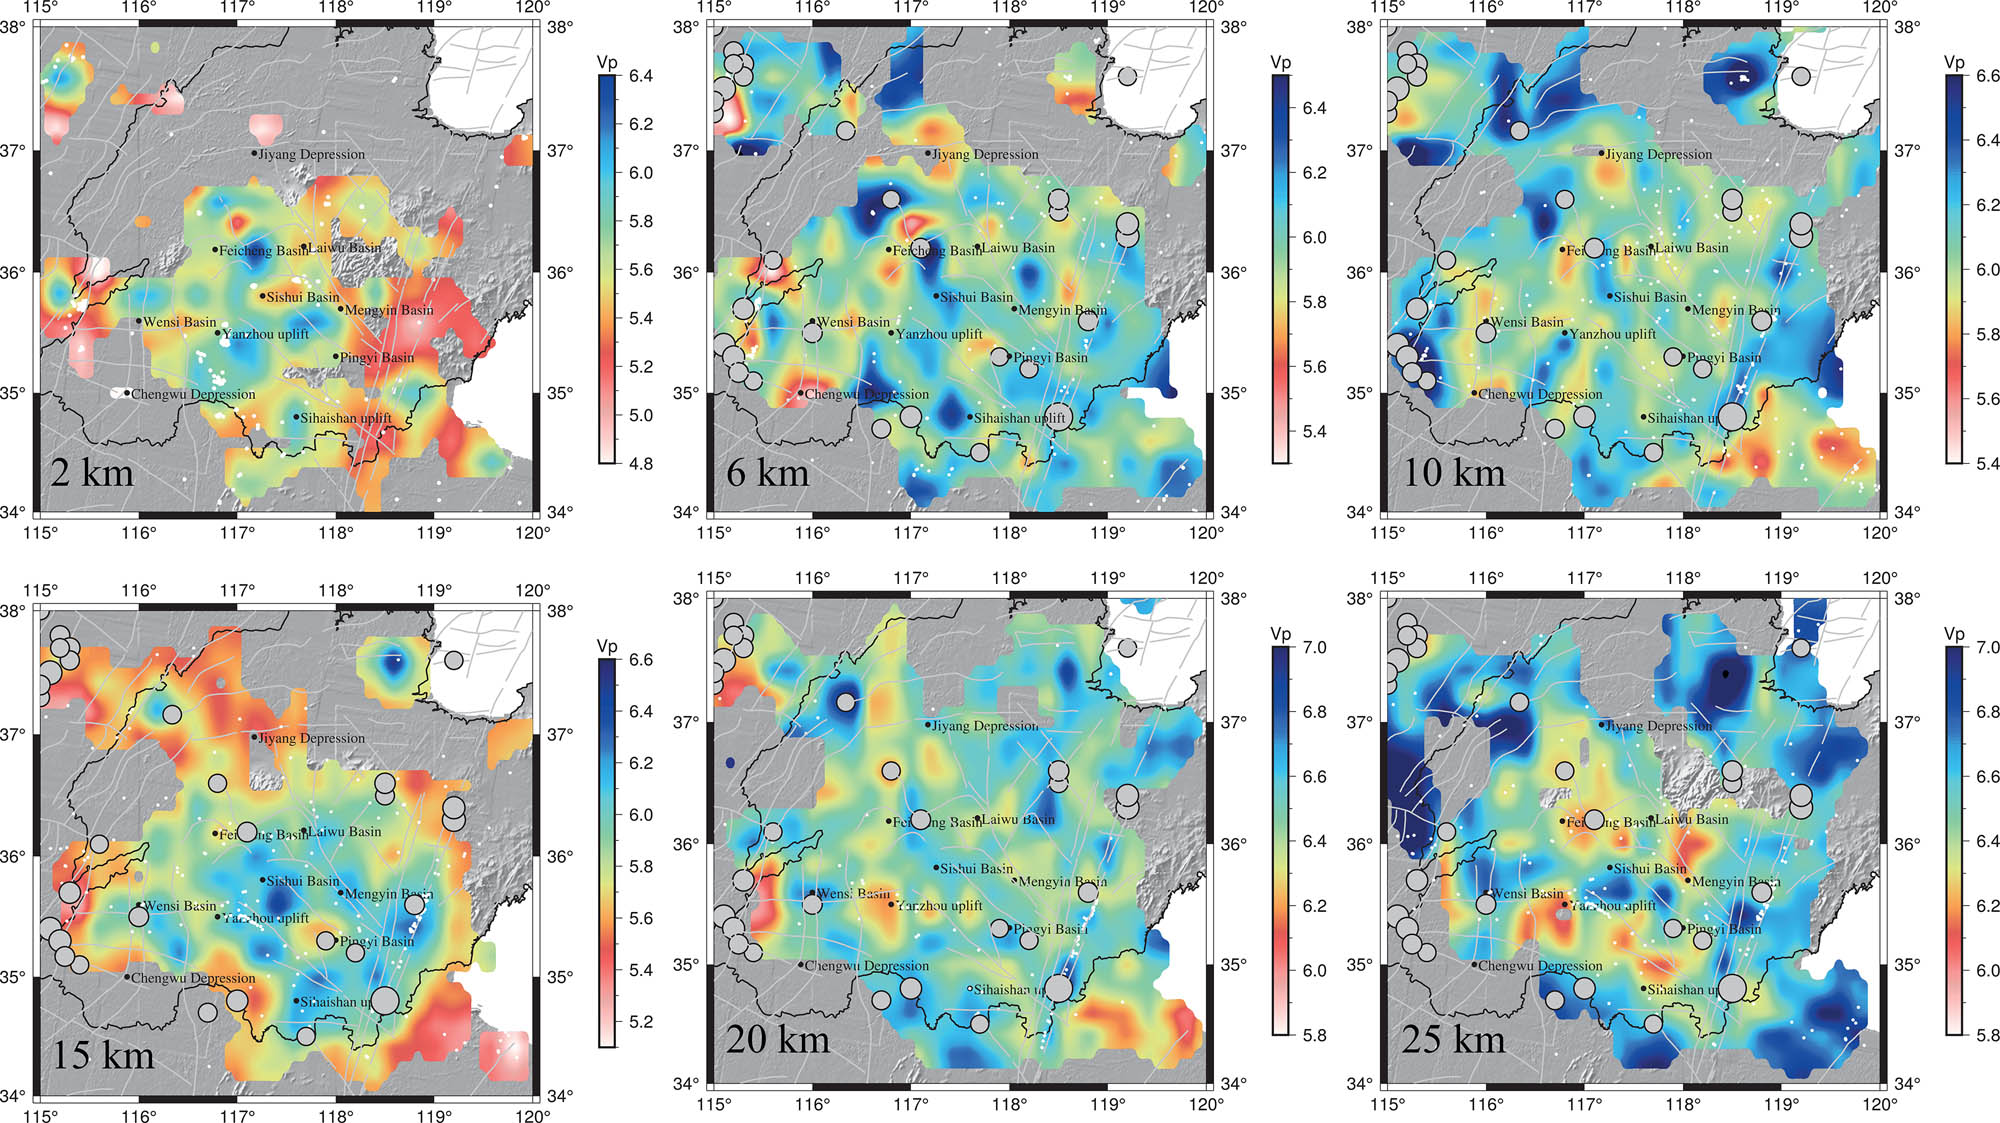
Map views of V p structures. The layer depth is shown at the lower-left corner of each map. White dots represent small earthquakes since 2008, and solid gray dots indicate earthquakes of magnitude 5.5 or greater since 780 B. C. White circles denote the earthquakes that occurred within a layer of 10 km thickness bound to each slice.
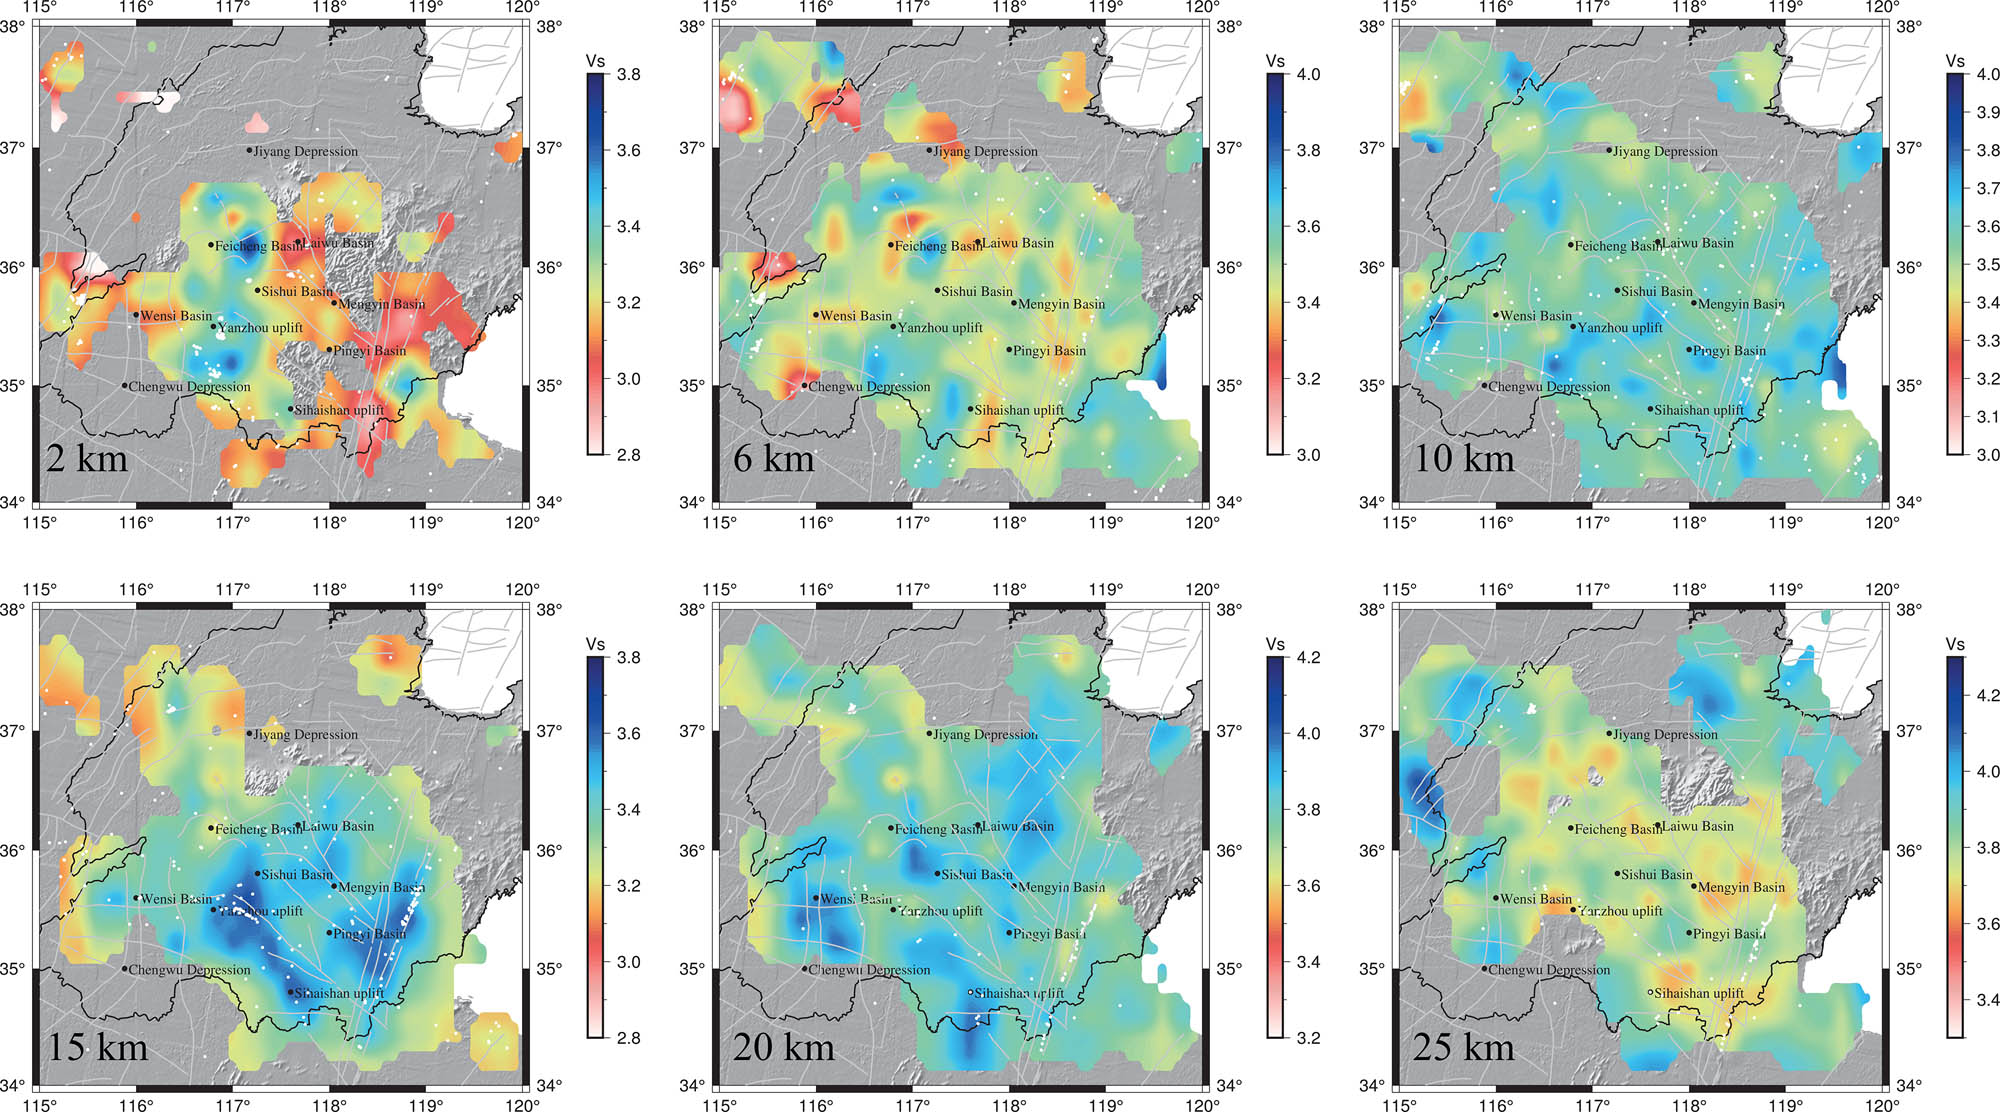
The same as Figure 8 but for V s structures.
Vertical cross-sections of P-wave velocity (V p) and S-wave velocity (V s) tomography along the five profiles shown in Figure 2a. The gray spheres represent earthquakes of magnitude M ≥ 3.5 within 25 km on either side of the profile. White dots represent earthquakes of magnitude M1.0–3.4. The color scale in the lower right corner indicates elevation and seismic wave velocity perturbation, respectively.
Field survey performed in the Luxi region indicates that extensional faults are well developed and characterized by complicated structural styles. The main structure style is the compound extensional fault system composed of high-angle faults and low-angle décollement faults [4,6]. The décollement depths of different faults in the western part of China are different, with a general trend of deepening from south to north [6,56]. There exists a low-velocity layer about 3–4 km thick in the upper and middle crust, which is highly plastic and is an important décollement detachment surface in the Luxi area [56,57]. Previous studies have shown that a large-scale low-velocity anomaly exists at 15–20 km depth [3,56]. Our imaging results indicate the presence of a significant low-velocity anomaly at depths of 13–17 km, which is in general agreement with the location of the high-conductivity layer obtained by magnetotelluric sounding [56,58,59,60]. In addition, the AA′–DD′ profile clearly observed the presence of high-velocity bodies in the 7–13 km depth range. Previous research findings indicate the presence of a distinct lithospheric layer-cake structure in the Luxi region. At the bottom of the upper crust, specifically at depths ranging from 7–11 km, there is identified a brittle–ductile transition zone [59]. The high-velocity anomalous zone corresponds essentially to the identified brittle–ductile transition zone. Within this transition zone, the upper segment is characterized by a brittle deformation structural layer, while the lower segment exhibits properties indicative of a tough deformation structural layer. The presence of this transition zone assumes significance in facilitating the transfer of lithospheric stress from the deeper regions to the shallower domains.
4.2 Velocity structure and seismic activity
The depth distribution characteristics of a large number of earthquakes are intuitively useful for identifying the geometry of tectonics such as deep and large fractures [61,62,63]. The study of the distribution of historical large earthquakes in relation to velocity anomalies is of great significance in exploring the mechanism of strong earthquakes. Figure 1a shows earthquakes of magnitude 5.5 or greater that have occurred since 780 BC. Because the depths of many of the older earthquakes are no longer known, we show these earthquakes only on horizontal slices of 5–20 km. These earthquakes basically occur in soft zones at low velocities or within high- and low-velocity transition zones. Previous studies have shown that high-velocity bodies are generally comprised of high-strength rock masses, which are characterized by a higher level of brittleness and locally elevated ability to accumulate seismogenic energy, whereas low-velocity bodies are less rigid and are less capable of accommodating a large amount of strain energy [64,65,66]. The transition zone between the high-velocity and low-velocity bodies can be an area of stress concentration, where the medium is relatively fragile and low in strength and thus is prone to earthquakes [66].
The DD’ profile passes through the location of most of the historical strong earthquakes in the western Luxi region, including the 1485 Feixian 5.5 earthquake, the 1622 Changqing 5.5 earthquake, the 1668 Tai’an 6.0 earthquake, the 1668 Tancheng 8.5 earthquake, and the 1859 Linyi 5.5 earthquake, which depths are difficult to be determined. There are many scholars who have done detailed studies on the depth of the 1668 Tancheng 8.5 earthquake, and we take the median of these results to be about 15 km for the later discussion [67]. In addition, the Plains region (Figure 2a), which has historically experienced very few earthquakes, was suddenly struck by a magnitude 5.5 earthquake on August 6, 2023, which also caught the attention of our researchers. The sudden occurrence of moderate to strong earthquakes in the area where are rare has also attracted the attention of researchers in China. The Pingyuan M5.5 earthquake occurred at the edge of the high-velocity body [68], and similarly close to the D’ point in 1668, the Tancheng 8.5 earthquake occurred (source mechanism solution from Shen et al. [5]), which is also in the transition zone between the high-velocity body and the low-velocity body. The relationship between the distribution of medium-strength earthquakes and velocity structure in the Luxi region that we obtained is basically consistent with the results of previous studies [34,36]. Previous studies have shown that most earthquakes in North China occur in the brittle–ductile transition zone between the upper and middle brittle crust and the lower ductile crust, at a depth of about 8–25 km [4,34]. We project earthquakes with a magnitude of M3.5 or greater that have occurred within a 25 km range on both sides of our profile since 1970 onto the depth profile (Figure 10). It is noteworthy that earthquakes are more prevalent within the brittle–ductile transition zone. Our imaging results also corroborate the existence of an obvious high- and low-velocity transition zone at about 7–13 km (Figure 10). Stresses at the rheological boundaries in the transition zone between the high- and low-velocity anomalies are more concentrated and are highly susceptible to moderately strong earthquakes [69,70]. According to the two-layer crustal rheology model [71], the crust is characterized by a brittle layer predominantly governed by fracture friction and a ductile layer primarily subject to deformation in the shallower depths. There exists an extensive transition zone between the brittle and ductile layers. Due to the increase in resistance to rock deformation with depth in the brittle layer and the decrease with depth in the ductile layer, the shear resistance in the brittle–ductile transition zone attains a high value. Below this transition zone, the shear resistance experiences a more pronounced decrease in the ductile layer, making it conducive for medium- and strong-intensity earthquakes to occur in the transition zone.
4.3 Geodynamic mechanism analysis
The presence of a low-velocity body and moderate-strong earthquakes in the 13–17 km depth range in the Luxi region can be attributed to the deep dynamical mechanisms associated with the upper brittle-and-ductile transition zone of the low-velocity body. A comprehensive interpretation can be achieved by combining the results of previous deep probes and Geochronology. Abundant research data consistently demonstrate a close correlation between magmatic activity and the subduction of the Pacific plate [72,73,74]. Since the Late Jurassic (∼140 Ma), the Izanaqi plate has been subducted under the East Asian continent at a high rate of 300 mm/a in the NNW direction [13,75,76]. The Tan-Lu fault zone exhibits left-lateral strike-slip faulting, inducing a near-north–south tensile stress field in eastern China. Consequently, the western segment of the Luxi region initiated its large-scale extensional movement. NW normal faults were formed during this period, mainly containing the major fractures from F1 to F6 in Figure 1b. The extensive tensile forces resulted in lithospheric thinning and the upwelling of a ductile flow circle, leading to substantial magmatic activity. This process drove lithospheric uplift and created conducive conditions for the formation of extensional movements and décollement structures in the Luxi area.
In the Paleocene-Early Eocene (65–53 Ma), the Pacific plate subducted toward Eurasia at a speed of 78 mm/a [77]. The subduction speed was significantly reduced, and the direction of subduction was still NNW, the whole East Asian region entered the state of extrusion stress, and the Luxi region was in the uplift. In the late Eocene (∼43 Ma), the subduction direction of the Pacific plate shifts from NNW to NWW, the subduction velocity decreases to 38 mm/a [78], and the Tan-Lu fault transitioned from left-slip to right-slip. Large-scale seismic stratigraphic imaging results clearly show that the leading edge of the Pacific subduction plate has advanced beneath North China, thus forming a mantle wedge beneath it [16]. Due to the dragging effect of the subducting plate, it induces the flow of soft fluvial material to the east. Concurrently, the Indian and Eurasian plates entered a land-land collision phase, which led to crustal extrusion in the Tibetan Plateau region, resulting in the lithospheric material being pushed eastward as well [79,80,81]. The synergistic effects of the aforementioned factors led to the establishment of an NW-SE extensional environment in eastern North China, with more intense magmatic activity and upwelling of upper mantle material. The upwelling flowed material continuously produced thermal erosion to the lithosphere, leading to softening of the material within the crust, and we infer that partial melting played an important role in the formation of the low-velocity body of the Luxi crust.
5 Conclusions
We used advanced double-difference tomography to determine the 3-D velocity structure of the P- and S-waves under the Luxi region. The results of seismic stratigraphic imaging in this article reveal the prevalence of near-vertical high-velocity anomalies in the Luxi region, reflecting the possibility of intrusion of mantle material into the crust. There is a transition zone of high and low velocities at a depth of 7–13 km, which is also a brittle and ductile transition zone, where most of the historical earthquakes above M3.5 occurred. Meanwhile, our imaging results also clearly indicate the presence of a significant low-velocity anomaly at depths of 13–17 km, which corresponds to the presence of a high-conductivity layer at that depth obtained from magnetotelluric sounding. The formation of décollement structures in the western Luxi region is related not only to the activity of the Tan-Lu fault zone, but also to the thinning of the lithosphere due to the subduction of the Pacific slab and the small-scale convection caused by the upwelling of the mantle. Combined with the relationship between the distribution of historical earthquakes and the velocity structure, most of the moderate and strong earthquakes occurred in the high- and low-velocity transition zone, which corresponds to the brittle–ductile transition zone. Exploration of the distribution and physical properties of such transition zones will yield important insights into the medium- and long-term prediction of earthquakes.
Acknowledgments
We are very grateful to Prof. Haijiang Zhang of the University of Science and Technology of China for providing the double-difference tomography program. All figures were made by using free software GMT [82].
-
Funding information: This work was jointly supported by Science and Technology Innovation Team for Application of Artificial Intelligence Technology in Earthquake Monitoring and Prediction, Shandong Earthquake Agency, Hebei Key Laboratory of Earthquake Dynamics (Grant No. FZ212204), Research and Application of Mine Microseismic Monitoring Technology (Grant No. YW2306).
-
Author contributions: Zhengshuai Zhang, Jianchang Zheng, and Di Yin conceived the idea and wrote the article with the help of all authors; Zhengshuai Zhang, Di Yin, Bo Li, and Yuqin Guo drew the figures; Guangbin Chai, Jing Wu, and Yang Wu collected the data and participated discussion. All authors contributed to writing the manuscript and approved the submitted version.
-
Conflict of interest: All authors certify that they have no affiliations with or involvement in any organization or entity with any financial interest or non-financial interest in the subject matter or materials discussed in this manuscript.
-
Ethical approval: Not Applicable. This article does not contain any studies with human or animal participants.
-
Consent to Publication: Not Applicable.
-
Data availability statement: Publicly available datasets were analyzed in this study. Fault dataset from the National Earthquake Data Center: https://data.earthquake.cn/. Shandong administrative boundary data from the National Catalogue Service for Geographic Information: www.webmap.cn. The China Earthquake Networks Center (CENC) for providing the high-quality arrival-time data used in this study.
References
[1] Niu SY, Hu HB, Mao JW. Structure in western Shandong and its genetic mechanism. Geol China. 2004;31:34–9.Suche in Google Scholar
[2] Qu P, Lv J, Guo Z, Yu Y, Chen YS. Study on crust and upper mantle structure in Shandong Area. Acta Sci Nat Univ Pekin. 2020;56:649–59.Suche in Google Scholar
[3] Li SZ, Wang JD, Liu JZ. Mesozoic structure and its tectonic setting in the western Shandong block. Acta Geol Sin. 2005;79:487–97.Suche in Google Scholar
[4] Li SJ, Li SZ, Li XY. Activity of Cenozoic fault system in the Luxi Block and deep dynamics. Mar Geol Quat Geol. 2018;38:123–34.Suche in Google Scholar
[5] Shen ZK, Wan YG, Gan WJ. Crustal stress evolution of last 700 years in North China and earthquake occurrences. Earthq Res China. 2004;20:211–28.Suche in Google Scholar
[6] Hu QY, Li L, Tang ZB, Shi XP. Characteristics and mechanism of Late Mesozoic extensional faultsin West Shandong Uplift. Geol China. 2009;36:1233–44.Suche in Google Scholar
[7] Wang ZC, Shi RH, Chao HT. Characteristics of the quaternary fault activities in the middle and south region of Shandong province. Mar Geol Quat Geol. 2001;21:95–102.Suche in Google Scholar
[8] Shi XP, Li L, Hu QY, Tang ZB. Characteristics of NW-trending normal faults and physical modeling since late Mesozoic in west Shandong uplift,China. Acta Sci Nat Univ Sunyatseni. 2010;49:130–7.Suche in Google Scholar
[9] Zhai MG, Meng QR, Liu JM. Geological features of Mesozoic tectonic regime inversion in Eastern North China and implication for geodynamics. Earth Sci Front. 2004;11:285–97.10.1360/02yd0416Suche in Google Scholar
[10] Zhu G, Niu ML, Xie CL, Wang YS. Sinistral to normal faulting along the tan‐lu fault zone: evidence for geodynamic switching of the East China Continental Margin. J Geol. 2010;118:277–93. 10.1086/651540.Suche in Google Scholar
[11] Li SZ, Zhang GW, Li YL. Deformation and orogeny of the mian-lue suture Zone in the Qinling Orogenic Belt. Acta Geol Sin. 2002;4:469–83.Suche in Google Scholar
[12] Ge XH, Liu JL, Ren SM, Yuan SH. The formation and evolution of the Mesozoic-Cenozoic continental tectonics in eastern China. Geol China. 2014;1:19–38.Suche in Google Scholar
[13] Maruyama S, Isozaki Y, Kimura G, Terabayashi M. Paleogeographic maps of the Japanese Islands: Plate tectonic synthesis from 750 Ma to the present. Isl Arc. 1997;6:121–42. 10.1111/j.1440-1738.1997.tb00043.x.Suche in Google Scholar
[14] Zhong DL, Ding L, Ji JQ. Coupling of the lithospheric convergence of west china and dispersion of east china in cenozoic:link with paleoenvironmental changes. Quat Sci. 2001;4:303–12.Suche in Google Scholar
[15] Tang ZB, Li L, Shi XP, Hu QY. Fission track thermochronology of late cretaceous-cenozoic uplifting events of the Mengshan mountain in the western Shandong rise, China. Acta Sci Nat Univ Sunyatseni. 2011;2:127–33.Suche in Google Scholar
[16] Huang JL, Zhao DP. High-resolution mantle tomography of China and surrounding regions. J Geophys Res. 2006;111:B09305. 10.1029/2005JB004066.Suche in Google Scholar
[17] Zhang ZS, Zheng JC, Wang SH, Li CQ, Liu FB. Imaging the subducting slab and mantle upwelling under the Japan islands revealed by double-difference tomography. Front Earth Sci. 2023;10:1019408. 10.3389/feart.2022.1019408.Suche in Google Scholar
[18] Qi JF, Zhou XH, Wang QS. Structural model and Cenozoic kinematics of Tan-Lu deep fracture zone in Bohai Sea area. Geol China. 2010;37:1231–42.Suche in Google Scholar
[19] Xiao QH, Liu Y, Feng YF. A preliminary study of the relationship between Mesozoic lithosphere evolution in eastern China and the subduction of the Pacific plate. Geol China. 2010;37:1092–101.Suche in Google Scholar
[20] Xing JS, Yang WR, Xing ZY, Liu JH. Meso-cenozoic Asthenosphere upwelling of eastern China and Its Impacts on Structure-magma-mineralization concentration region. Earth Sci. 2019;44:1570–83.Suche in Google Scholar
[21] Zhou GF, Wu RY. The investigation of deep crustal structure and crustal construction of the Eastern part of China with gravity data. Earth Sci. 1989;14:326–32.Suche in Google Scholar
[22] Yuan J, Gao LS. Three dimensional P-wave velocity structure of the upper mantle under the Eastern China. Earthq Res China. 1990;6:29–39.Suche in Google Scholar
[23] Qiu RZ, Deng JF, Zhou S. Lithospheric types in North China: geologic and geophysical evidence. Sci China Ser -Earth Sci Chin. 2004;34:698–711.Suche in Google Scholar
[24] Zhang K. A study on the control of deep crust-mantle structure and heat flow on petroleunm distribution and accumulation in bohaiwan basin. Pet Explor Dev. 1993;20:1–14.Suche in Google Scholar
[25] Gong YL, Wang LS, Liu SW. Distribution characteristics of geotemperature field in Jiyang depression,Shandong,North China. Chin J Geophys Chin. 2003;46:652–8.Suche in Google Scholar
[26] Jiang WL, Wang X, Tian T, Zhang JF, Wang DL. Detailed crustal structure of the North China and its implication for seismicity. J Asian Earth Sci. 2014;81:53–64. 10.1016/j.jseaes.2013.11.021.Suche in Google Scholar
[27] Liu G, Wu J, Zhou C, Ni TS. Anisotropy of middle-upper crust in the Anninghe-Zemuhe fault zone and its adjacent area and its implications. Chin J Geophys Chin. 2023;66:4533–51.Suche in Google Scholar
[28] Miao C. Study on crust-mantle coupling beneath the Shandong region. Earthq Res China. 2014;30:597–603.Suche in Google Scholar
[29] Liu G, Liu WY, Lu Z, Zhang P. Review of the measurement of rotational component in ground motions: a case study of rotating motion observation in Taiwan, China. Prog Geophys (in Chinese). 2020;35:0422–32.Suche in Google Scholar
[30] An MJ, Feng M, Zhao Y. Destruction of lithosphere within the north China craton inferred from surface wave tomography. Geochem Geophys Geosystems. 2009;10:2009GC002562. 10.1029/2009GC002562.Suche in Google Scholar
[31] Tang DZ, Liu HX, Li XM. Probe into deep-seated structural factors of abiogenic gas accumulation and storage in Jiyang depression. J China Univ Geosci. 2002;27:30–4.Suche in Google Scholar
[32] Behrmann JH, Mainprice D. Deformation mechanisms in a high-temperature quartz-feldspar mylonite: evidence for superplastic flow in the lower continental crust. Tectonophysics. 1987;140:297–305. 10.1016/0040-1951(87)90236-8.Suche in Google Scholar
[33] Wang GJ, Teng JW, Zhang XK. The crustal structure of western Shandong and the high-velocity body in the crust. Chin J Geophys Chin. 2007;50:1291–9.10.1002/cjg2.1148Suche in Google Scholar
[34] Wang ZS, Wang CY, Zeng RS, Wang XL. Tomographic imaging of P and S wave velocity structures beneth North China and its Vicinity. CT Theory Appl. 2008;17:15–27.Suche in Google Scholar
[35] Li ZW, Xu Y, Hao TY, Liu JS, Zhang L. Seismic tomography and velocity structure in the crust and upper mantle around Bohai Sea area. Chin J Geophys Chin. 2006;49:797–804.10.1002/cjg2.884Suche in Google Scholar
[36] Su DL, Fan JK, Wu SG, Chen CX, Dong XN, Chen SJ. 3D P wave velocity structures of crust and their relationship with earthquakes in the Shandong area. Chin J Geophys Chin. 2016;59:1335–49.Suche in Google Scholar
[37] Waldhauser F. Fault structure and mechanics of the Hayward Fault, California, from double-difference earthquake locations. J Geophys Res. 2002;107:2054. 10.1029/2000JB000084.Suche in Google Scholar
[38] Zhang HJ. Double-difference tomography: the method and its application to the hayward fault, California. Bull Seismol Soc Am. 2003;93:1875–89. 10.1785/0120020190.Suche in Google Scholar
[39] Zhang HJ, Thurber C. Development and applications of double-difference seismic tomography. Pure Appl Geophys. 2006;163:373–403. 10.1007/s00024-005-0021-y.Suche in Google Scholar
[40] Comte D, Carrizo D, Roecker S, Ortega-Culaciati F, Peyrat S. Three-dimensional elastic wave speeds in the northern Chile subduction zone: variations in hydration in the supraslab mantle. Geophys J Int. 2016;207:1080–105. 10.1093/gji/ggw318.Suche in Google Scholar
[41] Cui X, Song XQ, Xu LS, Zhu YQ, Li B, Zhang W. Three dimensional crustal P‐wave structure beneath the central south segment of the Tanlu Fault Zone determined by local earthquake travel‐time tomography. Terra Nova. 2021;33:613–20. 10.1111/ter.12553.Suche in Google Scholar
[42] Um J, Thurber C. A fast algorithm for two-point seismic ray tracing. Bull Seismol Soc Am. 1987;77:972–86. 10.1785/BSSA0770030972.Suche in Google Scholar
[43] Waldhauser F. A double-difference earthquake location algorithm: method and application to the northern hayward Fault, California. Bull Seismol Soc Am. 2000;90:1353–68. 10.1785/0120000006.Suche in Google Scholar
[44] Paige CC, Saunders MA. LSQR: sparse linear equations and least squares problems. ACM TransMathSoftw. 1982;8:195–209.10.1145/355993.356000Suche in Google Scholar
[45] Eberhart-Philips D. Three-dimensional velocity structure in northern California Coast Ranges from inversion of local earthquake arrival times. Bull Seismol Soc Am. 1986;76:1025–52.Suche in Google Scholar
[46] Eberhart-Phillips D, Michael AJ. Three-dimensional velocity structure, seismicity, and fault structure in the Parkfield Region, central California. J Geophys Res. 1993;98:15737. 10.1029/93JB01029.Suche in Google Scholar
[47] Lin GQ, Thurber CH, Zhang HJ, Hauksson E, Shearer PM, Waldhauser F, et al. A california statewide three-dimensional seismic velocity model from both absolute and differential times. Bull Seismol Soc Am. 2010;100:225–40. 10.1785/0120090028.Suche in Google Scholar
[48] Humphreys E, Clayton RW. Adaptation of back projection tomography to seismic travel time problems. J Geophys Res. 1988;93:1073. 10.1029/JB093iB02p01073.Suche in Google Scholar
[49] Lévěque J-J, Rivera L, Wittlinger G. On the use of the checker-board test to assess the resolution of tomographic inversions. Geophys J Int. 1993;115:313–8. 10.1111/j.1365-246X.1993.tb05605.x.Suche in Google Scholar
[50] Thurber C, Eberhart-Phillips D. Local earthquake tomography with flexible gridding. Comput Geosci. 1999;25:809–18. 10.1016/S0098-3004(99)00007-2.Suche in Google Scholar
[51] Scarfì L, Giampiccolo E, Musumeci C, Patanè D, Zhang H. New insights on 3D crustal structure in southeastern Sicily (Italy) and tectonic implications from an adaptive mesh seismic tomography. Phys Earth Planet Inter. 2007;161:74–85. 10.1016/j.pepi.2007.01.007.Suche in Google Scholar
[52] Thurber CH, Brocher TM, Zhang H, Langenheim VE. Three‐dimensional P wave velocity model for the San Francisco Bay region, California. J Geophys Res Solid Earth. 2007;112:2006JB004682. 10.1029/2006JB004682.Suche in Google Scholar
[53] Deng WZ, Chen JH, Guo B, Liu QY. Fine velocity structure of the Longmenshan fault zone by double-difference tomography. Chin. J Geophys. 2014;57:1101–10.Suche in Google Scholar
[54] Wang CZ, Wu JP, Yang T, Wang WL. Crustal structure beneath the Taiyuan Basin and adjacent areas revealed by double-difference tomography. Chin J Geophys Chin. 2018;61:963–74. 10.6038/cjg2018L0114.Suche in Google Scholar
[55] Shen JC, Xu MM, Yin HY, Li SC. Upper crustal velocity structure and geological significance of southwest Shandong Province, China: insights from double-difference seismic tomography. J Seismol. 2021;25:201–12. 10.1007/s10950-020-09954-z.Suche in Google Scholar
[56] Li L, Zhong DL, Shi XP, Tang ZB, Hu QY, Xu Y, et al. Late Mesozoic–Cenozoic décollement structure and its deep geological background in western Shandong, China. Prog Nat Sci. 2009;19:603–13. 10.1016/j.pnsc.2008.08.006.Suche in Google Scholar
[57] Li L, Zhong DL, Yang CC, Shi XP. Extension order and its deep geological background: evidence from western Shandong rise and Jiyang depression in the Late Mesozoic-Cenozoic. Earth Sci Front. 2012;19:255–73.Suche in Google Scholar
[58] Liu GD, Shi SL, Wang BY. Crustal high-conductivity layers in North China and their relation to crustal tectonic activity. Sci China Earth Sci B. 1984;9:439–48.Suche in Google Scholar
[59] Wang CY, Zhang XK, Wu QJ, Zhu ZP. Seismic evidence of detachment in north China basin. Chin J Geophys. 1994;37:613–20.Suche in Google Scholar
[60] Huang TL, Gao JG. Regional geophysical field in Shandong Province. ShangDong Land Resour. 2002;18:88–94.Suche in Google Scholar
[61] De Nardis R, Pandolfi C, Cattaneo M, Monachesi G, Cirillo D, Ferrarini F, et al. Lithospheric double shear zone unveiled by microseismicity in a region of slow deformation. Sci Rep. 2022;12:21066. 10.1038/s41598-022-24903-1.Suche in Google Scholar PubMed PubMed Central
[62] Tibaldi A, De Nardis R, Torrese P, Bressan S, Pedicini M, Talone D, et al. A multi-scale approach to the recent activity of the Stradella thrust in the seismotectonic context of the Emilia Arc (northwestern Italy). Tectonophysics. 2023;857:229853. 10.1016/j.tecto.2023.229853.Suche in Google Scholar
[63] Lavecchia A, Serlenga V, Filippucci M, Stabile TA, Prosser G, Tallarico A. Fault (Re)activation and fluid‐induced seismicity: An example from the val d’agri intermontane basin (Southern Italy). J Geophys Res Solid Earth. 2024;129:e2024JB028710. 10.1029/2024JB028710.Suche in Google Scholar
[64] Michael AJ, Eberhart-Phillips D. Relations among fault behavior, subsurface geology, and three-dimensional velocity models. Science. 1991;253:651–4. 10.1126/science.253.5020.651.Suche in Google Scholar PubMed
[65] Chiarabba C, Amato A. Vp and Vp/Vs images in the Mw 6.0 Colfiorito fault region (central Italy): A contribution to the understanding of seismotectonic and seismogenic processes. J Geophys Res Solid Earth. 2003;108:2001JB001665. 10.1029/2001JB001665.Suche in Google Scholar
[66] Kato A, Miyatake T, Hirata N. Asperity and Barriers of the 2004 Mid-Niigata Prefecture Earthquake Revealed by Highly Dense Seismic Observations. Bull Seismol Soc Am. 2010;100:298–306. 10.1785/0120090218.Suche in Google Scholar
[67] Weng AH, Li JP, Fan XP. Fine electrical structure beneath the epicenter of 1668 Tancheng Ms8.5 earthquake reveaked by MT sounding. Seismol Geol. 2018;40:396–409.Suche in Google Scholar
[68] Zhang Z, Xu LS, Fang LH. The MW5.5 earthquake on August 6, 2023, in Pingyuan, Shandong, China: A rupture on a buried fault. Earthq Sci. 2024;37:1–12. 10.1016/j.eqs.2023.10.001.Suche in Google Scholar
[69] Zhang Q, Sandvol E, Liu M. Lithospheric velocity structure of the New Madrid Seismic Zone: A joint teleseismic and local P tomographic study. Geophys Res Lett. 2009;36:2009GL037687. 10.1029/2009GL037687.Suche in Google Scholar
[70] Fang LH, Wu JP, Ding ZF, Wang WL, Panza GF. Crustal velocity structures beneath North China revealed by ambient noise tomography. Earthq Sci. 2010;23:477–86. 10.1007/s11589-010-0746-2.Suche in Google Scholar
[71] Sibson RH. Fault zone models, heat flow, and the depth distribution of earthquakes in the continental crust of the United States. Bull Seismol Soc Am. 1982;72:151–63. 10.1785/BSSA0720010151.Suche in Google Scholar
[72] Zhou XM, Li WX. Origin of Late Mesozoic igneous rocks in Southeastern China: implications for lithosphere subduction and underplating of mafic magmas. Tectonophysics. 2000;326:269–87. 10.1016/S0040-1951(00)00120-7.Suche in Google Scholar
[73] Zhou XM, Sun T, Shen WZ, Shu LS, Niu YL. Petrogenesis of Mesozoic granitoids and volcanic rocks in South China: A response to tectonic evolution. Episodes. 2006;29:26–33. 10.18814/epiiugs/2006/v29i1/004.Suche in Google Scholar
[74] Sun WD, Ding X, Hu YH, Li XH. The golden transformation of the Cretaceous plate subduction in the west Pacific. Earth Planet Sci Lett. 2007;262:533–42. 10.1016/j.epsl.2007.08.021.Suche in Google Scholar
[75] Engebretson D. Relative motions between oceanic and continental plates in the Pacific Basin. Geol Soc Am. 1985;206:1–60.10.1130/SPE206-p1Suche in Google Scholar
[76] Chen GW, Xia H, Chen SQ. The geological evidences for the tectonic transition in late Mesozoic in North China. Geol China. 2008;35:1162–77.Suche in Google Scholar
[77] Northrup CJ, Royden LH, Burchfiel BC. Motion of the Pacific plate relative to Eurasia and its potential relation to Cenozoic extension along the eastern margin of Eurasia. Geology. 1995;23:719. 10.1130/0091-7613(1995)023<0719:MOTPPR>2.3.CO;2.Suche in Google Scholar
[78] Li L, Shi XP, Tan MY. The cenozoic strike-slip characteristics along the Tan-Lu Fault Zone of the Weibei-Laizhouwan area. Chin. J Geol. 2009;44:855–64.Suche in Google Scholar
[79] Zhong DL, Ding L. The uplift process and mechanisms of the Tibetan Plateau. Sci China Ser D. 1996;26:289–95.Suche in Google Scholar
[80] Liu M, Cui XJ, Liu FT. Cenozoic rifting and volcanism in eastern China: a mantle dynamic link to the Indo–Asian collision. Tectonophysics. 2004;393:29–42. 10.1016/j.tecto.2004.07.029.Suche in Google Scholar
[81] Li SZ, Suo YH, Dai LM. Development of the Bohai Bay Basin and destruction of the North China Craton. 2010;17:064–89.Suche in Google Scholar
[82] Wessel P, Luis JF, Uieda L, Scharroo R, Wobbe F, Smith WHF, et al. The generic mapping tools version 6.0. Geochem Geophys Geosystems. 2019;20:5556–64. 10.1029/2019GC008515.Suche in Google Scholar
© 2024 the author(s), published by De Gruyter
This work is licensed under the Creative Commons Attribution 4.0 International License.
Artikel in diesem Heft
- Regular Articles
- Theoretical magnetotelluric response of stratiform earth consisting of alternative homogeneous and transitional layers
- The research of common drought indexes for the application to the drought monitoring in the region of Jin Sha river
- Evolutionary game analysis of government, businesses, and consumers in high-standard farmland low-carbon construction
- On the use of low-frequency passive seismic as a direct hydrocarbon indicator: A case study at Banyubang oil field, Indonesia
- Water transportation planning in connection with extreme weather conditions; case study – Port of Novi Sad, Serbia
- Zircon U–Pb ages of the Paleozoic volcaniclastic strata in the Junggar Basin, NW China
- Monitoring of mangrove forests vegetation based on optical versus microwave data: A case study western coast of Saudi Arabia
- Microfacies analysis of marine shale: A case study of the shales of the Wufeng–Longmaxi formation in the western Chongqing, Sichuan Basin, China
- Multisource remote sensing image fusion processing in plateau seismic region feature information extraction and application analysis – An example of the Menyuan Ms6.9 earthquake on January 8, 2022
- Identification of magnetic mineralogy and paleo-flow direction of the Miocene-quaternary volcanic products in the north of Lake Van, Eastern Turkey
- Impact of fully rotating steel casing bored pile on adjacent tunnels
- Adolescents’ consumption intentions toward leisure tourism in high-risk leisure environments in riverine areas
- Petrogenesis of Jurassic granitic rocks in South China Block: Implications for events related to subduction of Paleo-Pacific plate
- Differences in urban daytime and night block vitality based on mobile phone signaling data: A case study of Kunming’s urban district
- Random forest and artificial neural network-based tsunami forests classification using data fusion of Sentinel-2 and Airbus Vision-1 satellites: A case study of Garhi Chandan, Pakistan
- Integrated geophysical approach for detection and size-geometry characterization of a multiscale karst system in carbonate units, semiarid Brazil
- Spatial and temporal changes in ecosystem services value and analysis of driving factors in the Yangtze River Delta Region
- Deep fault sliding rates for Ka-Ping block of Xinjiang based on repeating earthquakes
- Improved deep learning segmentation of outdoor point clouds with different sampling strategies and using intensities
- Platform margin belt structure and sedimentation characteristics of Changxing Formation reefs on both sides of the Kaijiang-Liangping trough, eastern Sichuan Basin, China
- Enhancing attapulgite and cement-modified loess for effective landfill lining: A study on seepage prevention and Cu/Pb ion adsorption
- Flood risk assessment, a case study in an arid environment of Southeast Morocco
- Lower limits of physical properties and classification evaluation criteria of the tight reservoir in the Ahe Formation in the Dibei Area of the Kuqa depression
- Evaluation of Viaducts’ contribution to road network accessibility in the Yunnan–Guizhou area based on the node deletion method
- Permian tectonic switch of the southern Central Asian Orogenic Belt: Constraints from magmatism in the southern Alxa region, NW China
- Element geochemical differences in lower Cambrian black shales with hydrothermal sedimentation in the Yangtze block, South China
- Three-dimensional finite-memory quasi-Newton inversion of the magnetotelluric based on unstructured grids
- Obliquity-paced summer monsoon from the Shilou red clay section on the eastern Chinese Loess Plateau
- Classification and logging identification of reservoir space near the upper Ordovician pinch-out line in Tahe Oilfield
- Ultra-deep channel sand body target recognition method based on improved deep learning under UAV cluster
- New formula to determine flyrock distance on sedimentary rocks with low strength
- Assessing the ecological security of tourism in Northeast China
- Effective reservoir identification and sweet spot prediction in Chang 8 Member tight oil reservoirs in Huanjiang area, Ordos Basin
- Detecting heterogeneity of spatial accessibility to sports facilities for adolescents at fine scale: A case study in Changsha, China
- Effects of freeze–thaw cycles on soil nutrients by soft rock and sand remodeling
- Vibration prediction with a method based on the absorption property of blast-induced seismic waves: A case study
- A new look at the geodynamic development of the Ediacaran–early Cambrian forearc basalts of the Tannuola-Khamsara Island Arc (Central Asia, Russia): Conclusions from geological, geochemical, and Nd-isotope data
- Spatio-temporal analysis of the driving factors of urban land use expansion in China: A study of the Yangtze River Delta region
- Selection of Euler deconvolution solutions using the enhanced horizontal gradient and stable vertical differentiation
- Phase change of the Ordovician hydrocarbon in the Tarim Basin: A case study from the Halahatang–Shunbei area
- Using interpretative structure model and analytical network process for optimum site selection of airport locations in Delta Egypt
- Geochemistry of magnetite from Fe-skarn deposits along the central Loei Fold Belt, Thailand
- Functional typology of settlements in the Srem region, Serbia
- Hunger Games Search for the elucidation of gravity anomalies with application to geothermal energy investigations and volcanic activity studies
- Addressing incomplete tile phenomena in image tiling: Introducing the grid six-intersection model
- Evaluation and control model for resilience of water resource building system based on fuzzy comprehensive evaluation method and its application
- MIF and AHP methods for delineation of groundwater potential zones using remote sensing and GIS techniques in Tirunelveli, Tenkasi District, India
- New database for the estimation of dynamic coefficient of friction of snow
- Measuring urban growth dynamics: A study in Hue city, Vietnam
- Comparative models of support-vector machine, multilayer perceptron, and decision tree predication approaches for landslide susceptibility analysis
- Experimental study on the influence of clay content on the shear strength of silty soil and mechanism analysis
- Geosite assessment as a contribution to the sustainable development of Babušnica, Serbia
- Using fuzzy analytical hierarchy process for road transportation services management based on remote sensing and GIS technology
- Accumulation mechanism of multi-type unconventional oil and gas reservoirs in Northern China: Taking Hari Sag of the Yin’e Basin as an example
- TOC prediction of source rocks based on the convolutional neural network and logging curves – A case study of Pinghu Formation in Xihu Sag
- A method for fast detection of wind farms from remote sensing images using deep learning and geospatial analysis
- Spatial distribution and driving factors of karst rocky desertification in Southwest China based on GIS and geodetector
- Physicochemical and mineralogical composition studies of clays from Share and Tshonga areas, Northern Bida Basin, Nigeria: Implications for Geophagia
- Geochemical sedimentary records of eutrophication and environmental change in Chaohu Lake, East China
- Research progress of freeze–thaw rock using bibliometric analysis
- Mixed irrigation affects the composition and diversity of the soil bacterial community
- Examining the swelling potential of cohesive soils with high plasticity according to their index properties using GIS
- Geological genesis and identification of high-porosity and low-permeability sandstones in the Cretaceous Bashkirchik Formation, northern Tarim Basin
- Usability of PPGIS tools exemplified by geodiscussion – a tool for public participation in shaping public space
- Efficient development technology of Upper Paleozoic Lower Shihezi tight sandstone gas reservoir in northeastern Ordos Basin
- Assessment of soil resources of agricultural landscapes in Turkestan region of the Republic of Kazakhstan based on agrochemical indexes
- Evaluating the impact of DEM interpolation algorithms on relief index for soil resource management
- Petrogenetic relationship between plutonic and subvolcanic rocks in the Jurassic Shuikoushan complex, South China
- A novel workflow for shale lithology identification – A case study in the Gulong Depression, Songliao Basin, China
- Characteristics and main controlling factors of dolomite reservoirs in Fei-3 Member of Feixianguan Formation of Lower Triassic, Puguang area
- Impact of high-speed railway network on county-level accessibility and economic linkage in Jiangxi Province, China: A spatio-temporal data analysis
- Estimation model of wild fractional vegetation cover based on RGB vegetation index and its application
- Lithofacies, petrography, and geochemistry of the Lamphun oceanic plate stratigraphy: As a record of the subduction history of Paleo-Tethys in Chiang Mai-Chiang Rai Suture Zone of Thailand
- Structural features and tectonic activity of the Weihe Fault, central China
- Application of the wavelet transform and Hilbert–Huang transform in stratigraphic sequence division of Jurassic Shaximiao Formation in Southwest Sichuan Basin
- Structural detachment influences the shale gas preservation in the Wufeng-Longmaxi Formation, Northern Guizhou Province
- Distribution law of Chang 7 Member tight oil in the western Ordos Basin based on geological, logging and numerical simulation techniques
- Evaluation of alteration in the geothermal province west of Cappadocia, Türkiye: Mineralogical, petrographical, geochemical, and remote sensing data
- Numerical modeling of site response at large strains with simplified nonlinear models: Application to Lotung seismic array
- Quantitative characterization of granite failure intensity under dynamic disturbance from energy standpoint
- Characteristics of debris flow dynamics and prediction of the hazardous area in Bangou Village, Yanqing District, Beijing, China
- Rockfall mapping and susceptibility evaluation based on UAV high-resolution imagery and support vector machine method
- Statistical comparison analysis of different real-time kinematic methods for the development of photogrammetric products: CORS-RTK, CORS-RTK + PPK, RTK-DRTK2, and RTK + DRTK2 + GCP
- Hydrogeological mapping of fracture networks using earth observation data to improve rainfall–runoff modeling in arid mountains, Saudi Arabia
- Petrography and geochemistry of pegmatite and leucogranite of Ntega-Marangara area, Burundi, in relation to rare metal mineralisation
- Prediction of formation fracture pressure based on reinforcement learning and XGBoost
- Hazard zonation for potential earthquake-induced landslide in the eastern East Kunlun fault zone
- Monitoring water infiltration in multiple layers of sandstone coal mining model with cracks using ERT
- Study of the patterns of ice lake variation and the factors influencing these changes in the western Nyingchi area
- Productive conservation at the landslide prone area under the threat of rapid land cover changes
- Sedimentary processes and patterns in deposits corresponding to freshwater lake-facies of hyperpycnal flow – An experimental study based on flume depositional simulations
- Study on time-dependent injectability evaluation of mudstone considering the self-healing effect
- Detection of objects with diverse geometric shapes in GPR images using deep-learning methods
- Behavior of trace metals in sedimentary cores from marine and lacustrine environments in Algeria
- Spatiotemporal variation pattern and spatial coupling relationship between NDVI and LST in Mu Us Sandy Land
- Formation mechanism and oil-bearing properties of gravity flow sand body of Chang 63 sub-member of Yanchang Formation in Huaqing area, Ordos Basin
- Diagenesis of marine-continental transitional shale from the Upper Permian Longtan Formation in southern Sichuan Basin, China
- Vertical high-velocity structures and seismic activity in western Shandong Rise, China: Case study inspired by double-difference seismic tomography
- Spatial coupling relationship between metamorphic core complex and gold deposits: Constraints from geophysical electromagnetics
- Disparities in the geospatial allocation of public facilities from the perspective of living circles
- Research on spatial correlation structure of war heritage based on field theory. A case study of Jinzhai County, China
- Formation mechanisms of Qiaoba-Zhongdu Danxia landforms in southwestern Sichuan Province, China
- Magnetic data interpretation: Implication for structure and hydrocarbon potentiality at Delta Wadi Diit, Southeastern Egypt
- Deeply buried clastic rock diagenesis evolution mechanism of Dongdaohaizi sag in the center of Junggar fault basin, Northwest China
- Application of LS-RAPID to simulate the motion of two contrasting landslides triggered by earthquakes
- The new insight of tectonic setting in Sunda–Banda transition zone using tomography seismic. Case study: 7.1 M deep earthquake 29 August 2023
- The critical role of c and φ in ensuring stability: A study on rockfill dams
- Evidence of late quaternary activity of the Weining-Shuicheng Fault in Guizhou, China
- Extreme hydroclimatic events and response of vegetation in the eastern QTP since 10 ka
- Spatial–temporal effect of sea–land gradient on landscape pattern and ecological risk in the coastal zone: A case study of Dalian City
- Study on the influence mechanism of land use on carbon storage under multiple scenarios: A case study of Wenzhou
- A new method for identifying reservoir fluid properties based on well logging data: A case study from PL block of Bohai Bay Basin, North China
- Comparison between thermal models across the Middle Magdalena Valley, Eastern Cordillera, and Eastern Llanos basins in Colombia
- Mineralogical and elemental analysis of Kazakh coals from three mines: Preliminary insights from mode of occurrence to environmental impacts
- Chlorite-induced porosity evolution in multi-source tight sandstone reservoirs: A case study of the Shaximiao Formation in western Sichuan Basin
- Predicting stability factors for rotational failures in earth slopes and embankments using artificial intelligence techniques
- Origin of Late Cretaceous A-type granitoids in South China: Response to the rollback and retreat of the Paleo-Pacific plate
- Modification of dolomitization on reservoir spaces in reef–shoal complex: A case study of Permian Changxing Formation, Sichuan Basin, SW China
- Geological characteristics of the Daduhe gold belt, western Sichuan, China: Implications for exploration
- Rock physics model for deep coal-bed methane reservoir based on equivalent medium theory: A case study of Carboniferous-Permian in Eastern Ordos Basin
- Enhancing the total-field magnetic anomaly using the normalized source strength
- Shear wave velocity profiling of Riyadh City, Saudi Arabia, utilizing the multi-channel analysis of surface waves method
- Effect of coal facies on pore structure heterogeneity of coal measures: Quantitative characterization and comparative study
- Inversion method of organic matter content of different types of soils in black soil area based on hyperspectral indices
- Detection of seepage zones in artificial levees: A case study at the Körös River, Hungary
- Tight sandstone fluid detection technology based on multi-wave seismic data
- Characteristics and control techniques of soft rock tunnel lining cracks in high geo-stress environments: Case study of Wushaoling tunnel group
- Influence of pore structure characteristics on the Permian Shan-1 reservoir in Longdong, Southwest Ordos Basin, China
- Study on sedimentary model of Shanxi Formation – Lower Shihezi Formation in Da 17 well area of Daniudi gas field, Ordos Basin
- Multi-scenario territorial spatial simulation and dynamic changes: A case study of Jilin Province in China from 1985 to 2030
- Review Articles
- Major ascidian species with negative impacts on bivalve aquaculture: Current knowledge and future research aims
- Prediction and assessment of meteorological drought in southwest China using long short-term memory model
- Communication
- Essential questions in earth and geosciences according to large language models
- Erratum
- Erratum to “Random forest and artificial neural network-based tsunami forests classification using data fusion of Sentinel-2 and Airbus Vision-1 satellites: A case study of Garhi Chandan, Pakistan”
- Special Issue: Natural Resources and Environmental Risks: Towards a Sustainable Future - Part I
- Spatial-temporal and trend analysis of traffic accidents in AP Vojvodina (North Serbia)
- Exploring environmental awareness, knowledge, and safety: A comparative study among students in Montenegro and North Macedonia
- Determinants influencing tourists’ willingness to visit Türkiye – Impact of earthquake hazards on Serbian visitors’ preferences
- Application of remote sensing in monitoring land degradation: A case study of Stanari municipality (Bosnia and Herzegovina)
- Optimizing agricultural land use: A GIS-based assessment of suitability in the Sana River Basin, Bosnia and Herzegovina
- Assessing risk-prone areas in the Kratovska Reka catchment (North Macedonia) by integrating advanced geospatial analytics and flash flood potential index
- Analysis of the intensity of erosive processes and state of vegetation cover in the zone of influence of the Kolubara Mining Basin
- GIS-based spatial modeling of landslide susceptibility using BWM-LSI: A case study – city of Smederevo (Serbia)
- Geospatial modeling of wildfire susceptibility on a national scale in Montenegro: A comparative evaluation of F-AHP and FR methodologies
- Geosite assessment as the first step for the development of canyoning activities in North Montenegro
- Urban geoheritage and degradation risk assessment of the Sokograd fortress (Sokobanja, Eastern Serbia)
- Multi-hazard modeling of erosion and landslide susceptibility at the national scale in the example of North Macedonia
- Understanding seismic hazard resilience in Montenegro: A qualitative analysis of community preparedness and response capabilities
- Forest soil CO2 emission in Quercus robur level II monitoring site
- Characterization of glomalin proteins in soil: A potential indicator of erosion intensity
- Power of Terroir: Case study of Grašac at the Fruška Gora wine region (North Serbia)
- Special Issue: Geospatial and Environmental Dynamics - Part I
- Qualitative insights into cultural heritage protection in Serbia: Addressing legal and institutional gaps for disaster risk resilience