Spatial–temporal effect of sea–land gradient on landscape pattern and ecological risk in the coastal zone: A case study of Dalian City
-
Ying Han
 ,
Donglan Wei
,
Donglan Wei

Abstract
Coastal zones have intense human activity and are ecologically fragile. Assessing ecological risks in coastal zones is crucial to promoting ecological safety and sustainable development for coastal cities. However, the relationship between ecological risk assessment and distance from the coastline is indeterminate in current research. To solve this problem, this study constructs the sea–land gradient and reconstructs the landscape pattern index and landscape ecological risk index (ERI) considering the sea–land gradient paradigm. This study aims to analyze the spatial–temporal variation characteristics and effects of the sea–land gradient on landscape pattern and ecological risk in Dalian City from 2000 to 2015. The results show the following: (1) between 2000 and 2015, a significant effect of coastline on the coastal landscape pattern in Dalian is reducing landscape fragmentation. The extent of this influence gradually diminished along the sea–land gradient. The landscape aggregation of urban building sites near the sea was relatively high and gradually increased over the years; (2) in Dalian, the landscape ERI has decreased near the sea and increased near the inland year by year; (3) the dominant pattern of landscape ecological risk was characterized by a transition from high to low levels within the [0, 2.5] km zone, while a transition from low to high levels predominated within the [2.5, Max] km zone; and (4) the northern region in Dalian primarily goes from high to low risk in the buffer zone near the landside, whereas the southern area has this changing pattern in the buffer zone near the seaside.
1 Introduction
The coastal zone is a complex ecosystem composed of humans and nature. The interactions between land and ocean make an obvious impact on urban forms, functions, and potentials [1]. In the context of global warming and sea-level rise, the coastal zone is experiencing the most dramatic changes in resource exploitation, human activities, and the ecological environment. It takes a high degree of dynamism, complexity, and diversity [1,2,3]. With the development of coastal zones and the increasing pressure on resources and environment, there are a lot of ecological and environmental problems because of the susceptibility of coastal areas and human activities. These problems also have a detrimental influence on human society [4]. Therefore, investigations into the spatial–temporal evolution of coastal zones have a significant influence on the sustainable development of coastal cities.
The spatial and temporal evolution of the ecological environment is reflected in changes in landscape patterns. Landscape pattern, which is the result of the interaction of numerous complex physical, biological, and social forces, reflects the geographical distribution and structure of landscape features. It dominates the distribution forms and components of resources and the environment and restricts various landscape ecological processes [5]. The landscape pattern index is the primary instrument for quantitatively analyzing landscape patterns and dynamics, and it is crucial in the study of urban ecology and urban landscapes [6]. In recent years, landscape pattern analysis has been widely used in the study of urban morphology. Utilizing the landscape pattern index to conduct quantitative research on urban landscape [7] serves as a reference for urban landscape structure [8], urban ecological processes [9], and urban expansion research [10]. At present, most studies set up buffer zones along the city center to study the spatial features of urban landscape patterns [11,12,13]. The study region is largely centered in arid and semi-arid areas, deserts, agricultural and pastoral areas, and urban–rural interwoven zones in China.
With the rapid development of urbanization, the interaction between natural and social systems has become increasingly significant, resulting in significant spatial and temporal changes in the landscape pattern. The originally intact and homogeneous natural ecosystems are gradually transforming into complex and heterogeneous patterns, resulting in numerous fragmented and discontinuous mixed patches. Consequently, the ecological and environmental issues arising from these changes have attracted growing attention. Landscape ecological risks stem from the negative effects produced by the interactions between landscape patterns and ecological processes. These negative effects primarily manifest as impacts from human activities or natural disasters on the components, structure, and functions of landscapes. The ecological risk pattern of the coastal zone is a dynamic process, which is characterized by constant updating and change. Ecological risk assessment from the perspective of landscape patterns is rapidly becoming a vital method for investigating and treating ecological problems [14,15,16]. Currently, many scholars both domestically and internationally have combined landscape ecology with gradient analysis methods to study the gradient changes in landscape bands. Research primarily focuses on topographical and elevation gradients [17,18,19], revealing the dynamic changes in landscape ecological risks under various topographical and elevation gradients. It also explores the distribution differences of ecological risks at different levels and their transformations across these gradients. Gradient analysis of landscape ecological risks typically concentrates on areas with significant topographical fluctuations, such as the Loess Hilly–Gully Region, watershed areas, and ecologically fragile regions; however, studies on the gradient of ecological risks in coastal areas are relatively scarce.
The coastal zone, as an interwoven zone of land and sea systems, is an independent environmental system with two distinct land and ocean features [20]. The coastal zone is a typical ecologically vulnerable zone and a sensitive area to environmental changes since it has one of the highest densities of development and utilization [21]. On the one hand, coastal areas have to provide land and other resources for economic and social development, and on the other hand, they have to absorb the ecological and environmental pressures brought about by human activities and climate change. Consequently, while achieving rapid economic and social growth, these regions also confront numerous challenges, including unreasonable land use, coastal erosion, and regional development imbalances. In recent years, the dual pressures of global climate change and human activities have significantly altered coastal landscape patterns, leading to noticeable changes in landscape ecological processes and subjecting coastal zones to immense environmental pressures and ecological risks. Most of the research on coastal landscape and ecological risk is focused on large-scale global and national coastal climate and environmental changes [22,23], the ecological environment quality of the coastal zone [24,25,26,27], the ecosystem service value [28,29,30], as well as land use in cities and urban agglomerations of a mesoscale system [31,32,33,34]. There is a lack of research on the landscape pattern and ecological risks of coastal cities taking into account coastal features.
To specifically study the spatial and temporal changes in landscape patterns and ecological risks in coastal city, this study introduces the concept of the sea–land gradient. Gradient analysis was once a commonly used method in ecology, with similar migrations occurring in urban–rural gradients [35,36,37], topographical gradients, hydrothermal gradients, and elevation gradients. The sea–land gradient provides a new perspective to quantify the characteristics of the spatial distribution of coastal zones. It is an independent environmental system with sea–land transition features that can express the spatial change pattern of landscape structure from sea to land in a certain range [38]. By thoroughly analyzing the landscape pattern characteristics between the sea–land gradient zones can help to understand more comprehensively the landscape structure, function, and dynamic change process along this gradient. Additionally, conducting landscape ecological risk assessments based on the sea–land gradient allows for a more accurate exploration of the spatial patterns of ecological risk changes between land and sea. The changing landscape pattern and ecological development of coastal cities are both influenced by the sea–land gradient. An integrated analysis of the landscape pattern index, the landscape ecological risk index (ERI), and the natural and human elements of the sea–land gradient can better explain the interdependence of landscape processes and natural and socioeconomic processes [39].
The ecological and environmental issues in the coastal zone have garnered significant attention both domestically and internationally, according to the studies that are currently available. However, compared to watershed and inland areas, the theories and techniques for evaluating ecological risks in coastal regions remain relatively underdeveloped and require further in-depth and detailed investigation. Few studies have specifically analyzed the sea–land gradient effects on landscape patterns and ecological risks in coastal areas. To solve these challenges and more precisely explore the gradient effects of landscape patterns and ecological risks in coastal regions, this study introduces the concept of the sea–land gradient, constructs gradient intervals, and proposes landscape pattern indices and ecological risk indices applicable to the sea–land gradient. Using Dalian as a study area, this study analyzes the spatiotemporal changes in landscape patterns and landscape ecological risks along the sea–land gradient from 2000 to 2015. The study helps to deepen our understanding of the relationship between human activities and the sea–land interface, aiming to provide scientific support for the sustainable development of the coastal landscape in Dalian. Additionally, it offers theoretical insights for regional land-use planning and urban development decision-making. This study holds significant importance for coordinating the rational use of land resources, regional sustainable development, and environmental protection in coastal zones.
2 Materials and methods
2.1 Study area
Dalian is located at the southern end of the Liaodong Peninsula, between 120°58′–123°31′E and 38°43′–40°10′N. It is bounded to the east by the Yellow Sea, to the west by the Bohai Sea, to the south by the Shandong Peninsula, and to the north by China’s northeastern mainland. Dalian is surrounded by the sea on three sides and a long coastline, and blessed with the advantages of marine resources. The topography of Dalian City is characterized by higher elevations in the north and lower elevations in the south, with mountainous and hilly landscapes widely distributed. Dalian City is located in the warm temperate zone of the Northern Hemisphere and experiences a warm temperate continental monsoon climate with maritime characteristics. The winters are mild, the summers are not excessively hot, and the four seasons are distinct. The annual average temperature is 10.5°C, with annual precipitation ranging from 550 to 950 mm, and the total annual sunshine hours range from 2,500 to 2,800 h. The total area of the city is approximately 12,574 km2, of which the total area of the urban area is approximately 550.27 km2. For this study, the land area of Dalian is divided into the Main urban area, Jinzhou District, Lushunkou District, Pulandian District, Wafangdian City, and Zhuanghe City (Figure 1).

Location and administrative divisions of Dalian.
2.2 Data sources
This study is based on the land-use data from the Resource and Environment Data Center of the Chinese Academy of Sciences from 2000 to 2015 [40]. Based on the national resource and environment database, the Chinese Academy of Sciences utilized Landsat remote sensing imagery from the United States as the primary information source. Through manual visual interpretation, they established a national-scale land-use thematic database at a 1:10,000 scale, covering multiple time periods. The land-use data required for this study for the years 2000, 2005, 2010, and 2015 was obtained through reclassification processing, with a spatial resolution of 30 meters (Figure 2). The classification of this study is based on the national standard of Classification of Land Use Status (GB/T21010-2017), and combined with the characteristics of the land-use types in the study area, the land-use types of Dalian City are divided into agricultural land, woodland, grassland, water bodies, construction land, and unused land. The construction land includes urban building sites, rural building land, and other building sites (Table 1).

Spatial distribution of land use in Dalian.
Land-use classification categories
| Land-use class | Secondary land-use category |
|---|---|
| Agricultural land | Paddy field |
| Dryland | |
| Woodland | Arbor |
| Shrubland | |
| Sparse woodland | |
| Other forest lands | |
| Grassland | Natural pasture |
| Artificial pasture | |
| Other grasslands | |
| Water bodies | River |
| Lake | |
| Reservoir | |
| Pit pond | |
| Channel | |
| Construction land | Urban building sites |
| Rural building land | |
| Other building sites | |
| Unused land | Saline-alkali soil |
| Sand | |
| Bare land |
According to our previous researches, during 2000 and 2015, Dalian has fully utilized the benefits of coastal resources, and the entire quantity of land for the urban and port building has been spread near the coastline area, with a quick growth rate. The main source of land for building in the coastal zone is the conversion of agricultural land by human activity. The major zone of urban construction land has expanded from the shore to the inland in the southern part of Dalian; in the center and northern portions, urban construction land has developed inland, on the one hand, and to the sea on the other. From a spatial perspective, the homogeneity of land use gradually decreases from the coast to the interior; from a temporal perspective, the homogeneity of administrative units gradually increases, except for the Dalian city area. In the course of development, the homogeneity of land use in Dalian increases with time and subsequently diminishes when it reaches a particular level. Overall, the coastal areas are the first to suffer [41].
2.3 Methods
2.3.1 Extracting coastline and sea–land gradient
Since 2000, the coastline of Dalian has been changing as a result of the interaction between sea and land. The urban expansion has moved toward the sea, and part of the sea areas has transformed into land continually. In this study, the coastline extracted in 2015 is used as the reference coastline, which is the boundary of the study area.
To further analyze the spatial and temporal changes in coastal landscape patterns and landscape ecological risks with the spatial distance of the coastline, this study introduces the concept of sea–land gradient. According to our previous research [41], the sea–land gradient can reflect the spatial variation of landscape structure within a certain range from the sea to the land. It is an independent environmental system with the characteristics of sea–land transition. Based on the reference coastline, the study area is divided into four zones of [0,2.5] km, [2.5,5] km, [5,10] km, and [10, Max] km from sea to land, respectively (Figure 3).

Distribution of sea–land gradient and coastline changes in Dalian.
2.3.2 Measuring landscape pattern index with sea–land gradient
The landscape pattern index is widely used to analyze the spatial heterogeneity of urban ecosystems and their ecological effects [42]. In this study, two types of landscape indices are studied: class metrics and landscape metrics. The number of patches (NP), patch density (PD), edge density (ED), aggregation index (AI), and percentage of landscape (PLAND) are examples of class metrics indices; landscape metrics indices include the landscape shape index (LSI), largest patch index (LPI), Shannon’s evenness index (SHEI), and contagion index (CONTAG) [43,44,45] (Table 2). First, we cut out the land-use raster data of different buffer zones in batches and then calculated landscape pattern metrics in batches in Fragstats 4.2 software. Fragstats is a software tool used for analyzing and describing landscape patterns. It was developed by the Forest Service of the United States Department of Agriculture (USDA) and initially made available in 1994. The software is designed to provide quantitative analytical methods for landscape ecology research, enabling the assessment and interpretation of spatial and temporal patterns and dynamics within landscapes.
Landscape pattern index
| Landscape index | Metrics | Formula and meaning |
|---|---|---|
| NP | Class/landscape |
|
| PD | Class/landscape |
|
| ED | Class |
|
| AI | Class |
|
| PLAND | Class |
|
| LPI | Landscape |
|
| LSI | Class/landscape |
|
| SHEI | Landscape |
|
| CONTAG | Landscape |
|
2.3.3 Measuring landscape ERI with sea–land gradient
To improve the accuracy of estimating and visualizing the ERI, the landscape ecological units need to first be divided. According to landscape ecology studies, units should be 2–5 times larger than average patches. For the irregular units cutoff at the edge of the study area, those with an area greater than 0.5 regular sampling units are considered separate sample units, while those with an area less than 0.5 regular sampling units are merged into nearby sampling units [46]. As a result, the study area was divided into 3 km
Landscape pattern indices can effectively quantify valuable information regarding land-use/cover patterns and have thus become important indicators for assessing regional ecological risk conditions [47]. The magnitude of these indices can reflect the level of landscape ecological risk in the study area. The equation for landscape ecological risk is defined as follows:
where
2.3.3.1 Landscape loss index
The landscape loss index (
where
2.3.3.2 Landscape disturbance index
The landscape disturbance index (
where
2.3.3.2.1 Landscape fragmentation index
The landscape fragmentation index (
where
2.3.3.2.2 Landscape separation index
The landscape separation index (
where
2.3.3.2.3 Landscape fractal dimension index
The landscape fractal dimension index (
where
2.3.3.3 Landscape vulnerability index
The landscape vulnerability index (
3 Results
3.1 Spatial and temporal changes of coastal landscape patterns
3.1.1 Gradient analysis of coastal landscape pattern
The results of the calculation of the landscape pattern index for different gradient zones in Dalian from 2000 to 2015 are shown in Table 3. The main observations may be summarized as follows:
From 2000 to 2015, NP and LSI showed a tendency of first dropping and then growing along with the distance buffer zones in Dalian. NP has the fastest growth rate and the largest number in the [10, Max] km zone. The landscape shape is relatively irregular in the [0,2.5] and [10, Max] km zones.
PD decreases as the distance increases, indicating that the degree of landscape fragmentation decreases as the distance from the coastline, and the highest degree of landscape fragmentation is found in the [0,2.5] km zone.
In contrast to the changing trend of PD, the LPI grows with distance when seen from a spatial perspective. The LPI declined throughout time, with the rate of decline in the [10, Max] km zone being the fastest, at 64%.
The CONTAG increases steadily as the distance from the coastline increases, and the value is greatest in the [5, Max] km zone, indicating a significant degree of landscape aggregation. The degree of aggregation declines year after year.
The SHEI has increased year by year. The growth rate is the fastest in the [0,2.5] km zone, and the distribution of components in the landscape is the highest.
Landscape pattern index (landscape metrics) for different buffer zones in Dalian, 2000–2015
| Year | Buffer zones | NP | PD | LPI | LSI | CONTAG | SHEI |
|---|---|---|---|---|---|---|---|
| 2000 | [0,2.5] | 3646.00 | 1.56 | 4.97 | 46.29 | 62.13 | 0.66 |
| [2.5,5] | 1956.00 | 1.33 | 5.73 | 36.40 | 66.71 | 0.57 | |
| [5,10] | 2465.00 | 1.19 | 17.54 | 37.63 | 70.93 | 0.49 | |
| [10, Max] | 4445.00 | 0.71 | 29.45 | 56.90 | 69.13 | 0.52 | |
| 2005 | [0,2.5] | 4055.00 | 1.72 | 4.94 | 45.70 | 60.63 | 0.69 |
| [2.5,5] | 2001.00 | 1.36 | 5.72 | 34.77 | 65.96 | 0.59 | |
| [5,10] | 2523.00 | 1.22 | 14.04 | 36.42 | 70.55 | 0.50 | |
| [10, Max] | 4972.00 | 0.80 | 23.99 | 54.57 | 68.95 | 0.53 | |
| 2010 | [0,2.5] | 5016.00 | 2.09 | 4.45 | 49.79 | 56.72 | 0.76 |
| [2.5,5] | 2212.00 | 1.50 | 4.97 | 38.83 | 62.48 | 0.64 | |
| [5,10] | 2873.00 | 1.39 | 9.57 | 43.20 | 67.46 | 0.54 | |
| [10, Max] | 6142.00 | 0.99 | 10.75 | 66.85 | 67.15 | 0.55 | |
| 2015 | [0,2.5] | 3433.00 | 1.41 | 4.87 | 47.57 | 56.44 | 0.77 |
| [2.5,5] | 2155.00 | 1.46 | 4.88 | 38.26 | 62.06 | 0.65 | |
| [5,10] | 2886.00 | 1.39 | 9.55 | 43.50 | 66.68 | 0.55 | |
| [10, Max] | 6112.00 | 0.98 | 10.74 | 66.84 | 66.63 | 0.55 |
Figure 4 reports the changes in the landscape index at the class metrics on different buffer zones from 2000 to 2015. The degree of fragmentation and aggregation in different buffer zones, and the spatial distribution of landscape types revealed zonal differences.
From 2000 to 2015, the varying pattern among the different buffer zones was the same for rural building land, woodland, and agricultural land. The specific performance is that the LSI, PD, ED, and the NP all have maximum values, the landscape seems fragmented, and the landscape shape is irregular.
The patch shape of rural building land becomes increasingly irregular as the distance from the coastline rises. The NP of rural building land in the [10, Max] km zone has grown at the quickest rate, increasing by 1,583 patches in 15 years.
The urban building sites have the highest landscape AI value. In comparison with other land types, urban building sites are the most concentrated, with coastal development focused on the [0,5] km zone.
Woodland and agricultural land have the biggest PLAND types. The number of woodland increases with the distance from the coastline, and the proportion is largest in the [10, Max] km zone. The proportion of agricultural land is largest in the [5,10] km zone. In 2015, the proportion of urban building sites in the [0,5] km zone more than doubled compared to 2000.

Changes in landscape pattern index (class metrics) for different buffer zones in Dalian from 2000 to 2015: (a) NP, (b) PD, (c) ED, (d) AI, (e) LSI, and (f) PLAND.
3.1.2 Spatial analysis of gradient effect of coastal landscape pattern
The analysis of the landscape pattern indices of each administrative district in 2000 and 2015 (Table 4) could be summarized in the following points:
From 2000 to 2015, the landscape of the main urban area gradually fragmented from land to sea. Particularly, in the [0,2.5] km zone, the fragmentation is significant, the shape of the plaque is relatively regular, and the distribution of the plaque is highly uniform.
The Jinzhou District is highly fragmented overall, with patches clustering as the distance from the coastline rises and the distribution of the landscape becomes less uniform, with the largest fragmentation in the [10, Max] km zone.
The degree of landscape fragmentation in the Lushunkou District is large in the [0,5] km zone. However, as the distance between buffer zones increases, the degree of fragmentation gradually reduces, the shape of the patches tends to be regular, and the aggregation of landscape components is high.
The Pulandian District has the highest degree of landscape fragmentation and has the maximum density of patches when compared to other administrative regions in the [0,2.5] km zone. The degree of fragmentation in the Pulandian District steadily reduces as the distance from the coastline increases, and the landscape shape is irregular.
In Wafangdian City, the buffer zone near the sea has the most landscape fragmentation, while the buffer zone near the land has more patchy aggregation.
The NP in Zhuanghe City has increased fast over time, particularly in the [10, Max] km zone, where there has been a rise of 885 patches. Simultaneously, the landscape shape is most regular in the [10, Max] km zone. The [0,10] km zone has a higher degree of landscape fragmentation and patch aggregation.
Landscape pattern index (landscape metrics) by administrative districts in Dalian
| Buffer zones | Administrative district | NP | PD | LPI | LSI | CONTAG | SHEI | ||||||
|---|---|---|---|---|---|---|---|---|---|---|---|---|---|
| 2000 | 2015 | 2000 | 2015 | 2000 | 2015 | 2000 | 2015 | 2000 | 2015 | 2000 | 2015 | ||
| [0,2.5] | Main urban area | 297.00 | 232.00 | 1.04 | 0.76 | 26.03 | 39.13 | 15.31 | 15.26 | 58.26 | 60.42 | 0.75 | 0.71 |
| Jinzhou District | 788.00 | 681.00 | 1.45 | 1.16 | 9.40 | 9.21 | 23.45 | 22.68 | 59.75 | 54.10 | 0.71 | 0.82 | |
| Lushunkou District | 338.00 | 365.00 | 1.35 | 1.44 | 17.22 | 9.19 | 16.14 | 17.84 | 63.47 | 57.67 | 0.62 | 0.73 | |
| Pulandian District | 489.00 | 339.00 | 2.71 | 1.88 | 48.33 | 48.78 | 14.70 | 13.93 | 63.45 | 63.70 | 0.62 | 0.63 | |
| Wafangdian City | 1000.00 | 817.00 | 1.59 | 1.23 | 9.68 | 8.58 | 25.44 | 24.75 | 66.19 | 59.33 | 0.57 | 0.72 | |
| Zhuanghe City | 757.00 | 716.00 | 1.71 | 1.61 | 26.17 | 17.26 | 17.67 | 22.02 | 73.75 | 67.38 | 0.45 | 0.55 | |
| [2.5,5] | Main urban area | 190.00 | 144.00 | 1.23 | 0.94 | 14.29 | 40.96 | 12.50 | 10.57 | 60.00 | 66.73 | 0.69 | 0.58 |
| Jinzhou District | 528.00 | 530.00 | 1.44 | 1.44 | 9.55 | 17.80 | 19.03 | 18.56 | 64.80 | 62.39 | 0.61 | 0.65 | |
| Lushunkou District | 181.00 | 209.00 | 1.30 | 1.50 | 23.06 | 21.77 | 11.29 | 12.38 | 69.18 | 61.17 | 0.52 | 0.66 | |
| Pulandian District | 302.00 | 319.00 | 1.68 | 1.78 | 43.09 | 26.80 | 13.01 | 14.04 | 63.88 | 67.79 | 0.60 | 0.54 | |
| Wafangdian City | 506.00 | 521.00 | 1.45 | 1.49 | 13.20 | 9.52 | 19.00 | 19.64 | 67.80 | 58.28 | 0.54 | 0.72 | |
| Zhuanghe City | 313.00 | 505.00 | 1.11 | 1.79 | 29.84 | 25.46 | 14.39 | 18.27 | 70.74 | 70.16 | 0.49 | 0.49 | |
| [5,10] | Main urban area | 77.00 | 74.00 | 0.57 | 0.54 | 70.26 | 31.28 | 6.85 | 8.41 | 70.63 | 67.55 | 0.51 | 0.56 |
| Jinzhou District | 661.00 | 683.00 | 1.40 | 1.44 | 30.12 | 15.66 | 20.75 | 22.52 | 70.06 | 64.87 | 0.49 | 0.58 | |
| Lushunkou District | 74.00 | 104.00 | 0.83 | 1.17 | 39.96 | 29.51 | 7.27 | 8.82 | 63.01 | 66.25 | 0.63 | 0.57 | |
| Pulandian District | 570.00 | 616.00 | 1.45 | 1.56 | 56.01 | 22.32 | 15.98 | 18.43 | 76.56 | 72.89 | 0.38 | 0.44 | |
| Wafangdian City | 683.00 | 723.00 | 1.36 | 1.44 | 32.71 | 39.55 | 21.33 | 22.76 | 67.33 | 64.85 | 0.53 | 0.57 | |
| Zhuanghe City | 501.00 | 810.00 | 1.05 | 1.70 | 33.14 | 18.35 | 17.41 | 22.69 | 71.36 | 70.03 | 0.47 | 0.48 | |
| [10, Max] | Main urban area | 0.00 | 0.00 | 0.00 | 0.00 | 0.00 | 0.00 | 0.00 | 0.00 | 0.00 | 0.00 | 0.00 | 0.00 |
| Jinzhou District | 362.00 | 346.00 | 1.58 | 1.51 | 70.66 | 71.32 | 13.91 | 13.88 | 68.46 | 71.19 | 0.50 | 0.46 | |
| Pulandian District | 1573.00 | 1980.00 | 0.93 | 1.17 | 39.12 | 35.14 | 31.25 | 36.99 | 68.29 | 66.80 | 0.53 | 0.54 | |
| Wafangdian City | 1255.00 | 1707.00 | 0.69 | 0.94 | 22.78 | 16.34 | 29.41 | 36.52 | 69.01 | 64.34 | 0.53 | 0.60 | |
| Zhuanghe City | 1393.00 | 2278.00 | 0.56 | 0.92 | 19.77 | 19.82 | 36.90 | 41.78 | 61.12 | 66.27 | 0.65 | 0.56 | |
To summarize, since the twenty-first century, the landscape pattern of land use in Dalian has been changing. The changes are mainly manifested in the gradual fragmentation of the landscape, the increasing NP, the complex shape of patches, and the irregularity of patch boundaries. It appears that as the distance from the coastline rises, the degree of fragmentation decreases, and fragmentation of the landscape within the [0,2.5] km zone is large, although the uniformity of the landscape distribution is quite high. In terms of land-use types, urban building sites develop along the coastline and grow in the [0,5] km zone, whereas rural building land expands rapidly in the [10, Max] km zone. Agricultural land and woodland are the dominant landscape types in Dalian, accounting for the greatest proportion, and the greatest proportion is located in the [5, Max] km zone (the proportion is greater than 40%). The proportion of landscape types of urban building sites increased from 6.08% in 2000 to 15.23% in 2015 within the [0,2.5] km zone, which indicates significant urbanization development. Rural building land, woodland, and agricultural land are all highly fragmented. In terms of administrative regions, Jinzhou District is significantly fragmented.
3.2 Spatial and temporal changes in landscape ecological risk
3.2.1 Gradient analysis of coastal landscape ecological risk
The ecological risk grade for each buffer zone in Dalian from 2000 to 2015 was calculated according to the landscape ERI model (equation (1)) and then assigned to each unit centroid, and the Kriging method was used to generate a map of the spatial distribution of ecological risk in Dalian (Figure 5). Based on the natural breaks classification, the ecological risk was divided into five risk levels: low, medium low, medium, medium high, and high.
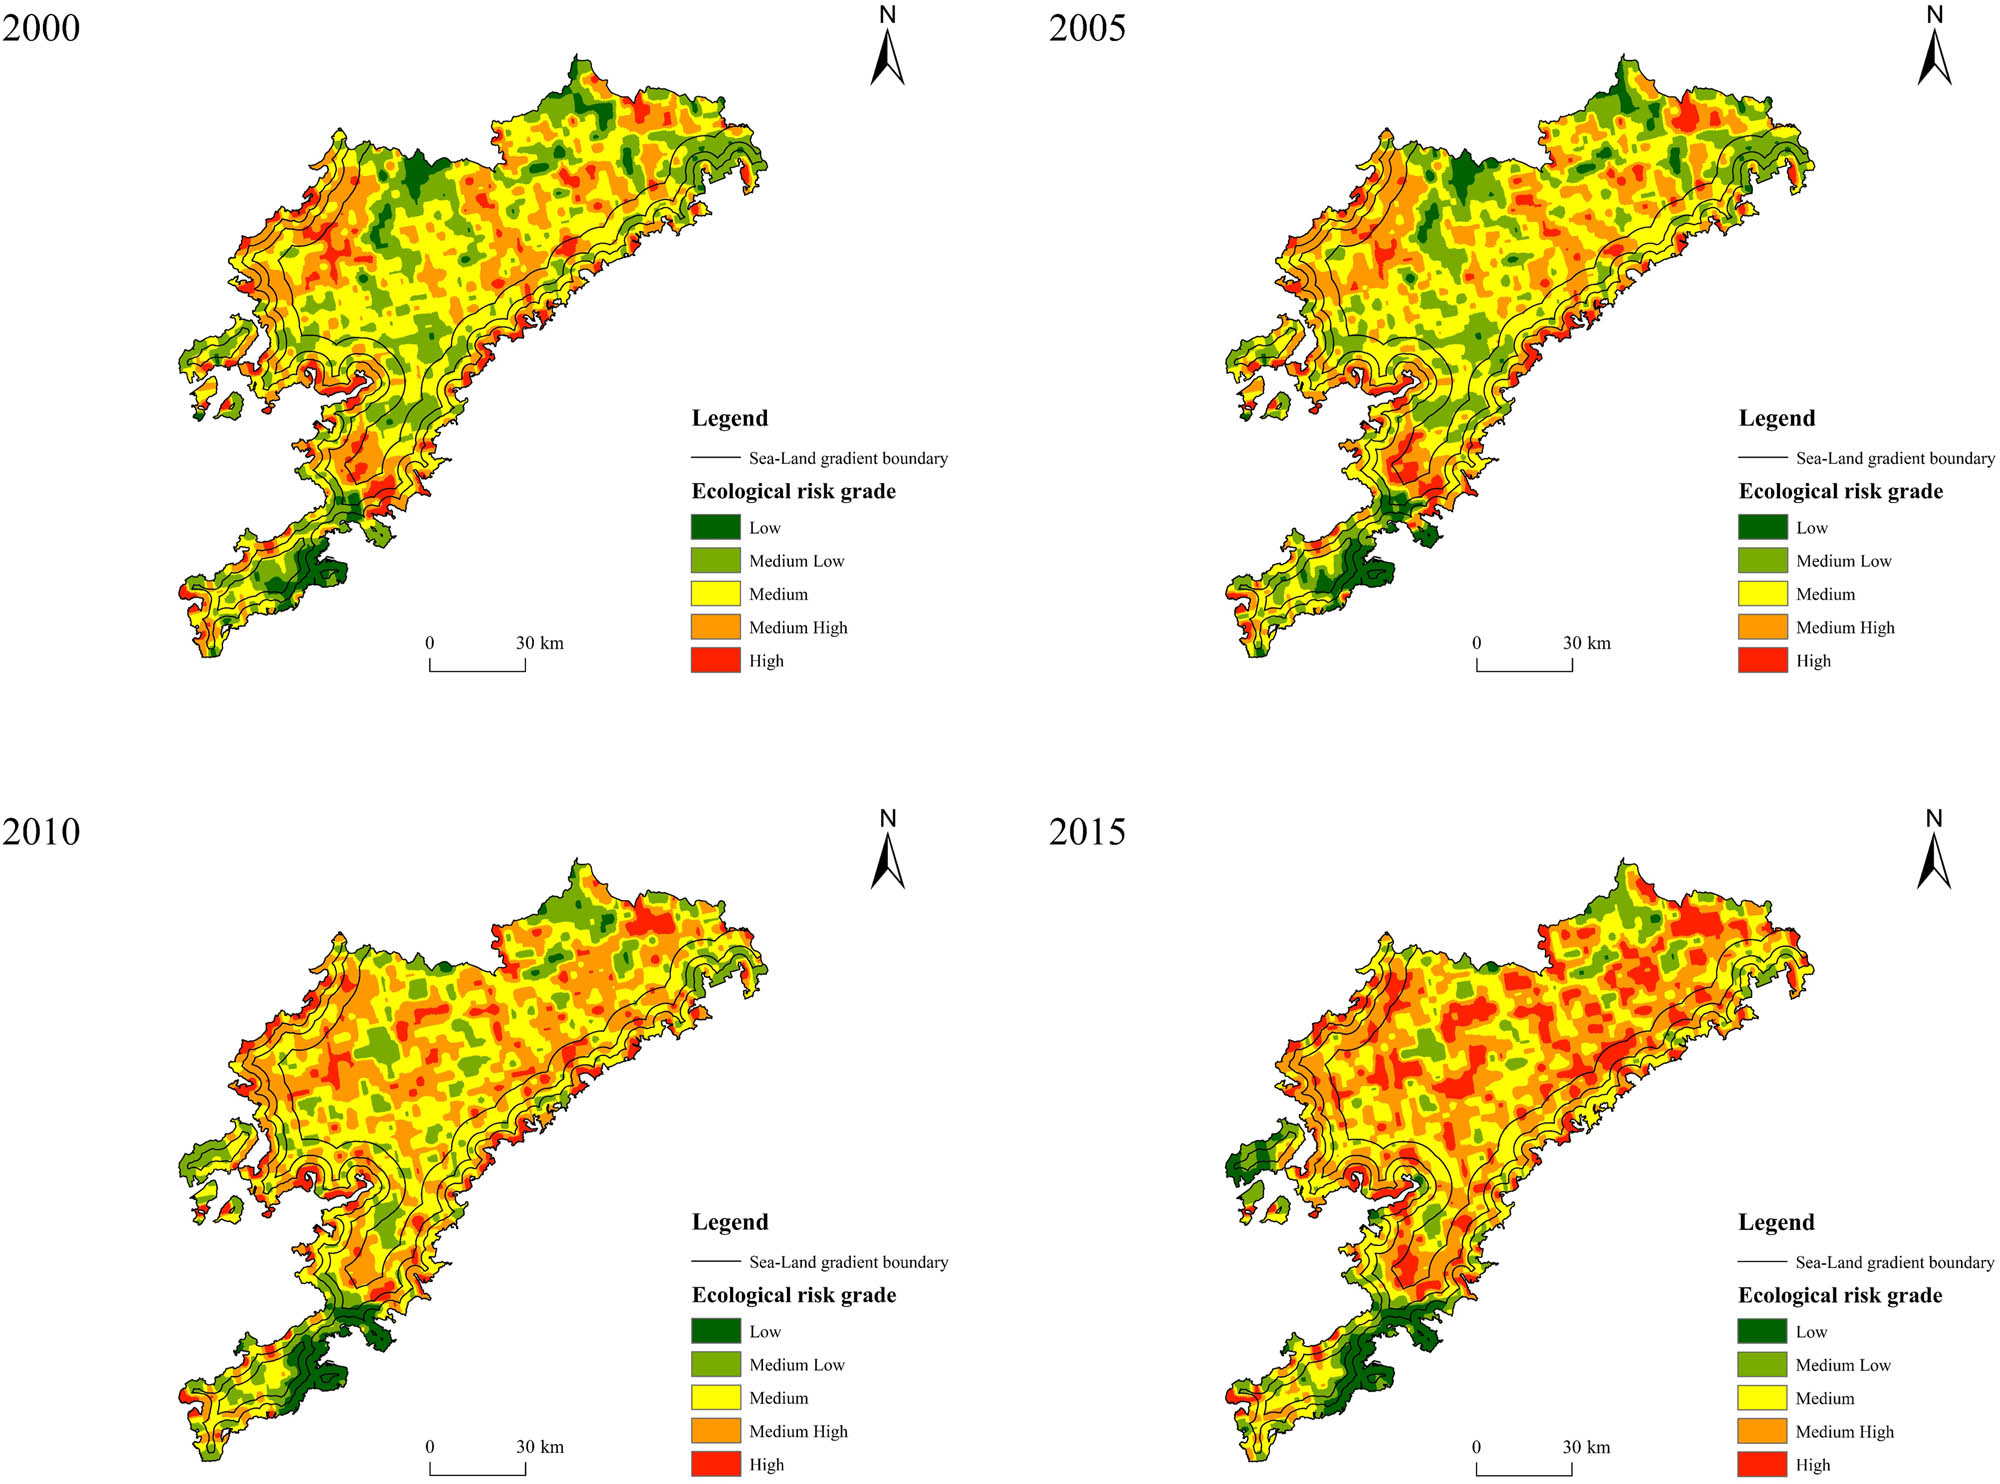
Spatial distribution of ecological risks in Dalian from 2000 to 2015.
Table 5 shows how the area of ecological risk in the various buffer zones changed between 2000 and 2015. In Dalian, low risk grew over time, medium high and high shrank, and the medium risk had a disproportionately high percentage. The low risk is expanding in the [2.5,5] km zone, and this buffer zone is primarily dominated by the medium risk. Low risk in the [5,10] km zone fluctuates up and down with time, and this zone is dominated by medium and medium high risk, the area of which increases with time. In the [10, Max] km zone, low and medium low risk decreased over time, while the area of medium risk increased until 2015, and the area of high and medium high risk decreased, with medium and medium high zones dominating in the [10, Max] km zone.
Changes in coastal ecological risk gradients in Dalian
| Buffer zones | Year | Low (km2) | Medium low (km2) | Medium (km2) | Medium high (km2) | High (km2) |
|---|---|---|---|---|---|---|
| [0,2.5] | 2000 | 197.31 | 447.46 | 765.48 | 510.80 | 415.69 |
| 2005 | 227.90 | 387.46 | 717.16 | 553.88 | 450.34 | |
| 2010 | 313.05 | 578.32 | 476.31 | 550.87 | 418.19 | |
| 2015 | 517.68 | 464.11 | 787.21 | 330.27 | 237.47 | |
| [2.5,5] | 2000 | 103.63 | 420.08 | 599.38 | 297.89 | 52.15 |
| 2005 | 136.38 | 374.07 | 614.64 | 300.67 | 47.38 | |
| 2010 | 140.97 | 449.77 | 421.34 | 377.45 | 83.61 | |
| 2015 | 196.85 | 286.51 | 608.85 | 337.25 | 43.67 | |
| [5,10] | 2000 | 78.53 | 511.56 | 877.38 | 459.07 | 142.68 |
| 2005 | 107.35 | 459.23 | 884.81 | 487.37 | 130.47 | |
| 2010 | 50.60 | 578.91 | 587.99 | 682.24 | 169.48 | |
| 2015 | 65.45 | 291.43 | 901.28 | 669.69 | 141.38 | |
| [10, Max] | 2000 | 441.87 | 1350.72 | 2571.94 | 1470.05 | 371.15 |
| 2005 | 399.52 | 1228.57 | 2615.13 | 1541.92 | 420.58 | |
| 2010 | 276.94 | 1524.39 | 1616.28 | 2193.07 | 595.05 | |
| 2015 | 274.88 | 963.50 | 2316.94 | 2188.55 | 461.85 |
The transfer matrix of ecological risk-level changes in distance from the coastline in Dalian is presented in Figure 6. The results show that:
In the [0,2.5] km zone, the transfer from medium low to medium risk is the key factor in the 204.66 km2 region with an increasing trend of ecological risk level; the transfer from medium to medium low risk is the main factor in the 475.65 km2 area with a declining trend of the ecological risk level. The decreasing trend in this buffer zone is 2.3 times greater than the increasing area, indicating a gradual decrease in the ecological risk level in the buffer zone near the sea.
In the [2.5,5] km zone, the area with an increasing trend in ecological risk level is 341.83 km2, consisting primarily of medium low to medium risk and from medium to medium high risk; the area with a decreasing trend in ecological risk level is 160.66 km2, consisting primarily of medium to low and medium low risk.
In the [5,10] km zone, the area with an increasing trend of ecological risk level is 666.02 km2, mainly from medium low to medium risk and from medium to medium high risk; the area with a decreasing trend of ecological risk level is 95.69 km2, mainly from medium to medium low risk. In this buffer zone, the area with an upward trend is 7 times larger than the area with a downward trend, and the ecological risk level rises significantly.
In the [10, Max] km zone, the area with an increasing trend in ecological risk level is 1894.27 km2, primarily because of the transfer of medium low risk to medium and medium high risk, as well as the transfer of medium risk to medium high risk; the area with a decreasing trend in ecological risk level is 358.13 km2, primarily because of the transfer of medium risk to medium low risk. This buffer zone’s upward trend is 5.3 times greater than its downward trend, indicating a significant increase in the level of ecological risk.
![Figure 6
Transfer matrix of ecological risk level changes in (a) [0,2.5] km, (b) [2.5,5] km, (c) [5,10] km, and (d) [10, Max] km from the coastline in Dalian.](/document/doi/10.1515/geo-2022-0722/asset/graphic/j_geo-2022-0722_fig_006.jpg)
Transfer matrix of ecological risk level changes in (a) [0,2.5] km, (b) [2.5,5] km, (c) [5,10] km, and (d) [10, Max] km from the coastline in Dalian.

Ecological risk in the administrative district of Dalian from 2000 to 2015: (a) main urban area, (b) Jinzhou District, (c) Lushunkou District, (d) Pulandian District, (e) Wafangdian City, and (f) Zhuanghe City.
In the study area, the ecological risk grade is generally transferring from medium low to medium high levels. The area with a decreasing trend in ecological risk is 1090.13 km2, whereas the area with an increasing trend is 3106.78 km2, or almost 2.85 times the area with a declining trend. Except for the buffer zone near the sea, the ecological risk levels in the rest of the gradient are all increasing more than decreasing, and the closer to land, the greater the increase than the decrease, indicating that the overall ecological risk in the coastal zone of Dalian is on the high side during the period 2000–2015.
3.2.2 Spatial analysis of gradient effect of coastal landscape ecological risk
Administrative units in Dalian displayed varying levels of ecological risk from 2000 to 2015 in various distance buffer zones (Figure 7). Except for the main urban area and Lushunkou District, each administrative unit’s trend of change in the transfer of ecological risk areas occurred within the same buffer zone between 2000 and 2015; however, the rate and area of transformation varied.
In the [0,5] km zone, there is mainly a transfer from high risk to low risk. However, in the [5, Max] km zone, there is a complex transfer in ecological risk levels, both from low to high and from high to low. The main urban area and Lushunkou District have a unique trend of change. The main urban area and Lushunkou District are similar in size and narrow in shape, and are adjacent to each other, with the Yellow Sea and the Bohai Sea on the east and west sides. There is no [10, Max] km zone in the main urban area and Lushunkou District due to the influence of area and shape factors, and the transfer in ecological risk is primarily manifested in the [0,2.5] km zone, from high risk to low risk. In comparison with the main urban area, Lushunkou District, and Jinzhou District, Pulandian District, Wafangdian City, and Zhuanghe City are located inland in the north. Pulandian District, Wafangdian City, and Zhuanghe City have the same trend of change in the [10, Max] km zone, with the largest area of change.
To summarize, the ecological risk level in Dalian’s near-sea zones has been declining annually between 2000 and 2015, while the opposite has been true for the near-land zones. The majority of the ecological risk-level transfer from Dalian is from low level to high level. In the [0,2.5] km zone, the ecological risk level is trending downward; however, in the [2.5, Max] km zone, it is trending upward. The overall ecological risk level of Dalian City is relatively high, and from a spatial perspective, the ecological risk level displays a gradient-like increasing tendency as the distance from the coastline rises.
4 Discussion
According to the results presented earlier, the coastal development patterns of Dalian have changed dramatically from 2000 to 2015 and have a significant impact on coastal land-use patterns.
First of all, there is a significant sea–land gradient effect on the changes of landscape patterns and landscape ecological risks in Dalian. The landscape patterns near the seaside have a tendency of more fragmentation than near the landside. The landscape ecological risks in the coastal zone have been increasing relative to those in the other zone. These results indicate that the development of Dalian is along the coastal zone and land use has been diversified, fragmented, and sensitive with the development.
In addition, the spatial heterogeneity of the sea–land gradient effects is certified in this case study. Different regions have different landscape ecological risk levels due to their geographical locations and development orientations. For example, the ecological risk values of Jinzhou District and Pulandian District have increased, with medium and medium high ecological risks predominating. In contrast, the main urban area is relatively well developed, with a high proportion of construction land and relatively sound facilities, and the ecological risk of the landscape is low. This is a result of the quick expansion of Jinzhou District, which led to the state’s approval of the establishment of Jinpu New District in 2014, which encompasses all of Jinzhou District’s administrative territory as well as a portion of Pulandian City. Throughout the study period, there was greater contact between construction land, unused land, and coastal water bodies, and the rapid development also generated ecological risk issues.
Changes in land use will unavoidably result in changes in regional landscape patterns, which will result in changes in landscape ecological risks [55]. The aforementioned phenomenon is the result of two major factors: land-use policies and the impact of rapid urbanization. Since the promulgation of the People’s Republic of China’s Land Management Law in 1999, land policy has begun to shift toward rationalization and standardization. From 2000 to 2015, the Ministry of Natural Resources issued 23 land-use policies and regulations and 103 marine development policies and regulations. Land policies regulate and influence the scale, intensity, and economic efficiency of land use [52]. At the same time, coastal cities have also emerged as the “leaders” of China’s economic development as a result of the “Northeast Revitalization Plan” and the brisk maritime business development. Furthermore, Dalian has an excellent geographical location and is the largest port city in northeast China. As the first batch of coastal open cities in China, Dalian has a relatively high level of urbanization and a rapid urbanization process. The change in landscape pattern is not only a concrete manifestation of the outcome of urbanization, but also a reflection of the dynamic change process of society, economy, environment, and many other factors affected by urbanization [56].
To a certain extent, the alterations in socioeconomic development and policy considerations over the past few years can be seen in the characteristics of land-use landscape patterns across time as well as the response to the distance from the coastline. Landscape ecological risk assessment is a comprehensive tool for the best spatial allocation of land resources and the design of ecological resource management decisions. Measuring the degree of landscape ecological risk in a region from the standpoint of ecological process and spatial coupling in landscape ecology offers a novel approach to quantifying the ecological effects of land-use change [57,58].
Based on the analysis in this study, the following recommendations are proposed: to address issues such as landscape fragmentation and increased ecological risks caused by unsustainable land development during socioeconomic development, Dalian should adhere to a protection-first principle in its future development. In the specific management process, it is crucial to first focus on overall development, followed by a detailed analysis of the variations in regional landscape patterns and ecological risks across different buffer zones. Additionally, close cooperation among the administrative districts should be strengthened. Since the landscape structure and ecological risk levels vary significantly across different administrative districts, differentiated management strategies should be adopted based on varying levels of risk. In addition, management can be stratified within administrative districts according to the changes in landscape patterns and ecological risks across the sea–land gradient zones. In the buffer zone near the sea, it is important to balance the needs of economic development with the protection of landscape ecology. This can be achieved through optimizing urban expansion models, rationally planning land use, and controlling development intensity, ultimately ensuring a balance between economic growth and ecological protection. In the buffer zone near the land, sustainable development of industries such as agriculture and forestry should be promoted to enhance land-use efficiency and optimize landscape patterns. This will help to realize the rational and circular use of resources and improve the stability and resilience of ecosystems against disturbances.
By clarifying the spatiotemporal patterns of coastal landscape changes and ecological risks, this study helps inform better urban management and provides a reliable basis for future coastal city planning and sustainable ecological development. Given the complexity of landscape ecological elements in coastal zones, this study evaluates the ecological risks of Dalian’s coastal zone primarily from the perspective of land-use and landscape pattern changes, without fully accounting for the influence of natural and human factors. Future research should focus on potential risk sources involving natural and socioeconomic factors to clarify the role of natural and socioeconomic drivers in the changes in landscape patterns and ecological risks. We are currently collecting data on land-use changes of other coastal cities in the world and will conduct a more extensive analysis of the aforementioned conclusions in the future.
5 Conclusion
In the context of integrated land–sea planning and rapid urban development, exploring the impact of the land–sea gradient on the changes in landscape patterns and ecological risks of coastal cities is essential for better understanding coastal urban development. This understanding is crucial for addressing environmental and natural challenges. The research holds significant value for optimizing landscape patterns and reducing ecological risks in the coastal zone of Dalian. In this study, the land-use data of Dalian City from 2000 to 2015 were classified and processed. Then, the landscape pattern index was calculated, and the landscape ecological risk model was constructed. Landscape pattern analysis and landscape ecological risk evaluation of land-use changes in Dalian City along the sea–land gradient are performed using a 3 km
Acknowledgements
Thanks for the reviewers and editors for their constructive suggestions and comments.
-
Funding information: This research has been supported by the National Natural Science Foundation of China, Grant Number 42101257, Department of Education of Liaoning Province, Grant Number LJKZ0972, Institute of Marine Sustainable Development of Liaoning Normal University.
-
Author contributions: Conceptualization, J.Z., F.W., and Y.H.; formal analysis, J.Z. and D.W.; project administration and funding acquisition, J.Z.; investigation, J.Z., D.W., and Y.H.; writing – original draft and methodology, Y.H.; writing – review and editing, J.Z.; supervision, F.W. The authors applied the SDC approach for the sequence of authors. All authors have read and agreed to the published version of the manuscript.
-
Conflict of interest: All authors declare that there is no conflict of interest.
References
[1] Tian P, Wang ZY, Li JL, Cao LD, Liu YC, Zhang HT, et al. Spatiotemporal characteristics and driving mechanism of high-intensity development of continental coastal zones in the East China Sea. Geogr Res. 2023;42:156–71.Search in Google Scholar
[2] Di XH, Wu XY, Wu L. Land Use Classification System for China’s Coastal Zone Based on Remote Sensing. Resour Sci. 2014;36:463–72.Search in Google Scholar
[3] Que QH, Wen CX. Spatial governance of coastal resource-based cities for high-quality development: From the perspective of cross-system impact. J Nat Resour. 2023;38:255–68.10.31497/zrzyxb.20230116Search in Google Scholar
[4] Liu XD, Tang LM, Li YL, Xu MD, Kang XY. Progress and topical analysis of international coastal zone research in the last 30 years based on knowledge mapping. Bull Surv Mapp. 2022;12:153–9.Search in Google Scholar
[5] Li QW, Jin TT, Peng QD, Lin JQ, Zhang D, Huang JT, et al. Identifying the extent of the spatial expression of landscape fragmentation based on scale effect analysis in Southwest China. Ecol Indic. 2022;141:109120.10.1016/j.ecolind.2022.109120Search in Google Scholar
[6] Quan Q, Tian GJ. A gradient analysis of spatiotemporal changes of urban landscape pattern in Beijing metropolitan region by GIS. Ecol Sci. 2008;4:254–61.Search in Google Scholar
[7] Yu LS, Fu YF, Yu HY, Li ZQ. Landscape pattern gradient dynamics and Desakota features in rapid urbanization area: A case study in Panyu of Guangzhou. Chin J Appl Ecol. 2011;22:171–80.Search in Google Scholar
[8] Wu JS, Luo KY, Zhao YH. The evolution of urban landscape pattern and its driving forces of Shenzhen from 1996 to 2015. Geogr Res. 2020;39:1725–38.Search in Google Scholar
[9] Xue F, Zhang NC, Xia CY, Zhang J, Wang CY, Li S, et al. Spatial evaluation of urban ecological resilience and analysis of driving forces: A case study of Tongzhou District, Beijing. Acta Ecol Sin. 2023;43(16):6810–23.Search in Google Scholar
[10] Wei L, Zhou L, Sun DQ, Tang XL. The evolution of spatio-temporal pattern and scenario simulation of urban agglomeration expansion in the Yellow River Basin: A case study in the Hohhot-Baotou-Ordos-Yulin Urban Agglomeration. Geogr Res. 2022;41:1610–22.Search in Google Scholar
[11] Seto KC, Fragkias M. Quantifying spatiotemporal patterns of urban land-use change in four cities of China with time series landscape metrics. Landsc Ecol. 2005;20:871–88.10.1007/s10980-005-5238-8Search in Google Scholar
[12] Hu PP, Li F, Hu D, Sun X, Liu YL, Chen XC. Spatial and temporal characteristics of urban expansion in Pearl River Delta urban agglomeration from 1980 to 2015. Acta Ecol Sin. 2021;41:7063–72.Search in Google Scholar
[13] Lei Y, Zhang XB, Luo J, Li YX, Wang ZY, Yao LT, et al. Spatio-temporal evolution of urban landscape pattern in arid areas based on different zones: A case study of Zhangye City. Acta Ecol Sin. 2023;43:2034–48.10.5846/stxb202202210408Search in Google Scholar
[14] Lou N, Wang ZJ, He ST. Assessment on Ecological Risk of Aha Lake National Wetland Park Based on Landscape Pattern. Res Soil Water Conserv. 2020;27:233–9.Search in Google Scholar
[15] Wang H, Liu X, Zhao C, Chang Y, Liu Y, Zang F. Spatial-temporal pattern analysis of landscape ecological risk assessment based on land use/land cover change in Baishuijiang National nature reserve in Gansu Province, China. Ecol Indic. 2021;124:107454.10.1016/j.ecolind.2021.107454Search in Google Scholar
[16] Yu H, Liu XL, Zhao TM, Zhang MY, Nian LL, Li XD. Landscape ecological risk assessment of Qilian Mountain National Park based on landscape pattern. Ecol Sci. 2022;41:99–107.Search in Google Scholar
[17] Gao BB, Wu YM, Chen L, Zheng KJ, Wu Y, Wang MJ, et al. Multi-scenario prediction of landscape ecological risk in the Sichuan-Yunnan ecological barrier based on terrain gradients. Land. 2022;11:2079.10.3390/land11112079Search in Google Scholar
[18] Li X, Yang CX, Xin GX, Yang K, Jiang HY. Landscape Ecological Risk Characteristics of Three Gorges Reservoir Area Based on Terrain Gradient. Res Soil Water Conserv. 2023;30:156–64.Search in Google Scholar
[19] Zhang X, Du H, Wang Y, Chen Y, Ma L, Dong T. Watershed landscape ecological risk assessment and landscape pattern optimization: Take Fujiang River Basin as an example. Hum Ecol Risk Assessment: An Int J. 2021;27:2254–76.10.1080/10807039.2021.1970511Search in Google Scholar
[20] Suo AN, Guan DM, Sun YG, Lin Y, Zhang MH. Advances in coastal landscape ecology and its role in the construction of marine ecological civilization. Acta Ecol Sin. 2016;36:3167–75.Search in Google Scholar
[21] Lin XR, Lv YP, Hong SJ, Wang AL. Research on land and set coupling coordination degree measurement in coastal zone and its optimization strategy: taking the coastal zone of Xiamen as an example. City Plan Rev. 2022;46:54–62.Search in Google Scholar
[22] He Q, Silliman BR. Climate change, human impacts, and coastal ecosystems in the Anthropocene. Curr Biol. 2019;29:R1021–35.10.1016/j.cub.2019.08.042Search in Google Scholar PubMed
[23] Losada IJ, Toimil A, Munoz A, Garcia-Fletcher AP, Diaz-Simal P. A planning strategy for the adaptation of coastal areas to climate change: The Spanish case. Ocean & Coast Manag. 2019;182:104983.10.1016/j.ocecoaman.2019.104983Search in Google Scholar
[24] Zhang X, Song W, Lang Y, Feng X, Yuan Q, Wang J. Land use changes in the coastal zone of China’s Hebei Province and the corresponding impacts on habitat quality. Land Use Policy. 2020;99:104957.10.1016/j.landusepol.2020.104957Search in Google Scholar
[25] Zheng Z, Wu Z, Chen Y, Yang Z, Marinello F. Exploration of eco-environment and urbanization changes in coastal zones: A case study in China over the past 20 years. Ecol Indic. 2020;119:106847.10.1016/j.ecolind.2020.106847Search in Google Scholar
[26] Wang YX, Wang YF, Zhang JW, Wang Q. Land use transition in coastal area and its associated eco-environmental effect: A case study of coastal area in Fujian Province. Acta Scientiae Circumstantiae. 2021;41:3927–37.Search in Google Scholar
[27] Li MN, Yin P, Duan XY, Dong C, Cao K, Yang L, et al. Land use change and ecosystem effect in typical coastal zone of Yangtze River Delta in the last 20 years. Geol China. 2022;49:1114–26.Search in Google Scholar
[28] Liu YB, Li BQ, Wang YY, Chen LL, Li XW, Hou XY. Evaluation of ecological connectivity in the coastal zone of Laizhou Bay-Yellow River Delta based on ecosystem service value. Acta Ecol Sin. 2019;39:7514–24.10.5846/stxb201802060321Search in Google Scholar
[29] Liu Y, Hou X, Li X, Song B, Wang C. Assessing and predicting changes in ecosystem service values based on land use/cover change in the Bohai Rim coastal zone. Ecol Indic. 2020;111:106004.10.1016/j.ecolind.2019.106004Search in Google Scholar
[30] Tong C, Li JL, Ye MY, Tong YQ, Tian P, Wang LJ, et al. The effects of landscape pattern change on ecosystem services value in the coastal zone of the East China Sea. J Zhejiang University(Science Ed). 2020;47:492–506+20.Search in Google Scholar
[31] Li WF, Yu T, Li JL, Chen PC, Chen Y. Suitability evaluation of land use in coastal zones: A case study in southern Hangzhou Bay. Geogr Res. 2015;34:701–10.Search in Google Scholar
[32] Dada OA, Agbaje AO, Adesina RB, Asiwaju-Bello YA. Effect of coastal land use change on coastline dynamics along the Nigerian Transgressive Mahin mud coast. Ocean Coast Manag. 2019;168:251–64.10.1016/j.ocecoaman.2018.11.014Search in Google Scholar
[33] Su L, Fan J, Fu L. Exploration of smart city construction under new urbanization: A case study of Jinzhou-Huludao Coastal Area. Sustain Computing: Inform Syst. 2020;27:100403.10.1016/j.suscom.2020.100403Search in Google Scholar
[34] Wang MM, Zhang HY, Zhang YG, Lin MS, Gong P. Evolution analysis of land use pattern in the Changjiang River Delta coastal zone in recent 39 years. Haiyang Xuebao. 2020;42:142–54.Search in Google Scholar
[35] Hou L, Wu F, Xie X. The spatial characteristics and relationships between landscape pattern and ecosystem service value along an urban-rural gradient in Xi’an city, China. Ecol Indic. 2020;108:105720.10.1016/j.ecolind.2019.105720Search in Google Scholar
[36] Tang HZ, Tang M, Guan MW, Zhang MC, Wang ZT. Diversity analysis of urban and rural land use based on Sentinel-2 remote sensing image: A case study of Zhuozhou City in Hebei Province. J China Agric Univ. 2021;26:157–66.Search in Google Scholar
[37] Cai ZR, Fang CY, He QH, Yan JL, Gao D, Liu ZY. Urban-Rural Gradient Identification and Ecosystem Service Response in Main Urban Area of Nanchang Based on Landscape Clustering. Res Environ Sci. 2022;35:806–17.Search in Google Scholar
[38] Wu L, Hou XY. Analysis of land use change in the coastal zone of Circum the Bohai Sea Region during 2000 to 2010, Mar Sci. 2015;39:101–10.Search in Google Scholar
[39] Huang MY, Yue WZ, Feng SR, Zhang JH. Spatial-temporal evolution of habitat quality and analysis of landscape patterns in Dabie Mountain area of west Anhui province based on InVEST model. Acta Ecol Sin. 2020;40:2895–906.10.5846/stxb201904260858Search in Google Scholar
[40] Xu X, Liu J, Zhang S, Li R, Yan C, Wu S. China’s multi-period land use land cover remote sensing monitoring data set (CNLUCC). Resource and Environment Data Cloud Platform: Beijing, China, 2018.Search in Google Scholar
[41] Han Y, Zhu J, Wei D, Wang F. Spatial-Temporal Effect of Sea–Land Gradient on Land Use Change in Coastal Zone: A Case Study of Dalian City. Land. 2022;11:1302.10.3390/land11081302Search in Google Scholar
[42] Wang XK, Su YB, Ren YF, Zhang HX, Sun X, Ouyang ZY. Urban ecosystem: highly spatial heterogeneity. Acta Ecol Sin. 2020;40:5103–12.Search in Google Scholar
[43] Aurora RM, Furuya K. Urban Sprawl Analysis Using Landscape Metrics in Chiba Prefecture, Japan from 1990-2021. IOP Conference Series: Earth and Environmental Science; 2024: IOP Publishing. p. 012012.10.1088/1755-1315/1384/1/012012Search in Google Scholar
[44] Masoudi M, Richards DR, Tan PY. Assessment of the Influence of Spatial Scale and Type of Land Cover on Urban Landscape Pattern Analysis Using Landscape Metrics. J Geovisualization Spat Anal. 2024;8:8.10.1007/s41651-024-00170-8Search in Google Scholar
[45] Ren W, Zhao J, Ma X. Analysis of spatial differentiation and air quality impact of green space landscape in Xi’an, China. Int J Environ Sci Technol. 2023;20:12449–63.10.1007/s13762-023-04844-6Search in Google Scholar
[46] Su AM, He AX. Analysis of land use based on RS and Geo statistics in Fuzhou City. J Nat Resour 2010;25:91–9.Search in Google Scholar
[47] Chen B, Xu SZ, Zhou YY, Wang CZ, Yang DT. Assessment of Landscape Ecological Risk in Jianghan Plain Area Based on Land Use Change. Res Soil Water Conserv. 2022;29:228–34+43.Search in Google Scholar
[48] Hao J, Tian YN, Ge F, Liu JY. Correlational relationship between land use and landscape ecological risks in Inner Mongolia section of middle Nenjiang River. China Environ Sci. 2023;43:6132–40.Search in Google Scholar
[49] Zhou RJ, Zhang YZ, He HC. Ecological risk assessment based on land use changes in the coastal area in Yancheng city. Geogr Res. 2016;35:1017–28.Search in Google Scholar
[50] Wang S, Liu F, Chen W, Liu Y, Cai W. Landscape ecological risk evaluation and driving factors in the lake basin of central Yunnan Plateau. Chin J Eco Agric. 2024;32:391–404.Search in Google Scholar
[51] Liu CY, Zhang K, Liu JP. A long-term site study for the ecological risk migration of landscapes and its driving forces in the Sanjiang Plain from 1976 to 2013. Acta Ecol Sin. 2018;38:3729–40.10.5846/stxb201707041208Search in Google Scholar
[52] Zhang W, Chang WJ, Zhu ZC, Hui Z. Landscape ecological risk assessment of Chinese coastal cities based on land use change. Appl Geogr. 2020;117:102174.10.1016/j.apgeog.2020.102174Search in Google Scholar
[53] Peng J, Dang WX, Liu YX, Zong ML, Hu XX. Review on landscape ecological risk assessment. Acta Geogr Sin. 2015;70:664–77.Search in Google Scholar
[54] Chen XY, Xie GZ, Zhang JP. Landscape ecological risk assessment of land use changes in the coastal area of Haikou City in the past 30 years. Acta Ecol Sin. 2021;41:975–86.10.5846/stxb201909211974Search in Google Scholar
[55] Liu MZ, Li GX, Xing LY, Sun JX. Analysis of land use change and landscape risk in Laoshan district, Qingdao city. Periodical Ocean Univ China. 2022;52:90–102.Search in Google Scholar
[56] Wang JL. Relation Between the Urbanization and the Land Utilization in Dalian. China Popul Resour Environ. 2009;19:59–63.Search in Google Scholar
[57] Qiao B, Yan YQ, Zhang TH, Li XY, Zhang R, Li XD, et al. Landscape ecological risk identification and optimization strategy in Xining City based on land use change. Chin J Ecol. 2023;42(8):2020–31.Search in Google Scholar
[58] Xing RS, Zhou QG, Li H, Chen Q, Chen D. Analysis on spatiotemporal variations of land use change in Wanzhou district of three gorges reservoir based on the terrain gradient. Res Soil Water Conserv. 2019;26:297–304.Search in Google Scholar
© 2024 the author(s), published by De Gruyter
This work is licensed under the Creative Commons Attribution 4.0 International License.
Articles in the same Issue
- Regular Articles
- Theoretical magnetotelluric response of stratiform earth consisting of alternative homogeneous and transitional layers
- The research of common drought indexes for the application to the drought monitoring in the region of Jin Sha river
- Evolutionary game analysis of government, businesses, and consumers in high-standard farmland low-carbon construction
- On the use of low-frequency passive seismic as a direct hydrocarbon indicator: A case study at Banyubang oil field, Indonesia
- Water transportation planning in connection with extreme weather conditions; case study – Port of Novi Sad, Serbia
- Zircon U–Pb ages of the Paleozoic volcaniclastic strata in the Junggar Basin, NW China
- Monitoring of mangrove forests vegetation based on optical versus microwave data: A case study western coast of Saudi Arabia
- Microfacies analysis of marine shale: A case study of the shales of the Wufeng–Longmaxi formation in the western Chongqing, Sichuan Basin, China
- Multisource remote sensing image fusion processing in plateau seismic region feature information extraction and application analysis – An example of the Menyuan Ms6.9 earthquake on January 8, 2022
- Identification of magnetic mineralogy and paleo-flow direction of the Miocene-quaternary volcanic products in the north of Lake Van, Eastern Turkey
- Impact of fully rotating steel casing bored pile on adjacent tunnels
- Adolescents’ consumption intentions toward leisure tourism in high-risk leisure environments in riverine areas
- Petrogenesis of Jurassic granitic rocks in South China Block: Implications for events related to subduction of Paleo-Pacific plate
- Differences in urban daytime and night block vitality based on mobile phone signaling data: A case study of Kunming’s urban district
- Random forest and artificial neural network-based tsunami forests classification using data fusion of Sentinel-2 and Airbus Vision-1 satellites: A case study of Garhi Chandan, Pakistan
- Integrated geophysical approach for detection and size-geometry characterization of a multiscale karst system in carbonate units, semiarid Brazil
- Spatial and temporal changes in ecosystem services value and analysis of driving factors in the Yangtze River Delta Region
- Deep fault sliding rates for Ka-Ping block of Xinjiang based on repeating earthquakes
- Improved deep learning segmentation of outdoor point clouds with different sampling strategies and using intensities
- Platform margin belt structure and sedimentation characteristics of Changxing Formation reefs on both sides of the Kaijiang-Liangping trough, eastern Sichuan Basin, China
- Enhancing attapulgite and cement-modified loess for effective landfill lining: A study on seepage prevention and Cu/Pb ion adsorption
- Flood risk assessment, a case study in an arid environment of Southeast Morocco
- Lower limits of physical properties and classification evaluation criteria of the tight reservoir in the Ahe Formation in the Dibei Area of the Kuqa depression
- Evaluation of Viaducts’ contribution to road network accessibility in the Yunnan–Guizhou area based on the node deletion method
- Permian tectonic switch of the southern Central Asian Orogenic Belt: Constraints from magmatism in the southern Alxa region, NW China
- Element geochemical differences in lower Cambrian black shales with hydrothermal sedimentation in the Yangtze block, South China
- Three-dimensional finite-memory quasi-Newton inversion of the magnetotelluric based on unstructured grids
- Obliquity-paced summer monsoon from the Shilou red clay section on the eastern Chinese Loess Plateau
- Classification and logging identification of reservoir space near the upper Ordovician pinch-out line in Tahe Oilfield
- Ultra-deep channel sand body target recognition method based on improved deep learning under UAV cluster
- New formula to determine flyrock distance on sedimentary rocks with low strength
- Assessing the ecological security of tourism in Northeast China
- Effective reservoir identification and sweet spot prediction in Chang 8 Member tight oil reservoirs in Huanjiang area, Ordos Basin
- Detecting heterogeneity of spatial accessibility to sports facilities for adolescents at fine scale: A case study in Changsha, China
- Effects of freeze–thaw cycles on soil nutrients by soft rock and sand remodeling
- Vibration prediction with a method based on the absorption property of blast-induced seismic waves: A case study
- A new look at the geodynamic development of the Ediacaran–early Cambrian forearc basalts of the Tannuola-Khamsara Island Arc (Central Asia, Russia): Conclusions from geological, geochemical, and Nd-isotope data
- Spatio-temporal analysis of the driving factors of urban land use expansion in China: A study of the Yangtze River Delta region
- Selection of Euler deconvolution solutions using the enhanced horizontal gradient and stable vertical differentiation
- Phase change of the Ordovician hydrocarbon in the Tarim Basin: A case study from the Halahatang–Shunbei area
- Using interpretative structure model and analytical network process for optimum site selection of airport locations in Delta Egypt
- Geochemistry of magnetite from Fe-skarn deposits along the central Loei Fold Belt, Thailand
- Functional typology of settlements in the Srem region, Serbia
- Hunger Games Search for the elucidation of gravity anomalies with application to geothermal energy investigations and volcanic activity studies
- Addressing incomplete tile phenomena in image tiling: Introducing the grid six-intersection model
- Evaluation and control model for resilience of water resource building system based on fuzzy comprehensive evaluation method and its application
- MIF and AHP methods for delineation of groundwater potential zones using remote sensing and GIS techniques in Tirunelveli, Tenkasi District, India
- New database for the estimation of dynamic coefficient of friction of snow
- Measuring urban growth dynamics: A study in Hue city, Vietnam
- Comparative models of support-vector machine, multilayer perceptron, and decision tree predication approaches for landslide susceptibility analysis
- Experimental study on the influence of clay content on the shear strength of silty soil and mechanism analysis
- Geosite assessment as a contribution to the sustainable development of Babušnica, Serbia
- Using fuzzy analytical hierarchy process for road transportation services management based on remote sensing and GIS technology
- Accumulation mechanism of multi-type unconventional oil and gas reservoirs in Northern China: Taking Hari Sag of the Yin’e Basin as an example
- TOC prediction of source rocks based on the convolutional neural network and logging curves – A case study of Pinghu Formation in Xihu Sag
- A method for fast detection of wind farms from remote sensing images using deep learning and geospatial analysis
- Spatial distribution and driving factors of karst rocky desertification in Southwest China based on GIS and geodetector
- Physicochemical and mineralogical composition studies of clays from Share and Tshonga areas, Northern Bida Basin, Nigeria: Implications for Geophagia
- Geochemical sedimentary records of eutrophication and environmental change in Chaohu Lake, East China
- Research progress of freeze–thaw rock using bibliometric analysis
- Mixed irrigation affects the composition and diversity of the soil bacterial community
- Examining the swelling potential of cohesive soils with high plasticity according to their index properties using GIS
- Geological genesis and identification of high-porosity and low-permeability sandstones in the Cretaceous Bashkirchik Formation, northern Tarim Basin
- Usability of PPGIS tools exemplified by geodiscussion – a tool for public participation in shaping public space
- Efficient development technology of Upper Paleozoic Lower Shihezi tight sandstone gas reservoir in northeastern Ordos Basin
- Assessment of soil resources of agricultural landscapes in Turkestan region of the Republic of Kazakhstan based on agrochemical indexes
- Evaluating the impact of DEM interpolation algorithms on relief index for soil resource management
- Petrogenetic relationship between plutonic and subvolcanic rocks in the Jurassic Shuikoushan complex, South China
- A novel workflow for shale lithology identification – A case study in the Gulong Depression, Songliao Basin, China
- Characteristics and main controlling factors of dolomite reservoirs in Fei-3 Member of Feixianguan Formation of Lower Triassic, Puguang area
- Impact of high-speed railway network on county-level accessibility and economic linkage in Jiangxi Province, China: A spatio-temporal data analysis
- Estimation model of wild fractional vegetation cover based on RGB vegetation index and its application
- Lithofacies, petrography, and geochemistry of the Lamphun oceanic plate stratigraphy: As a record of the subduction history of Paleo-Tethys in Chiang Mai-Chiang Rai Suture Zone of Thailand
- Structural features and tectonic activity of the Weihe Fault, central China
- Application of the wavelet transform and Hilbert–Huang transform in stratigraphic sequence division of Jurassic Shaximiao Formation in Southwest Sichuan Basin
- Structural detachment influences the shale gas preservation in the Wufeng-Longmaxi Formation, Northern Guizhou Province
- Distribution law of Chang 7 Member tight oil in the western Ordos Basin based on geological, logging and numerical simulation techniques
- Evaluation of alteration in the geothermal province west of Cappadocia, Türkiye: Mineralogical, petrographical, geochemical, and remote sensing data
- Numerical modeling of site response at large strains with simplified nonlinear models: Application to Lotung seismic array
- Quantitative characterization of granite failure intensity under dynamic disturbance from energy standpoint
- Characteristics of debris flow dynamics and prediction of the hazardous area in Bangou Village, Yanqing District, Beijing, China
- Rockfall mapping and susceptibility evaluation based on UAV high-resolution imagery and support vector machine method
- Statistical comparison analysis of different real-time kinematic methods for the development of photogrammetric products: CORS-RTK, CORS-RTK + PPK, RTK-DRTK2, and RTK + DRTK2 + GCP
- Hydrogeological mapping of fracture networks using earth observation data to improve rainfall–runoff modeling in arid mountains, Saudi Arabia
- Petrography and geochemistry of pegmatite and leucogranite of Ntega-Marangara area, Burundi, in relation to rare metal mineralisation
- Prediction of formation fracture pressure based on reinforcement learning and XGBoost
- Hazard zonation for potential earthquake-induced landslide in the eastern East Kunlun fault zone
- Monitoring water infiltration in multiple layers of sandstone coal mining model with cracks using ERT
- Study of the patterns of ice lake variation and the factors influencing these changes in the western Nyingchi area
- Productive conservation at the landslide prone area under the threat of rapid land cover changes
- Sedimentary processes and patterns in deposits corresponding to freshwater lake-facies of hyperpycnal flow – An experimental study based on flume depositional simulations
- Study on time-dependent injectability evaluation of mudstone considering the self-healing effect
- Detection of objects with diverse geometric shapes in GPR images using deep-learning methods
- Behavior of trace metals in sedimentary cores from marine and lacustrine environments in Algeria
- Spatiotemporal variation pattern and spatial coupling relationship between NDVI and LST in Mu Us Sandy Land
- Formation mechanism and oil-bearing properties of gravity flow sand body of Chang 63 sub-member of Yanchang Formation in Huaqing area, Ordos Basin
- Diagenesis of marine-continental transitional shale from the Upper Permian Longtan Formation in southern Sichuan Basin, China
- Vertical high-velocity structures and seismic activity in western Shandong Rise, China: Case study inspired by double-difference seismic tomography
- Spatial coupling relationship between metamorphic core complex and gold deposits: Constraints from geophysical electromagnetics
- Disparities in the geospatial allocation of public facilities from the perspective of living circles
- Research on spatial correlation structure of war heritage based on field theory. A case study of Jinzhai County, China
- Formation mechanisms of Qiaoba-Zhongdu Danxia landforms in southwestern Sichuan Province, China
- Magnetic data interpretation: Implication for structure and hydrocarbon potentiality at Delta Wadi Diit, Southeastern Egypt
- Deeply buried clastic rock diagenesis evolution mechanism of Dongdaohaizi sag in the center of Junggar fault basin, Northwest China
- Application of LS-RAPID to simulate the motion of two contrasting landslides triggered by earthquakes
- The new insight of tectonic setting in Sunda–Banda transition zone using tomography seismic. Case study: 7.1 M deep earthquake 29 August 2023
- The critical role of c and φ in ensuring stability: A study on rockfill dams
- Evidence of late quaternary activity of the Weining-Shuicheng Fault in Guizhou, China
- Extreme hydroclimatic events and response of vegetation in the eastern QTP since 10 ka
- Spatial–temporal effect of sea–land gradient on landscape pattern and ecological risk in the coastal zone: A case study of Dalian City
- Study on the influence mechanism of land use on carbon storage under multiple scenarios: A case study of Wenzhou
- A new method for identifying reservoir fluid properties based on well logging data: A case study from PL block of Bohai Bay Basin, North China
- Comparison between thermal models across the Middle Magdalena Valley, Eastern Cordillera, and Eastern Llanos basins in Colombia
- Mineralogical and elemental analysis of Kazakh coals from three mines: Preliminary insights from mode of occurrence to environmental impacts
- Chlorite-induced porosity evolution in multi-source tight sandstone reservoirs: A case study of the Shaximiao Formation in western Sichuan Basin
- Predicting stability factors for rotational failures in earth slopes and embankments using artificial intelligence techniques
- Origin of Late Cretaceous A-type granitoids in South China: Response to the rollback and retreat of the Paleo-Pacific plate
- Modification of dolomitization on reservoir spaces in reef–shoal complex: A case study of Permian Changxing Formation, Sichuan Basin, SW China
- Geological characteristics of the Daduhe gold belt, western Sichuan, China: Implications for exploration
- Rock physics model for deep coal-bed methane reservoir based on equivalent medium theory: A case study of Carboniferous-Permian in Eastern Ordos Basin
- Enhancing the total-field magnetic anomaly using the normalized source strength
- Shear wave velocity profiling of Riyadh City, Saudi Arabia, utilizing the multi-channel analysis of surface waves method
- Effect of coal facies on pore structure heterogeneity of coal measures: Quantitative characterization and comparative study
- Inversion method of organic matter content of different types of soils in black soil area based on hyperspectral indices
- Detection of seepage zones in artificial levees: A case study at the Körös River, Hungary
- Tight sandstone fluid detection technology based on multi-wave seismic data
- Characteristics and control techniques of soft rock tunnel lining cracks in high geo-stress environments: Case study of Wushaoling tunnel group
- Influence of pore structure characteristics on the Permian Shan-1 reservoir in Longdong, Southwest Ordos Basin, China
- Study on sedimentary model of Shanxi Formation – Lower Shihezi Formation in Da 17 well area of Daniudi gas field, Ordos Basin
- Multi-scenario territorial spatial simulation and dynamic changes: A case study of Jilin Province in China from 1985 to 2030
- Review Articles
- Major ascidian species with negative impacts on bivalve aquaculture: Current knowledge and future research aims
- Prediction and assessment of meteorological drought in southwest China using long short-term memory model
- Communication
- Essential questions in earth and geosciences according to large language models
- Erratum
- Erratum to “Random forest and artificial neural network-based tsunami forests classification using data fusion of Sentinel-2 and Airbus Vision-1 satellites: A case study of Garhi Chandan, Pakistan”
- Special Issue: Natural Resources and Environmental Risks: Towards a Sustainable Future - Part I
- Spatial-temporal and trend analysis of traffic accidents in AP Vojvodina (North Serbia)
- Exploring environmental awareness, knowledge, and safety: A comparative study among students in Montenegro and North Macedonia
- Determinants influencing tourists’ willingness to visit Türkiye – Impact of earthquake hazards on Serbian visitors’ preferences
- Application of remote sensing in monitoring land degradation: A case study of Stanari municipality (Bosnia and Herzegovina)
- Optimizing agricultural land use: A GIS-based assessment of suitability in the Sana River Basin, Bosnia and Herzegovina
- Assessing risk-prone areas in the Kratovska Reka catchment (North Macedonia) by integrating advanced geospatial analytics and flash flood potential index
- Analysis of the intensity of erosive processes and state of vegetation cover in the zone of influence of the Kolubara Mining Basin
- GIS-based spatial modeling of landslide susceptibility using BWM-LSI: A case study – city of Smederevo (Serbia)
- Geospatial modeling of wildfire susceptibility on a national scale in Montenegro: A comparative evaluation of F-AHP and FR methodologies
- Geosite assessment as the first step for the development of canyoning activities in North Montenegro
- Urban geoheritage and degradation risk assessment of the Sokograd fortress (Sokobanja, Eastern Serbia)
- Multi-hazard modeling of erosion and landslide susceptibility at the national scale in the example of North Macedonia
- Understanding seismic hazard resilience in Montenegro: A qualitative analysis of community preparedness and response capabilities
- Forest soil CO2 emission in Quercus robur level II monitoring site
- Characterization of glomalin proteins in soil: A potential indicator of erosion intensity
- Power of Terroir: Case study of Grašac at the Fruška Gora wine region (North Serbia)
- Special Issue: Geospatial and Environmental Dynamics - Part I
- Qualitative insights into cultural heritage protection in Serbia: Addressing legal and institutional gaps for disaster risk resilience