Study on the influence mechanism of land use on carbon storage under multiple scenarios: A case study of Wenzhou
-
Wei Quan


Abstract
Based on the perspective of conflict of interest between low-carbon ecology and economic and social development, this study explores the change mechanism of land use cover change (LUCC) and carbon storage (CS) in the context of “Dual-Carbon” goal and territorial spatial ecological governance, which is of great significance to optimize the construction path of “Dual-Carbon” goal and formulate low-carbon, ecological, high-quality, and sustainable economic and social policies in the urban areas. An integrated framework based on the System Dynamics model, the Patch Generation Land Simulation model, and the Integrated Valuation of Ecosystem Services and Trade-offs model was constructed to dynamically simulate the LUCC demand and CS of Wenzhou under four scenarios in 2035, and to analyze the spatial evolution mechanisms of LUCC and CS. The main results of the study show that in the Natural Development Scenario (NDS) and High-speed Urbanization Scenario (HUS), the expansion mechanism is similar, and the area of woodland decreases greatly, which is mainly caused by the rapid expansion of construction land and cultivated land. Under Low-carbon and High-quality Development Scenario (LHDS) and Ecological Safety Governance Scenario (ESGS), woodland and grassland increased significantly, mainly because low-carbon and ecological governance policies strengthened ecological land protection and limited construction land control. By 2035, the prediction results show that LHDS has the highest CS (2.231 × 10⁵ kt), followed by ESGS (2.226 × 10⁵ kt), NDS (2.191 × 10⁵ kt), and HUS (2.142 × 10⁵ kt). The range of increase and decrease was 0.189, −0.149, −1.676, −3.692%, and only in LHDS, CS increased by 42.05 kt. Therefore, in order to achieve the “Dual-Carbon” goal, Wenzhou needs to prioritize the combination of LHDS and ESGS to formulate relevant policies.
1 Introduction
Terrestrial ecosystem carbon storage (CS) is an important factor for climate regulation and ecological environment improvement [1,2], and climate change due to land use cover change (LUCC) induced by human activities directly affects ecosystem CS [3]. The conflict between economic and social development and low carbon ecology is becoming more and more serious, in order to alleviate the contradiction between coordinating economic development, LUCC, ecosystem functioning, and CS, carbon emissions in terms of LUCC and CS have received great attention in the research fields of global climate change and ecosystem functioning preservation [4,5].
CO2 accounts for about 80% of China’s total greenhouse gas emissions over the period 2005–2020, mainly from the consumption of energy such as coal, crude oil, and natural gas, and emissions from industrial processes as a result of economic development and urban expansion [6]. Achieving net-zero CO2 emissions is critical for achieving “carbon neutrality” in the broadest sense [7], and China as one of the world’s largest sources of carbon emissions, has the potential to become a carbon neutral country. China is one of the world’s largest sources of carbon emissions [8,9]. In the past few years, the government has put forward the goal of achieving “carbon peak” by 2030 and “carbon neutrality” by 2060. At the same time, a nationwide ecological governance of national land space will be carried out to optimize the ecological environment and land use structure, adjust the economic development mode and energy consumption structure, reduce carbon emissions, and increase ecological CS, so as to accelerate the realization of the goal of “dual-carbon” and the optimization of territorial spatial ecological governance [10]. Quantitative assessment of future changes in sustainability can help policy makers make more scientific decisions on economic development strategies [11]. Therefore, it is extremely important to clarify the trend of LUCC and CS dynamics in the future under the constraints of multi-policy factors such as “dual-carbon” and territorial spatial ecological governance.
Due to the different development conflicts faced at different stages, the absolute and relative conflicts between LUCC and economic development will also change, and the coordination of economic and social development and low-carbon ecological conflicts is extremely important. Previous studies have shown that LUCC changes are greatly influenced by natural climate change and economic and social development [12,13]. At the same time, LUCC change is the most important factor affecting CS change in terrestrial ecosystems [14]. The study of dynamic change of LUCC is the basis of CS assessment, and it is usually necessary to consider LUCC and transfer management methods under different economic and social development contexts [15]. Predicting and optimizing the spatial pattern of LUCC to improve the regional CS is the main method to improve the CS. Models based on the dynamic simulation of LUCC under multiple scenarios include conversion of land use and its effects at small regional extent (CLUE-S) model [16], ANN-CA [17], future land use simulation (FLUS) model [18], Patch Generation Land Simulation (PLUS) model [19], Markov model [20], and logistic cellular automaton models [21]. In order to more deeply couple the economic and social subsystems, natural resources subsystems, and LUCC subsystems, and to develop multi-scenario simulation from the perspective of the conflict between economic and social development and low-carbon ecology, the system dynamics (SD) model is introduced into the LUCC prediction model, which is a kind of improved top-down model that can better reflect the nonlinear, dynamic, and systematic characteristics of the LUCC process, and is more effective in simulating LUCC under multi-scenario and superiority in simulating LUCC demand changes under multiple scenarios [22,23]. However, it is difficult to simulate the spatial structure of land [24]. Therefore, the combination of SD model with CLUE-S, artificial neural network cellular automata (ANN-CA), FLUS, PLUS, and other models can more accurately simulate the spatial changes in LUCC. However, the CLUE-S, FLUS, ANN-CA, and other models have the following shortcomings compared with the PLUS model. First, CLUE-S and ANN-CA simulation quantities are smaller, which makes it difficult to perform multi-scenario simulations; second, FLUS is limited in the number of driving factors that can be incorporated into the simulation compared to PLUS; third, the simulation accuracy is poorer at the same image metric scale; and fourth, the CA models, such as CLUE-S and ANN-CA, lack the introduction of policy factors associated with planned development zones, which makes them unsuitable for multi-scenario LUCC and CS prediction [25]. Compared with previous CA models, the PLUS model combines the CA model with the patch generation simulation strategy, utilizes the advantages of other CA models [15], enhances the ability to simulate the real landscape pattern, retains the advantages of adaptive inertial competition and roulette wheel competition mechanism [26], and determines the development potential of each LUCC type through the Random Forest algorithm [27], and the simulation results are closer to the landscape pattern indicators of the real landscape, and is more suitable for future multi-scenario CS prediction. The simulation results are closer to the landscape pattern indicators of real landscapes, and can more accurately simulate the dynamic spatial changes of LUCCs, which is more suitable for future multi-scenario CS prediction. At the same time, in order to avoid the problem that it is difficult to carry out multi-scenario prediction with a single model of PLUS, the SD model is coupled, and the dynamic prediction and policy impact control advantages of the SD model are utilized to carry out the refined simulation of land use demand under multi-scenarios.
Field surveys [28], sample inventories [29], and ecosystem CS monitoring [30] are used to assess CS. Although traditional methods are accurate, they are difficult to measure large-scale and long time-series areas [31], and are difficult to be widely applied because of the large workload and low efficiency. With technological advances and the need for large-scale research, CS assessment models such as bookkeeping models [32,33], remote sensing models [34], CASA models [35], and ecosystem service evaluation and trade-off (InVEST) [36,37] models have been developed. Among the above models, the InVEST model has been widely used by researchers in the field of ecological CS research [38,39]. Compared with the above CS models, InVEST requires fewer types of data, is easy to obtain and operate, has fast computation and high accuracy in quantitative assessment, is capable of spatial and temporal visualization, and is more suitable for spatial analysis of CS triggered by changes in LUCC [40]. However, CS within the same LUCC type will show different attribute characteristics and spatial-temporal characteristics due to changes in the natural and economic and social environments [39], and their spatial compositions and the historical changes in LUCC [41,42] will be significantly different, and the conflict between LUCC and CS and economic and social development will arise. LUCC conflict is the external manifestation of the competition for spatial resources [43]. Conflicts arise when various types of LUCC demands overlap spatially, or when LUCC stakeholders have incompatible interests with certain land types [44]. Uncontrolled LUCC can seriously affect ecological space and agricultural space [45]. Changes in LUCC conflicts based on specific social environments or institutional conditions have been of interest [46], but most of the existing studies have focused only on absolute LUCC conflicts [47] and have not explored the impacts of LUCC conflicts on spatial changes in CS under different development scenarios. LUCC types of CS also change over time in response to environmental changes [48,49]. In previous studies of LUCC and CS forecasting, researchers have focused more on optimizing LUCC and CS forecasting models, as well as exploring the impacts of LUCC on CS in different geographic spaces and under different scenarios. However, in the direction of absolute and relative LUCC conflicts, no in-depth research has been conducted on CS changes under the perspective of LUCC conflicts. Meanwhile, the mutual influence of LUCC and CS spatial mechanism changes has not been systematically analyzed.
In summary, there are still gaps in research on CS assessment and spatial mechanisms under the LUCC conflict perspective. In addition, there is a lack of research on LUCC and CS in the context of the “Dual-Carbon” goal and territorial spatial ecological governance. Therefore, based on this background, this study starts from the perspective of absolute and relative conflict of LUCC in low-carbon ecology and economic and social development. Natural Development Scenario (NDS), High-speed Urbanization Scenario (HUS), Low-carbon and High-quality Development Scenario (LHDS) and Ecological Safety Governance Scenario (ESGS) are set. Coupled with the SD-PLUS-InVEST model, the dynamic changes and development mechanisms of LUCC and CS under the four scenarios in Wenzhou City in 2035 are investigated, and the spatial changes in CS are characterized by absolute and relative conflicts under the background of the “Dual-Carbon” goal and the territorial spatial ecological governance. This will help to harmonize the conflicts between the “Dual-Carbon” goal, territorial spatial ecological governance, and economic and social development, and provide new ideas for the formulation of low-carbon, ecological, high-quality, and sustainable economic and social development policies.
2 Materials and methods
2.1 Study area
Wenzhou City is located in the southern part of Zhejiang Province, China, with a total area of 12,103 km2, the terrain is dominated by mountains and hills, and belongs to the subtropical monsoon climate zone. It is rich in forest resources, totaling 7,075 km2, with a per capita of 735 m2, which is among the highest in the country (Figure 1). By the end of 2020, the household population is 8,287,000, and the resident population is 9,250,000, with the third highest gross domestic product (GDP) in Zhejiang Province. With the long-term high rate of economic growth, the ecological footprint per capita has risen year by year and the ecological deficit is serious, reaching a maximum of 1.68 ha per capita, resulting in enormous pressure on land from the consumption of natural resources and the depletion of a large stock of natural resources to support current development and consumption [50]. In the “13th Five-Year Plan” of Wenzhou City to control greenhouse gas emissions implementation program, it is proposed to achieve “carbon peak” in 2030. In addition, Wenzhou, as a national low-carbon pilot city, responds to the ecological governance of land space under the goal of “Dual-Carbon” [51,52]. It is actively exploring the requirements of adaptive transformation to create a low-carbon, ecological, high-quality sustainable development path with the characteristics of Wenzhou City [53,54].

Geographic location of Wenzhou City.
2.2 Research framework
The research framework of this study is as follows (Figure 2):
Data collection: Economic and social data, natural resource data, and LUCC data were collected in the study area.
Scenario setting: Four scenarios were constructed based on the background of the “Dual-Carbon” goal and territorial spatial ecological governance, as well as the absolute and relative conflicts between economic and social development and ecological and low-carbon perspectives.
LUCC demand forecast: Based on the four scenarios, the SD model is applied to forecast the LUCC demand in 2035.
LUCC simulation: Based on the results of LUCC prediction by the SD model, the PLUS model is used to simulate LUCC in 2035.
CS measurement: The InVEST model is used, combined with the PLUS simulation results, to forecast the CS under the four scenarios in 2035.
Analysis of results: The results are analyzed to resolve the dynamic changes and spatial mechanisms of LUCC and CS in the future.

Research framework.
2.3 Data sources and processing
2.3.1 Data sources
The basic data required for the SD model were obtained from the statistical yearbooks of Zhejiang Province and Wenzhou City. The data required for the PLUS model, the LUCC data, were the 30 m accuracy remote sensing data published by Wuhan University. The 30 m accuracy data provide detailed LUCC information with high accuracy, which can ensure the detailed capture of the complexity of LUCC changes and better reflect the spatial heterogeneity of land use, and also solve the problem of excessive data computation, which is suitable for the prediction of land use and CS [55,56].The prediction drivers included 8 environmental factors and 13 economic and social factors, and the limiting factors were the open water and ecological function protection areas (Table 1), and the above factors are the main reasons influencing the LUCC changes. Meteorological data were obtained from the National Meteorological Science Data Center (http://data.cma.cn/), and the rest of the data were obtained from the Resource and Environmental Science and Data Center of the Chinese Academy of Sciences (www.resdc.cn) and Geospatial Data Cloud (www.gscloud.cn) (Table 1).
LUCC driving factor data
| Data type | Data name | Year | Precision/m | Data source |
|---|---|---|---|---|
| LUCC data | LUCC | 2005 and 2020 | 30 | (https://www.resdc.cn/) |
| Natural environment data | Elevation | 2020 | 30 | (http://soil.geodata.cn/) |
| Slope | 2020 | 30 | (http://data.cma.cn/) | |
| Average annual temperature | 2005–2020 | 30 | (http://data.cma.cn/) | |
| Average annual precipitation | 2005–2020 | 30 | (https://www.gscloud.cn) | |
| Soil type | 2020 | 30 | Spatial processing | |
| Average humidness | 2021 | 500 | (https://www.resdc.cn/) | |
| Socio-economic data | NDVI | 2020 | 1,000 | (https://www.resdc.cn/) |
| Distance to river | 2020 | 1,000 | Spatial processing | |
| Distance to railway | 2020 | 30 | Spatial processing | |
| Distance to high ways | 2020 | 30 | Spatial processing | |
| Distance to provincial road | 2020 | 30 | Spatial processing | |
| Distance to express road | 2020 | 30 | Spatial processing | |
| Distance to main road | 2020 | 30 | Spatial processing | |
| Distance to secondary main road | 2020 | 30 | Spatial processing | |
| Distance to city branch | 2020 | 30 | Spatial processing | |
| GDP | 2020 | 30 | (https://www.resdc.cn/) | |
| Nighttime lighting index | 2020 | 1,000 | (https://www.resdc.cn/) | |
| Population density | 2020 | 1,000 | (https://www.resdc.cn/) | |
| Distance to dwelling place | 2020 | 30 | Spatial processing | |
| Distance to public service facilities | 2020 | 30 | Spatial processing | |
| Limiting factor | Water | 2020 | 30 | (https://www.gscloud.cn) |
| Ecological protection area | 2020 | 1,000 | (https://www.gscloud.cn) |
2.3.2 Data processing
The data processing flow is as follows:
The raw vector data of LUCC were extracted and cropped by mask by ArcGIS 10.8 software, and then classified into six land use types, namely, cultivated land, woodland, grassland, water, construction land, and unused land by applying the reclassification tool.
The digital elevation model data were processed by ArcGIS 10.8 software to obtain slope and direction data.
Distances to waters, public service points, and roads were calculated using Euclidean distances in ArcGIS 10.8 software.
Combined with the meteorological station data and statistics of Wenzhou’s average annual temperature and average annual precipitation from 2005 to 2020, the raster data of Wenzhou at 30 km resolution were generated by spatial interpolation with ArcGIS10.8 software.
The raster data of NDVI, GDP, population, night lights, and limiting factors were all processed by ArcGIS10.8 software, and after the unified coordinate system (CGCS2000_3_Degree_GK_CM_108E) was carried out, the raster data were processed by resampling and cropping. At the same time, it was ensured that the number of rows and columns of the 2005 and 2020 LUCC data was the same, and the projected coordinates of all raster data were identical.
The SD model uses the underlying statistical yearbook data, which was standardized mainly through SPSS.26 Descriptive Statistics.
2.4 Methods
2.4.1 Scenarios of future
Based on China’s “Dual-Carbon” goal and the goal of territorial spatial ecological governance, Wenzhou City serves as a pioneer area for low-carbon ecology, high-quality development, and ecological security governance of territorial space. We assume that Wenzhou will follow the path of low-carbon, ecological and high-quality sustainable development in the future. At the same time, the impacts of relative and absolute conflicts between future economic and social development and ecological low-carbon on LUCC and CS were considered. Four scenarios are set up:
CS under the NDS: According to the development trend of Wenzhou City from 2005 to 2020, it is sufficient to set up a natural development scenario and make basic restrictions on the transfer of land, without considering the restrictions on the change in LUCC by external policies.
HUS: Under the high speed of urban development, the high economic growth has led to extreme encroachment of urban construction land and extremely high occupancy of other land [57]. LUCC changes in the urbanization process are mainly reflected in a 40% increase in the probability of transferring cultivated land, woodland, grassland, and water to construction land, and a 100% increase in the probability of transferring unused land to construction land. This shift not only increases the area of construction land in cities, but also reflects the high intensity demand for land resources in cities [58]. Therefore, the probability of shifting cultivated land, woodland, grassland, water, and unused land to construction land is higher in this scenario.
LHDS: Construction land is the main factor leading to high carbon emissions [59]. In order to improve the low-carbon and ecological nature of economic development, alleviate the absolute conflict between economic development and ecological low-carbon, Wenzhou needs to take the sustainable development of the green low-carbon circular economy model to improve the CS comprehensively. Therefore, the transfer of woodland and grassland to construction land should be restricted. At the same time, the unused land should be transferred to land categories with higher CS such as woodland, grassland, and cultivated land [60].
ESGS: In order to ensure urban ecological quality and ecological security, human interference in ecologically sensitive areas, ecologically fragile areas, and prohibited development zones should be minimized to create conditions for ecological governance and protection of national land space [61]. In this scenario, only land categories with low CS are allowed to be converted to land categories with high CS, and the occupation of construction land and cultivated land to forest land is restricted, and the protection of land categories with high CS, such as woodland, water, and grassland, is strengthened [62]. The LUCC prediction transfer parameters for the above four scenarios are given in Table 2.
Transfer cost matrix of each land use type under different development scenarios
| LUCC | NDS | HUS | LHDS | ESGS | ||||||||||||||||||||
|---|---|---|---|---|---|---|---|---|---|---|---|---|---|---|---|---|---|---|---|---|---|---|---|---|
| C | F | G | W | B | I | C | F | G | W | B | I | C | F | G | W | B | I | C | F | G | W | B | I | |
| C | 1 | 1 | 1 | 1 | 1 | 1 | 1 | 1 | 1 | 1 | 1 | 1 | 1 | 1 | 1 | 1 | 1 | 0 | 1 | 0 | 0 | 0 | 1 | 1 |
| F | 1 | 1 | 1 | 1 | 1 | 1 | 1 | 1 | 1 | 1 | 1 | 1 | 0 | 1 | 0 | 0 | 0 | 0 | 0 | 1 | 0 | 0 | 0 | 0 |
| G | 1 | 1 | 1 | 1 | 1 | 1 | 1 | 1 | 1 | 1 | 1 | 1 | 0 | 1 | 1 | 0 | 1 | 0 | 0 | 0 | 1 | 0 | 0 | 0 |
| W | 0 | 0 | 0 | 1 | 0 | 0 | 1 | 1 | 1 | 1 | 1 | 1 | 0 | 1 | 1 | 1 | 1 | 0 | 0 | 0 | 0 | 1 | 0 | 0 |
| B | 1 | 1 | 1 | 1 | 1 | 1 | 1 | 1 | 1 | 1 | 1 | 1 | 1 | 1 | 1 | 1 | 1 | 1 | 1 | 0 | 0 | 0 | 1 | 1 |
| I | 0 | 0 | 0 | 0 | 0 | 1 | 0 | 0 | 0 | 0 | 0 | 1 | 1 | 1 | 1 | 0 | 0 | 1 | 1 | 0 | 0 | 0 | 1 | 1 |
Note: C: cultivated land, F: woodland, G: (grassland, W: water, B: (unused land): I (construction land).
2.4.2 SD models
System dynamics treat complex systems as systems with multiple information causal feedback mechanisms, which is able to deal with nonlinear and time-varying problems and perform quantitative simulations [63]. Meanwhile, the SD model can reveal the complex relationship among LUCC, economic development, and ecological protection. And by simulating different development modes, it can effectively assess which development mode is most conducive to the long-term sustainability of the city [64,65]. Therefore, the SD model has been widely used in the simulation of urban composite systems and LUCC changes [66].
This study constructs a base model based on the linear regression relationship between the economic and social subsystem, the natural resource subsystem and the LUCC subsystem (Figure 3). The economic and social subsystem has the greatest impact on LUCC, and economic and social development leads to an increase in investment in all types of social fixed assets and materials for survival, accelerating the expansion of cultivated land and construction land, and increasing the cost of ecological and environmental management. The population subsystem reflects the changes in urban and rural population, and the increase in population and GDP growth inevitably leads to a further increase in construction land, thus indirectly affecting the spatial pattern and occupancy of LUCC. The natural resources subsystem mainly affects the water use and temperature of cultivated land, woodland, grassland, and water. The LUCC subsystem reflects the spatial pattern and transfer of LUCC under different development scenarios.

System dynamics model.
Based on the LUCC data, economic and social data, and natural resource data of Wenzhou City from 2005 to 2020, the interactions between the subsystems and variables were simulated. After several calibrations, the parameters between the variables were determined and the model was constructed (Figure 3). The simulation period of the SD model is 2005–2035 with a time step of 1 year. The historical simulation phase is 2005–2020, and the real data in 2020 is used to evaluate the accuracy of the simulation model. The scenarios are simulated with a base year of 2020, and the parameters and policy constraints of different scenarios are input to simulate the four scenarios of LUCC demand in Wenzhou City in 2035.
2.4.3 PLUS models and model validation
The PLUS model is a patch-generated LUCC change simulation model, which contains two modules, the Land Expansion Analysis Strategy (LEAS) model and the multi-type stochastic seed-based (CARS) [15,26]. In this study, we extracted the land expansion data of Wenzhou City from 2005 to 2020 using the LEAS module, and analyzed the impact of drivers on land expansion through the Random Forest algorithm to identify and quantify the key drivers affecting the change in LUCC. The CARS module utilizes the analysis results of the LEAS module to further simulate the LUCC. Parameters such as domain weights are to be set in this module, and domain weights are set according to the proportion of the expansion area of different land types of the total area. The parameters are as follows: (1) LEAS: the value of the decision tree is 20, the sampling rate is 0.01, the mTny is 14, and the number of parallel threads is set to 1. (2) CARS: the neighborhood range is set to 3, the Thread is 6, the diminishing threshold coefficient is 0.5, the diffusion coefficient is 0.1, and the seed probability of the random patches is 0.0001.
Based on the 2005 and 2020 LUCC data (Figure 4), 23 impact factors were selected (Figure 5), including elevation, slope, mean annual temperature, mean annual precipitation, land type, mean annual humidity, NDVI, distance to off-river rivers, distance to important transportation routes, GDP, nighttime lighting, population density, distance to settlements, distance to points of public services, distance to governmental sites, and Ecological Reserve data. Among them, surface waters and ecological protection zones are the limiting factors. Surface waters are mainly composed of rivers, lakes, and coastal waters, which block the expansion and encroachment of urban land use with their natural barrier characteristics, while ecological protection zones are composed of river origins, water conservation areas and animal and plant protection zones, which limit the expansion of the city as an important ecological protection site. Using LUCC data in 2005 as a simulation reference map, the PLUS model was run to obtain the LUCC simulation results in 2020. The accuracy of the PLUS model was evaluated by comparing the simulation results with the real LUCC data in 2020. If the accuracy of the results is high, the LUCC demand data predicted by the SD model for the four scenarios in Wenzhou City in 2035 are input into the PLUS model. Based on the LUCC data in 2020, the changes in the spatial and temporal pattern of LUCC in Wenzhou City in 2035 were simulated.

LUCC in (a) 2005 and (b) 2020.
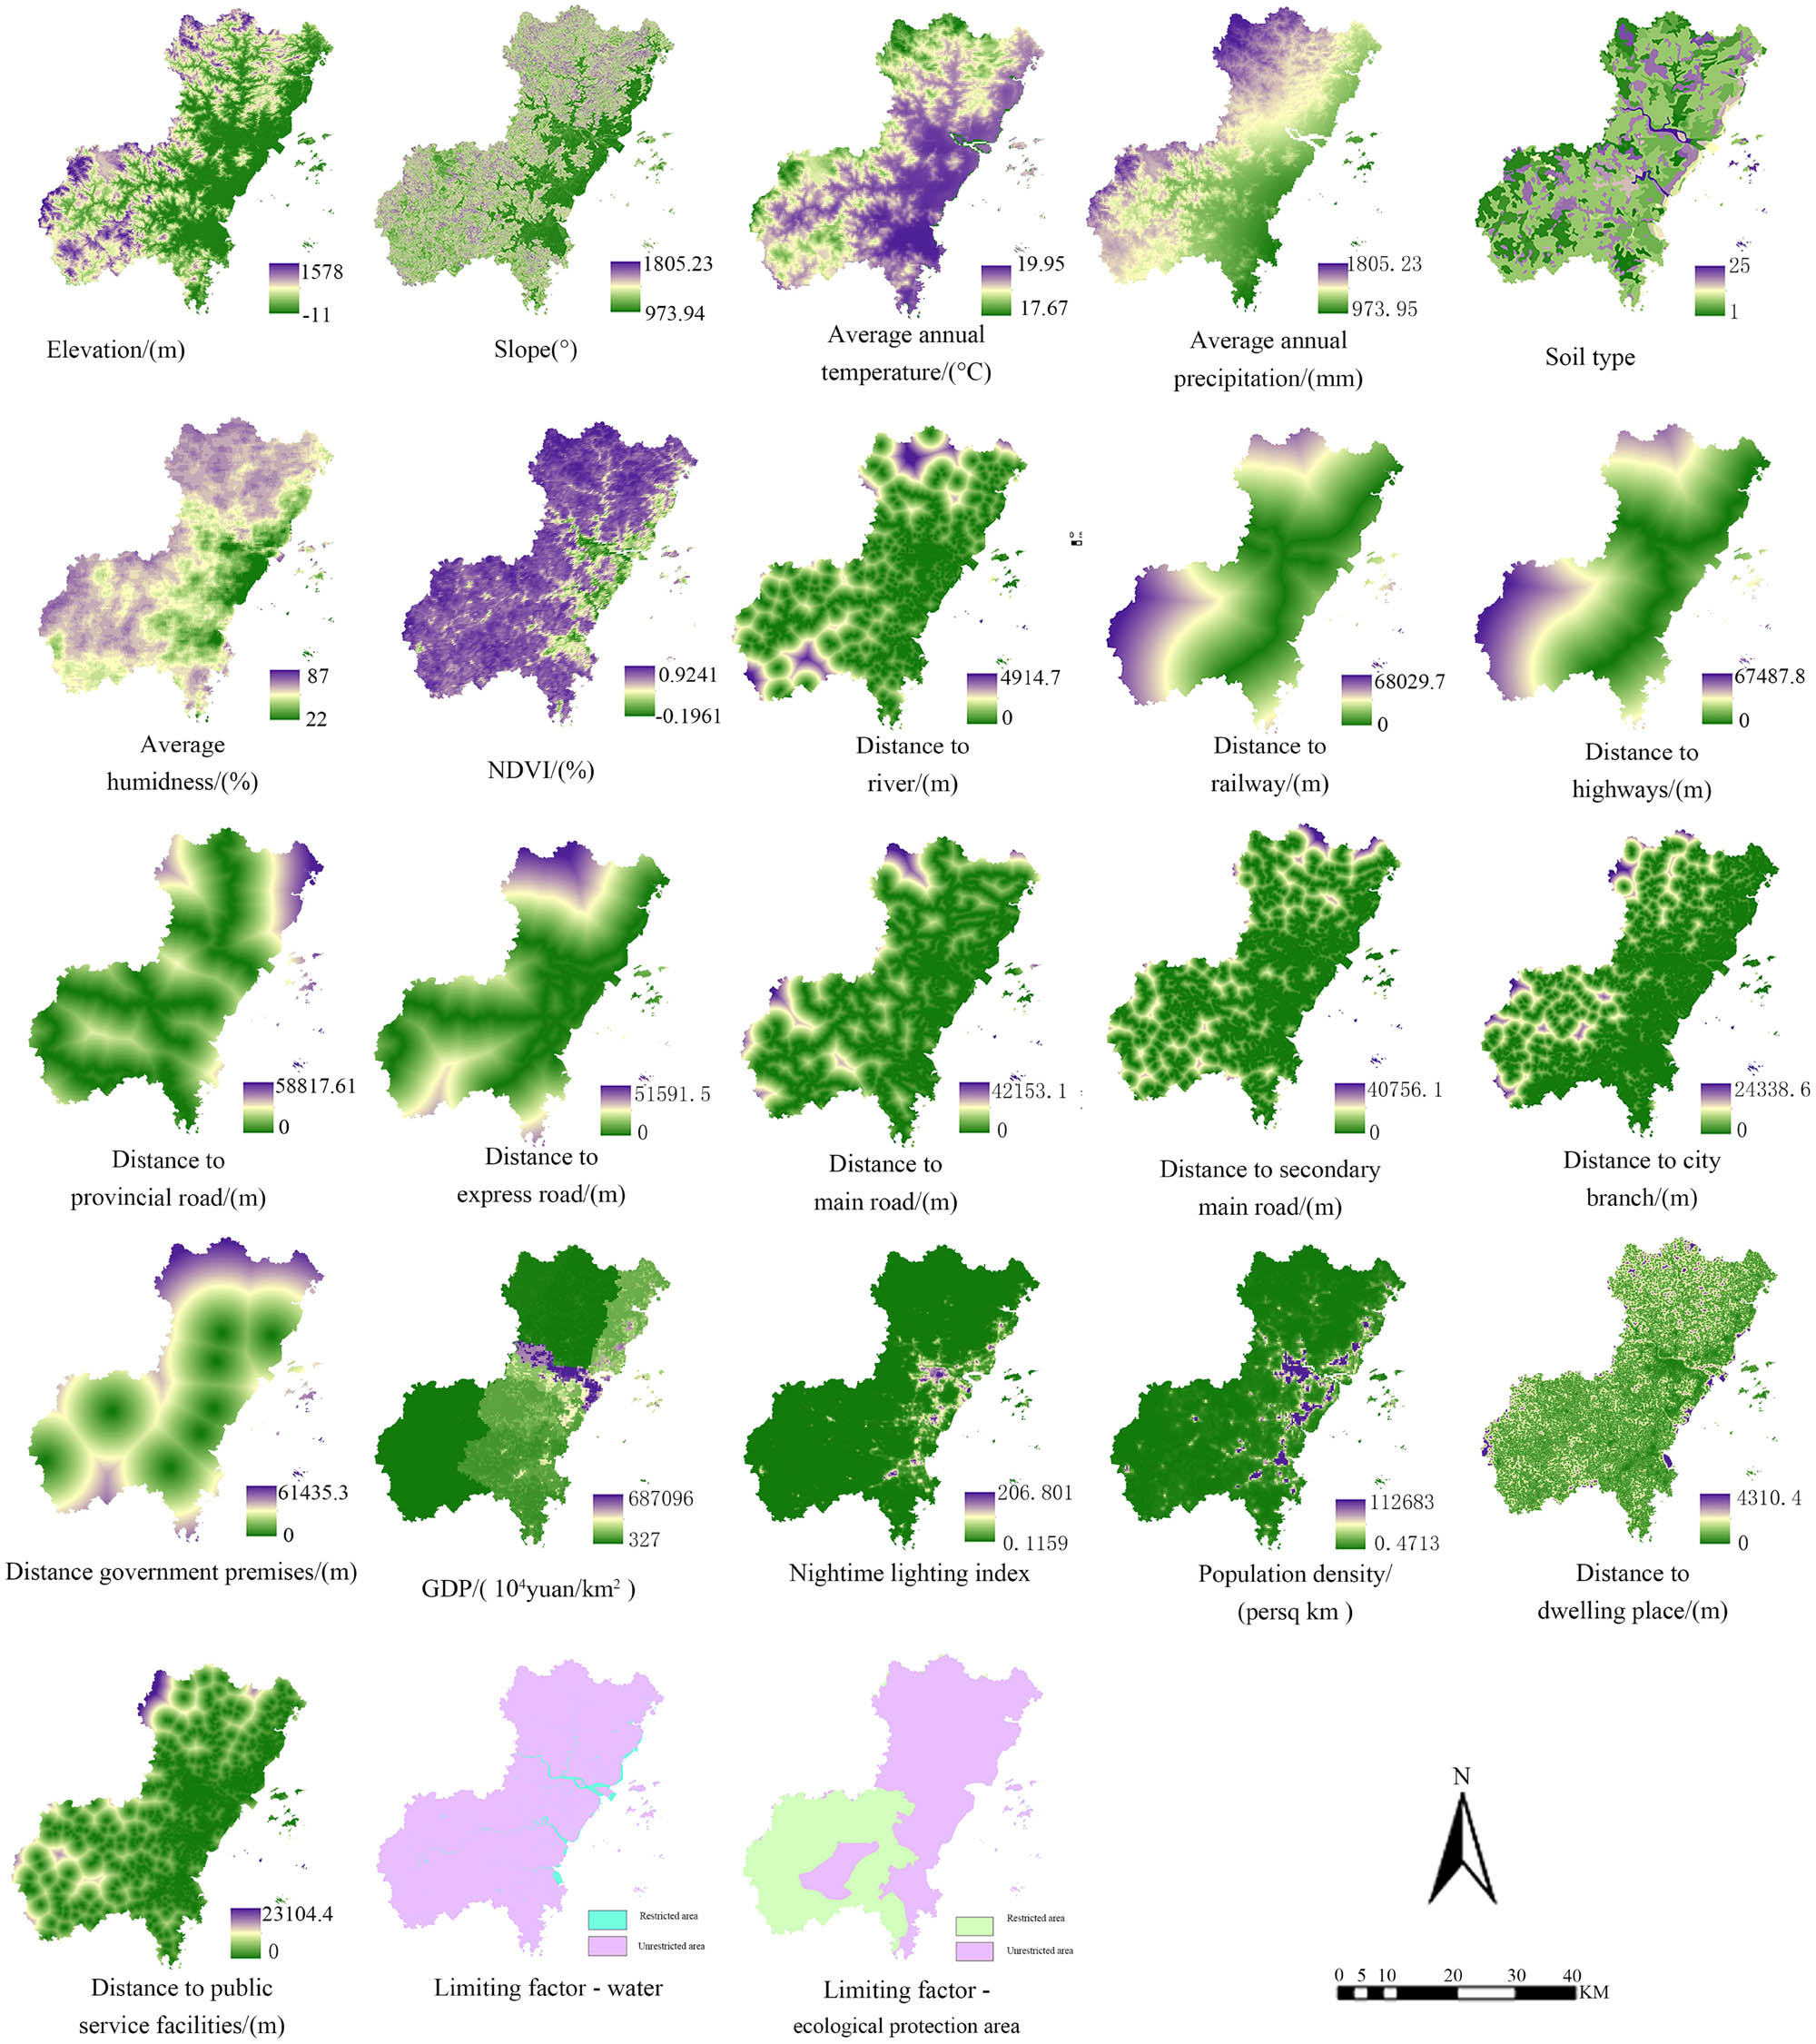
Driver and limiting factors.
2.4.4 InVEST models
In this study, the CS module of the InVEST model was utilized to assess the CS of terrestrial ecosystems in Wenzhou City in 2035, based on LUCC data and carbon density data. Among them, the carbon module divides the ecosystem CS into four basic carbon pools: above-ground biogenic carbon, below-ground biogenic carbon, soil carbon, and dead organic carbon [67]. The calculation formula is as follows:
where i is the number of LUCC types;
Carbon density is an important input parameter for the accurate assessment of CS by the InVEST model, which varies in different climatic zones [68]. In this study, the carbon density was corrected with reference to the carbon density of Jiangsu and Zhejiang regions and the data from previous carbon density studies [69,70]. The carbon density of dead organic matter for each LUCC type was estimated by referring to the IPCC 2006 national greenhouse gas emission inventory [71]. In this study, the carbon density correction method proposed by Alam et al. [72] and Shui et al. [73] was used for the correction, and the correction formula was as follows:
where
Carbon density value of each land use type in the study area (kt)
| Land use type | Carbon above | Carbon below | Carbon soil | Carbon dead |
|---|---|---|---|---|
| Cultivated land | 5.961 | 1.274 | 96.635 | 0.000 |
| Woodland | 68.781 | 21.734 | 132.572 | 8.131 |
| Grassland | 2.635 | 10.043 | 103.01 | 0.879 |
| Water | 0.685 | 0.000 | 83.962 | 0.000 |
| Unused land | 0.113 | 0.000 | 75.431 | 0.000 |
| Construction land | 0.113 | 0.000 | 77.631 | 0.000 |
3 Results
3.1 Change analysis of LUCC and CS from 2005 to 2020
3.1.1 Characterization and spatial mechanisms of LUCC from 2005 to 2020
From 2005 to 2020, the areas of woodland, grassland, and water in Wenzhou City decreased by 407.55, 2.02, and 55.66 km2, respectively (Table 4). And the percentage also showed a decreasing trend, with woodland decreasing from 75.61 to 72.06%, grassland decreasing from 0.03 to 0.01%, and water decreasing from 2.28 to 1.79%. Among all LUCC types, Woodland had the largest decrease in area and constructed land had the largest increase in area. Cultivated land, unused land, and constructed land increased by 169.78, 0.065, and 295.38 km2, respectively, all of which showed an upward trend, with cultivated land increasing from 17.39 to 18.87% and constructed land increasing from 4.69 to 7.27%. The land that has not been transformed accounts for 91.6% of the total land, the amount of shifting of cultivated land accounts for 4.6%, the amount of shifting of construction land accounts for 2.7%, the amount of shifting of woodland accounts for 1%, and the amount of shifting of the rest of the types of land is small accounting for about 0.01% (Table 4 and Figure 6). The results of the analysis are as follows: (1) Compared with the west, the terrain of the east coast is flat, with good conditions for cultivation and construction, and the expansion of cultivated land and construction land is more obvious. (2) The high speed of economic development and the rapid growth of urban and rural populations have increased the demand for food, leading to the occupation of large areas of ecological land (woodland, grassland, and water) in the west and north by cultivated land and construction land. (3) The rise of a large number of private enterprises in townships and counties has led to the rapid economic and social development of townships and increased demand for construction land, accelerating the expansion of construction land in the ecological area in the western and northern regions in the form of a point distribution (Figure 6).
LUCC conversion in Wenzhou from 2005 to 2020 (km2)
| 2005 | 2020 | Roll-out total | |||||
|---|---|---|---|---|---|---|---|
| Cultivated land | Woodland | Grassland | Water | Unused land | Construction land | ||
| Cultivated land | 1602.88 | 474.42 | 0.97 | 48.70 | 0.01 | 2.11 | 2129.08 |
| Woodland | 114.75 | 8161.30 | 0.79 | 0.53 | 0.00 | 0.02 | 8277.38 |
| Grassland | 0.19 | 0.24 | 0.85 | 0.01 | 0.01 | 0.00 | 1.28 |
| Water | 8.65 | 0.22 | 0.04 | 278.43 | 0.00 | 4.91 | 292.24 |
| Unused land | 0.03 | 0.01 | 0.09 | 0.098 | 0.02 | 0.00 | 0.23 |
| Construction land | 250.43 | 19.98 | 0.55 | 37.88 | 0.10 | 527.90 | 836.83 |
| Carry-over total | 1976.93 | 8656.15 | 3.27 | 365.63 | 0.12 | 534.94 | 11537.03 |
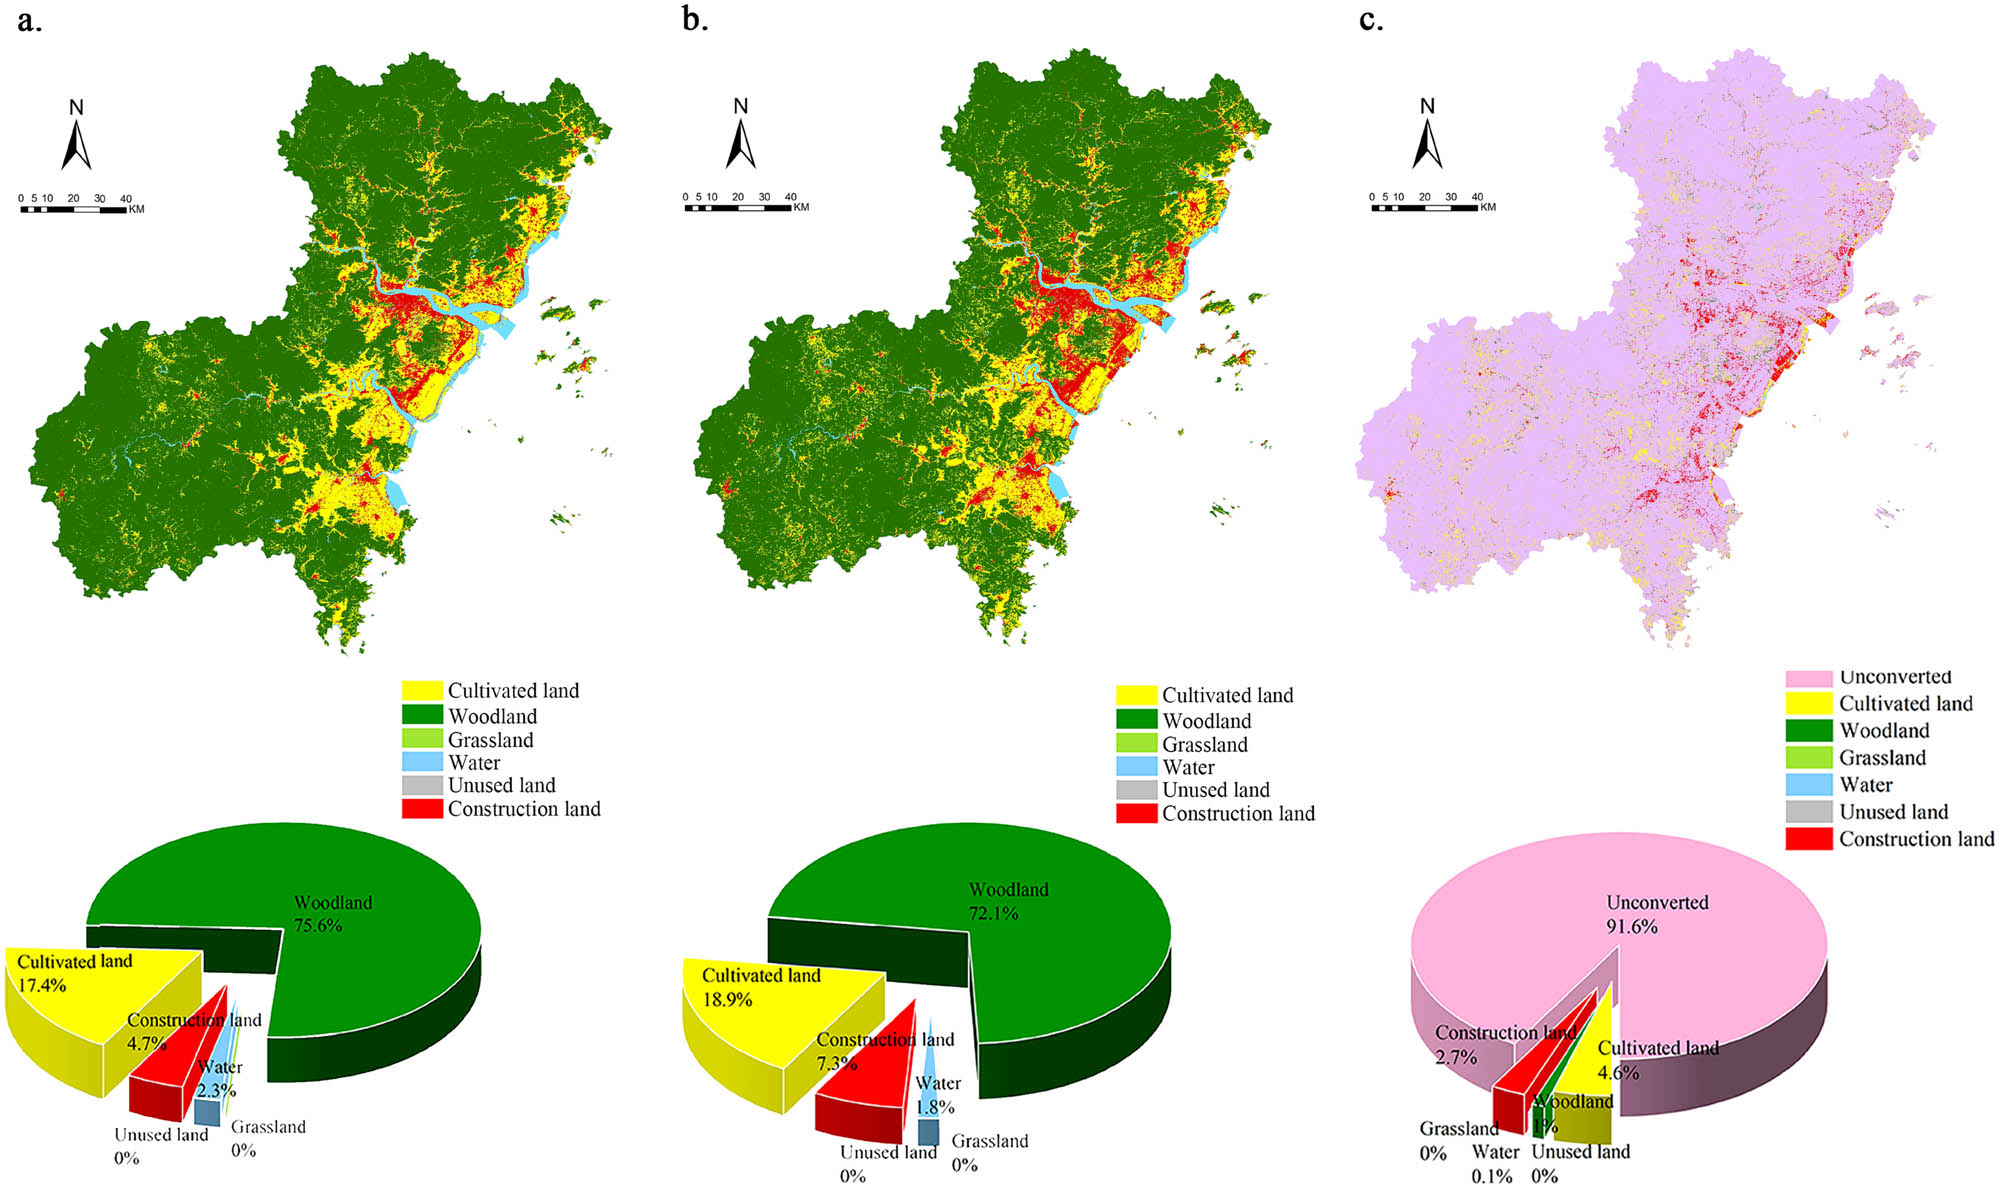
Distribution of LUCC space transfers from 2005 to 2020. (a) Year 2005. (b) Year 2020. (c) 2005–2020 land transfer.
3.1.2 Characterization and spatial mechanisms of CS from 2005 to 2020
Using the InVEST model to assess the CS in Wenzhou City in 2005 and 2020, the CS was 2.28 × 10⁵ kt and 2.22 × 10⁵ kt, respectively (Table 5), with a total decrease of 6.12 × 10³ kt, and the CS of woodland decreased by 8.76 × 10³ kt, and there was a decreasing trend in the CS from 2005 to 2020, with the total amount decreasing by 2.4%. In terms of LUCC types, the CS in descending order, is woodland, cultivated land, construction land, water, grassland, and unused land. From 2005 to 2020, the transfer and dynamics of CS of each land type (Table 6 and Figure 6), CS conversions of cultivated land, construction land, and woodland were 2.032 × 10⁴ kt, 3.39 × 10³ kt, and 1.20 × 10³ kt, respectively, which are the main factors affecting the change in CS in Wenzhou from 2005 to 2020, and the CS transfer of the remaining land use is relatively small and less influential.
CS in 2005 and 2020 (10 kt)
| Land use type | 2005 | 2020 | ||
|---|---|---|---|---|
| Carbon (10 kt) | Proportion (%) | Carbon (10 kt) | Proportion (%) | |
| Cultivated land | 2053.43 | 9.01 | 2211.48 | 9.94 |
| Woodland | 20014.57 | 87.79 | 19138.79 | 86.02 |
| Grassland | 3.81 | 0.02 | 1.49 | 0.01 |
| Water | 309.50 | 1.36 | 247.37 | 1.11 |
| Unused land | 0.09 | 0.00 | 0.17 | 0.00 |
| Construction land | 415.88 | 1.82 | 650.58 | 2.92 |
| Summary | 22797.28 | 100.00 | 22249.88 | 100.00 |
CS transfers (10 kt) in different land categories from 2005 to 2020
| Land use type | Cultivated land | Woodland | Grass land | Water | Unused land | Construction land |
|---|---|---|---|---|---|---|
| Cultivated land | 1664.91 | 1096.94 | 1.13 | 41.224 | 0.01 | 1.64 |
| Woodland | 119.18 | 18870.39 | 0.92 | 0.45 | 0.01 | 0.01 |
| Grassland | 0.19 | 0.54 | 0.99 | 0.01 | 0.01 | 0.01 |
| Water | 8.98 | 0.50 | 0.04 | 235.68 | 0.001 | 3.82 |
| Unused land | 0.03 | 0.01 | 0.10 | 0.08 | 0.018 | 0.01 |
| Construction land | 260.11 | 46.18 | 0.64 | 32.06 | 0.08 | 410.41 |
The analysis of four typical areas in Wenzhou City from 2005 to 2020 shows (Figure 6) that the areas with significant CS reduction are mainly areas A and D, where woodland and grassland are reduced in a large area, mostly distributed in point form in ecological service areas, with a wide range and a high density. The fringe areas of the main urban areas of B and C, where the CS is reduced, are distributed in piecemeal form, with a large area, and are mostly areas of woodland and cultivated land. The part of CS increasing is mainly the new cultivated land and construction land along the east coast and river, and the space of CS increasing is distributed in a narrow band with a small area. The spatial change in CS is consistent with LUCC in Wenzhou from 2005 to 2020, which is influenced by economic and social development (Figure 7). In the past 10 years, ecological CS technology has mainly focused on the exploration of loamy carbon sequestration, carbon capture, utilization, and storage (CCUS) technology, and ecological spatial restoration is considered to be the best natural solution with low cost and high CS. Therefore, in the future, Wenzhou should increase the investment in ecological and environmental management and restoration of land space to solve the problem of declining CS in Wenzhou at the level of ecological CCUS [74].

Dynamics of CS from 2005 to 2020. (a) 2005 CS, (b) 2020 CS, (c) 2020 CS intensity, and (d) 2005–2020 carbon transfer region.
3.2 LUCC demand forecast based on SD modeling
Based on the statistical data of Wenzhou City from 2005 to 2020, the values of SD model variables are set, and the LUCC demand in 2020 is simulated by combining natural resource data, economic and social data, and policy factors. Then, the simulation results in 2020 are compared with the real data in 2020 to calibrate the accuracy. The results show that the errors between the simulated data and the real data are less than 10% and mostly within 5%, with high model accuracy and good model structure (Table 7).
LUCC prediction accuracy (km2)
| Year | Cultivated land | Woodland | Grassland | Water | Unused land | Construction land |
|---|---|---|---|---|---|---|
| 2020 true (km2) | 2163.4263 | 8261.9586 | 1.3230 | 205.3071 | 0.1791 | 833.4999 |
| 2020 forecast (km2) | 2213.8573 | 8172.2156 | 1.4293 | 215.0721 | 0.1101 | 863.9569 |
| Error | 0.0233 | −0.0109 | 0.0804 | 0.0476 | −0.0835 | 0.0365 |
Based on the 2020 data, the economic and social development parameters under different scenarios were substituted into the SD model for simulation, and the results were obtained (Table 8). The results show that by 2035, the LUCC demand under the four scenarios in Wenzhou City vary greatly, and the area of cultivated land and construction land both increase. The growth rate of cultivated land area is HDS, NDS, ESGS, and LHDS in descending order; the growth rate of construction land is HDS, NDS, ESGS, and LHDS in descending order. The area of woodland, grassland, water, and unused land under the four scenarios show a decreasing trend in general, among which the area of woodland, grassland, water, and unused land decreases the most significantly under HDS. Grassland and unused land under ESGS have a small increasing trend. Cultivated land, woodland, and water have smaller changes in the LHDS and ESGS, which is mainly due to the fact that these two scenarios pursue high-quality, low-carbon ecology, maximize the coordination of the absolute conflict between the interests of economic development and ecological and low-carbon, and limit the disordered transfer between construction land and other land with low-carbon and ecological policies, which increases the amount of ecological land transfer (Figure 8).
Multi-scenario land demand in 2035 (km2)
| Scenarios | Cultivated land | Woodland | Grassland | Water | Unused land | Construction land |
|---|---|---|---|---|---|---|
| NDS | 2300.7676 | 8004.5715 | 0.5826 | 189.2505 | 0.0013 | 969.9568 |
| HUS | 2505.4972 | 7676.8982 | 0.0413 | 137.7814 | 0.0010 | 1145.0519 |
| LHDS | 2247.0106 | 8090.2258 | 1.9538 | 189.8802 | 0.0016 | 936.5507 |
| ESGS | 2236.9492 | 8075.9770 | 0.8921 | 188.5445 | 0.0012 | 963.5868 |

Changes in demand for different land types from 2020 to 2035. (a) Cultivated land. (b) Woodland. (c) Grassland. (d) Water. (e) Unused land. (f) Construction land.
3.3 LUCC simulations based on the PLUS model
3.3.1 Change analysis of LUCC in multi-scenario from 2020 to 2035
Based on the PLUS model for the 2005–2020 LUCC simulation, it can be seen that from the accuracy calibration process, the PLUS model has higher sensitivity to the accuracy and quality of the driving vector data, and the use of 500 and 1,000 m low-precision driving factors will directly reduce the accuracy of the LEAS module and increase the LUCC simulation error. In this study, the data used are mostly 30 m, and the overall accuracy of PLUS model is 91.86%, and the kappa coefficient is 0.91, which is high, indicating that the model is effective for LUCC simulation results. Based on the LUCC data in 2020, the LUCC demand simulated by SD under the four scenarios is substituted in the PLUS model, and the simulation results are as follows (Figures 9 and 10). The results show that cultivated land and construction land account for about 30% of the total land under NDS and HUS, and the transfer ratio of the two is 43 and 53%, respectively. Woodland accounted for 67–69% of the total land, and the changes in woodland, grassland, and water were all less than 3%, and most of the land shifted to construction land and cultivated land. Because of the absolute priority of economic development, economic and social development and low-carbon ecology are in absolute conflict, which is not conducive to the realization of the goal of “Dual-Carbon” and territorial spatial ecological governance. Under the LHDS and ESGS, woodland accounts for 70–73% of the total land, and from the perspective of land transfer, the transfer ratio is 46%, while cultivated land and construction land account for about 27% of the total land, and the transfer ratio is 24 and 28%, respectively. As a result of advocating low-carbon and high-quality development, ecological protection and ecological governance of land space, and focusing on the protection of ecological land, the area of this type of land transferred to cultivated land and construction land is relatively small, and the trend of returning and expanding the area of woodland and grassland is obvious, and the conflict of interests between economic development and ecological and low-carbon is relatively small, mostly relative, which is conducive to low-carbon and high-quality development.

Multi-scenario land modeling, land transfer space, and LUCC ratio in 2035. (A) NDS 2035 Land prediction; (a) NDS 2020–2035 transfer region; (B) HUS 2035 Land prediction; (b) HUS 2020–2035 transfer region; (C) LHDS 2035 Land prediction; (c) LHDS 2020–2035 transfer region; (D) ESGS 2035 Land prediction; (d) ESGS 2020–2035 transfer region.

Transfer of different land types. (a) 2020–2035 (NDS). (b) 2020–2035 (HUS). (c) 2020–2035 (LHDS). (d) 2020–2035 (ESGS).
3.3.2 Analysis of spatial mechanism of LUCC change 2020–2035
From the analysis of the four typical change regions in (Figures 9 and 11), it can be seen that the expansion of LUCC space under different scenarios is highly differentiated. Under NDS and HUS, the rapid expansion of construction land leads to a significant reduction in cultivated land in regions B and C. The expansion of construction land in regions A and D occupies a large amount of ecological space, such as woodland and grassland, with a significant reduction in woodland, and the construction land is widely distributed in a large point-like manner within the ecological zone. Under HUS, the expansion of construction land within the ecological zone seriously breaks the ecological protection space. The expansion of construction land and cultivated land under the LHDS is similar to that of the ESGS, and the space of woodland and grassland in the ecological space of regions A and D is better preserved and not extensively destroyed. The land transfer in regions B and D is dominated by woodland, construction land, and cultivated land, which is mainly transferred to the space of construction land, with the overall expansion of a smaller magnitude.

Transfer intensity of LUCC in multi-scenario. (a) NDS 2020–2035 transfer intensity. (b) HUS 2020–2035 transfer intensity. (c) LHDS 2020–2035 transfer intensity. (d) ESGS 2020–2035 transfer intensity.
3.4 CS measurement in multi-scenario based on InVEST modeling
3.4.1 Dynamic analysis of CS from 2020 to 2035
The dynamic simulation of CS was unfolded based on the SD-PLUS-InVEST model, which has a longer development time, greater data demand, higher sensitivity to the accuracy of the LUCC data, and more complex requirements than the static model, but the dynamic model has high accuracy and many prediction scenarios, which makes it more suitable for predicting spatial changes in CS over long time periods [75]. The results of the four scenarios simulated by SD-PLUS were substituted in the InVEST model to assess the changes in CS in Wenzhou City under different scenarios from 2020 to 2035 (Table 9 and Figure 12). The variability of CS under different scenarios is significant (Figure 10). In 2035, the CS under NDS, HUS, LHDS, and ESGS is 2.191 × 10⁵ kt, 2.142 × 10⁵ kt, 2.231 × 10⁵ kt, and 2.226 × 10⁵ kt, with an increment of −1.676, −3.692, 0.189, and −0.149%, respectively. Under the four scenarios, the CS in Wenzhou City from 2020 to 2035 shows different degrees of changes, and the CS of NDS, HUS, and ESGS decreases by 3.730 × 10³ kt, 8.214 × 10³ kt, and 33.09 kt, respectively, and the CS under LHDS increases by 42.05 kt. The largest changes in CS of land use types under the four scenarios were in woodland and cultivated land, with CS of woodland decreasing by 6.3 × 10³ kt and 1.338 × 10⁴ kt under NDS and HUS, respectively, and CS of cultivated land increasing by 1.78 × 10³ kt and 3.91 × 10³ kt, respectively; CS of woodland under NDS and HUS was 325 kt and 20 kt, respectively, and CS of cultivated land under NDS increased by 8.10 × 10² kt, cultivated land CS decreased by 1.32 × 10³ kt under HUS. CS of construction land under NDS, HUS, and ESGS showed an upward trend with an increase of 6.80 × 10³ kt, 1.58 × 10³ kt, and 9.90 × 10³ kt, respectively, and a decrease of 7.2 × 10² kt under LHDS, while the remaining land use types showed smaller changes in the total CS withdrawal. CS in Wenzhou City tends to have an overall decreasing trend from 2020 to 2035, with the largest decreases under NDS and HUS, the small decrease of CS under ESGS and the small increase under LHDS all benefit from the constraints of the policies of ecological protection, low-carbon development and territorial spatial ecological governance, which emphasize the strict protection of woodland, cultivated land, grassland, and water in development, and the effective coordination of the absolute and relative conflicts between the economic and social development and the low-carbon ecological interests.
CS in multi-scenarios
| LUCC | 2020 (10 kt) | 2020 (10 kt) | |||
|---|---|---|---|---|---|
| NDS | HUS | LHDS | ESGS | ||
| Cultivated land | 2053.43 | 2389.81 | 2602.46 | 2292.98 | 2079.93 |
| Woodland | 20014.57 | 18508.01 | 17750.37 | 19171.27 | 19138.79 |
| Grassland | 3.81 | 1.11 | 3.01 | 1.33 | 1.49 |
| Water | 309.50 | 259.01 | 264.17 | 247.86 | 247.37 |
| Unused land | 0.09 | 0.17 | 0.20 | 0.09 | 0.09 |
| Construction land | 415.88 | 718.76 | 808.30 | 578.40 | 749.13 |

Intensity of change in CS and heat map of transfers. (A) NDS 2035 carbon transfer intensity; (a) NDS 2035 carbon transfer. (B) HUS 2035 carbon transfer intensity; (b) HUS 2035 carbon transfer. (C) LHDS 2035 carbon transfer intensity; (c) LHDS 2035 carbon transfer. (D) ESGS 2035 carbon transfer intensity; (d) ESGS 2035 carbon transfer.
3.4.2 Spatial analysis of CS from 2020 to 2035
The spatial distribution of CS in 2035 is shown in Figure 13. Under NDS and HUS, the areas with decreasing woodland and decreasing CS are widely distributed in a sporadic point-like manner in regions A and D. The reason for this is that the urbanization rate in the western and northern woodland areas has increased, and the construction land for economic development and township settlements has increased, leading to the encroachment of a large amount of woodland and grassland space, and the encroachment of the economic and social development space on the space for low-carbon ecological services is in an absolute conflict, which results in the space with higher CS becoming smaller.

Spatial distribution and dynamic transfer of CS. (A) NDS 2035 CS; (B) HUS 2035 CS; (C) LHDS 2035 CS; (D) ESGS 2035 CS. (a) NDS 2020–2035 carbon transfer region; (b) HUS 2020–2035 carbon transfer region; (c) LHDS 2020–2035 carbon transfer region; (d) ESGS 2020–2035 carbon transfer region.
The changes in CS under LHDS and ESGS are similar, with woodland significantly higher than cultivated land. Under LHDS, the area of CS increase is significantly larger than the area of CS decrease, and the areas of CS decrease are mainly located in the areas of coastal cultivated land and construction land expansion in B and D. The construction land and cultivated land in the ecological reserves in A and D under LHDS and ESGS are significantly reduced compared with those in NDS and HUS. At the same time, the occupation of space for economic and social development and space for low-carbon ecological services is in a balanced state, with mostly relatively conflicting and non-conflicting interests, and there is a significant increase in the space with higher CS in the region.
4 Discussion
4.1 Impact of LUCC on CS in multi-scenario
This study investigates the impacts of four scenarios of LUCC, namely, NDS, HUS, LHDS, and ESGS on CS under the background of “Dual-Carbon” target and territorial spatial ecological governance in Wenzhou City from the perspectives of absolute and relative conflicts between different economic and social development modes and low-carbon ecology. There is significant spatial heterogeneity in LUCC and CS changes in the study area from 2020 to 2035. Under the four scenarios, the amount of transfer and spatial change in each type of land varies greatly. The expansion of construction land, woodland, and cultivated land is highly influenced by economic and social development and ecological and environmental protection policies, while the change in cultivated land area is more influenced by both population growth and the red line of cultivated land protection [76,77]. Under the relative and absolute conflict between economic and social development and low-carbon ecology, the large expansion of construction land will inevitably lead to the encroachment of land with higher CS in ecological space, resulting in lower CS, which is consistent with the results of previous researchers [78].
A low-carbon ecological development model and better policy conditions for territorial spatial ecological governance can effectively increase the area of woodland, grassland, and water. Ecological lands such as woodland and grassland are more inclined to expand to more ecologically healthy areas, which can effectively increase CS [79]. Woodland, water, grassland, and unused land decrease to varying degrees under all four scenarios, mainly from the expansion of cultivated land and construction land, with a large decrease in land with higher CS under NDS and HUS, and a small decrease in land with higher CS under LHDS and ESGS.
It was found that policy constraints, moderate reductions in GDP and population growth, and increased investment in ecological protection and management could restore the quality of CS in localized areas, and could effectively contribute to CS growth [80,81]. This is consistent with the results of Wang’s previous study on the dynamic assessment of CS in Bortala City in the context of climate change using the SD-PLUS-InVEST model [82]. In-depth analysis of spatial heterogeneity, different development conflict perspectives and changes in land types under development scenarios reveal the main drivers of CS changes. under LHDS and ESGS, the expansion of woodland and cultivated land is the main driver of CS changes; Under NDS and HUS, the expansion of cultivated land to construction land, forest land to cultivated land and construction land is the main driving factor of CS decline; under LHDS, expansion of grassland, unused land to woodland and Cultivated land is the main driver of CS increase.
4.2 Implications and recommendations
In recent years, with the development of the economy and the increase in the intensity of land development, the ecological environment has been increasingly damaged, the area of grassland and woodland has been reduced, resulting in the decline in CS, and the conflict of interest between economic and social development and low-carbon ecology is obvious. With the development of territorial spatial ecological governance in China, Wenzhou will optimize the LUCC structure, increase CS, achieve the “Dual-Carbon” goal, complete the work of territorial spatial ecological governance, and realize the high-quality, low-carbon ecological and safe development.
From the predicted results of LUCC and CS in 2035, the “Dual-Carbon” target, territorial spatial ecological governance, and ecological security and protection policies have a great impact on the future CS in Wenzhou City. From the results of CS in the past years, it can be seen that the largest carbon reservoir in the type of LUCC in Wenzhou City is Woodland, followed by cultivated land. Therefore, the protection of woodland and cultivated land is decisive for the future CS, while the protection of water and unused land should also be emphasized, which is in line with the current idea of territorial spatial ecological governance and cultivated land protection. The implementation of the above land ecological protection work will directly promote the implementation of land use policies under the LHDS and ESGS development models. However, in the context of the “dual-carbon” goal and the territorial spatial ecological governance, and in order to improve the ecological CS at the same time, it will be difficult to implement the land development model with high energy consumption and expansion under the NDS and HUS. In the future planning, the impacts of the formulation of low carbon strategy, territorial spatial ecological governance, and the delineation of three zones and three lines on CS in the study area need to be studied in depth. Based on the above, we propose the following development strategies.
As a pilot city of low-carbon ecology, Wenzhou should accelerate the pace of low-carbon ecological city construction and strengthen ecological environmental protection. Wenzhou has many hills and mountains, woodland is the main land, and woodland is the land with high CS. Wenzhou has a developed economy and a large population, and there is an absolute conflict of interest between the high growth rate of economic and social development and low-carbon ecology, and the woodland, as an important ecological land, is at the core of the conflict, and the loss of a large area of woodland from 2005 to 2020 has led to a significant decline in CS, so it is necessary to particularly increase the protection of woodland, which is conducive to slowing down the decline in CS, and the formation of a stable pattern of CS [83].
Based on Wenzhou’s “Dual-Carbon” goal and territorial spatial ecological governance pattern, the city will strictly implement the national ecological protection red line policy, ensure the protection and governance of important ecological barriers, ecological patches and ecological corridors, improve the management system of important ecological service zones, change the absolute conflict of interests between economic and social development and low-carbon ecology, and enhance the carbon sink function of ecological land [84]. Terrestrial ecosystems are the largest carbon reservoirs, and CS varies greatly among different vegetation types, so improving the vegetation richness of ecological service spaces can effectively build a stable spatial pattern of CS [85].
In response to the spatial heterogeneity of CS under LUCC types in Wenzhou City under different development scenarios, it is essential to adopt refined land use classification in the future under LHDS and ESGS, to improve the classification accuracy of land use types through the combination of high-resolution remotely sensed data and field surveys, to strengthen the ecological governance of the land, and to delineate the precise red line for ecological governance and protection, so as to enhance CS more accurately under different land use types [86]. Under NDS and HUS, a long-term carbon cycle monitoring network should be established to regularly collect and analyze CS data under different land use types in order to understand their dynamic trends, and to promote sustainable land management techniques, such as rational crop rotation, conservation tillage, and increasing the internal vegetation cover of construction land, etc., which can help to improve the soil organic carbon content and reduce carbon emissions. At the same time, the government should encourage urban builders, farmers, and land managers to adopt land use and management methods that are conducive to carbon sequestration to improve CS and achieve economic and low-carbon co-development by formulating relevant policies and providing low-carbon subsidies, etc. [87,88].
As an important economic and social development pivot in the Yangtze River Delta region and Zhejiang Province, Wenzhou should accelerate the transformation of its economic development model. Wenzhou should promote a new low-carbon and high-quality development model, increase investment in urban green infrastructure and homeland ecological security governance, and increase scientific and technological investment in low-carbon ecological construction, so as to turn the absolute conflict between economic and social development and ecological low-carbon into relative conflict and non-conflict, and improve ecological quality and CS. In promoting economic transformation to improve the quality of the ecological environment of the entire region and harmonizing the conflict between economic and social development and low-carbon ecological construction, the adoption of the LHDS and ESGS development models can jointly promote economic and social development and achieve the goals of “Dual-Carbon” and territorial spatial ecological governance.
4.3 Strengths and limitations
In this study, the spatial and temporal dynamics of LUCC and CS are simulated by coupled SD, PLUS, and InVEST models based on four scenarios of NDS, HUS, LHDS, and ESGS, which provide a new way to simulate the dynamics of the future LUCC under the dual contexts of different socio-economic development and “dual-carbon” target and the target of territorial spatial ecological governance, as well as under the absolute and relative conflict between socio-economic development and low-carbon ecological land use. The coupled SD and PLUS models can simulate the changes in LUCC demand and spatial differentiation patterns from different socioeconomic development scenarios with higher accuracy, and can better simulate LUCC changes and predict LUCC trends. The InVEST model is one of the most commonly used models for assessing CS because it has various advantages, including lower data requirements, less intensive calculations, and higher accuracy of conclusions.
However, the InVEST model oversimplifies the process of the carbon cycle by assuming that carbon sequestration in a region varies regularly and linearly over time [89]. Meanwhile, the InVEST model only considered the carbon density of different land types, ignoring the effects of seasonal changes in vegetation type, vegetation growth on carbon density [90,91], and did not consider in detail the carbon emission factors of socioeconomic development due to energy use. In future studies, more policies can be considered to limit CS changes under vegetation growth and seasonal changes, and field studies can be combined with prediction models to improve the accuracy of CS prediction. Meanwhile, the SD-PLUS-InVEST model in this study can be combined with the dynamic simulation of energy consumption for urban land use and economic development in future research, which can more accurately simulate the changes in energy consumption during urban expansion and economic development, supplement the influence factors of the socioeconomic subsystems in the SD model, and improve the simulation accuracy, which will in turn improve the prediction accuracy of PLUS and InVEST [92,93].
5 Conclusion
Under the background of “Dual-Carbon” target and territorial spatial ecological governance, we weigh the relative and absolute conflicts of resource utilization between low-carbon development, territorial spatial ecological governance, and economic and social development, and simulate the changes in LUCC and CS under different development scenarios with high accuracy by combining the comprehensive research models of SD model, PLUS model, and InVEST model. The changes in urban LUCC and CS under different development scenarios were simulated with high accuracy to explore the spatial evolution mechanism of LUCC and CS, and to provide effective references for the future to improve CS to achieve the “Dual-Carbon” goal, complete territorial spatial ecological governance and restoration, and build high-quality development. The conclusions of this study are as follows:
During the period from 2005 to 2020, the area of Woodland in Wenzhou City decreased by 407.5 km2, the area of construction land increased by 295.38 km2, and the area of cultivated land increased by 169.78 km2. About 63.5% of the transferred land was transferred as construction land, with cultivated land converted to construction land as the most important type of transfer.
The total amount of CS in Wenzhou City in 2005 and 2020 is 2.28 × 10⁵ kt and 2.22 × 10⁵ kt, respectively, with a total decrease of 6.12 × 10³ kt. Among them, the CS of woodland has decreased by 8.76 × 10³ kt, which is a decreasing trend year by year, and the total amount of CS has decreased by 2.4%. During the period of high economic and population growth, the demand for construction land rose sharply, and the transfer of woodland to cultivated land and construction land was the main reason for the decline in CS.
There is spatial heterogeneity in the prediction results of LUCC changes under NDS, HUS, LHDS, and ESGS. The overall change pattern is similar under LHDS and ESGS, with rapid expansion of woodland in the northern and western parts of the study area and a reduction in the large-scale uncontrolled expansion of construction land. Under NDS and HUS, the expansion of construction land within the ecological reserve and natural area in the western and northern parts of the study area is significant and the expansion area is large. Under HUS, the expansion of construction land and cultivated land is rapid to woodland, grassland, and unused land.
From 2020 to 2035, CS decreases under NDS, HUS, and ESGS and increases under LHDS. By 2035, CS under LHDS is the highest (2.23 × 10⁵ kt), followed by ESGS (2.22 × 10⁵ kt), NDS (2.19 × 10⁵ kt), and HUS (2.14 × 10⁵ kt). Overall, CS under NDS and HUS decreased the most, while the decrease in CS under LHDS and ESGS tended to moderate relatively.
Therefore, in order to guarantee the development of Wenzhou’s economic and social construction, the realization of the “dual-carbon” goal and the harmonious development of territorial spatial ecological governance, the development path and norms are formulated in conjunction with LHDS and ESGS. Wenzhou needs to refer to the “Carbon Emission Trading Management Measures (Trial),” “China’s Country Program for the Implementation of the 2030 Agenda for Sustainable Development,” “Paris Agreement,” and other legal means to implement carbon tax, subsidies, and eco-efficiency standards and enhance the legitimacy of the ecological CS under the “dual-carbon” goal and the territorial spatial ecological governance.
Acknowledgements
We sincerely thank the review experts for their comments on this paper. Their comments are very valuable, helpful for us to revise and improve the paper, and have important guiding significance for our research.
-
Funding information: This work was supported by the Open Fund of Wenzhou Future City Research Institute (Grant No. WL2023012) and Open Fund of Zhejiang Provincial Key Laboratory of Resource and Environment Information System (No. ZJGIS-KFJJ-20230301).
-
Author contributions: W.Q. analyzed the data and proposed the idea, X.H. wrote the draft and analyzed the experiments, G.X. was involved in experimental validation and visualization, J. H. was involved in data collection and processing, K.L. constructed the model, and X.J. participated in the construction of model, proposed research ideas, and revised the manuscript.
-
Conflict of interest: The authors state no conflict of interest.
References
[1] Sleeter BM, Marvin DC, Cameron DR, Selmants PC, Westerling AL, Kreitler J, et al. Effects of 21st-century climate, land use, and disturbances on ecosystem carbon balance in California. Glob Change Biol. 2019;25:3334–53.10.1111/gcb.14677Search in Google Scholar PubMed PubMed Central
[2] Chuai X, Huang X, Wang W, Zhao R, Zhang M, Wu C. Land use, total carbon emissions change and low carbon land management in Coastal Jiangsu, China. J Clean Prod. 2015;103:77–86.10.1016/j.jclepro.2014.03.046Search in Google Scholar
[3] Jiasheng L, Xiaomin G, Xiaowei C, Fangjian X, Feng Y, Runyi G, et al. Reexamine China’s terrestrial ecosystem carbon balance under land use-type and climate change. Land Use Policy. 2021;102:105275.10.1016/j.landusepol.2020.105275Search in Google Scholar
[4] Aitali R, Snoussi M, Kolker AS, Oujidi B, Mhammdi N. Effects of land use/land cover changes on carbon storage in North African Coastal Wetlands. J Mar Sci Eng. 2022;10:364.10.3390/jmse10030364Search in Google Scholar
[5] Eduardo G, Miguel I, Katažyna B, Marius K, Donalda K, Paulo P. Future land-use changes and its impacts on terrestrial ecosystem services: A review. Sci Total Environ. 2021;781:146716.10.1016/j.scitotenv.2021.146716Search in Google Scholar PubMed
[6] Shan Y, Liu J, Liu Z, Xu X, Shao S, Wang P, et al. New provincial CO2 emission inventories in China based on apparent energy consumption data and updated emission factors. Appl Energy. 2016;184:742–50.10.1016/j.apenergy.2016.03.073Search in Google Scholar
[7] Wu X, Tian Z, Guo J. A review of the theoretical research and practical progress of carbon neutrality. Sustain Oper Computers. 2022;3:54–66.10.1016/j.susoc.2021.10.001Search in Google Scholar
[8] Teets JC. Reforming service delivery in China: The emergence of a social innovation model. J Chin Polit Sci. 2012;17:15–32.10.1007/s11366-011-9176-9Search in Google Scholar
[9] Zhang D, Zhang Q, Qi S, Huang J, Karplus VJ. Integrity of firms’ emissions reporting in China’s early carbon markets. Nat Clim Change. 2019;9:164–9.10.1038/s41558-018-0394-4Search in Google Scholar
[10] Liu Z, Deng Z, He G, Wang H, Zhang X, Lin J, et al. Challenges and opportunities for carbon neutrality in China. Nat Rev Earth Environ. 2022;3:141–55.10.1038/s43017-021-00244-xSearch in Google Scholar
[11] Smriti M. How China could be carbon neutral by mid-century. Nature. 2020;586:482–3.10.1038/d41586-020-02927-9Search in Google Scholar PubMed
[12] Kebede AS, Nicholls RJ, Allan A, Arto I, Cazcarro I, Fernandes JA, et al. Applying the global RCP–SSP–SPA scenario framework at sub-national scale: A multi-scale and participatory scenario approach. Sci Total Environ. 2018;635:659–72.10.1016/j.scitotenv.2018.03.368Search in Google Scholar PubMed
[13] Doelman JC, Stehfest E, Tabeau A, van Meijl H, Lassaletta L, Gernaat DE, et al. Exploring SSP land-use dynamics using the IMAGE model: Regional and gridded scenarios of land-use change and land-based climate change mitigation. Glob Environ Change. 2018;48:119–35.10.1016/j.gloenvcha.2017.11.014Search in Google Scholar
[14] Nie X, Lu B, Chen Z, Yang Y, Chen S, Chen Z, et al. Increase or decrease? Integrating the CLUMondo and InVEST models to assess the impact of the implementation of the Major Function Oriented Zone planning on carbon storage. Ecol Indic. 2020;118:106708.10.1016/j.ecolind.2020.106708Search in Google Scholar
[15] Liang X, Guan Q, Clarke KC, Liu S, Wang B, Yao Y. Understanding the drivers of sustainable land expansion using a patch-generating land use simulation (PLUS) model: A case study in Wuhan, China. Comput Environ Urban Syst. 2021;85:101569.Search in Google Scholar
[16] Verburg PH, Soepboer W, Veldkamp A, Limpiada R, Espaldon V, Mastura SS. Modeling the spatial dynamics of regional land use: the CLUE-S model. Environ Manag. 2002;30:391–405.10.1007/s00267-002-2630-xSearch in Google Scholar PubMed
[17] Li X, Yeh AG. Neural-network-based cellular automata for simulating multiple land use changes using GIS. Int J Geogr Inf Sci. 2002;16:323–43.10.1080/13658810210137004Search in Google Scholar
[18] Yang J, Xie B, Zhang D. Spatio-temporal evolution of carbon stocks in the Yellow River Basin based on InVEST and CA-Markov models. Chin J Eco-Agriculture. 2021;29:1018–29.Search in Google Scholar
[19] Shao Z, Chen R, Zhao J, Xia C, He Y, Tang F. Spatio-temporal evolution and prediction of carbon storage in Beijing’s ecosystem based on FLUS and InVEST models. Acta Ecol Sin. 2022;42:9456–69.10.5846/stxb202201100094Search in Google Scholar
[20] Zhu W, Zhang J, Cui Y, Zheng H, Zhu L. Assessment of territorial ecosystem carbon storage based on land use change scenario: A case study in Qihe River Basin. Acta Geogr Sin. 2019;74:446–59.Search in Google Scholar
[21] Yimin C, Xia L, Xiaoping L, Bin A. Modeling urban land-use dynamics in a fast developing city using the modified logistic cellular automaton with a patch-based simulation strategy. Int J Geogr Inf Sci. 2014;28:234–55.10.1080/13658816.2013.831868Search in Google Scholar
[22] Tan J, Li A, Lei G, Xie X. A SD-MaxEnt-CA model for simulating the landscape dynamic of natural ecosystem by considering socio-economic and natural impacts. Ecol Model. 2019;410:108783.10.1016/j.ecolmodel.2019.108783Search in Google Scholar
[23] Liu Y, Lv X, Qin X, Guo H, Yu Y, Wang J, et al. An integrated GIS-based analysis system for land-use management of lake areas in urban fringe. Landsc Urban Plan. 2007;82:233–46.10.1016/j.landurbplan.2007.02.012Search in Google Scholar
[24] Qian L, Chengjun W, Tao F, Chuanjia D, Binglin Z. Multi-scenario prediction of land use change and carbon storage in Shaanxi Province based on the SD-PLUS coupled model. J Soil Water Conserv. 2024;38:195–206+215.Search in Google Scholar
[25] Liang X, Guan Q, Clarke KC, Liu S, Wang B, Yao Y. Understanding the drivers of sustainable land expansion using a patch-generating land use simulation (PLUS) model: A case study inWuhan. Comput Environ Urban Syst. 2021;85:e101569.10.1016/j.compenvurbsys.2020.101569Search in Google Scholar
[26] Li C, Wu Y, Gao B, Zheng K, Wu Y, Li C. Multi-scenario simulation of ecosystem service value for optimization of land use in the Sichuan-Yunnan ecological barrier, China. Ecol Indic. 2021;132:108328.10.1016/j.ecolind.2021.108328Search in Google Scholar
[27] Han Z, Chaoqun L, Wanzeng L, Chao Y, Dasheng F, Zikun W, et al. Understanding spatio-temporal patterns of land use/land cover change under urbanization in Wuhan, China, 2000–2019. Remote Sens. 2021;13:3331.10.3390/rs13163331Search in Google Scholar
[28] Liu B, Zhang L, Lu F, Deng L, Zhao H, Luo Y, et al. Methodology for accounting the net mitigation of China’s ecological restoration projects (CANM-EP). MethodsX. 2019;6:1753–73.10.1016/j.mex.2019.07.015Search in Google Scholar PubMed PubMed Central
[29] Li RW, Ye CC, Wang Y, Han GD, Sun J. Carbon storage estimation and its drivering force analysis based on InVEST model in the Tibetan Plateau. Acta Agrestia Sin. 2021;29:43.Search in Google Scholar
[30] Van der Linden S. Determinants and measurement of climate change risk perception, worry, and concern. The Oxford Encyclopedia of climate change communication. Oxford, UK: Oxford University Press; 2017.10.1093/acrefore/9780190228620.013.318Search in Google Scholar
[31] Zhenming Z, Yunchao Z, Xiao T, Xianfei H. Study on spatial heterogeneity and reserve estimation of soil organic carbon in a small karst catchment. Acta Ecol Sin. 2017;37:7647–59.10.5846/stxb201609141863Search in Google Scholar
[32] Kong J, Yang R, Su Y, Fu Z. Effect of land use and cover change on carbon stock dynamics in a typical desert oasis. Acta Ecol Sin. 2018;38:7801–12.Search in Google Scholar
[33] Houghton RA. The annual net flux of carbon to the atmosphere from changes in land use 1850–1990. Tellus B. 1999;51:298–313.10.1034/j.1600-0889.1999.00013.xSearch in Google Scholar
[34] Tong X, Wang K, Yue Y, Brandt M, Liu B, Zhang C, et al. Quantifying the effectiveness of ecological restoration projects on long-term vegetation dynamics in the karst regions of Southwest China. Int J Appl Earth Obs Geoinf. 2017;54:105–13.10.1016/j.jag.2016.09.013Search in Google Scholar
[35] Xinhua T, Qiuchen Z-G, Yanfei W. Remote sensing estimation of the carbon balance ability based on the object-oriented method for Guangxi Youjiang District. J Geo-Inf Sci. 2016;18:1675–83.Search in Google Scholar
[36] Zhang H, Deng W, Zhang S, Peng L, Liu Y. Impacts of urbanization on ecosystem services in the Chengdu-Chongqing Urban Agglomeration: Changes and trade-offs. Ecol Indic. 2022;139:108920.10.1016/j.ecolind.2022.108920Search in Google Scholar
[37] Chaplin-Kramer R, Sharp RP, Mandle L, Sim S, Johnson J, Butnar I, et al. Spatial patterns of agricultural expansion determine impacts on biodiversity and carbon storage. Proc Natl Acad Sci U S Am. 2015;112:7402–7.10.1073/pnas.1406485112Search in Google Scholar PubMed PubMed Central
[38] Pingping Z, Yanhong L, Haoran Y, Quantong C, Qingdong D, Lianqi Z. Spatio-temporal variation and dynamic simulation of ecosystem carbon storage in the north-south transitional zone of China. J Nat Resour. 2022;37:1183–97.10.31497/zrzyxb.20220506Search in Google Scholar
[39] Li T, Li M-Y, Tian L. Dynamics of carbon storage and its drivers in Guangdong Province from 1979 to 2012. Forests. 2021;12:1482.10.3390/f12111482Search in Google Scholar
[40] Liu G, Li G, Li J, Zhang Y, Lu Q, Du S. Study on change in carbon storage and its spatial pattern in Mata Watershed from 1999 to 2016 based on InVEST model. Arid Zone Res. 2021;38:267–74.Search in Google Scholar
[41] Hurtt GC, Frolking S, Fearon M, Moore B, Shevliakova E, Malyshev S, et al. The underpinnings of land-use history: Three centuries of global gridded land-use transitions, wood-harvest activity, and resulting secondary lands. Glob Change Biol. 2006;12:1208–29.10.1111/j.1365-2486.2006.01150.xSearch in Google Scholar
[42] Chaplin-Kramer R, Johnson JA, Sharp RP, Chatterton J, Weil C, Baccini A, et al. Spatial heterogeneity in forest carbon storage affects priorities for reforestation. bioRxiv. 2021;112:7402–7.10.1101/2021.07.06.450936Search in Google Scholar
[43] Xu Z, Feng T, Pengtao Z, Boyang H, Lei X. Dynamic simulation and characteristic analysis of county production-living-ecological spatial conflicts based on CLUE-S model. Acta Ecol Sin. 2019;39:5897–908.10.5846/stxb201901070059Search in Google Scholar
[44] Von Der Dunk A, Grêt-Regamey A, Dalang T, Hersperger AM. Defining a typology of peri-urban land-use conflicts – A case study from Switzerland. Landsc Urban Plan. 2011;101:149–56.10.1016/j.landurbplan.2011.02.007Search in Google Scholar
[45] Yang Y, Liu Y, Li Y, Du G. Quantifying spatio-temporal patterns of urban expansion in Beijing during 1985–2013 with rural-urban development transformation. Land Use Policy. 2018;74:220–30.10.1016/j.landusepol.2017.07.004Search in Google Scholar
[46] Pacheco FAL, Fernandes LFS. Environmental land use conflicts in catchments: A major cause of amplified nitrate in river water. Sci Total Environ. 2016;548–549:173–88.10.1016/j.scitotenv.2015.12.155Search in Google Scholar PubMed
[47] Meimei W, Zizhen J, Tengbiao L, Yongchun Y, Zhuo J. Analysis on absolute conflict and relative conflict of land use in Xining metropolitan area under different scenarios in 2030 by PLUS and PFCI. Cities. 2023;137:104314.10.1016/j.cities.2023.104314Search in Google Scholar
[48] Case MJ, Johnson BG, Bartowitz KJ, Hudiburg TW. Forests of the future: Climate change impacts and implications for carbon storage in the Pacific Northwest, USA. For Ecol Manag. 2021;482:118886.10.1016/j.foreco.2020.118886Search in Google Scholar
[49] Ward RD. Carbon sequestration and storage in Norwegian Arctic coastal wetlands: Impacts of climate change. Sci Total Environ. 2020;748:141343.10.1016/j.scitotenv.2020.141343Search in Google Scholar PubMed
[50] Xiangmu J, Qiankun L. Analysis of a land carrying capacity index based on an expanded three dimensional ecological footprint model: a case study of Wenzhou. Acta Ecol Sin. 2017;37:2982–93.10.5846/stxb201601310224Search in Google Scholar
[51] Xianjin H, Anlu Z, Rongqin Z, Fei G, Honghui Z. Carbon emission peak, carbon neutrality and territorial spatial planning implementation mechanism. Mod Urban Res. 2022;1:1–5.Search in Google Scholar
[52] Qingyi G. Concept adjustment and dilemma relief of China’s territorial space governance under the “dual carbon” goal. China Land Sci. 2023;37:12–9.Search in Google Scholar
[53] Yanlin W, Wenze Y, Shuijun Z, Haoxuan X, Ming L, Jianqiang W. Practice and enlightenment of promoting harmonious coexistence between man and nature – A case study of the integrated protection and restoration projection of mountains-rivers, forests-farmlands-lakes-grasslands-sand in the Oujiang River Source Area of Zhejiang Province. Nat Resour Econ China. 2023;36:37–43.Search in Google Scholar
[54] Haiqing L, Gaoqiu S, Deli Z. Carbon storage of forest ecosystem in Wenzhou City, Zhejiang Province, China. J Nanjing For Univ ( Nat Sci Ed). 2022;46:20–6.Search in Google Scholar
[55] Zexin L, Junjie L, Wenzheng Z, Jing G, Xuqiang Z. Response paltemm of watershed runolf in loess guly area under LUCC multi-scenario simulation and its adaptive planning strategy: a case study of Sanchuan River Basin in west of Shanxi province. Acta Feologica Sin. 2025;142:1–12.Search in Google Scholar
[56] Huang A, Wang Y, Tian L, Xia J, Liang YL, Sun MX, et al. Research progress of carbon effect in land use system: Mechanisms, simulations and optimization. J Natural Resour. 2024;39:2450–70.10.31497/zrzyxb.20241012Search in Google Scholar
[57] Baotao L. The decoupling relationship between the expansion of urban construction land and economic growth in Jilin province. J Resour Ecol. 2019;10:275–81.10.5814/j.issn.1674-764x.2019.03.005Search in Google Scholar
[58] Chong P, Leyi C, Feng H. The analysis of new-type urbanization and the intensive urban land use: Spatial-temporal evolution and their relationship. Geogr Res. 2015;33:2005–20.Search in Google Scholar
[59] Yu R, Huang XJ. Research on the expansion scale of construction land under the restriction of carbon emission peak. China Popul Resour Environ. 2019;29:66–72.Search in Google Scholar
[60] Wang K, Li X, Lyu X, Dang D, Dou H, Li M, et al. Optimizing the land use and land cover pattern to increase its contribution to carbon neutrality. Remote Sens. 2022;14:4751.10.3390/rs14194751Search in Google Scholar
[61] Wu B, Xie Y, Li Y, Cong L. How to delineate and zone protected areas under the scope of ecological conservation redline strategy. Biodivers Sci. 2022;30:21–6.10.17520/biods.2021372Search in Google Scholar
[62] Shujiang X, Ying W, Hua D, Chunmei Y, Zifang W, Ming G. Response and multi-scenario prediction of carbon storage to land use/cover change in the main urban area of Chongqing, China. Ecol Indic. 2022;142:109205.10.1016/j.ecolind.2022.109205Search in Google Scholar
[63] Peijun S. Today and future of the dynamics of human-earth (earth surface) system. Earth Sci Front. 1997;4:201–2.Search in Google Scholar
[64] Pejic Bach M, Tustanovski E, Ip AW, Yung K-L, Roblek V. System dynamics models for the simulation of sustainable urban development: A review and analysis and the stakeholder perspective. Kybernetes. 2020;49:460–504.10.1108/K-04-2018-0210Search in Google Scholar
[65] Li JP, Duan HM, Qiu M. Study on urban sustainable development based on system dynamics. Appl Mech Mater. 2014;587:171–5.10.4028/www.scientific.net/AMM.587-589.171Search in Google Scholar
[66] Cao QW, Gu CL, Guan WH. China’s urbanization SD modelling and simulation based on land use. J Nat Resour. 2021;36:1062–84.10.31497/zrzyxb.20210419Search in Google Scholar
[67] Yingchun L, Yande J, Shanmei H. Multi-scenario simulation of land use/land cover change and water yield evaluation coupled with the GMOP-PLUS-InVEST model: A case study of the Nansi Lake Basin in China. Ecol Indic. 2023;155:110926.10.1016/j.ecolind.2023.110926Search in Google Scholar
[68] Zhao M, He Z, Du J, Chen L, Lin P, Fang S. Assessing the effects of ecological engineering on carbon storage by linking the CA-Markov and InVEST models. Ecol Indic. 2019;98:29–38.10.1016/j.ecolind.2018.10.052Search in Google Scholar
[69] Yongchao L, Jialin L, Qixiang Y, Xiaoli S, Ruiliang P, Gaili H. A comparative study on the changes of ecosystem services values in the bay basin between China and the USA: A case study on Xiangshangang Bay basin, Zhejiang and Tampa Bay basin, Florida. Geogr Res. 2019;38:357–68.Search in Google Scholar
[70] Qian D, Chi Z. Influential factors analysis for spatial heterogeneity of soil organic carbon in Chinese terrestrial ecosystem with geographical detector. Ecol Environ Sci. 2021;30:19.Search in Google Scholar
[71] Carre F, Hiederer R, Blujdea V, Koeble R. Background guide for the calculation of land carbon stocks in the biofuels sustainability scheme drawing on the 2006 IPCC Guidelines for National Greenhouse Gas Inventories. Luxembourg: Publications Office of the European Union; 2010.Search in Google Scholar
[72] Alam SA, Starr M, Clark BJ. Tree biomass and soil organic carbon densities across the Sudanese woodland savannah: A regional carbon sequestration study. J Arid Environ. 2013;89:67–76.10.1016/j.jaridenv.2012.10.002Search in Google Scholar
[73] Shui CG, Sheng YY, Sheng XJ, ZiXian D, Jing Z. Total belowground carbon allocation in China’s forests. Acta Agrestia Sin. 2007;27:5148–57.Search in Google Scholar
[74] Bai Y, Cotrufo MF. Grassland soil carbon sequestration: Current understanding, challenges, and solutions. Science. 2022;377:603–8.10.1126/science.abo2380Search in Google Scholar PubMed
[75] Mostafa M, Varela C, Franke MB, Zondervan E. Dynamic modeling and control of a simulated carbon capture process for sustainable Power-to-X. Appl Sci. 2021;11:9574.10.3390/app11209574Search in Google Scholar
[76] Zhang Y, Xie H. Interactive relationship among urban expansion, economic development, and population growth since the reform and opening up in China: An analysis based on a vector error correction model. Land. 2019;8:153–3.10.3390/land8100153Search in Google Scholar
[77] Domke GM, Oswalt SN, Walters BF, Morin RS. Tree planting has the potential to increase carbon sequestration capacity of forests in the United States. Proc Natl Acad Sci U S Am. 2020;117:24649–51.10.1073/pnas.2010840117Search in Google Scholar PubMed PubMed Central
[78] Yingxue L, Zhaoshun L, Shujie L, Xiang L. Multi-scenario simulation analysis of land use and carbon storage changes in Changchun City based on FLUS and InVEST model. Land. 2022;11:647.10.3390/land11050647Search in Google Scholar
[79] Yang H, Huang J, Liu D. Linking climate change and socioeconomic development to urban land use simulation: Analysis of their concurrent effects on carbon storage. Appl Geogr. 2020;115:102135.10.1016/j.apgeog.2019.102135Search in Google Scholar
[80] McGuire CJ. A case study of carbon sequestration potential of land use policies favoring re-growth and long-term protection of temperate forests. J Sustain Dev. 2010;3:11–6.10.5539/jsd.v3n1p11Search in Google Scholar
[81] Casey G, Galor O. Is faster economic growth compatible with reductions in carbon emissions? The role of diminished population growth. Environ Res Lett. 2017;12:014003.10.1088/1748-9326/12/1/014003Search in Google Scholar PubMed PubMed Central
[82] Wang Z, Li X, Mao Y, Li L, Wang X, Lin Q. Dynamic simulation of land use change and assessment of carbon storage based on climate change scenarios at the city level: A case study of Bortala, China. Ecol Indic. 2022;134:108499.10.1016/j.ecolind.2021.108499Search in Google Scholar
[83] Ma J, Bu R, Liu M, Chang Y, Qin Q, Hu Y. Ecosystem carbon storage distribution between plant and soil in different forest types in Northeastern China. Ecol Eng. 2015;81:353–62.10.1016/j.ecoleng.2015.04.080Search in Google Scholar
[84] Wenjun W. Reserve estimation, spatiotemporal distribution and its influencing factors of soil organic carbon in Fujian Province, China. Geoscience. 2019;33:1295.Search in Google Scholar
[85] LiYao F, Tianyi C, Qian W, Jing H, Shuxue W, Junhao W, et al. Scenario simulation of land use change and carbon storage response in Henan Province, China: 1990–2050. Ecol Indic. 2023;154:110660.10.1016/j.ecolind.2023.110660Search in Google Scholar
[86] Hongyu Y, Feng L, Weiwei W, Xiangpeng M, Zhu L, Baiyinbaoligao. Yangtze river delta integrated demo zone: Ecosystem service changes and trade-offs analysis. J China Inst Water Resour Hydropower Res. 2024;22:1–12.Search in Google Scholar
[87] Zitao Y, Li T. Sustainability assessment based on PLUS simulation of future landuse change: A case study of Jiangxi Province. Sci Geogr Sin. 2024;1–11.Search in Google Scholar
[88] Jingling X, Jinli C, Dan C, Yaruo M, Xinyi C, Haoran Q, et al. Characteristics and influencing factors of topsoil organic carbon content changes in purple soils of the Sichuan basin. Chin J Eco-Agriculture. 2024;32:1–13.Search in Google Scholar
[89] Hernández-Alonso H, Madrigal-González J, Tornos-Estupiña L, Santiago-Rodríguez A, Alonso-Rojo P, Morera-Beita A, et al. Tree-size heterogeneity modulates the forest age-dependent carbon density in biomass and top soil stocks on Mediterranean woodlands. Plant Soil. 2023;486:361–73.10.1007/s11104-023-05874-2Search in Google Scholar
[90] Shi-Hang W, Xue-Zheng S, Yong-Cun Z, Weindorf D, Dong-Sheng Y, Sheng-Xiang X, et al. Regional simulation of soil organic carbon dynamics for dry farmland in east China by coupling a 1:500 000 soil database with the century model. Pedosphere. 2011;21:277–87.10.1016/S1002-0160(11)60128-8Search in Google Scholar
[91] Li J, Chen X, Kurban A, Van de Voorde T, De Maeyer P, Zhang C. Coupled SSPs-RCPs scenarios to project the future dynamic variations of water-soil-carbon-biodiversity services in Central Asia. Ecol Indic. 2021;129:107936.10.1016/j.ecolind.2021.107936Search in Google Scholar
[92] Patrizi N, LaTouf SK, Tsiropoulou EE, Papavassiliou S. Prosumer-centric self-sustained smart grid systems. IEEE Syst J. 2022;16:6042–53.10.1109/JSYST.2022.3156877Search in Google Scholar
[93] Liu J, Yan Q, Zhang M. Ecosystem carbon storage considering combined environmental and land-use changes in the future and pathways to carbon neutrality in developed regions. Sci Total Environ. 2023;903:166204.10.1016/j.scitotenv.2023.166204Search in Google Scholar PubMed
© 2024 the author(s), published by De Gruyter
This work is licensed under the Creative Commons Attribution 4.0 International License.
Articles in the same Issue
- Regular Articles
- Theoretical magnetotelluric response of stratiform earth consisting of alternative homogeneous and transitional layers
- The research of common drought indexes for the application to the drought monitoring in the region of Jin Sha river
- Evolutionary game analysis of government, businesses, and consumers in high-standard farmland low-carbon construction
- On the use of low-frequency passive seismic as a direct hydrocarbon indicator: A case study at Banyubang oil field, Indonesia
- Water transportation planning in connection with extreme weather conditions; case study – Port of Novi Sad, Serbia
- Zircon U–Pb ages of the Paleozoic volcaniclastic strata in the Junggar Basin, NW China
- Monitoring of mangrove forests vegetation based on optical versus microwave data: A case study western coast of Saudi Arabia
- Microfacies analysis of marine shale: A case study of the shales of the Wufeng–Longmaxi formation in the western Chongqing, Sichuan Basin, China
- Multisource remote sensing image fusion processing in plateau seismic region feature information extraction and application analysis – An example of the Menyuan Ms6.9 earthquake on January 8, 2022
- Identification of magnetic mineralogy and paleo-flow direction of the Miocene-quaternary volcanic products in the north of Lake Van, Eastern Turkey
- Impact of fully rotating steel casing bored pile on adjacent tunnels
- Adolescents’ consumption intentions toward leisure tourism in high-risk leisure environments in riverine areas
- Petrogenesis of Jurassic granitic rocks in South China Block: Implications for events related to subduction of Paleo-Pacific plate
- Differences in urban daytime and night block vitality based on mobile phone signaling data: A case study of Kunming’s urban district
- Random forest and artificial neural network-based tsunami forests classification using data fusion of Sentinel-2 and Airbus Vision-1 satellites: A case study of Garhi Chandan, Pakistan
- Integrated geophysical approach for detection and size-geometry characterization of a multiscale karst system in carbonate units, semiarid Brazil
- Spatial and temporal changes in ecosystem services value and analysis of driving factors in the Yangtze River Delta Region
- Deep fault sliding rates for Ka-Ping block of Xinjiang based on repeating earthquakes
- Improved deep learning segmentation of outdoor point clouds with different sampling strategies and using intensities
- Platform margin belt structure and sedimentation characteristics of Changxing Formation reefs on both sides of the Kaijiang-Liangping trough, eastern Sichuan Basin, China
- Enhancing attapulgite and cement-modified loess for effective landfill lining: A study on seepage prevention and Cu/Pb ion adsorption
- Flood risk assessment, a case study in an arid environment of Southeast Morocco
- Lower limits of physical properties and classification evaluation criteria of the tight reservoir in the Ahe Formation in the Dibei Area of the Kuqa depression
- Evaluation of Viaducts’ contribution to road network accessibility in the Yunnan–Guizhou area based on the node deletion method
- Permian tectonic switch of the southern Central Asian Orogenic Belt: Constraints from magmatism in the southern Alxa region, NW China
- Element geochemical differences in lower Cambrian black shales with hydrothermal sedimentation in the Yangtze block, South China
- Three-dimensional finite-memory quasi-Newton inversion of the magnetotelluric based on unstructured grids
- Obliquity-paced summer monsoon from the Shilou red clay section on the eastern Chinese Loess Plateau
- Classification and logging identification of reservoir space near the upper Ordovician pinch-out line in Tahe Oilfield
- Ultra-deep channel sand body target recognition method based on improved deep learning under UAV cluster
- New formula to determine flyrock distance on sedimentary rocks with low strength
- Assessing the ecological security of tourism in Northeast China
- Effective reservoir identification and sweet spot prediction in Chang 8 Member tight oil reservoirs in Huanjiang area, Ordos Basin
- Detecting heterogeneity of spatial accessibility to sports facilities for adolescents at fine scale: A case study in Changsha, China
- Effects of freeze–thaw cycles on soil nutrients by soft rock and sand remodeling
- Vibration prediction with a method based on the absorption property of blast-induced seismic waves: A case study
- A new look at the geodynamic development of the Ediacaran–early Cambrian forearc basalts of the Tannuola-Khamsara Island Arc (Central Asia, Russia): Conclusions from geological, geochemical, and Nd-isotope data
- Spatio-temporal analysis of the driving factors of urban land use expansion in China: A study of the Yangtze River Delta region
- Selection of Euler deconvolution solutions using the enhanced horizontal gradient and stable vertical differentiation
- Phase change of the Ordovician hydrocarbon in the Tarim Basin: A case study from the Halahatang–Shunbei area
- Using interpretative structure model and analytical network process for optimum site selection of airport locations in Delta Egypt
- Geochemistry of magnetite from Fe-skarn deposits along the central Loei Fold Belt, Thailand
- Functional typology of settlements in the Srem region, Serbia
- Hunger Games Search for the elucidation of gravity anomalies with application to geothermal energy investigations and volcanic activity studies
- Addressing incomplete tile phenomena in image tiling: Introducing the grid six-intersection model
- Evaluation and control model for resilience of water resource building system based on fuzzy comprehensive evaluation method and its application
- MIF and AHP methods for delineation of groundwater potential zones using remote sensing and GIS techniques in Tirunelveli, Tenkasi District, India
- New database for the estimation of dynamic coefficient of friction of snow
- Measuring urban growth dynamics: A study in Hue city, Vietnam
- Comparative models of support-vector machine, multilayer perceptron, and decision tree predication approaches for landslide susceptibility analysis
- Experimental study on the influence of clay content on the shear strength of silty soil and mechanism analysis
- Geosite assessment as a contribution to the sustainable development of Babušnica, Serbia
- Using fuzzy analytical hierarchy process for road transportation services management based on remote sensing and GIS technology
- Accumulation mechanism of multi-type unconventional oil and gas reservoirs in Northern China: Taking Hari Sag of the Yin’e Basin as an example
- TOC prediction of source rocks based on the convolutional neural network and logging curves – A case study of Pinghu Formation in Xihu Sag
- A method for fast detection of wind farms from remote sensing images using deep learning and geospatial analysis
- Spatial distribution and driving factors of karst rocky desertification in Southwest China based on GIS and geodetector
- Physicochemical and mineralogical composition studies of clays from Share and Tshonga areas, Northern Bida Basin, Nigeria: Implications for Geophagia
- Geochemical sedimentary records of eutrophication and environmental change in Chaohu Lake, East China
- Research progress of freeze–thaw rock using bibliometric analysis
- Mixed irrigation affects the composition and diversity of the soil bacterial community
- Examining the swelling potential of cohesive soils with high plasticity according to their index properties using GIS
- Geological genesis and identification of high-porosity and low-permeability sandstones in the Cretaceous Bashkirchik Formation, northern Tarim Basin
- Usability of PPGIS tools exemplified by geodiscussion – a tool for public participation in shaping public space
- Efficient development technology of Upper Paleozoic Lower Shihezi tight sandstone gas reservoir in northeastern Ordos Basin
- Assessment of soil resources of agricultural landscapes in Turkestan region of the Republic of Kazakhstan based on agrochemical indexes
- Evaluating the impact of DEM interpolation algorithms on relief index for soil resource management
- Petrogenetic relationship between plutonic and subvolcanic rocks in the Jurassic Shuikoushan complex, South China
- A novel workflow for shale lithology identification – A case study in the Gulong Depression, Songliao Basin, China
- Characteristics and main controlling factors of dolomite reservoirs in Fei-3 Member of Feixianguan Formation of Lower Triassic, Puguang area
- Impact of high-speed railway network on county-level accessibility and economic linkage in Jiangxi Province, China: A spatio-temporal data analysis
- Estimation model of wild fractional vegetation cover based on RGB vegetation index and its application
- Lithofacies, petrography, and geochemistry of the Lamphun oceanic plate stratigraphy: As a record of the subduction history of Paleo-Tethys in Chiang Mai-Chiang Rai Suture Zone of Thailand
- Structural features and tectonic activity of the Weihe Fault, central China
- Application of the wavelet transform and Hilbert–Huang transform in stratigraphic sequence division of Jurassic Shaximiao Formation in Southwest Sichuan Basin
- Structural detachment influences the shale gas preservation in the Wufeng-Longmaxi Formation, Northern Guizhou Province
- Distribution law of Chang 7 Member tight oil in the western Ordos Basin based on geological, logging and numerical simulation techniques
- Evaluation of alteration in the geothermal province west of Cappadocia, Türkiye: Mineralogical, petrographical, geochemical, and remote sensing data
- Numerical modeling of site response at large strains with simplified nonlinear models: Application to Lotung seismic array
- Quantitative characterization of granite failure intensity under dynamic disturbance from energy standpoint
- Characteristics of debris flow dynamics and prediction of the hazardous area in Bangou Village, Yanqing District, Beijing, China
- Rockfall mapping and susceptibility evaluation based on UAV high-resolution imagery and support vector machine method
- Statistical comparison analysis of different real-time kinematic methods for the development of photogrammetric products: CORS-RTK, CORS-RTK + PPK, RTK-DRTK2, and RTK + DRTK2 + GCP
- Hydrogeological mapping of fracture networks using earth observation data to improve rainfall–runoff modeling in arid mountains, Saudi Arabia
- Petrography and geochemistry of pegmatite and leucogranite of Ntega-Marangara area, Burundi, in relation to rare metal mineralisation
- Prediction of formation fracture pressure based on reinforcement learning and XGBoost
- Hazard zonation for potential earthquake-induced landslide in the eastern East Kunlun fault zone
- Monitoring water infiltration in multiple layers of sandstone coal mining model with cracks using ERT
- Study of the patterns of ice lake variation and the factors influencing these changes in the western Nyingchi area
- Productive conservation at the landslide prone area under the threat of rapid land cover changes
- Sedimentary processes and patterns in deposits corresponding to freshwater lake-facies of hyperpycnal flow – An experimental study based on flume depositional simulations
- Study on time-dependent injectability evaluation of mudstone considering the self-healing effect
- Detection of objects with diverse geometric shapes in GPR images using deep-learning methods
- Behavior of trace metals in sedimentary cores from marine and lacustrine environments in Algeria
- Spatiotemporal variation pattern and spatial coupling relationship between NDVI and LST in Mu Us Sandy Land
- Formation mechanism and oil-bearing properties of gravity flow sand body of Chang 63 sub-member of Yanchang Formation in Huaqing area, Ordos Basin
- Diagenesis of marine-continental transitional shale from the Upper Permian Longtan Formation in southern Sichuan Basin, China
- Vertical high-velocity structures and seismic activity in western Shandong Rise, China: Case study inspired by double-difference seismic tomography
- Spatial coupling relationship between metamorphic core complex and gold deposits: Constraints from geophysical electromagnetics
- Disparities in the geospatial allocation of public facilities from the perspective of living circles
- Research on spatial correlation structure of war heritage based on field theory. A case study of Jinzhai County, China
- Formation mechanisms of Qiaoba-Zhongdu Danxia landforms in southwestern Sichuan Province, China
- Magnetic data interpretation: Implication for structure and hydrocarbon potentiality at Delta Wadi Diit, Southeastern Egypt
- Deeply buried clastic rock diagenesis evolution mechanism of Dongdaohaizi sag in the center of Junggar fault basin, Northwest China
- Application of LS-RAPID to simulate the motion of two contrasting landslides triggered by earthquakes
- The new insight of tectonic setting in Sunda–Banda transition zone using tomography seismic. Case study: 7.1 M deep earthquake 29 August 2023
- The critical role of c and φ in ensuring stability: A study on rockfill dams
- Evidence of late quaternary activity of the Weining-Shuicheng Fault in Guizhou, China
- Extreme hydroclimatic events and response of vegetation in the eastern QTP since 10 ka
- Spatial–temporal effect of sea–land gradient on landscape pattern and ecological risk in the coastal zone: A case study of Dalian City
- Study on the influence mechanism of land use on carbon storage under multiple scenarios: A case study of Wenzhou
- A new method for identifying reservoir fluid properties based on well logging data: A case study from PL block of Bohai Bay Basin, North China
- Comparison between thermal models across the Middle Magdalena Valley, Eastern Cordillera, and Eastern Llanos basins in Colombia
- Mineralogical and elemental analysis of Kazakh coals from three mines: Preliminary insights from mode of occurrence to environmental impacts
- Chlorite-induced porosity evolution in multi-source tight sandstone reservoirs: A case study of the Shaximiao Formation in western Sichuan Basin
- Predicting stability factors for rotational failures in earth slopes and embankments using artificial intelligence techniques
- Origin of Late Cretaceous A-type granitoids in South China: Response to the rollback and retreat of the Paleo-Pacific plate
- Modification of dolomitization on reservoir spaces in reef–shoal complex: A case study of Permian Changxing Formation, Sichuan Basin, SW China
- Geological characteristics of the Daduhe gold belt, western Sichuan, China: Implications for exploration
- Rock physics model for deep coal-bed methane reservoir based on equivalent medium theory: A case study of Carboniferous-Permian in Eastern Ordos Basin
- Enhancing the total-field magnetic anomaly using the normalized source strength
- Shear wave velocity profiling of Riyadh City, Saudi Arabia, utilizing the multi-channel analysis of surface waves method
- Effect of coal facies on pore structure heterogeneity of coal measures: Quantitative characterization and comparative study
- Inversion method of organic matter content of different types of soils in black soil area based on hyperspectral indices
- Detection of seepage zones in artificial levees: A case study at the Körös River, Hungary
- Tight sandstone fluid detection technology based on multi-wave seismic data
- Characteristics and control techniques of soft rock tunnel lining cracks in high geo-stress environments: Case study of Wushaoling tunnel group
- Influence of pore structure characteristics on the Permian Shan-1 reservoir in Longdong, Southwest Ordos Basin, China
- Study on sedimentary model of Shanxi Formation – Lower Shihezi Formation in Da 17 well area of Daniudi gas field, Ordos Basin
- Multi-scenario territorial spatial simulation and dynamic changes: A case study of Jilin Province in China from 1985 to 2030
- Review Articles
- Major ascidian species with negative impacts on bivalve aquaculture: Current knowledge and future research aims
- Prediction and assessment of meteorological drought in southwest China using long short-term memory model
- Communication
- Essential questions in earth and geosciences according to large language models
- Erratum
- Erratum to “Random forest and artificial neural network-based tsunami forests classification using data fusion of Sentinel-2 and Airbus Vision-1 satellites: A case study of Garhi Chandan, Pakistan”
- Special Issue: Natural Resources and Environmental Risks: Towards a Sustainable Future - Part I
- Spatial-temporal and trend analysis of traffic accidents in AP Vojvodina (North Serbia)
- Exploring environmental awareness, knowledge, and safety: A comparative study among students in Montenegro and North Macedonia
- Determinants influencing tourists’ willingness to visit Türkiye – Impact of earthquake hazards on Serbian visitors’ preferences
- Application of remote sensing in monitoring land degradation: A case study of Stanari municipality (Bosnia and Herzegovina)
- Optimizing agricultural land use: A GIS-based assessment of suitability in the Sana River Basin, Bosnia and Herzegovina
- Assessing risk-prone areas in the Kratovska Reka catchment (North Macedonia) by integrating advanced geospatial analytics and flash flood potential index
- Analysis of the intensity of erosive processes and state of vegetation cover in the zone of influence of the Kolubara Mining Basin
- GIS-based spatial modeling of landslide susceptibility using BWM-LSI: A case study – city of Smederevo (Serbia)
- Geospatial modeling of wildfire susceptibility on a national scale in Montenegro: A comparative evaluation of F-AHP and FR methodologies
- Geosite assessment as the first step for the development of canyoning activities in North Montenegro
- Urban geoheritage and degradation risk assessment of the Sokograd fortress (Sokobanja, Eastern Serbia)
- Multi-hazard modeling of erosion and landslide susceptibility at the national scale in the example of North Macedonia
- Understanding seismic hazard resilience in Montenegro: A qualitative analysis of community preparedness and response capabilities
- Forest soil CO2 emission in Quercus robur level II monitoring site
- Characterization of glomalin proteins in soil: A potential indicator of erosion intensity
- Power of Terroir: Case study of Grašac at the Fruška Gora wine region (North Serbia)
- Special Issue: Geospatial and Environmental Dynamics - Part I
- Qualitative insights into cultural heritage protection in Serbia: Addressing legal and institutional gaps for disaster risk resilience