Effect of coal facies on pore structure heterogeneity of coal measures: Quantitative characterization and comparative study
-
Lingyu Zhao
 ,
Dejiang Li
,
Dejiang Li

Abstract
Coal facies is an important indicator reflecting depositional environment of coal, which affects pore distribution. The effect of coal facies on the nanopore structure is essential for deep coalbed methane drainage. In this study, 13 coal samples from the Upper Triassic Talichik Formation in the Kubei-Bashi tectonic belt were collected. The coal facies type is determined based on the coal phase parameters (TPI–GI diagram). On this basis, nanopore diameter distribution is determined by using liquid nitrogen adsorption and CO2 adsorption experiments. Then, single and multi-fractal dimensions are studied by using fractal theories. The results are as follows. The coal facies are classified into three types, namely low swampy reed phases (Type A, GI > 5, TPI < 1), wetland herbaceous swamp phases (Type B, GI < 5, TPI < 1), and dry forest swamp phases (Type C, GI < 1, TPI > 1). The pore volume percentage of micropores is similar amongst the three facies types, showing that the coal facies has little effect on the pore structure of micropores. The pore volume and specific surface area of meso-pores are the largest for coal facies A, indicating the most developed meso-pores in coal facies A. However, the pore volume percentage with a diameter of 2–10 nm in coal facies A is the lowest among the three coal facies. Above all, the coal reservoir under the wet overlying water depositional environment of coal facies A offers a relatively large pore volume as well as a specific surface area, which is more favorable for the exploration and development of coalbed methane; therefore, it is the advantageous coal reservoir in the study area.
1 Introduction
Coal facies exerts an important control on the pore characteristics of coal reservoirs, serving as a crucial indicator that reflects the coal depositional environment. The coal facies type imposes constraints on the scale of coal-bearing gas formation and productivity potential. Coal facies research has emerged as a hot topic in coal geology research [1,2,3]. Several researchers have studied pore characteristics through methods such as high-pressure mercury injection (HPMI) and low-temperature liquid nitrogen tests (LPN2 GA). They have explored the intrinsic relationship between coal facies and pore characteristics, revealing variations in pore characteristics across different coal facies types [4,5].
Coal reservoirs represent heterogeneous porous media, and the morphology of pores and the structure of coal directly affect the physical properties of coal, as well as the adsorption–desorption and seepage characteristics of gas in the coal reservoir [6,7,8]. The pore structure dictates the gas content of coalbed methane and impacts the recoverability of coalbed methane [9,10,11]. The factors affecting the pore-fracture structure include the industrial components of coal rock, the degree of coal metamorphism, and the coal rock components [12,13]. However, the fundamental reason lies in the diversity of coal facies types, i.e., different depositional environments in which the coal reservoirs are located, with different coal facies types constraining the pore-fracture structure development.
Recent studies have employed fluid injection methods and image analysis techniques to provide detailed descriptions of the pore structure of coal reservoirs. In the context of adsorption reservoirs, the pore structure is a central factor affecting the gas content of the coal reservoir. Currently, the main methods for characterizing adsorbate pores include HPMI, LP N2GA, CO2 adsorption test (LP CO2GA), and low-field nuclear magnetic resonance (LF-NMR) spectroscopy [14,15,16]. These methods are complemented by mathematical approaches such as fractal theory to quantitatively evaluate the heterogeneity of pore distribution [17,18]. For instance, Liu and Nie [19] utilized adsorption tests and image analysis approaches to analyze fractal characteristics, deriving pore distribution fractal dimension D1 and surface fractal dimension D2, effectively reflecting differences in pore distribution heterogeneity. Li et al. calculated pore volume fractal dimension D v, surface fractal dimension D s, and pore distribution fractal dimension D p on the basis of FHH fractal theory and the Menger sponge model, providing quantitative evaluations of coal reservoir heterogeneity. Despite extensive studies by previous authors on coal facies division and the quantitative characterization of pore-fracture structure, few have delved into the impact of coal facies on the pore-fracture structure of reservoirs. Moreover, the impact of coal facies on the heterogeneity of pore-fracture distribution, crucial in reflecting the depositional environment of coal, remains largely unexplored [20].
This study focuses on coal samples collected from the Triassic Talichik Formation in the Misbrak and Heiyingshan sections, serving as representative samples. The identification of coal facies is based on the maceral characteristics. Quantitative characterization of the nanopore size distribution in coal samples is accomplished through LPN2 GA and LPCO2 GA tests. Subsequently, the pore structure characteristics of micropores and mesopores of different coal facies samples are discussed. Building upon these results, the heterogeneity of pores distribution is investigated using single and multiple fractal models. This article concludes by shedding light on the pore development mechanism.
2 Study area and experimental methods
2.1 Geological setting
The study area is situated within the Kubei–Bashi tectonic belt, located in the northern part of the Kuqa depression at the northern margin of the Tarim Basin. It extends from the Kapshalyan River in the west to the Kuqa River in the east and from the Krasu Tectonic Belt in the south to the northern edge of the basin, covering an area of about 1,700 km2 (Figure 1). The Kubei–Bashi tectonic zone is mainly controlled by a series of thrust faults, with its main body formed during the Neogene. Nevertheless, evident tectonic activities were also observed during the late Yanshan period. Overall, the thrust structure involves a complex basement. In the north, the Triassic strata are eroded to the surface, leading to the development of a series of gentle anticlines in the south, characterized by strong structural deformation [21].
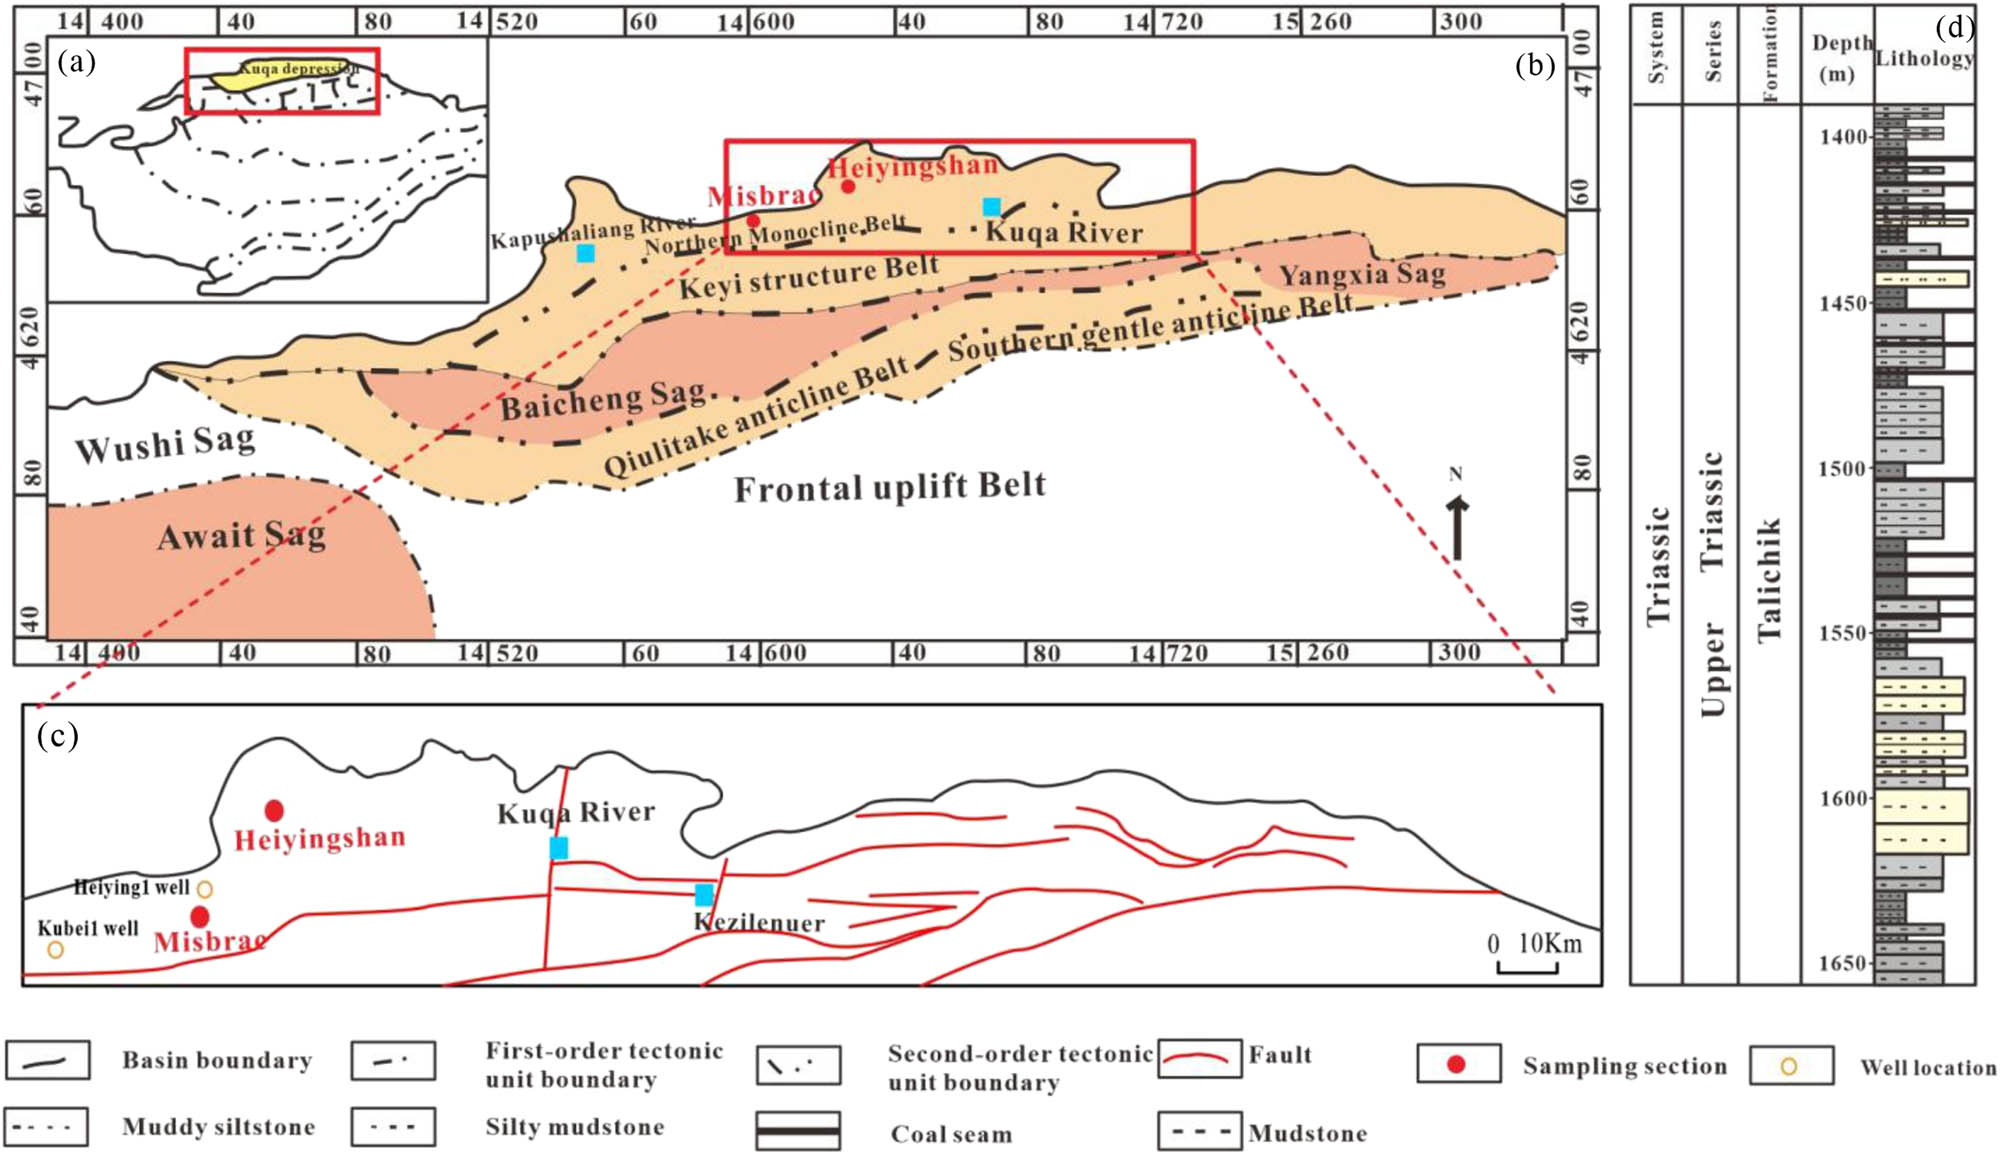
Study area location (a), tectonic unit division map of the Kuga Depression (b), sampling outcrop (c), and stratigraphic column of Triassic in northern Kuqa Depression (d).
The current stratigraphy revealed by outcrops and drilled wells in the study area primarily consists of Mesozoic–Cenozoic formations, with the Middle Jurassic Kyzylnur Formation and the Upper Triassic Talichik Formation identified as coal-bearing strata. During the period of coal seam development, the geological activities in the Southern Tianshan region were relatively stable, resulting in a limited impact of geological movements on changes in the depositional environment. Climate during this time largely regulated the depositional environment in the Kubei–Bashi tectonic belt [22]. The 13 coal samples in this study were mainly collected from the Upper Triassic Talichik Formation in the Misbrak section and Heiyingshan section in the Kubei–Bashi area, where fluvial and lacustrine depositional systems were prevalent during the depositional period of the Talichik Formation.
2.2 Experimental methods and computational theory
2.2.1 Experimental methods
The first step involved the microscopic identification of coal rock components based on the color, morphology, and structure of the coal samples. Then, the maceral analysis of the light section, prepared after crushing the coal seam, was carried out. The pulverized coal light sheet was examined under a reflective polarizing microscope using single polarization or incomplete orthogonal polarization. Accurate identification of macerals and minerals was achieved through quantitative analysis employing the number point method, as outlined in GB/T 8899 “Methods for Determination of Microscopic Components and Minerals of Coal.” Following this, the coal samples were ground into powdered form, and the vitrinite reflectance value (R o, max) was measured using a microspectrophotometer. Finally, the coal samples were placed in a 40–60 mesh sieve to grind 6–10 g for subsequent analytical testing.
In this study, we focus on the pore characteristics (2–100 nm) of adsorption pores in coal reservoirs. According to the IUPAC pore classification method, pores with diameters of 0.4–2 nm are considered micropores, and pores with diameters of 2–100 nm are considered mesopores. The characterization of micropore structures involved the LPCO2 GA test, whereas the LPN2 GA test was employed for the characterization of mesopore structures.
2.2.2 Classification of coal facies
Various coal facies samples have been proposed in previous studies, forming the basis of classical coal facies research methods. Parameters, such as gelatinization index (GI), tissue preservation index (TPI), vegetation index (VI), groundwater index (GWI), vegetation index (VI), vitrinite/inertinite ratio (V/I), along with graphical analytical methods, such as TPI–GI phase diagrams and VI–GWI phase diagrams, have been popularly cited [23,24].
The more commonly cited methods for coal facies analysis include TPI, GI, VI, GWI, and GI–TPI phase diagram [25]. Upon the development and improvement of the calculation method, the formulae are as follows:
TPI = (telinite + colotelinite + semifusinite + fusinite)/(colodetrinte + macrinite + inertodetrinite)
GI = (vitrinite + macrinite)/(semifusinite + fusinite + inertodetrinite)
GWI = (gelinite + corpogelinite + minerals + vitrodetrinite)/(telinite + telocolinite + colodetrinite)
VI = (colotelinite + fusinite + semifusinite + suberinite + resinite)/(colodetrinite + inertodetrinite + alginite + liptodetrinite + sporinite + cutinite)
GI reflects the ratio of gelation products to non-gelation products. It can not only indicate the characteristics of water level changes in ancient peat bogs but also reflect the extent to which plant remains have been subjected to gelatinization. TPI represents the ratio of structural microscopic components to unstructured microscopic components in the vitrinite and inertinite, reflecting the degree of the well-preserved plant cell structure and the intensity of plant tissue degradation. GWI and VI signifies the degree of gelation of the fabrics depending on pH conditions [23,24].
2.2.3 Single-fractal model
The Frenkel–Halsey–Hill (FHH) model is the most widely used single-fractal model for analyzing liquid nitrogen test data [26]. Fractal values in this model are mainly obtained by linear fitting of adsorption and relative pressure. This fractal model can provide a detailed analysis of pore heterogeneity in the pore size range of 2–100 nm, with the fractal dimension calculated as follows:
Here, V is the adsorption volume corresponding to the equilibrium pressure P, cm3 g−1; C is a constant; V 0 is the adsorption volume of the monomolecular layer of gas, cm3 g−1; P 0 is the saturated vapor pressure, MPa; and A is the power law index, and its value is controlled by the fractal dimension (D), where a larger value of D indicates stronger pore heterogeneity.
Based on the CO2 adsorption test results, the fractal model was used to study the heterogeneity of micropores. The equation can be expressed as
where S r is the cumulative specific surface area, m2 g−1; r is the pore radius, nm; and D is the fractal dimension, dimensionless; surface fractal dimension D = 2 + C or D = (C – 3)/3. A larger D value indicates stronger heterogeneity of pores.
2.2.4 Multi-fractal model
Multiple fractal allows for a more detailed characterization of the complexity and heterogeneity of the sample. For reservoirs with strong heterogeneity, such as coal reservoirs, the pore size distribution curve will not only fluctuate but also jump randomly. In addition, different pore spacing parts are similar, making multifractals advantageous for calculating nanopore distribution heterogeneity [27,28]. Multifractal calculation results include two forms from previous studies, i.e., a∼f(a) singular and q∼D fractal dimension spectrum. It can be concluded that the two forms have an explicit correlation [29]. Therefore, in this study, the q∼D fractal dimension spectrum is selected to describe the multifractal results of coal samples. The formula is as follows:
where q is the index representing the fractal characteristics of objects at different scales.
Therefore, the generalized dimension (D q ) can be defined as
When q = 1, D q becomes
Relevant parameters include D min, D max, D 0, D 0 – D max, and D min – D 0. Multifractal results calculated from the adsorption data show that in the low-value zone of pore volume, a larger D min – D 0 indicates a stronger heterogeneity in pore size distribution [30]. In the high-value zone of pore volume, increasing D 0 – D max indicates a stronger heterogeneity in pore size distribution.
3 Results and discussion
3.1 Coal sample characterization and coal facies classification
The results of the industrial analysis of the samples, as well as the maceral contents, are shown in Table 1. The macroscopic coal rock type in the study area is dominated by the semi-bright type, and R o,max of the coal samples in the Misbrak section ranges from 1.08 to 1.42%, indicating a higher degree of thermal evolution (Table 1). The organic maceral group is predominantly composed of vitrinite, followed by inertinite, and negligible exinite content. Within the vitrinite maceral subgroup, desmocollinite is the predominant component, followed by vitrodetrinite and telocollinite. The inertinite maceral subgroup is primarily comprised of semifusinite, with minor amounts of macrinite and inertodetrinite (Figure 2). The R o,max of coal samples from the Heiyingshan section ranges from 0.70 to 0.82%, and the organic maceral group is dominated by inertinite and exhibits the lowest exinite content. The industrial analysis parameters indicate that all coal samples have the highest fixed carbon content, and the volatile content generally exceeds the ash and moisture content.
Maceral contents and industrial analysis results of coal samples
| Section | Sample no. | R o,max (%) | Vitrinite (%) | Exinite (%) | Inertinite (%) | Mineral matter (%) | M ad (%) | A ad (%) | V daf (%) | FCad (%) |
|---|---|---|---|---|---|---|---|---|---|---|
| M-1 | 1.31 | 89.14 | 0 | 8.99 | 1.87 | 0.86 | 7.10 | 24.89 | 69.78 | |
| M-2 | 1.23 | 87.01 | 0 | 11.42 | 1.57 | 0.80 | 2.96 | 25.88 | 71.93 | |
| M-3 | 1.11 | 45.75 | 0 | 7.08 | 47.17 | 1.25 | 51.84 | 30.72 | 33.37 | |
| M-4 | 1.19 | 91.04 | 0 | 1.08 | 7.88 | 0.65 | 18.98 | 23.43 | 62.03 | |
| M-5 | 1.19 | 56.54 | 0 | 7.01 | 36.45 | 0.45 | 22.68 | 40.09 | 46.32 | |
| Misbrak | M-6 | 1.21 | 76.95 | 0 | 9.66 | 13.39 | 0.82 | 2.66 | 22.33 | 75.60 |
| M-7 | 1.17 | 56.06 | 0.76 | 18.94 | 24.24 | 0.92 | 5.08 | 27.89 | 68.45 | |
| M-8 | 1.08 | 51.58 | 6.66 | 41.06 | 0.7 | 0.70 | 4.11 | 26.93 | 70.07 | |
| M-9 | 1.42 | 58.65 | 0 | 25.56 | 15.79 | 0.86 | 41.56 | 22.59 | 45.24 | |
| M-10 | 1.11 | 70.86 | 0 | 26.98 | 2.16 | 0.94 | 22.92 | 25.16 | 57.69 | |
| H-1 | 0.70 | 33 | 6.27 | 59.08 | 1.65 | 1.31 | 3.65 | 33.40 | 64.17 | |
| Heiyingshan | H-2 | 0.82 | 33.61 | 1.66 | 56.43 | 8.3 | 2.06 | 39.45 | 38.55 | 37.21 |
| H-3 | 0.71 | 21.89 | 0.38 | 75.09 | 2.64 | 0.96 | 1.60 | 34.76 | 64.20 |

Maceral photomicrographs. (a) M-2, telocollinite (C1), (b) M-3, macrinite (Ma), (c) M-6, semifusinite (Sf), (d) M-7, desmocollinite (C2), (e) M-10, vitrodetrinite (Vd), (f) M-10, inertodetrinite (Id) and desmocollinite (C2), (g) H-1, semifusinite (Sf), (h) H-2, telocollinite (C1), (i) H-3, semifusinite (Sf) and pyrite (Py).
The coal samples selected for this study have similar maturity levels, classified as medium-rank coal (Table 1), with minimal structural variation. Analysis of submicroscopic component images and mineral content shows that the coal surface structure in the study area is smooth, containing clay minerals and pyrite. Coal reservoirs developed in coal facies A are rich in vitrinite, with well-developed micropores. The pyrite filling these micropores influences the pore structure development. In contrast, coal reservoirs in facies B and C have higher inertinite content, characterized by well-developed microfractures filled with clay minerals. Compared to Facies A, Facies B and C have less micropores development but more mesopores and macropores, with pore structure influenced by clay minerals. The observed mineral types in microphotographs align with descriptions from hand specimen analyses.
Table 2 shows the division parameters of coal facies. The TPI–GI diagram reflects the conditions of coal-forming plant swamp media and provides information about the depositional environment during peat aggregation. The coal facies are classified into three types based on TPI and GI, namely low swampy reed phases (Type A, GI > 5, TPI < 1), wetland herbaceous swamp phases (Type B, GI < 5, TPI < 1), and dry forest swamp phases (Type C, GI < 1, TPI > 1). Coal facies A is characterized by the highest GI and lowest TPI values, indicative of a wet overlying water depositional environment; coal facies C exhibits the lowest GI and highest TPI values, suggesting a dry depositional environment (Figure 3).
Coal facies division parameters
| Section | Sample no. | R o,max (%) | TPI | GI | VI | GWI | V/I |
|---|---|---|---|---|---|---|---|
| M-1 | 1.31 | 0.24 | 11.33 | 0.24 | 0.02 | 9.92 | |
| M-2 | 1.23 | 0.57 | 8.22 | 0.58 | 0.02 | 7.62 | |
| M-3 | 1.11 | 0.09 | 7.62 | 0.09 | 1.05 | 6.47 | |
| M-4 | 1.19 | 1.03 | 0.61 | 1.00 | 0.26 | 0.60 | |
| Misbrak | M-5 | 1.19 | 0.63 | 2.33 | 0.63 | 0.28 | 2.29 |
| M-6 | 1.21 | 2.01 | 0.30 | 2.04 | 0.12 | 0.29 | |
| M-7 | 1.17 | 0.09 | 84.67 | 0.09 | 0.09 | 84.67 | |
| M-8 | 1.08 | 0.31 | 2.78 | 0.31 | 0.03 | 2.63 | |
| M-9 | 1.42 | 0.08 | 9.46 | 0.08 | 0.66 | 8.07 | |
| M-10 | 1.11 | 0.15 | 8.27 | 0.15 | 0.21 | 7.97 | |
| H-1 | 0.70 | 1.30 | 0.60 | 1.18 | 0.05 | 0.56 | |
| Heiyingshan | H-2 | 0.82 | 0.47 | 2.96 | 0.46 | 0.53 | 2.96 |
| H-3 | 0.71 | 0.61 | 1.34 | 0.56 | 0.01 | 1.26 |
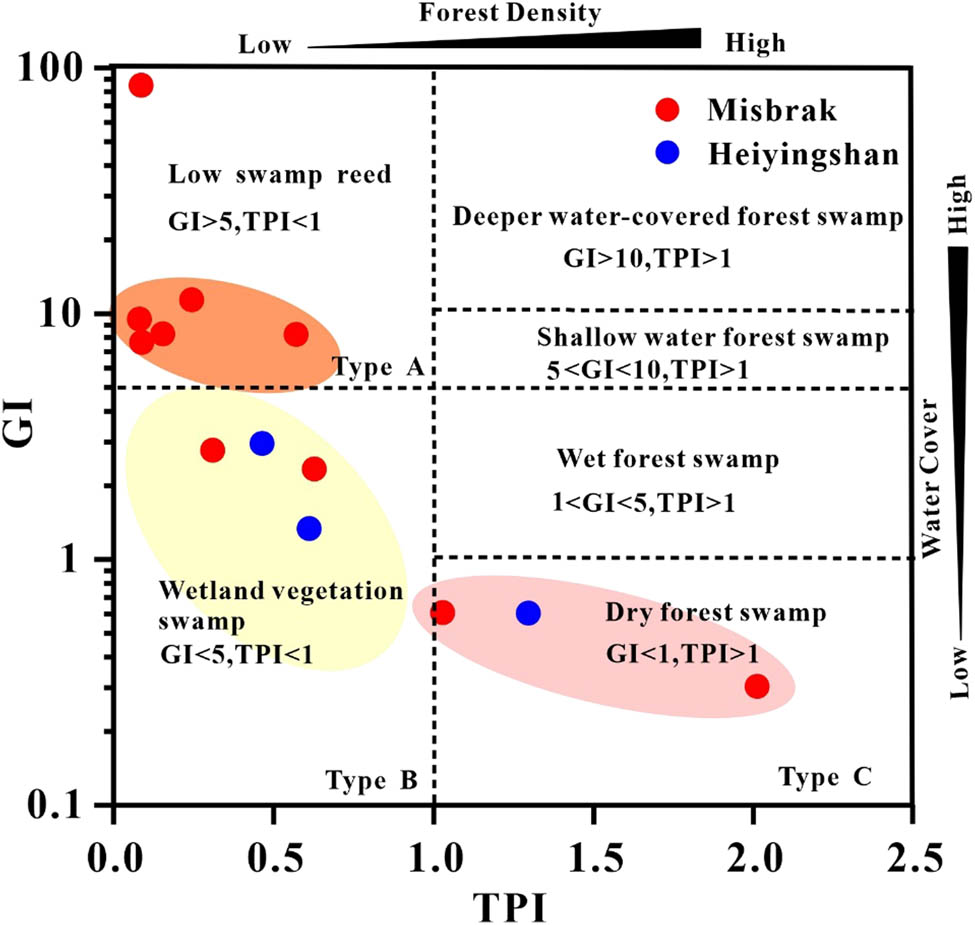
Classification of coal facies.
3.2 Effect of coal facies on 0.4–1.2 nm pore heterogeneity
3.2.1 Micropore distribution of samples with different coal facies types
The CO2 adsorption curve reflects the pore size distribution of micropores. Figure 4a, c, and e show that the adsorption volumes of coal samples in coal facies A, B, and C are 5.77–12.15 cm3 g−1, 6.64–13.35 cm3 g−1, and 7.45–9.42 cm3 g−1, respectively (Figure 4a, c, and e). The micropore distribution curves of all coal samples show two pore peaks at about 0.55 and 0.85 nm, respectively. The peak of the pore size distribution curves of coal facies B and C showed an inverted U-shape at 0.55 nm compared with that of coal facies A, which indicated that the pore size development is more homogeneous (Figure 4b, d, and f).

CO2 adsorption curves of coal samples (a, c, e) and micropore distribution of different coal facies samples (b, d, f).
The volume and specific surface area of micropores are similar across three coal facies (Figure 5a and b), and also the pore volume percentage for the micropores of 0.40–0.55 nm, 0.55–0.85 nm, and 0.85–1.2 nm are similar among the three facies types (Figure 5c), showing that the coal facies types have little effect on the pore structures of micropores.

Comparison of structure parameters of micropores. Specific surface area of different coal facies types (a), pore volume of different coal facies types (b), and pore volume percentage of different coal facies types (c).
Although the pore size distribution curves show some differences across coal facies types, the peak pore size distribution is similar among the different coal types. Generally, micropores contribute the majority of pore volume (averaging 88%), followed by mesopores (averaging 8%), with macropores contributing the least pore volume (averaging 4%) (Figure 6a). The distribution characteristics of specific surface area also vary across coal facies types. Micropores typically provide most of the specific surface area (averaging 95%), with mesopores contributing around 5% and macropores contributing a negligible amount (Figure 6b). This indicates that micropores are well-developed in deep coal reservoirs. The pore volume and specific surface area distribution trends are consistent across different coal facies types, as the pore size range aligns with the development of the specific surface area. Moreover, micropores play a dominant role in contributing to both pore volume and specific surface area, suggesting that the primary sites for coalbed methane adsorption and storage are micropores with high specific surface areas, which also serve as effective pathways for initial gas migration and diffusion after desorption.

Distributions of the pores of different coal facies types: (a) the percentage of pore volume and (b) the percentage of specific surface area.
Previous studies have found that exinite and inertinite contain fewer pores, whereas pores are well-developed in vitrinite, and the abundance of mineral pores is related to the types of minerals present in coal. Coal facies A is characterized by a high vitrinite content with well-developed micropores and relatively low permeability, whereas coal facies C, characterized by high inertinite content, exhibits more meso- to macropores and higher permeability (Figure 7a and b). Compared to inertinite, vitrinite shows a positive correlation with micropore volume, indicating that vitrinite plays a role in controlling micropore development (Figure 7c and d).
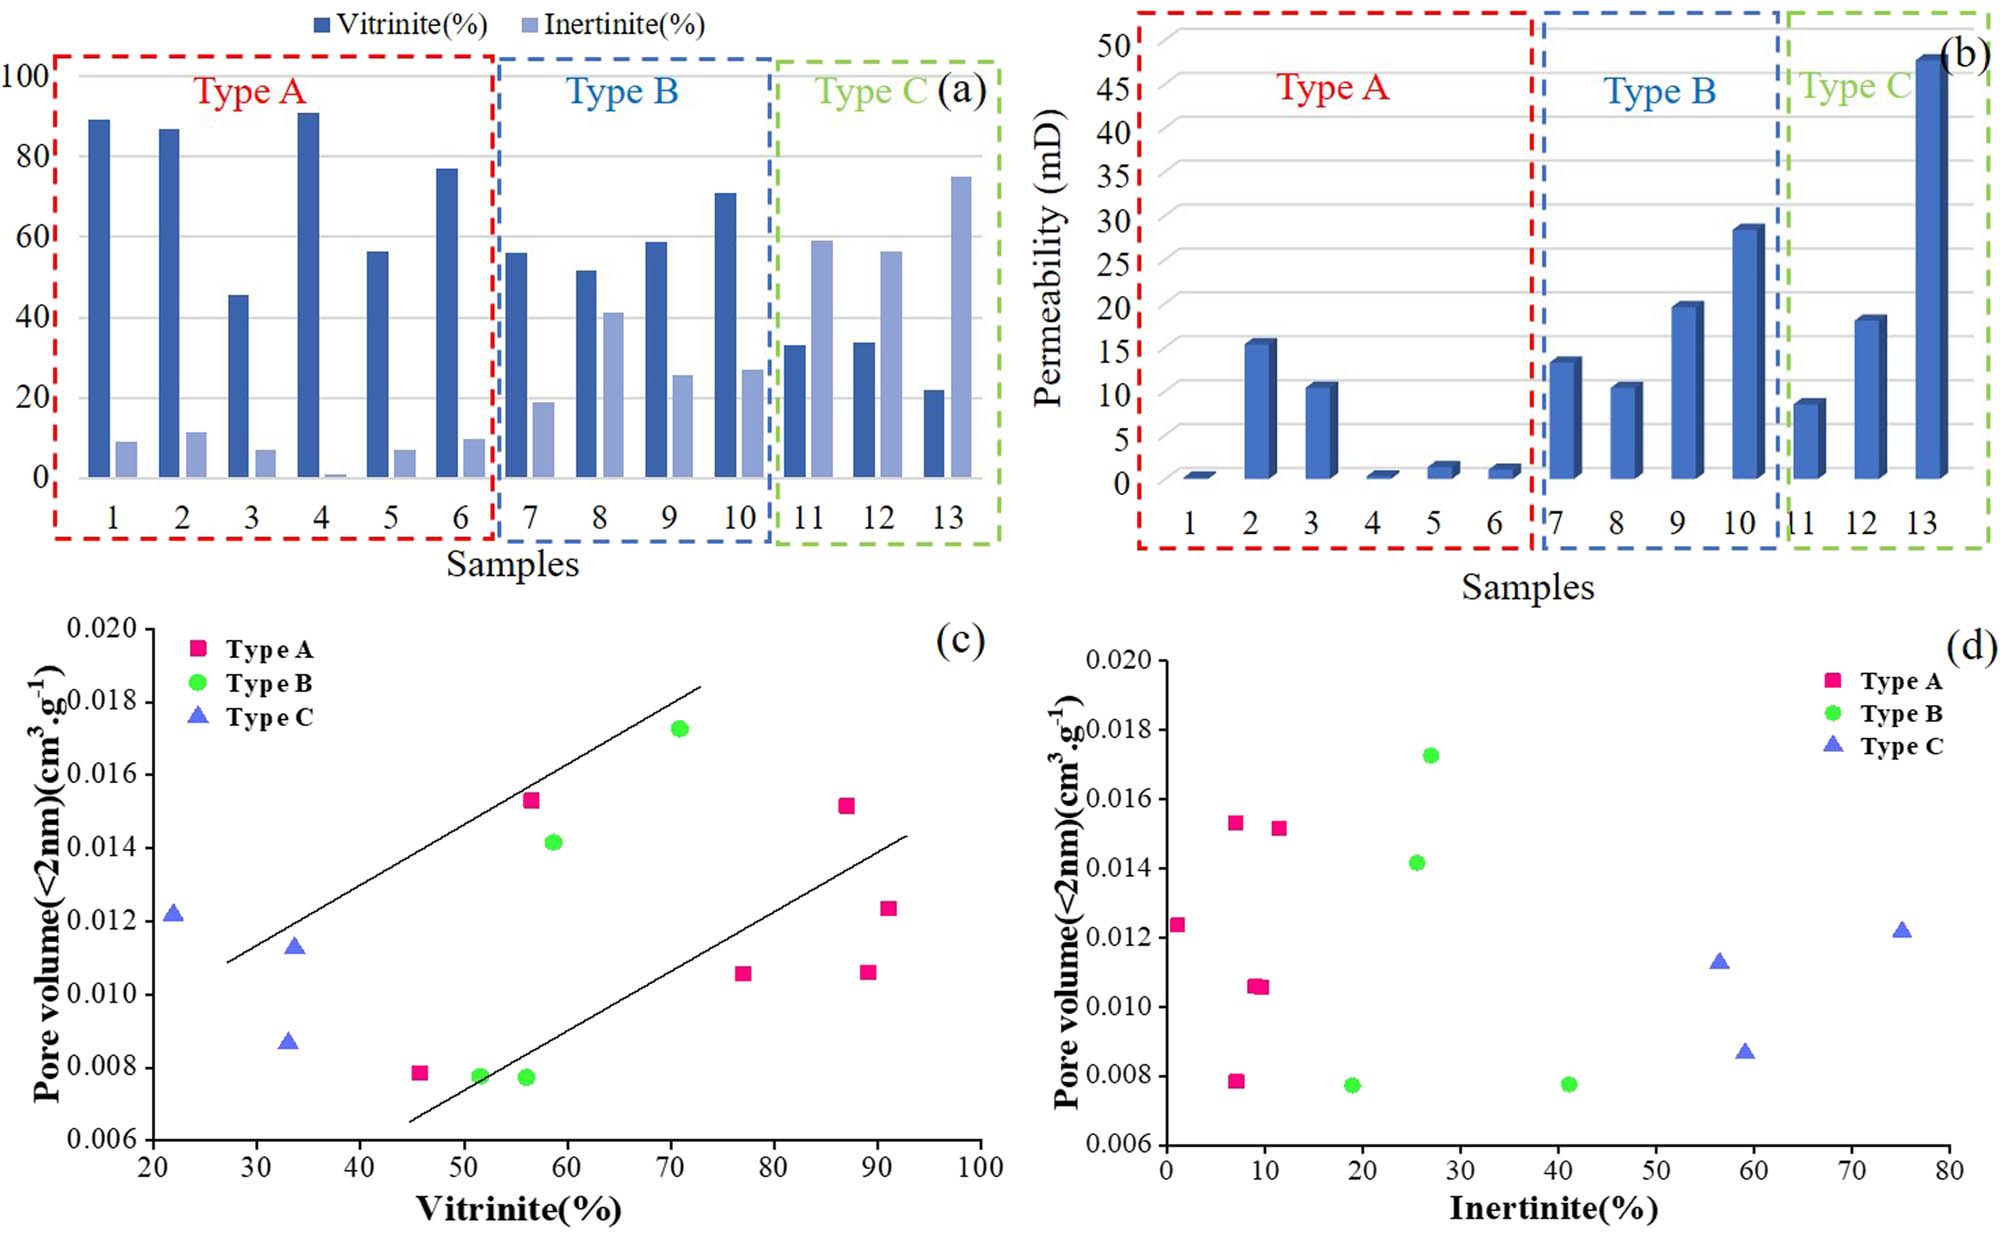
Vitrinite and inertinite content of different samples (a), permeability data (b), and the relationship between micropore volume and submicroscopic components (c and d).
Figure 8 shows a strong positive correlation between R o,max of micropores, and both pore volume and specific surface area. As R o,max increases, the pore volume of each sample increases linearly, accompanied by an increase in specific surface area. This is primarily due to an increase in coal maturity, where macropores gradually decrease while micropores, such as adsorption pores, increase. The R o,max values for all samples range from 0.65 to 2%, classifying them as medium-rank coal. However, there are differences in R o,max values across different coal facies types: coal facies A has the highest average R o,max (average 1.23%). The samples from coal facies A also show the largest pore volume and specific surface area, consistent with the higher vitrinite content characteristic of this facies.

Relationship between micropore volume and R o, max.. Crossplots of R o, max. and pore volume (a) and crossplots of R o, max. and specific surface area (b).
3.2.2 Single-fractal analysis based on carbon dioxide adsorption curves
The micropore fractal characteristics are analyzed using the CO2 adsorption data (Figure 9). The results indicate that there exist differences in the two segments of the single-fractal curve of micropores before and after the critical diameter, taken as 0.6 nm. This division illustrates the heterogeneity of the pore distribution for pores smaller than 0.4–0.6 nm and 0.6–2.0 nm.

Fractal curves of micropore distribution. Single fractal curves of coal facies A (a), single fractal curves of coal facies B (b), and single fractal curves of coal facies C (c).
The demarcation point of the fractal curve is approximately ln (r) = −0.5 (r = 0.60 nm), indicating significantly different fractal characteristics (Figure 9). Calculations confirm that this value corresponds to the position of peak 1 in Figure 4b, d, and f. Therefore, the fractal demarcation point is determined to be the average peak position of 0.60 nm. The fractal dimension for each sample comprises two parameters, namely D s1 (r < 0.6 nm) and D s2 (r > 0.6 nm). The results show that D s1 ranges from 1.76 to 5.3 (Figure 10a), which falls outside the typical fractal range of D between 2 and 3 [30,31,32]. This deviation is primarily attributed to the limited pore data points in the range of 0.47–0.60 nm during the testing process, resulting in a calculation range of only 0.13 nm. To ensure accurate calculations, this section focuses in terms of fractals only on micropores larger than 0.60 nm.

D S1 of different coal facies types (a) and D S2 of different coal facies types (b).
The calculated D s2 values range from 2.77 to 2.95, demonstrating clear fractal characteristics. The D s2 values for coal facies A, B, and C are 2.77–2.95, 2.84–2.86, and 2.83–2.86, respectively (Figure 10b). The D s2 values exhibit minimal variation among different coal facies types, indicating that coal facies has a limited effect on micropore development, a conclusion supported by Figure 5. However, the D s2 values of coal facies A (2.77–2.95) are larger than those of other types, suggesting that the samples in coal facies A have the strongest heterogeneity in the 0.6–1.2 nm pore distribution range.
3.2.3 Multi-fractal analysis based on CO2 adsorption curves
The single fractal cannot fully characterize the heterogeneity differences of micropores. In this article, the q ∼ D fractal dimension spectrum is selected to describe the multifractal results. Taking the sample M-2 as an example, the relationship between lg(x(q, ε)) and lg(ε) was studied (Figure 11a). There is a good linear relationship between q and i(q) (Figure 11b), and as q increases i(q) increases monotonically, illustrating multi-fractal behavior in micropore size distribution. Significant differences in D 0 – D 10 and D −10 – D 0 among all samples indicate substantial variations in pore volumes within the micropore range (Figure 11c, d, and f). D 0 – D 10 exhibits less variation among all samples, whereas D −10 – D 0 displays more variability among different coal facies types. Specifically, D −10 – D 0 for coal facies A, B, and C ranges from 0.1 to 0.22, 0.09 to 0.16, and 0.12 to 0.18, respectively.

Multifractal curves characteristics of micropores. The linear relationship between q and i(q) (a, b), and the linear relationship between q and D(q) in different coal facies types (c–e).
D −10 (1.13–1.15) and D 10 (0.97–0.98) exhibit less variation among all samples (Figure 12a and b). The values of D −10 – D 0 and D 0 – D 10 are larger for coal facies A compared to other types, suggesting stronger heterogeneity in micropore distribution in both the low- and high-pore-volume development areas of this coal facies (Figure 12c and d). D −10 – D 10 of coal facies A is 1.1–1.22 (Figure 12e), surpassing other types, further emphasizing the stronger heterogeneity in micropore distribution for coal facies A.

Comparison of multi-fractal characteristics between different coal facies types. D 10 and D ‒10 of different coal facies types (a, b), the relationship between D 10, D ‒10 and D 0 (c–e).
As D −10 – D 0 increases, D −10 – D 10 increases linearly with an R 2 of 0.98, and D 0 – D 10 increases similarly (Figure 13a), indicating that the lower pore volume area controls the heterogeneity of the micropore size distribution. The volume percentage of pores smaller than 0.55 nm increases progressively with D −10 – D 0, and the heterogeneity of the micropore size distribution is impacted by pores smaller than 0.55 nm.
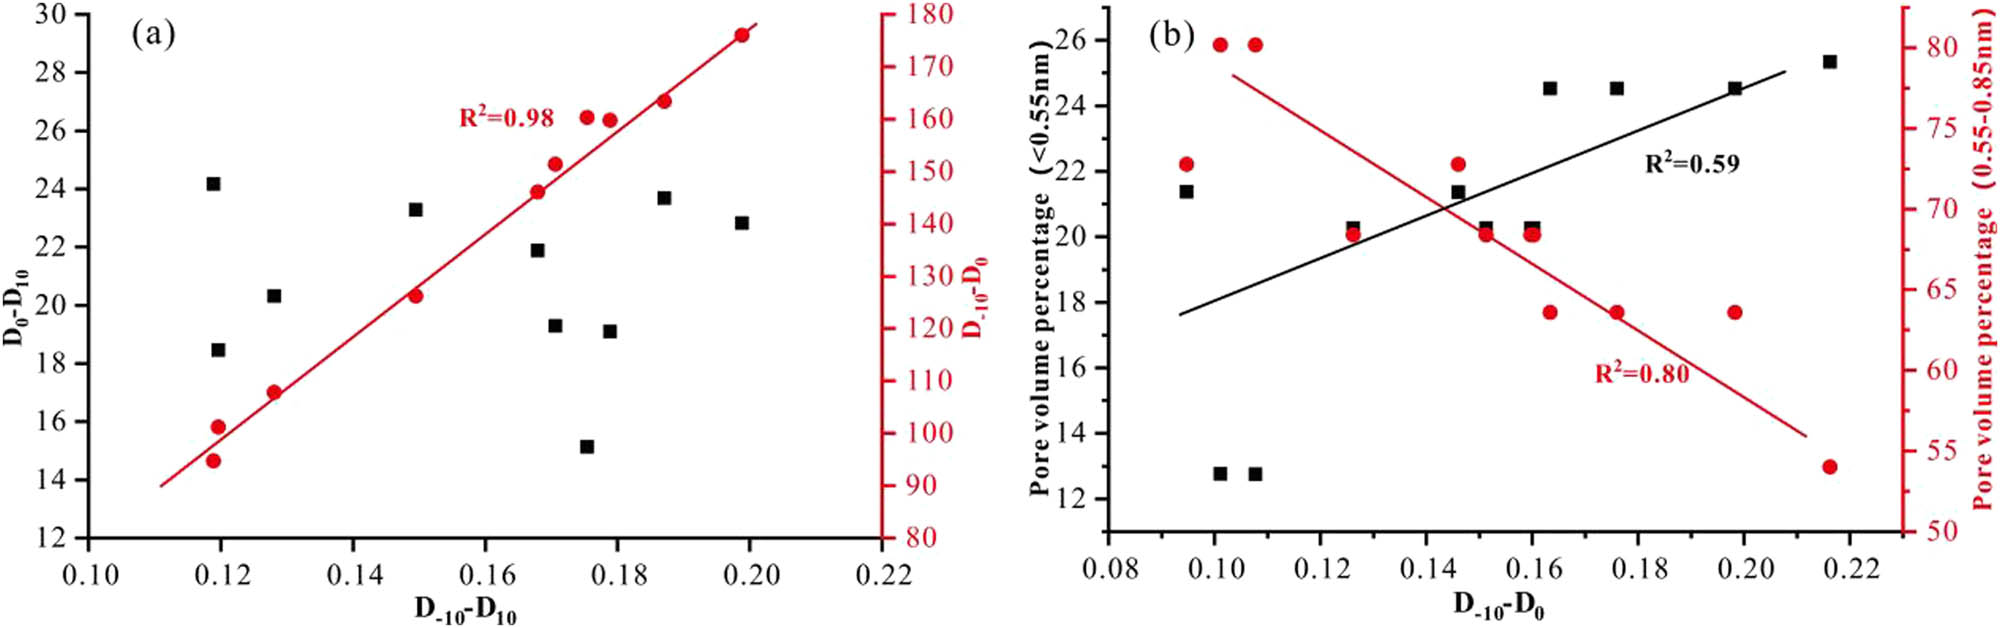
Relationship between multi-fractal and pore structure parameters. Plots of D ‒10 – D 10 and D 0 – D 10 (a), the relationship between D ‒10 – D 0 and pore structure parameters (b).
3.3 Effect of coal facies on 2–100 nm pore heterogeneity
3.3.1 Mesopore distribution of samples of different coal facies types
The N2 adsorption curve reflects the pore size distribution of mesopores. The total adsorption volume for coal facies A ranges from 0.71 to 8.64 cm3 g−1, and that for coal facies C is 0.56–0.89 cm3 g−1 (Figure 14a, c and e). Coal facies A exhibits separated adsorption–desorption curves with clear hysteresis loops (except for sample M-2), suggesting the development of ink-bottle pores with a more complex pore structure. Conversely, coal facies C displays coinciding adsorption–desorption curves, indicating well-developed open pores are a simpler pore structure. Coal facies B, represented by varying adsorption and desorption curve morphologies, shows obvious hysteresis loops and ink-bottle pores in samples H-2 and H-3, while samples M-5 and M-8 display open pores. Coal facies B samples are in a transitional stage between coal facies A and C, exhibiting relatively complex variations (Figure 14a, c, and e). Two peaks are shown in mesopore distribution curves at about 10 nm and 45 nm (Figure 14b, d, and f).

N2 adsorption curves of coal samples (a, c, e) and mesopore size distribution of different coal facies samples (b, d, f).
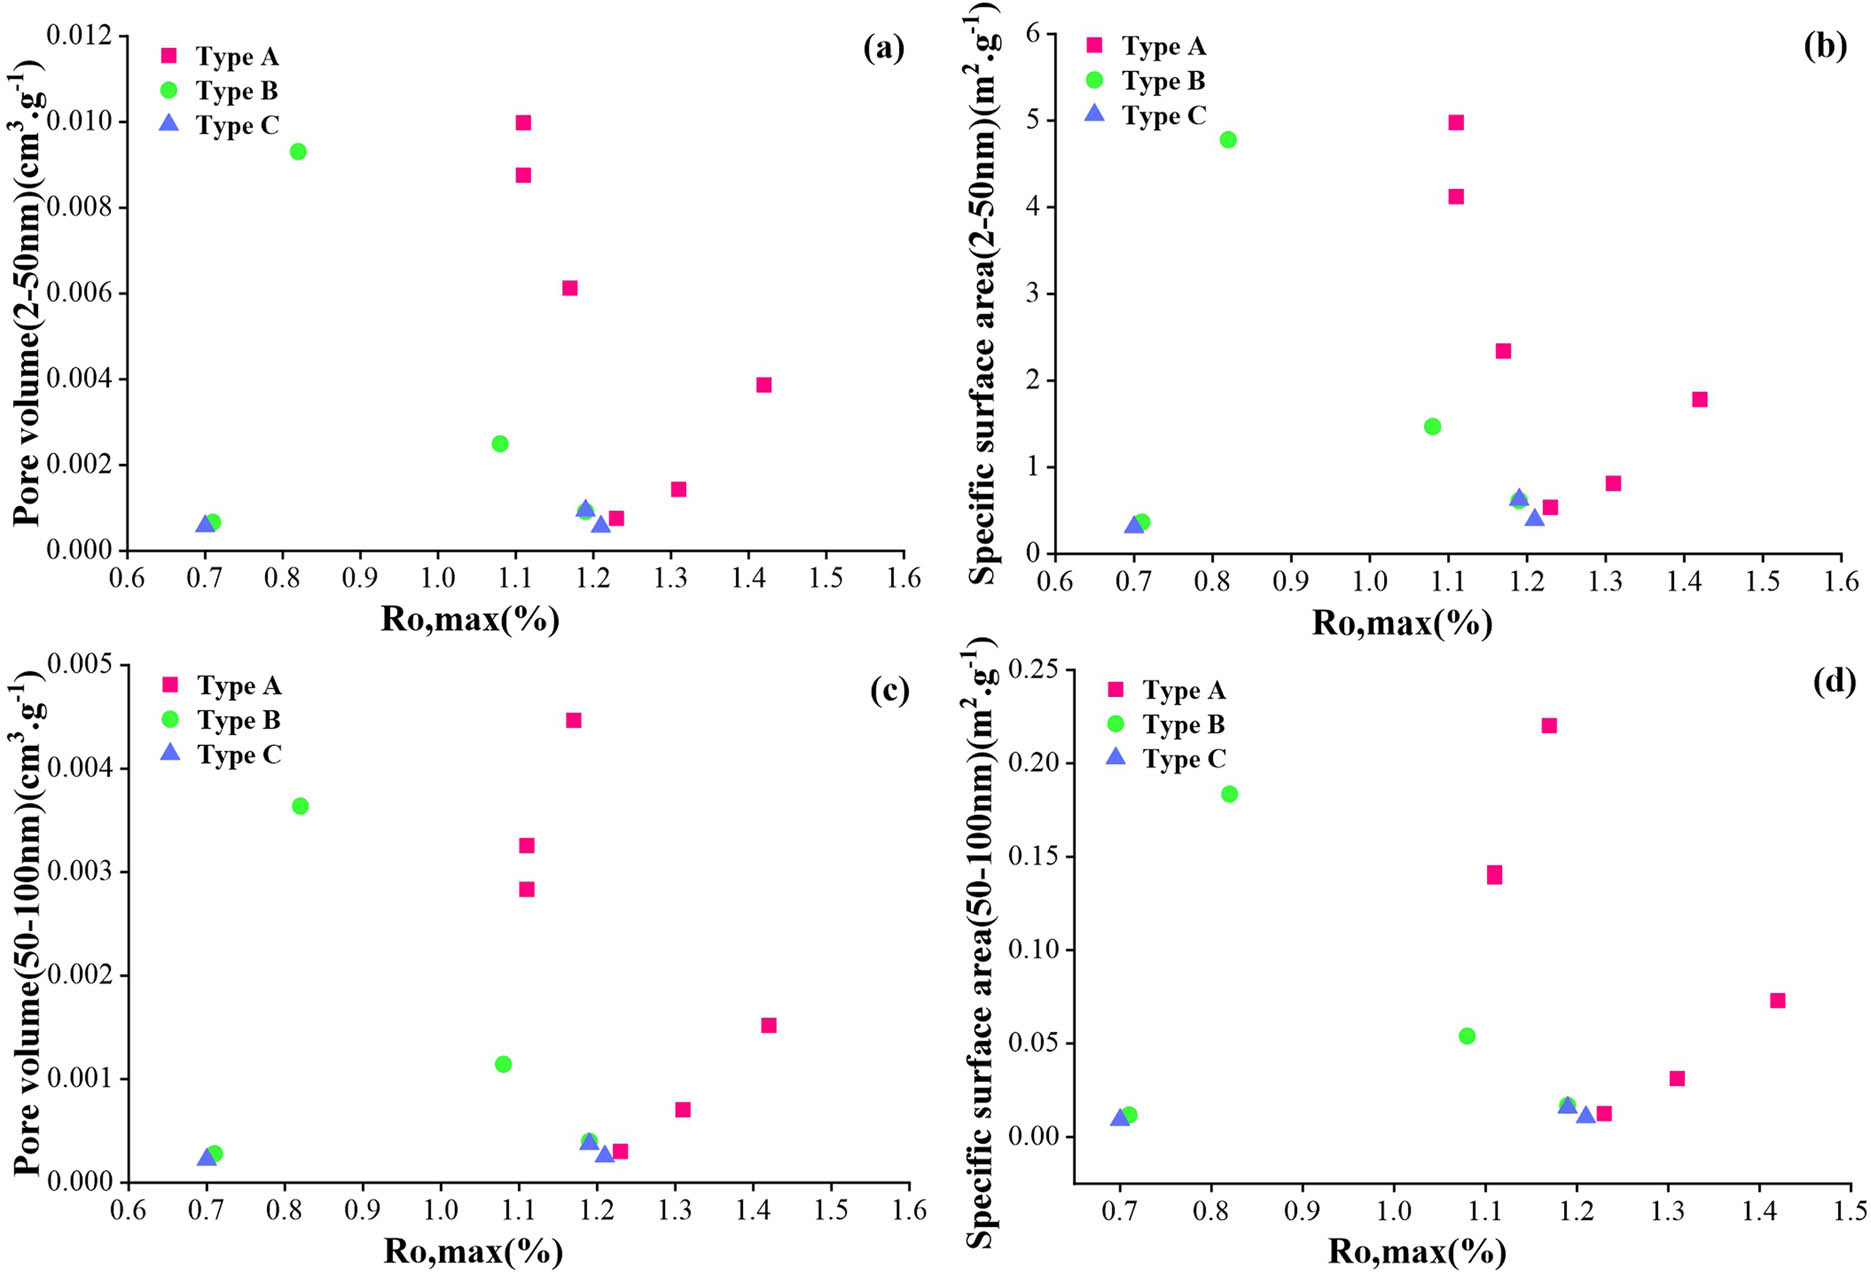
The pore volume and specific surface area of mesopores are the largest for coal facies A (0.007 cm3 g−1 and 2.5 m2 g−1), indicating the most developed mesopores in coal facies A (Figure 15a and b). The percentage of pore volume with a diameter of 2–10 nm in coal facies A is the lowest among the three coal facies, whereas the volume percentage of 10–50 nm pores in coal facies A is much higher than that of other coal facies (Figure 15c). These results underscore the influence of coal facies type on mesoporous structure development.

Comparison of mesopore structural parameters among different coal facies samples. Specific surface area of different coal facies types (a), pore volume of different coal facies types (b), and pore volume percentage of different coal facies types (c).
Compared to micropores (Figure 8), the pore volume and specific surface area of 2–100 nm pores show a weaker correlation with R o,max (Figure 16). It is suggested that the pore structure within this range is influenced not only by coal maturity but also by fundamental coal parameters such as moisture and ash content, making the structural variations of these pores more complex than those of micropores.
Relationship between mesopore volume and R o, max. Crossplots of R o, max and pore volume (a, c) and crossplots of R o, max and specific surface area (b, d).
The specific surface area of 2–50 nm and 50–100 nm pores shows a weak correlation with vitrinite content (Figure 17a and c), while a certain correlation exists with inertinite content. As inertinite content increases, the specific surface area of the pores decreases (Figure 17b and d). Compared to coal facies A, coal facies B and C have higher inertinite content, fewer micropores, poorer adsorption capacity, and more developed mesopores and macropores, resulting in higher permeability. This indicates that inertinite plays a controlling role in coal reservoirs where meso- and macropores are predominant.

Relationship between mesopore-specific surface area and vitrinite (a, c), and relationship between mesopore-specific surface area and inertinite (b, d).
3.3.2 Single-fractal analysis based on N2 adsorption and desorption curves
The N2 adsorption curve is employed to examine the mesopore fractal dimension, with limited studies conducted on the fractal dimension of the desorption curve. It was found that the fractal values obtained by the liquid nitrogen desorption curve are also physically meaningful [33]. Utilizing the FHH model, all coal samples are subjected to a single fractal, and the fractal dimension is calculated (Figure 18). Figure 18 shows that the two sections of the fractal curves are roughly circumscribed by P/P 0 = 0.5, which corresponds to a pore size of 4 nm.

Fractal curves of mesopores using N2 adsorption desorption data (a, c, e) and N2 desorption data (b, d, f).
The single fractal dimension contains four parameters in each coal sample, i.e., D 1 (P/P 0 < 0.5, in the adsorption curve), D 2 (P/P 0 > 0.5, in the adsorption curve), D 3 (P/P 0 > 0.5, in the desorption curve), and D 4 (P/P 0 < 0.5, in the desorption curve). The fractal dimension values are the following: D 1 = 2.05–2.71, D 2 = 2.37–2.66, D 3 = 2.57–2.76, and D 4 = 2.25–2.69. These values fall within the defined fractal range of 2–3, indicating clear fractal characteristics across the entire pressure range.
Previous research has demonstrated that the fractal dimension value obtained by P/P 0 < 0.5 represents the heterogeneity of pore volume and reflects the pore space morphology [34]. Similarly, values obtained for P/P 0 > 0.5 also represent the heterogeneity of pore surface area and reflect the pore surface morphology. Compared to coal facies B and C, the fractal curves of coal facies A are nearly straight lines, indicating consistent heterogeneity in the mesopore distribution of coal facies A samples (Figure 18a, c, and e). The fractal slopes obtained from the desorption curves range between −0.75 and −0.25, indicating fractal significance (Figure 18b, d, and f). The four parameters of coal facies A are larger than those of the other two coal facies, which indicates that the heterogeneity of mesopore restricted by coal facies A is the strongest (Figure 19).

D 1 values of different coal facies types (a), D 2 values of different coal facies types (b), D 3 values of different coal facies types (c), D 4 values of different coal facies types (d).
A linear positive correlation exists between D 1 and D 3 (R 2 = 0.73), indicating that the liquid nitrogen desorption curve conforms to the fractal condition and exhibits fractal significance (Figure 20a). Additionally, D 1 and the volume percentage of pores with 10–50 nm have a linearly positive association. (Figure 20b), indicating that the mesopore distribution heterogeneity is regulated by pores of 10–50 nm. This also indicates that D 1 reflects the volume roughness of the pore structure, aligning with previous experimental observations [35].

Multi-fractal dimension correlation. The relationship between D 1 and D 3 (a), relationship between D 1 and pore volume percentage (b).
3.3.3 Multi-fractal analysis based on N2 adsorption and desorption curves
Taking the sample M-1 as an example, the relationship between lg(x(q, ε)) and lg(ε) was studied. When q < 0, i(q) increases with an increase of q, while when q > 0, the increase of i(q) is not obvious (Figure 21b). This pattern suggests a multi-fractal behavior in mesopore size distribution. D 0 – D 10 and D −10 – D 0 showed significant differences across all samples, indicating substantial variations in mesopore volumes. D −10 – D 0 varies more among different coal facies, with D −10 – D 0 values for coal facies A, B, and C ranging from 0.34 to 0.94, 0.39 to 0.74, and 0.47–0.83, respectively (Figure 21c, d and f).

Multifractal curves characteristics of mesopores. The linear relationship between q and i(q) (a, b), and the linear relationship between q and D(q) in different coal facies types (c–e).
In the low-value zone of pore volume, a larger D min – D 0 indicates stronger heterogeneity. In addition, in the high-value zone, increasing D 0 – D 10 indicates stronger heterogeneity in pore size distribution. D 10 (0.085–0.105) for the coal facies types show minimal differences, with the D −10 of coal facies A higher than that of coal facies B and C (Figure 22a and b). These results suggest that the mesopore distribution in coal facies B and C is more homogeneous compared to coal facies A. The D −10 – D 0 and D 0 – D 10 of coal facies A are the largest compared to coal facies B and C, suggesting that coal facies A is more heterogeneous in the pore-volume low-value zone and the pore volume of the high-value zone (Figure 22c and d). Figure 22e shows that the D −10 – D 10 of coal facies A is 2–8 (larger than other types), indicating an overall stronger heterogeneity of mesopore distribution.

Comparison of multi-fractal parameters in different coal facies types. D 10 and D ‒10 of different coal facies types (a, b), the relationship between D 10, D ‒10 and D 0 (c–e).
As D −10 – D 0 increases, D −10 – D 10 increases linearly with an R 2 of 0.99 (Figure 23a), indicating that the heterogeneity of the mesopore distribution is primarily governed by the lower pore volume area. Furthermore, D −10 – D 0 gradually increases with an increase in the volume percentage of pores of 10–50 nm, indicating that pores of 10–50 nm play a significant role in governing the heterogeneity of mesopores.

Correlation between multi-fractal parameters. Plots of D ‒10 – D 10 and D 0 – D 10 (a), the relationship between D ‒10 – D 0 and pore structure parameters (b).
4 Conclusions
In this study, coal facies were identified based on maceral characteristics. The micropore and mesopore size distribution of different coal samples was quantitatively characterized by low-temperature liquid nitrogen and carbon dioxide adsorption tests. Subsequently, the difference in volume and specific surface area distributions of nanopores in different coal facies samples were discussed. The heterogeneity of micropore and mesopore distributions was investigated. Eventually, the differences in the pore structures in different coal facies samples were clarified. The key findings are summarized as follows.
All coal samples can be categorized into three coal facies types: low marsh reed phase (A, GI > 5, TPI < 1), wetland grassy swamp phase (B, GI < 5, TPI < 1), and dry forest swamp phase (C, GI < 1, TPI > 1).
Low-temperature liquid nitrogen tests show that the coal facies controls the development characteristics of mesopores, with mesopore volume following the order: coal facies A > coal facies B > coal facies C, and mesopore specific surface area following the order: coal facies A > coal facies B > coal facies C.
Single-fractal analysis based on the N2 adsorption–desorption curve and CO2 adsorption curve show that the liquid nitrogen desorption curve conforms to the fractal conditions and exhibits fractal significance. Different fractal dimensions indicated that the coal facies A have the strongest heterogeneity.
Utilizing the multiple fractal theory to quantitatively characterize the heterogeneity of the pore structure, the multiple fractals results indicate that the heterogeneity of mesopores is regulated by pores of 10–50 nm, and pores smaller than 0.55 nm affect the heterogeneity of the micropore size distribution.
The coal reservoir under the wet overlying water depositional environment of coal facies A offers a relatively large pore volume as well as specific surface area, which is more favorable for the exploration and development of coalbed methane; therefore, it is the advantageous coal reservoir in the study area.
Acknowledgements
The authors are grateful for the reviewer s valuable comments that improved the manuscript. The datasets generated during and/or analysed during the current study are available from the corresponding author on reasonable request.
-
Funding information: This study was funded by the National Natural Science Foundation of China (Grant Nos 42072172 and 42372160).
-
Author contributions: Conceptualization: ZLY; methodology: CXC, ZJJ; formal analysis and investigation: ZLY, YP, LDJ, and SJT; writing – original draft preparation: ZLY; writing – review and editing: VV, CXC, and ZJJ; funding acquisition: CXC.
-
Conflict of interest: The authors declare that they have no known competing financial interests or personal relationships that could have appeared to influence the work reported in this paper.
References
[1] Zhao L, Qin Y. Control of coal facies to adsorption-desorption divergence of coals: A case from the Xiqu Drainage Area, Gujiao CBM Block, North China. Int J Coal Geol. 2017;171:169–84. 10.1016/j.coal.2017.01.006.Search in Google Scholar
[2] Zhai Y. The characteristics of coal facies in the Permian coal seams in the north of pingdingshan and its control of coal pore characteristics. Master’s thesis. Henan Polytechnic University; 2022.Search in Google Scholar
[3] Clara G, Marco R, Mauricio AB. Relationship between coal composition, coal facies, and desorbed methane gas content: Thermal histories and exhumation processes in the middle Magdalena Valley basin, Colombia. J South Am Earth Sci. 2023;128:104369. 10.1016/j.jsames.2023.104369.Search in Google Scholar
[4] Li T, Wu C, Liu Q. Characteristics of coal fractures and the influence of coal facies on coalbed methane productivity in the South Yanchuan Block, China. J Nat Gas Sci Eng. 2015;22:625–32. 10.1016/j.jngse.2015.01.014.Search in Google Scholar
[5] Shen Y, Wang X, Shi Q. Coal facies characteristics and pore structure response of oil-rich coal in Yushenfu Mining Area. Saf Coal Mines. 2021;52(10):30–37+44. 10.13347/j.cnki.mkaq.2021.10.007.Search in Google Scholar
[6] Jin K, Cheng Y, Liu Q. Experimental investigation of pore structure damage in pulverized coal: Implications for methane adsorption and diffusion characteristics. Energy Fuels. 2016;30(12):10383–95. 10.1021/acs.energyfuels.6b02530.Search in Google Scholar
[7] Xi K, Cao Y, Liu K, Jahren J, Zhu R, Yuan G, et al. Authigenic minerals related to wettability and their impacts on oil accumulation in tight sandstone reservoirs: An example from the Lower Cretaceous Quantou Formation in the southern Songliao Basin, China. J Asian Earth Sci. 2019;178:173–92. 10.1016/j.jseaes.2018.04.025.Search in Google Scholar
[8] Xi K, Cao Y, Liu K, Wu S, Yuan G, Zhu R, et al. Geochemical constraints on the origins of calcite cements and their impacts on reservoir heterogeneities: A case study on tight oil sandstones of the Upper Triassic Yanchang Formation, southwestern Ordos Basin, China. AAPG Bull. 2019;103(10):2447–85. 10.1306/01301918093.Search in Google Scholar
[9] Guo H, Wang K, Cui H. Experimental iovestioation on the pore and fracture structure of the reconstructed coal and its fractal characteristics. J China Univ Min Technol. 2019;48(6):1206–14.Search in Google Scholar
[10] Zhao Z, Liu P, Li Q, Nie B, Zhao K, Zhao Y, et al. Evaluating coal pore structure and gas sorption-diffusion behavior alteration induced by ultrasound stimulation using sorbing tests and matrix diffusion modeling. Geoenergy Sci Eng. 2024;234:212642. 10.1016/j.geoen.2024.212642.Search in Google Scholar
[11] Li L, Liu D, Cai Y, Wang Y, Jia Q. Coal structure and its implications for coalbed methane exploitation: a review. Energy Fuels. 2021;35(1):86–110. 10.1021/acs.energyfuels.0c03309.Search in Google Scholar
[12] Fan Q, Cai Y, Bei J. Pore and fracture structure of coal reservoir constrained by coal metamorphism. Geoscience. 2020;34(2):273–80.Search in Google Scholar
[13] Lou Y, Su Y, Wang W, Xia P. Coal facies and its effects on pore characteristics of the Late Permian Longtan coal, Western Guizhou, China. Geofluids. 2022;2022(1):6071514. 10.1016/j.fuel.2020.118248.Search in Google Scholar
[14] Ou C, Li C, Rui Z, Ma Q. Lithofacies distribution and gas-controlling characteristics of the Wufeng–Longmaxi black shales in the southeastern region of the Sichuan Basin, China. J Pet Sci Eng. 2018;165:269–83. 10.1016/j.petrol.2018.02.024.Search in Google Scholar
[15] Li J, Lu S, Chen G, Wang M, Tian S, Guo Z. A new method for measuring shale porosity with low-field nuclear magnetic resonance considering non-fluid signals. Mar Pet Geol. 2019;102:535–43. 10.1016/j.marpetgeo.2019.01.013.Search in Google Scholar
[16] Xue C, Wu J, Qiu L, Zhong J, Zhang S, Zhang B, et al. Lithofacies classification and its controls on the pore structure distribution in Permian transitional shale in the northeastern Ordos Basin, China. J Pet Sci Eng. 2020;195:107657. 10.1016/j.petrol.2020.107657.Search in Google Scholar
[17] Cai Y, Liu D, Yao Y, Li J, Liu J. Fractal characteristics of coal pores based on classic geometry and thermodynamics models. Acta Geol Sin (English Edition). 2011;85(5):1150–62. 10.1111/j.1755-6724.2011.00247.x.Search in Google Scholar
[18] Zhao Z, Liu G, Chang P, Wang X, Lin J. Fractal characteristics for coal chemical structure: Principle, methodology and implication. Chaos, Solitons Fractals. 2023;173:113699. 10.1016/j.chaos.2023.113699.Search in Google Scholar
[19] Liu X, Nie B. Fractal characteristics of coal samples utilizing image analysis and gas adsorption. Fuel. 2016;182(1):314–22. 10.1016/j.fuel.2016.05.110.Search in Google Scholar
[20] Li Z, Ren T, Li X, Qiao M, Yang X, Tan L, et al. Multi-scale pore fractal characteristics of differently ranked coal and its impact on gas adsorption. Int J Min Sci Technol. 2023;33:389–401. 10.1016/j.ijmst.2022.12.006.Search in Google Scholar
[21] Wang K, Yang H, Li Y, Zhang R, Ma Y, Wang B. Geological characteristics and exploration potential of the northern tectonic belt of Kuqa depression in Tarim Basin. ACTA Petrolei Sin. 2021;42(7):885–905. 10.7623/syxb202107005.Search in Google Scholar
[22] Zhao G, Li X, Liu M, Dong C, Li J, Liu Y, et al. Fault activity and hydrocarbon accumulation significance of structural belt in northern Kuqa Depression. J Min Sci Technol. 2022;7(1):34–44. 10.19606/j.cnki.jmst.2022.01.004.Search in Google Scholar
[23] Diessel CFK. The correlation between coal facies and depositional environments. In Proceedings of 20th Symposium. The University of Newcastle, Newcastle; 1986. p. 19–22.Search in Google Scholar
[24] Calder JH, Gibling MR, Mukhopadhyay PK. Peat formation in a Westphalian B piedmont setting, Cumberland Basin, Nova Scotia: implications for the maceral based interpretation of rheotrophic and raised paleomires. Bull Soc Géol Fr. 1991;162(2):283–98.Search in Google Scholar
[25] Diessel CFK. Utility of coal petrology for sequence-stratigraphic analysis. Int J Coal Geol. 2007;70(1–3):3–34. 10.1016/j.coal.2006.01.008.Search in Google Scholar
[26] Ahmad AL, Mustafa NNN. Pore surface fractal analysis of palladium-alumina ceramic membrane using Frenkel-Halsey-Hill (FHH) model. J Colloid Interface Sci. 2006;301(2):575–84. 10.1016/j.jcis.2006.05.041.Search in Google Scholar PubMed
[27] Yao P, Zhang J, Lv D, Veerle V, Chang X. Effect of water occurrence in coal reservoirs on the production capacity of coalbed methane by using NMR simulation technology and production capacity simulation. Geoenergy Sci Eng. 2024;243:213353. 10.1016/j.geoen.2024.213353.Search in Google Scholar
[28] Paz Ferreiro J, Vidal Vázquez E. Multifractal analysis of Hg pore size distributions in soils with contrasting structural stability. Geoderma. 2010;160(1):64–73. 10.1016/j.geoderma.2009.11.019.Search in Google Scholar
[29] Zhao P, Wang X, Cai J, Luo M, Zhang J, Liu Y, et al. Multifractal analysis of pore structure of Middle Bakken formation using low temperature N2 adsorption and NMR measurements. J Pet Sci Eng. 2019;176:312–20. 10.1016/j.petrol.2019.01.040.Search in Google Scholar
[30] Liu K, Ostadhassan M, Zou J, Gentzis T, Rezaee R, Bubach B, et al. Multifractal analysis of gas adsorption isotherms for pore structure characterization of the Bakken Shale. Fuel. 2018;219:296–311. 10.1016/j.fuel.2018.01.126.Search in Google Scholar
[31] Friesen WI, Mikula RJ. Mercury porosimetry of coals: pore volume distribution and compressibility. Fuel. 1987;67:1516–20. 10.1016/0016-2361(88)90069-5.Search in Google Scholar
[32] Posnansky O, Guo J, Hirsch S, Papazoglou S, Braun J, Sack I. Fractal network dimension and viscoelastic powerlaw behavior: I. A modeling approach based on a coarse-graining procedure combined with shear oscillatory rheometry. Phys Med Biol. 2012;57:4023–41. 10.1088/0031-9155/57/12/4023.Search in Google Scholar PubMed
[33] Zhang J, Wei C, Chu X, Vandeginste V, Ju W. Multifractal analysis in characterizing adsorption pore heterogeneity of middle- and high-rank coal reservoirs. ACS Omega. 2020;5(31):19385–19401. 10.1021/acsomega.0c01115.Search in Google Scholar PubMed PubMed Central
[34] Zhu J, Liu J, Yang Y, Cheng J, Zhou J, Cen K. Fractal characteristics of pore structures in 13 coal specimens: Relationship among fractal dimension, pore structure parameter, and slurry ability of coal. Fuel Process Technol. 2016;149:256–67. 10.1016/j.fuproc.2016.04.026.Search in Google Scholar
[35] Zhao J, Xu H, Tang D, Mathews JP, Li S, Tao S. A comparative evaluation of coal specific surface area by CO2 and N2 adsorption and its influence on CH4 adsorption capacity at different pore sizes. Fuel. 2016;183:420–31.10.1016/j.fuel.2016.06.076Search in Google Scholar
© 2024 the author(s), published by De Gruyter
This work is licensed under the Creative Commons Attribution 4.0 International License.
Articles in the same Issue
- Regular Articles
- Theoretical magnetotelluric response of stratiform earth consisting of alternative homogeneous and transitional layers
- The research of common drought indexes for the application to the drought monitoring in the region of Jin Sha river
- Evolutionary game analysis of government, businesses, and consumers in high-standard farmland low-carbon construction
- On the use of low-frequency passive seismic as a direct hydrocarbon indicator: A case study at Banyubang oil field, Indonesia
- Water transportation planning in connection with extreme weather conditions; case study – Port of Novi Sad, Serbia
- Zircon U–Pb ages of the Paleozoic volcaniclastic strata in the Junggar Basin, NW China
- Monitoring of mangrove forests vegetation based on optical versus microwave data: A case study western coast of Saudi Arabia
- Microfacies analysis of marine shale: A case study of the shales of the Wufeng–Longmaxi formation in the western Chongqing, Sichuan Basin, China
- Multisource remote sensing image fusion processing in plateau seismic region feature information extraction and application analysis – An example of the Menyuan Ms6.9 earthquake on January 8, 2022
- Identification of magnetic mineralogy and paleo-flow direction of the Miocene-quaternary volcanic products in the north of Lake Van, Eastern Turkey
- Impact of fully rotating steel casing bored pile on adjacent tunnels
- Adolescents’ consumption intentions toward leisure tourism in high-risk leisure environments in riverine areas
- Petrogenesis of Jurassic granitic rocks in South China Block: Implications for events related to subduction of Paleo-Pacific plate
- Differences in urban daytime and night block vitality based on mobile phone signaling data: A case study of Kunming’s urban district
- Random forest and artificial neural network-based tsunami forests classification using data fusion of Sentinel-2 and Airbus Vision-1 satellites: A case study of Garhi Chandan, Pakistan
- Integrated geophysical approach for detection and size-geometry characterization of a multiscale karst system in carbonate units, semiarid Brazil
- Spatial and temporal changes in ecosystem services value and analysis of driving factors in the Yangtze River Delta Region
- Deep fault sliding rates for Ka-Ping block of Xinjiang based on repeating earthquakes
- Improved deep learning segmentation of outdoor point clouds with different sampling strategies and using intensities
- Platform margin belt structure and sedimentation characteristics of Changxing Formation reefs on both sides of the Kaijiang-Liangping trough, eastern Sichuan Basin, China
- Enhancing attapulgite and cement-modified loess for effective landfill lining: A study on seepage prevention and Cu/Pb ion adsorption
- Flood risk assessment, a case study in an arid environment of Southeast Morocco
- Lower limits of physical properties and classification evaluation criteria of the tight reservoir in the Ahe Formation in the Dibei Area of the Kuqa depression
- Evaluation of Viaducts’ contribution to road network accessibility in the Yunnan–Guizhou area based on the node deletion method
- Permian tectonic switch of the southern Central Asian Orogenic Belt: Constraints from magmatism in the southern Alxa region, NW China
- Element geochemical differences in lower Cambrian black shales with hydrothermal sedimentation in the Yangtze block, South China
- Three-dimensional finite-memory quasi-Newton inversion of the magnetotelluric based on unstructured grids
- Obliquity-paced summer monsoon from the Shilou red clay section on the eastern Chinese Loess Plateau
- Classification and logging identification of reservoir space near the upper Ordovician pinch-out line in Tahe Oilfield
- Ultra-deep channel sand body target recognition method based on improved deep learning under UAV cluster
- New formula to determine flyrock distance on sedimentary rocks with low strength
- Assessing the ecological security of tourism in Northeast China
- Effective reservoir identification and sweet spot prediction in Chang 8 Member tight oil reservoirs in Huanjiang area, Ordos Basin
- Detecting heterogeneity of spatial accessibility to sports facilities for adolescents at fine scale: A case study in Changsha, China
- Effects of freeze–thaw cycles on soil nutrients by soft rock and sand remodeling
- Vibration prediction with a method based on the absorption property of blast-induced seismic waves: A case study
- A new look at the geodynamic development of the Ediacaran–early Cambrian forearc basalts of the Tannuola-Khamsara Island Arc (Central Asia, Russia): Conclusions from geological, geochemical, and Nd-isotope data
- Spatio-temporal analysis of the driving factors of urban land use expansion in China: A study of the Yangtze River Delta region
- Selection of Euler deconvolution solutions using the enhanced horizontal gradient and stable vertical differentiation
- Phase change of the Ordovician hydrocarbon in the Tarim Basin: A case study from the Halahatang–Shunbei area
- Using interpretative structure model and analytical network process for optimum site selection of airport locations in Delta Egypt
- Geochemistry of magnetite from Fe-skarn deposits along the central Loei Fold Belt, Thailand
- Functional typology of settlements in the Srem region, Serbia
- Hunger Games Search for the elucidation of gravity anomalies with application to geothermal energy investigations and volcanic activity studies
- Addressing incomplete tile phenomena in image tiling: Introducing the grid six-intersection model
- Evaluation and control model for resilience of water resource building system based on fuzzy comprehensive evaluation method and its application
- MIF and AHP methods for delineation of groundwater potential zones using remote sensing and GIS techniques in Tirunelveli, Tenkasi District, India
- New database for the estimation of dynamic coefficient of friction of snow
- Measuring urban growth dynamics: A study in Hue city, Vietnam
- Comparative models of support-vector machine, multilayer perceptron, and decision tree predication approaches for landslide susceptibility analysis
- Experimental study on the influence of clay content on the shear strength of silty soil and mechanism analysis
- Geosite assessment as a contribution to the sustainable development of Babušnica, Serbia
- Using fuzzy analytical hierarchy process for road transportation services management based on remote sensing and GIS technology
- Accumulation mechanism of multi-type unconventional oil and gas reservoirs in Northern China: Taking Hari Sag of the Yin’e Basin as an example
- TOC prediction of source rocks based on the convolutional neural network and logging curves – A case study of Pinghu Formation in Xihu Sag
- A method for fast detection of wind farms from remote sensing images using deep learning and geospatial analysis
- Spatial distribution and driving factors of karst rocky desertification in Southwest China based on GIS and geodetector
- Physicochemical and mineralogical composition studies of clays from Share and Tshonga areas, Northern Bida Basin, Nigeria: Implications for Geophagia
- Geochemical sedimentary records of eutrophication and environmental change in Chaohu Lake, East China
- Research progress of freeze–thaw rock using bibliometric analysis
- Mixed irrigation affects the composition and diversity of the soil bacterial community
- Examining the swelling potential of cohesive soils with high plasticity according to their index properties using GIS
- Geological genesis and identification of high-porosity and low-permeability sandstones in the Cretaceous Bashkirchik Formation, northern Tarim Basin
- Usability of PPGIS tools exemplified by geodiscussion – a tool for public participation in shaping public space
- Efficient development technology of Upper Paleozoic Lower Shihezi tight sandstone gas reservoir in northeastern Ordos Basin
- Assessment of soil resources of agricultural landscapes in Turkestan region of the Republic of Kazakhstan based on agrochemical indexes
- Evaluating the impact of DEM interpolation algorithms on relief index for soil resource management
- Petrogenetic relationship between plutonic and subvolcanic rocks in the Jurassic Shuikoushan complex, South China
- A novel workflow for shale lithology identification – A case study in the Gulong Depression, Songliao Basin, China
- Characteristics and main controlling factors of dolomite reservoirs in Fei-3 Member of Feixianguan Formation of Lower Triassic, Puguang area
- Impact of high-speed railway network on county-level accessibility and economic linkage in Jiangxi Province, China: A spatio-temporal data analysis
- Estimation model of wild fractional vegetation cover based on RGB vegetation index and its application
- Lithofacies, petrography, and geochemistry of the Lamphun oceanic plate stratigraphy: As a record of the subduction history of Paleo-Tethys in Chiang Mai-Chiang Rai Suture Zone of Thailand
- Structural features and tectonic activity of the Weihe Fault, central China
- Application of the wavelet transform and Hilbert–Huang transform in stratigraphic sequence division of Jurassic Shaximiao Formation in Southwest Sichuan Basin
- Structural detachment influences the shale gas preservation in the Wufeng-Longmaxi Formation, Northern Guizhou Province
- Distribution law of Chang 7 Member tight oil in the western Ordos Basin based on geological, logging and numerical simulation techniques
- Evaluation of alteration in the geothermal province west of Cappadocia, Türkiye: Mineralogical, petrographical, geochemical, and remote sensing data
- Numerical modeling of site response at large strains with simplified nonlinear models: Application to Lotung seismic array
- Quantitative characterization of granite failure intensity under dynamic disturbance from energy standpoint
- Characteristics of debris flow dynamics and prediction of the hazardous area in Bangou Village, Yanqing District, Beijing, China
- Rockfall mapping and susceptibility evaluation based on UAV high-resolution imagery and support vector machine method
- Statistical comparison analysis of different real-time kinematic methods for the development of photogrammetric products: CORS-RTK, CORS-RTK + PPK, RTK-DRTK2, and RTK + DRTK2 + GCP
- Hydrogeological mapping of fracture networks using earth observation data to improve rainfall–runoff modeling in arid mountains, Saudi Arabia
- Petrography and geochemistry of pegmatite and leucogranite of Ntega-Marangara area, Burundi, in relation to rare metal mineralisation
- Prediction of formation fracture pressure based on reinforcement learning and XGBoost
- Hazard zonation for potential earthquake-induced landslide in the eastern East Kunlun fault zone
- Monitoring water infiltration in multiple layers of sandstone coal mining model with cracks using ERT
- Study of the patterns of ice lake variation and the factors influencing these changes in the western Nyingchi area
- Productive conservation at the landslide prone area under the threat of rapid land cover changes
- Sedimentary processes and patterns in deposits corresponding to freshwater lake-facies of hyperpycnal flow – An experimental study based on flume depositional simulations
- Study on time-dependent injectability evaluation of mudstone considering the self-healing effect
- Detection of objects with diverse geometric shapes in GPR images using deep-learning methods
- Behavior of trace metals in sedimentary cores from marine and lacustrine environments in Algeria
- Spatiotemporal variation pattern and spatial coupling relationship between NDVI and LST in Mu Us Sandy Land
- Formation mechanism and oil-bearing properties of gravity flow sand body of Chang 63 sub-member of Yanchang Formation in Huaqing area, Ordos Basin
- Diagenesis of marine-continental transitional shale from the Upper Permian Longtan Formation in southern Sichuan Basin, China
- Vertical high-velocity structures and seismic activity in western Shandong Rise, China: Case study inspired by double-difference seismic tomography
- Spatial coupling relationship between metamorphic core complex and gold deposits: Constraints from geophysical electromagnetics
- Disparities in the geospatial allocation of public facilities from the perspective of living circles
- Research on spatial correlation structure of war heritage based on field theory. A case study of Jinzhai County, China
- Formation mechanisms of Qiaoba-Zhongdu Danxia landforms in southwestern Sichuan Province, China
- Magnetic data interpretation: Implication for structure and hydrocarbon potentiality at Delta Wadi Diit, Southeastern Egypt
- Deeply buried clastic rock diagenesis evolution mechanism of Dongdaohaizi sag in the center of Junggar fault basin, Northwest China
- Application of LS-RAPID to simulate the motion of two contrasting landslides triggered by earthquakes
- The new insight of tectonic setting in Sunda–Banda transition zone using tomography seismic. Case study: 7.1 M deep earthquake 29 August 2023
- The critical role of c and φ in ensuring stability: A study on rockfill dams
- Evidence of late quaternary activity of the Weining-Shuicheng Fault in Guizhou, China
- Extreme hydroclimatic events and response of vegetation in the eastern QTP since 10 ka
- Spatial–temporal effect of sea–land gradient on landscape pattern and ecological risk in the coastal zone: A case study of Dalian City
- Study on the influence mechanism of land use on carbon storage under multiple scenarios: A case study of Wenzhou
- A new method for identifying reservoir fluid properties based on well logging data: A case study from PL block of Bohai Bay Basin, North China
- Comparison between thermal models across the Middle Magdalena Valley, Eastern Cordillera, and Eastern Llanos basins in Colombia
- Mineralogical and elemental analysis of Kazakh coals from three mines: Preliminary insights from mode of occurrence to environmental impacts
- Chlorite-induced porosity evolution in multi-source tight sandstone reservoirs: A case study of the Shaximiao Formation in western Sichuan Basin
- Predicting stability factors for rotational failures in earth slopes and embankments using artificial intelligence techniques
- Origin of Late Cretaceous A-type granitoids in South China: Response to the rollback and retreat of the Paleo-Pacific plate
- Modification of dolomitization on reservoir spaces in reef–shoal complex: A case study of Permian Changxing Formation, Sichuan Basin, SW China
- Geological characteristics of the Daduhe gold belt, western Sichuan, China: Implications for exploration
- Rock physics model for deep coal-bed methane reservoir based on equivalent medium theory: A case study of Carboniferous-Permian in Eastern Ordos Basin
- Enhancing the total-field magnetic anomaly using the normalized source strength
- Shear wave velocity profiling of Riyadh City, Saudi Arabia, utilizing the multi-channel analysis of surface waves method
- Effect of coal facies on pore structure heterogeneity of coal measures: Quantitative characterization and comparative study
- Inversion method of organic matter content of different types of soils in black soil area based on hyperspectral indices
- Detection of seepage zones in artificial levees: A case study at the Körös River, Hungary
- Tight sandstone fluid detection technology based on multi-wave seismic data
- Characteristics and control techniques of soft rock tunnel lining cracks in high geo-stress environments: Case study of Wushaoling tunnel group
- Influence of pore structure characteristics on the Permian Shan-1 reservoir in Longdong, Southwest Ordos Basin, China
- Study on sedimentary model of Shanxi Formation – Lower Shihezi Formation in Da 17 well area of Daniudi gas field, Ordos Basin
- Multi-scenario territorial spatial simulation and dynamic changes: A case study of Jilin Province in China from 1985 to 2030
- Review Articles
- Major ascidian species with negative impacts on bivalve aquaculture: Current knowledge and future research aims
- Prediction and assessment of meteorological drought in southwest China using long short-term memory model
- Communication
- Essential questions in earth and geosciences according to large language models
- Erratum
- Erratum to “Random forest and artificial neural network-based tsunami forests classification using data fusion of Sentinel-2 and Airbus Vision-1 satellites: A case study of Garhi Chandan, Pakistan”
- Special Issue: Natural Resources and Environmental Risks: Towards a Sustainable Future - Part I
- Spatial-temporal and trend analysis of traffic accidents in AP Vojvodina (North Serbia)
- Exploring environmental awareness, knowledge, and safety: A comparative study among students in Montenegro and North Macedonia
- Determinants influencing tourists’ willingness to visit Türkiye – Impact of earthquake hazards on Serbian visitors’ preferences
- Application of remote sensing in monitoring land degradation: A case study of Stanari municipality (Bosnia and Herzegovina)
- Optimizing agricultural land use: A GIS-based assessment of suitability in the Sana River Basin, Bosnia and Herzegovina
- Assessing risk-prone areas in the Kratovska Reka catchment (North Macedonia) by integrating advanced geospatial analytics and flash flood potential index
- Analysis of the intensity of erosive processes and state of vegetation cover in the zone of influence of the Kolubara Mining Basin
- GIS-based spatial modeling of landslide susceptibility using BWM-LSI: A case study – city of Smederevo (Serbia)
- Geospatial modeling of wildfire susceptibility on a national scale in Montenegro: A comparative evaluation of F-AHP and FR methodologies
- Geosite assessment as the first step for the development of canyoning activities in North Montenegro
- Urban geoheritage and degradation risk assessment of the Sokograd fortress (Sokobanja, Eastern Serbia)
- Multi-hazard modeling of erosion and landslide susceptibility at the national scale in the example of North Macedonia
- Understanding seismic hazard resilience in Montenegro: A qualitative analysis of community preparedness and response capabilities
- Forest soil CO2 emission in Quercus robur level II monitoring site
- Characterization of glomalin proteins in soil: A potential indicator of erosion intensity
- Power of Terroir: Case study of Grašac at the Fruška Gora wine region (North Serbia)
- Special Issue: Geospatial and Environmental Dynamics - Part I
- Qualitative insights into cultural heritage protection in Serbia: Addressing legal and institutional gaps for disaster risk resilience