Rockfall mapping and susceptibility evaluation based on UAV high-resolution imagery and support vector machine method
-
Longhui Zhao
 ,
Genlan Yang
,
Genlan Yang

Abstract
This study aims to develop a comprehensive method for automated rockfall mapping and susceptibility assessment using unmanned aerial vehicle (UAV) tilt photography and the support vector machine (SVM) algorithm. By employing Jinzhong Town in the mountainous forest landscapes of Southwest China as a case study, we leverage photogrammetry principles and computer vision algorithms to generate high-precision, high-resolution digital surface models (DSMs), and digital orthophoto maps through a UAV remote sensing system. The rockfall inventory is accurately and automatically mapped using the object-based classification method and SVM algorithm. The automated rockfall identification method achieves a 93% accuracy with a Kappa coefficient of 0.7967. Statistical analyses of spatial distribution characteristics reveal a significant correlation between rockfall volume and area with a correlation coefficient (R²) of 0.92316 under logarithmic coordinates. In addition, a power function relationship describes the link between rockfall volume and slope height (R² = 0.87), while the relationship with sliding distance is characterized by a weaker linear correlation (R² = 0.65). Rockfall runout distance also shows a significant linear correlation with slope height (R² = 0.79) but exhibits a less-pronounced association with rockfall volume (R² = 0.58). The SVM model employed to assess rockfall susceptibility indicates high accuracy (area under the curve = 0.896), affirming its efficacy in rockfall susceptibility assessment. Our findings underscore the utility of UAV remote sensing for rockfall information extraction and susceptibility evaluation, particularly in challenging mountainous forest environments characterized by intricate topography and geological complexities.
1 Introduction
Rockfall refers to the phenomenon in which the rock mass on a steep slope suddenly falls under the action of gravity, which is mainly composed of the vertical movement [1,2,3]. It is one of the major natural hazards in mountainous forest areas, killing people, and causing economic losses [4,5,6,7]. Rockfalls have damaged urban and rural residential areas, as well as agricultural and forests [8,9,10,11]. To reduce the damage caused by rockfall, it is essential to zoning rockfall susceptibility, especially at the stage of land use planning [12,13,14]. The rockfall list is used as basic information for creating these maps [15]. The first stage of preparing a rockfall inventory is to create a map showing the location and size of the rockfall [16,17].
Existing rockfall investigation and mapping technologies, such as optical remote sensing [18,19,20,21], airborne laser scanner [22,23,24], terrestrial laser scanner [25,26,27], space-borne radar [28,29], and ground-based radar [30,31,32], all have various disadvantages such as high price, lack of flexibility, and inconvenience. Generally, digital elevation models (DEMs) and digital orthophoto maps (DOMs) obtained from aerial or satellite images have low resolution and cannot fully identify rockfall texture features, such as rockfall fracture structures or small displacement deformation, which limits the absolute accuracy of landslide mapping [33,34]. Furthermore, these methods involve huge costs, complicated technologies, and in particular, are subject to the effects of time and weather conditions [35]. Modern deep learning approaches like convolutional neural networks (CNNs) provide high accuracy in image recognition tasks but require extensive computational resources and large training datasets, making them impractical in remote and diverse geological settings and less interpretable compared to traditional techniques like support vector machines (SVM) [36].The development of low-cost unmanned aerial vehicles (UAVs) and image-based computing technology recently has dramatically increased the application of UAV-based photogrammetry technology as a favorite supplement to traditional aerial photogrammetry; moreover, it has been widely used in geological environments and hazard surveys [35,37], riverbank erosion [38], vegetation monitoring [39,40], and land resource management [41]. It has the advantages of flexible shooting angles, free from the influence of terrain and topography, long hovering time, and high resolution; thus, it is widely used in the emergency investigation of geological hazards [42,43,44]. For example, drones were used for damage inspection after Hurricanes Harvey [45] and Maria [46]. In addition, UAVs have gradually become indispensable after earthquake hazard investigation and evaluation, such as the 2013 Lushan earthquake [47], the 2014 Chile Earthquake [48], and the 2017 Jiuzhaigou earthquake [33,49]. Despite the exemplary of UAV remote sensing in broad-scale monitoring of geological disasters, enhancements are necessary for detailed analysis and quantitative evaluations at the microscale, particularly involving high-precision DEMs and DOMs. Utilizing extensive aerial data, UAV technology has facilitated nuanced time-series analyses [50]. Notably, Yating et al. achieved an aerial accuracy of up to 5 cm in their study of geological hazards in Chongqing, employing UAV photogrammetry techniques [51]. Furthermore, Nikolakopoulos et al. systematically explored the relationship between UAV-collected geometry and the topographic features of multiple active landslide areas, evaluating the accuracy of high-resolution orthoimagery and digital surface models through quantitative and qualitative methods [52]. Such research underscores the importance of leveraging UAV data, particularly in tracking dynamic shifts within geological disaster zones, to significantly boost the precision and efficiency of disaster forecasting and management strategies. Collectively, these findings highlight the invaluable role of UAVs in swiftly assessing geological hazards and devising effective mitigation and rescue plans, and they illuminate promising avenues for future research into detailed disaster analysis and quantitative assessments. Consequently, they cannot directly generate indices like the normalized difference vegetation index, which are crucial for vegetation extraction [53]. Acknowledging this issue, numerous scholars worldwide have proposed various visible light vegetation indices based on the spectral characteristics of green plants in the visible light spectrum, such as the visible band difference vegetation index (VDVI) [54,55]. Given the abundant vegetation cover in mountainous forest areas, this study introduces the UAV visible light RGB band difference vegetation index (VDVI) to identify rockfalls. This innovative approach aims to eliminate the impact of vegetation, providing a novel reference for accurate rockfall identification in mountainous forest areas.
Jinzhong Town, situated in Kaiyang County in the heart of Southwest China, is predominantly characterized by mountainous forest landscapes. The region, marked by challenging topography and a delicate geological environment, lacks direct accessibility and support. It grapples with the recurring threat of geohazards, particularly rockfalls [17,56], thereby presenting a significant risk to the safety of both lives and property. As a result, there is an immediate need for a comprehensive understanding of the processes and characteristics associated with rockfalls [57]. Therefore, the main purpose of this study was to evaluate the suitability of UAV systems for rockfall mapping in complex terrain conditions within mountainous forest areas and to establish a complete method for automatic rockfall mapping and refined susceptibility evaluation based on UAV tilt photography. Abundant spectral and textural information on the rockfall surface was obtained using UAV tilt photography and the SVM method. High-precision digital surface model (DSM), DOM, and 3D real scene model data production were collected using the motion recovery structure algorithm (SFM), which uses the method of multiscale segmentation and object-based classification, taking the slope information and the VDVI as a parameter, and threshold-based and SVM classification methods are used to extract rockfall information. We analyzed the spatial characteristics of the rockfall distribution in the study area and the correlation of rockfall with the main controlling factors by statistical methods. Finally, the SVM model was utilized to assess the susceptibility evaluation of rockfalls. UAV remote sensing has further applications in the field of rockfall information extraction and susceptibility analysis. Highlighting the effectiveness of this new technology in the plateau region demonstrates the potential of UAV photogrammetry use in other areas including regional geohazard investigations.
2 Overview of the study area
The study area, situated in Jinzhong Town, west of Kaiyang County, China (106°50′26′E, 27°05′42′N), is positioned 28 km away from Kaiyang County and 88 km from the central hub of Guiyang (Figure 1). This locale falls within the subtropical temperate and humid climate zone, characterized by warm winters, hot summers, distinct seasons, and foggy winters. Notably, the rainy season spans from May to September, witnessing an average annual rainfall of 1199.8 mm, occurring over 205 days on average, with the highest daily rainfall recorded at 160 mm.

Location of the study area and rockfall inventory map: (a) location of Kaiyang County in China; (b) location of the study area in Kaiyang County; and (c) the distribution of rockfalls in the study area.
The study area is traversed by the Yangshui River, a significant secondary tributary within the Wujiang River system. Geomorphologically, the region exhibits a shallow-cut, eroded, and dissolved Zhongshan landform, featuring elevations ranging from 1,000 to 1,500 m and a steep topography. The general slope of the study area hovers between 30° and 50°, while the collapsed source area registers steeper slopes, predominantly ranging from 60° to 70°. The slope aspect maintains a relatively consistent pattern, predominantly falling between 290° and 310° in the study area.
The lithology of the exposed stratum in the research area is primarily composed of the Banxi Group of Neoproterozoic Qingbaikouan (Pt3b) Slate with ripple mark structure, and the Lower Sinian Nantuo Formation (Pt3 2cn) purplish red silty shale and variant siltstone. In addition, the Upper Dengying Formation (Pt3 3bЄldy) features light gray and dark gray thick dolostone, while the lower Cambrian cattle hoof pond group (Єl-2n) consists of black carbonaceous shale. The Jindingshan (Є2j) Formation includes interbedded mudstone with quartz sandstone and sandy mudstone, and the Furong Loushanguan group (Є3-4l) comprises dolomite (Figure 2). The main structure of the study area is the Yangshui anticline and its plunging section. Under the influence of lithology and structure, a steep slope with a height of 30–100 m is often formed in the dolomite of Dengying Formation, which has strong weathering resistance. The slope is greater than 45°, and the partial slope can reach 80°. The collapse disaster occurs in the thick dolomite of the upper Dengying Formation. At the foot of steep slope, the red mud shale of Nantuo Formation with weak weathering resistance has been developed.

Geological map of the research area.
3 Data and methods
UAV is a remote sensing technology employed as a flight platform carrying sensor equipment to collect ground information [58]. The UAV tilt photogrammetry system is primarily composed of a multi-rotor small UAV system, an aerial photography system, and a ground control system (Figure 3) [59]. The multirotor small UAV system specifically denotes UAVs and various remote sensing equipment. Serving as the foundation of the UAV remote sensing system, this system is entrusted with delivering the image acquisition equipment to predetermined locations. The aerial photography system, on the other hand, consists of a 360° all-around rotating camera head and a high-definition digital camera. Its primary function is to capture images of the target area that adhere to the photogrammetry requirements. The ground control system encompasses a UAV controller and real-time kinematic (RTK) control point measurement. Collaboration between the ground control system and the UAV platform is essential for achieving precise control over the flight state [60]. This coordinated effort ensures the accuracy and reliability of the data collected during the UAV’s remote sensing missions.

Composition of UAV tilt photogrammetry system.
There are three steps in the general operation process of the quantitative extraction of geometric feature information of rockfall using the UAV remote sensing technology, namely, on-site operation, photo processing, rockfall hazard identification, and susceptibility evaluation (Figure 4). The following is a brief discussion.

Implementation process of automatic rockfall mapping and susceptibility evaluation based on tilt photography of UAV.
3.1 On-site operation
Field operations include field environmental investigation and assessment, control point layout and measurement, equipment assembly and system testing, parameter setting, and flight aerial photography.
3.1.1 Layout and measurement of ground control point (GCP)
Owing to the limited accuracy of GPS carried by UAVs, it is necessary to improve the processing accuracy of remote sensing results of rockfall bodies by introducing GCPs [61,62]. The number of image control points is generally 3–5, but the distribution should be as uniform as possible [63]. In addition, the GPS RTK method is preferred for the measurement of GCPs in most cases. Base stations should be set up in high terrain broad vision areas. Paint each measurement point to facilitate the absolute orientation of the UAV images in the later period. Tapo GPS RTK was used for measurement in this experiment, and the WGS_1984_UTM projection coordinate system was selected as the spatial reference (Figure 5b). To measure three-dimensional coordinates, five control points are evenly placed throughout the research area. The positions of control points are shown in Figure 5a.

Workflow for rockfall mapping and susceptibility evaluation based on UAV high-resolution imagery and SVM method.
3.1.2 Parameter setting and aerial photography
Parameter settings include UAV flight level, route planning, setting, and overlap rate photo set. The flight angle, flight altitude, and camera frequency setting should be taken into account to meet the following requirements in the planning of routes to the aircraft’s flight: fore-and-aft overlap rate is above 80%, side lap rate is above 60%, and an orthographic shot where the height difference is slight and oblique shots where the height difference is significant [64]. Different camera parameters were selected to ensure the quality of photos taken by the color of ground objects around the study area, flight altitude, and weather conditions. After setting the aforementioned parameters, one can start flying aerial photography. During the flight, the fore-and-aft overlap should not be less than 85%, and the side overlap should not be less than 65% (Figure 5a). Other important parameters of UAV aerial photography are shown in Table 1.
Determination of critical parameters of aerial photography
| Item | Relative flight height (m) | Heading overlap rate (%) | Side overlap rate (%) | Camera pitch angle (°) | Ground resolution (m) | Photo resolution (m) | Number of photos/piece |
|---|---|---|---|---|---|---|---|
| Value | 300 | 85 | 65 | 90 | 1 | 4,864 × 3,648 | 1,530 |
3.2 Data processing
The technology mainly uses the SFM method to perform 3D reconstruction using aerial photos. Presently, the new digital photogrammetry method of structure from motion (SFM) based on a computer vision algorithm is widely used in the processing of UAV images [65]. In this method, an efficient matching algorithm with automatic features is used to reconstruct a set of images with a high overlap rate and changing perspective to obtain a digital 3D model [66]. The concrete steps of the SFM method mainly include data space matching, aerial triangulation, and digital results generation [67]. The specific modeling process is shown in Figure 5c–e.
3.2.1 Image-space matching
First, in the absence of any ground auxiliary measurement calculation, the software carries out the process of space fusion calculation on the object using the RGB information recorded by the aerial film itself. After the initial processing, the spatial information of the phase control points of the aerial film was matched with the real coordinate points of the GCPs [68].
3.2.2 Aerial triangulation
According to the GCPs measured in the field, a route model or regional network model corresponding to the field was established to determine the external orientation elements of all images in the region by using digital photogrammetry, which provides orientation points and note points for correction, mapping, and instrumental placement element data required during the operation [69].
3.2.3 Generation of digital results
The spatial information of the ground objects was obtained through software calculation. The generation and application of high-precision data also include the digital surface model, DOM, and 3D model generation. DSM and DOM are the core data of later information extraction, through which the spatial morphology and surface texture information of rockfalls can be obtained (Figure 5f and g).
3.3 Rockfall mapping and susceptibility evaluation
3.3.1 Object-based image analysis
UAVs for remote sensing images are characterized by high resolution, while the traditional pixel-based classification results feature low classification accuracy and produce a salt-and-pepper effect [70,71,72]. The object-oriented classification method comprehensively utilizes multisource information such as spectral, texture, spatial form, and context information, and characterizes higher classification accuracy. It is more suitable for high-resolution UAV images [73,74].
The fundamental concept of object-oriented image analysis involves attributing several characteristics to each object, including its spectral properties, texture, and shape. Pixels with the same or similar characteristic information are divided into a single object through an image segmentation algorithm. The object turns into the smallest unit of image analysis and processing, which explores a new train of thought in the processing of high-resolution remote sensing image analysis [75]. The primary processing process is divided into five steps: remote sensing data preprocessing, object segmentation, feature selection, information extraction, and extraction result analysis (Figure 5h–n) [76].
Various types of object-oriented classification methods include the degree of membership function, nearest neighbor classification, SVM, and rule-based classification [74]. The degree of membership function uses possibility to represent the membership of an object to a class. The membership value typically ranges between 0 and 1, where 1 represents full membership or maximum possibility of belonging to the class, and 0 represents complete non-membership or zero possibility (Figure 4) [77,78]. Nearest neighbor classification and SVM are supervised classification methods, which select pixels whose categories are easy to be determined as classification samples and then use the classification samples to determine the categories of other unknown categories of pixels [79]. Rule-based classification is a classification method based on careful investigation of the research area, combined with the acquisition of expert experience, and based on the actual situation of the research area under the condition of continuous attempts [76].
In this study, we utilized membership functions and rule-based classification to eliminate ground objects with spectral features unrelated to rockfalls, such as vegetation and water bodies. We distinguished between vegetation and nonvegetation by setting thresholds for the VDVI index, and combined with high-precision DEM data, we used rule-based classification to exclude areas with slopes less than 10° as nonrockfall regions. In addition, we employed the SVM classification method to precisely extract rockfall information, ensuring the accuracy and effectiveness of the research.
3.3.2 Multi-scaled solution segmentation and parameter selection
In object-based classification, the first step is image segmentation in the study area [74]. The purpose is to divide the homogenous area of the image, and the quality of segmentation results affects the accuracy of classification of the segmentation. The choice of segmentation scale in the image segmentation process is critical. Insufficient or excessive segmentation results in a decline in classification accuracy. Consequently, the optimal segmentation scale needs to be determined by repeated experiments in line with the actual situation (Table 2) [80].
Image segmentation parameters
| Segmentation scale | Shape factor | Compactness | Band weight |
|---|---|---|---|
| 150 | 0.5 | 0.5 | 1:1:1:1 |
3.3.3 Extraction of vegetation
In this study, due to the high vegetation coverage and relatively low extraction difficulty within the study area, vegetation extraction was prioritized in the initial layer of analysis. Visible-band difference vegetation index (VDVI) index has a good extraction effect for green vegetation information in images only containing visible light band and is more suitable for UAV image extraction. The classification method of the membership function was selected, and the membership function of vegetation was constructed by selecting the VDVI index to extract the vegetation information. Its calculation formula is as follows [55]:
where G is the green light band; R is the red light band; and B is the blue band. When the VDVI index was less than –0.018, the ground object type was nonvegetation, and when the VDVI index was more greater than 0.002, the ground object type was vegetation. Therefore, the membership function of the vegetation information was constructed in the interval of (−0.018, 0.002), and the membership function value determined the category. The original image was divided into vegetation and nonvegetation using the aforementioned method (Figure 5l).
3.3.4 Extraction of areas with a slope less than 10°
The spectral features of the unclassified ground objects were close to each other. More topographic features, shape features, texture features, and neighborhood features were needed to better extract rockfall information. Rockfalls tend to occur in areas with steep slopes; therefore, areas with slopes less than 10° are considered nonrockfall areas. Therefore, high-precision DEM data generated by the UAV were used to obtain the slope information of the study area. Areas with a slope less than 10° were extracted from the nonvegetated areas using the regular classification method (Figure 5m).
3.3.5 Extraction of rockfall
After the first two steps, the vegetation and the information of the areas with a slope less than 10° were extracted. The next step was to extract the rockfall information from the remaining area. With respect to rockfall information extraction, it is difficult to set an appropriate threshold for extraction.
Therefore, this study manually selected sample points and used the SVM for the classification. SVM has a strong small sample learning ability and strong robustness and is an excellent supervised classification algorithm [81]. The actual risk can be minimized by selecting an appropriate function subset and a discriminant function in the subset. Under the circumstances of linear separable, the optimal classification hyperplane of the sample is sought in the original space, and the discriminant function is [82]:
where
Under the condition of linear inseparability, a slack variable ε i ≥ 0 is added, and the samples of low-dimensional input space are mapped to a high-dimensional attribute space by nonlinear mapping, and then transformed into linear separable. The kernel function was introduced to solve the dimensional hazards. Therefore, the linear algorithm was used to analyze the nonlinear samples in the high-dimensional attribute space, and then the optimal classification hyperplane was found in the feature space. Namely [83]:
where
3.3.6 Rockfall characteristics and susceptibility evaluation
When the 3D model is displayed in the vector point cloud, deep information mining can be performed. These parameters provide primary data for the quantitative study of geological hazards and have important guiding significance for the monitoring and analysis of geological hazards. Based on the rockfall mapping, combined with the 3D model and 3D information provided by DEM, this study obtained the leading-edge elevation, trailing-edge elevation, slope height (H), runout distance (L), rockfall area (A), and rockfall volume (V). These parameters were used to analyze the relationship between the collapse volume and its characteristic indices.
Seven causing factors, including elevation, lithology, slope, aspect, relief, and distance to the river, were selected to construct the evaluation system of rockfall causing factors (Figure 5o and p). To optimize the assessment of rockfall susceptibility, four primary factors – elevation, slope, aspect, and local relief – were derived from 1 m resolution DEMs generated by UAV photogrammetry. In addition, lithology and distance to rivers were also processed at a resolution of 1 m to maintain uniformity in data precision, facilitating accurate modeling and analysis. The SVM model was introduced to compile the rockfall susceptibility zoning map of the study area (Figure 5q). The final susceptibility map of rockfall was produced at a 1 m resolution, ensuring high precision in the susceptibility evaluation. Receiver-operating characteristic (ROC) curve was used to evaluate the accuracy of the model. The SVM modeling and classification in this study were implemented using Python 3.10 and the scikit-learn library (version 1.5).
In this study, we introduced several innovations to UAV remote sensing and rockfall susceptibility evaluation, including an enhanced on-site operational procedure with advanced environmental assessment and precise GCP layout using Tapo GPS RTK for increased data accuracy. We adopted an object-based image analysis tailored for high-resolution images, which improved classification accuracy by utilizing spectral, textural, spatial, and contextual information. In addition, we refined rockfall feature extraction through multiscaled solution segmentation and applied an SVM classifier with a radial basis kernel function to handle nonlinear separabilities effectively. These advancements, combined with high-resolution DEM integration and ROC curve assessments, significantly enhanced the methodological rigor and predictive accuracy of rockfall susceptibility evaluations.
4 Result
4.1 Identification results of rockfall
Thirty-three rockfalls were extracted and translated using high-resolution UAV remote sensing images and GIS technology considering the aforementioned method. The distribution of rockfalls is shown in Figure 6a.

The resultant rockfall maps and three typical types of rockfalls in the study area. (a) The resultant rockfall maps. (The blue polygons show the expert-based rockfall maps. The red polygons indicate the OBIA-based rockfall maps.) (b) Piedmont-flat rockfall, (c) Piedmont-blocked rockfall, (d) Gully rockfall.
According to the spatial distribution, the 33 plane forms of rockfall can be divided into three types: piedmont-blocked, piedmont-flat, and ravine types (Figure 6b–d). The piedmont-blocked type was blocked across the slope owing to the collapse of instability. The slope is either orthogonal or oblique to the direction of the landslide so that the entire plane becomes a “T” under the circumstance of the accretion-stopped rockfall. The collapse moves along the ravine-collapse owing to the instability of the ravine collapse with an elongated plane. It is clearly controlled by topography. Owing to the instability, it is not constrained by the side, and the rockfall can expand to the side in the downhill movement. When it moves to a wide valley or platform area, it stops accumulating naturally under the action of friction resistance.
The main concentration of the rockfall area among the 33 was between 1,000 and 10,000 m2, constituting 61% of the total, although 93.8% of the entire rockfall area occurred between 1,000 and 1,00,000 m2. There are 22 volumes range 10,000 and 100,000 m3, accounting for 67% of the total rockfall (Figure 7a). The number of rockfalls with volumes between 1,000 and 10,000 m3 was comparable to those in the 1,00,000–10,00,000 m3 range, with six and five occurrences, respectively (Figure 7b). The slope height of the rockfall in the study area has a prominent characteristic of normal distribution. The peak value from 50 to 100 m and the height from 0 to 50 m is identical to that between 100 and 150 m. The number of collapsed bodies above 100 m decreased gradually with the increase in height (Figure 7c). The peak value of runout distance also appears at 50–100 m, and the numbers of 0–50 m and 100–150 m are equal. There are only two rockfall bodies with a runout distance above 250 m (Figure 7d).

Characteristic statistics of rockfall. (a) Area, (b) volume (c), slope height, and (d) runout distance.
4.2 Accuracy assessments
The extraction accuracy of remote sensing image information can be defined as the level of accuracy of the extraction of ground object information. Extracting accuracy is a universal standard for testing whether the extraction method and model rules are reliable. Through the calculation and analysis of the accuracy of information extraction, the advantages and disadvantages of the method and the results can be judged, which is helpful for the correction of the information extraction model [84]. To quantitatively describe the accuracy of rockfall identification, the same UAV image was used to perform a manual visual interpretation of the rockfall and obtain the rockfall distribution in the study area. One hundred verification points of the rockfall data and 100 verification points of the nonrockfall data were randomly obtained. Through overlay analysis of verification points and extraction results, overall accuracy (OA) and Kappa coefficient were used to measure the identification accuracy (Table 3). According to the statistical calculation, the OA of the rockfall recognition method using the combination of object-oriented and SVM algorithms was 93%, and the Kappa coefficient was 0.7967, indicating a high recognition accuracy. The application of the SVM model to UAV-based remote sensing data effectively discriminated between rockfall and nonrockfall regions. The high-dimensional feature space created by UAV image attributes, such as texture and shape, significantly enhanced SVM’s performance. This practical efficacy of SVM, especially its theoretical efficiency in managing nonlinear and high-dimensional data, was corroborated by our experiment, where the SVM achieved an accuracy of 93%, closely aligning with theoretical expectations and confirming its robust capability in real-world applications.
Accuracy verification confusion matrix
| Parameter | Results of the method in this paper | |
|---|---|---|
| Rockfall | Non-rockfall | |
| Rockfall sample points | 149 | 12 |
| Nonrockfall sample points | 2 | 37 |
| The overall accuracy | 93% | |
| Kappa | 0.7967 | |
4.3 Relationship between rockfall and influence factors
In this study, six factors such as elevation, slope, aspect, relief, lithology, and distance to the river were selected, and GIS software was used to calculate the relationship between the six factors and rockfall hazard. The slope data were divided into eight grades and intervals of 10°. The aspect is divided into nine grades; the relief is divided into five grades; the elevation is divided into seven grades according to 100 m intervals. The distance from the water system is graded by 200 m. The lithology can be divided into three types according to the engineering geological rock group (Figure 8). According to this classification, data of the elevation, slope, aspect, relief, lithology, and distance to the river in the whole area were reclassified, and the area within each data range was counted. The ratio of the grid area within each elevation, slope, aspect, relief, lithology, and distance to the river within the rockfall range to the grid area within each elevation, slope, aspect, relief, lithology, and distance to the river within the rockfall range was used as the area density of the rockfall.
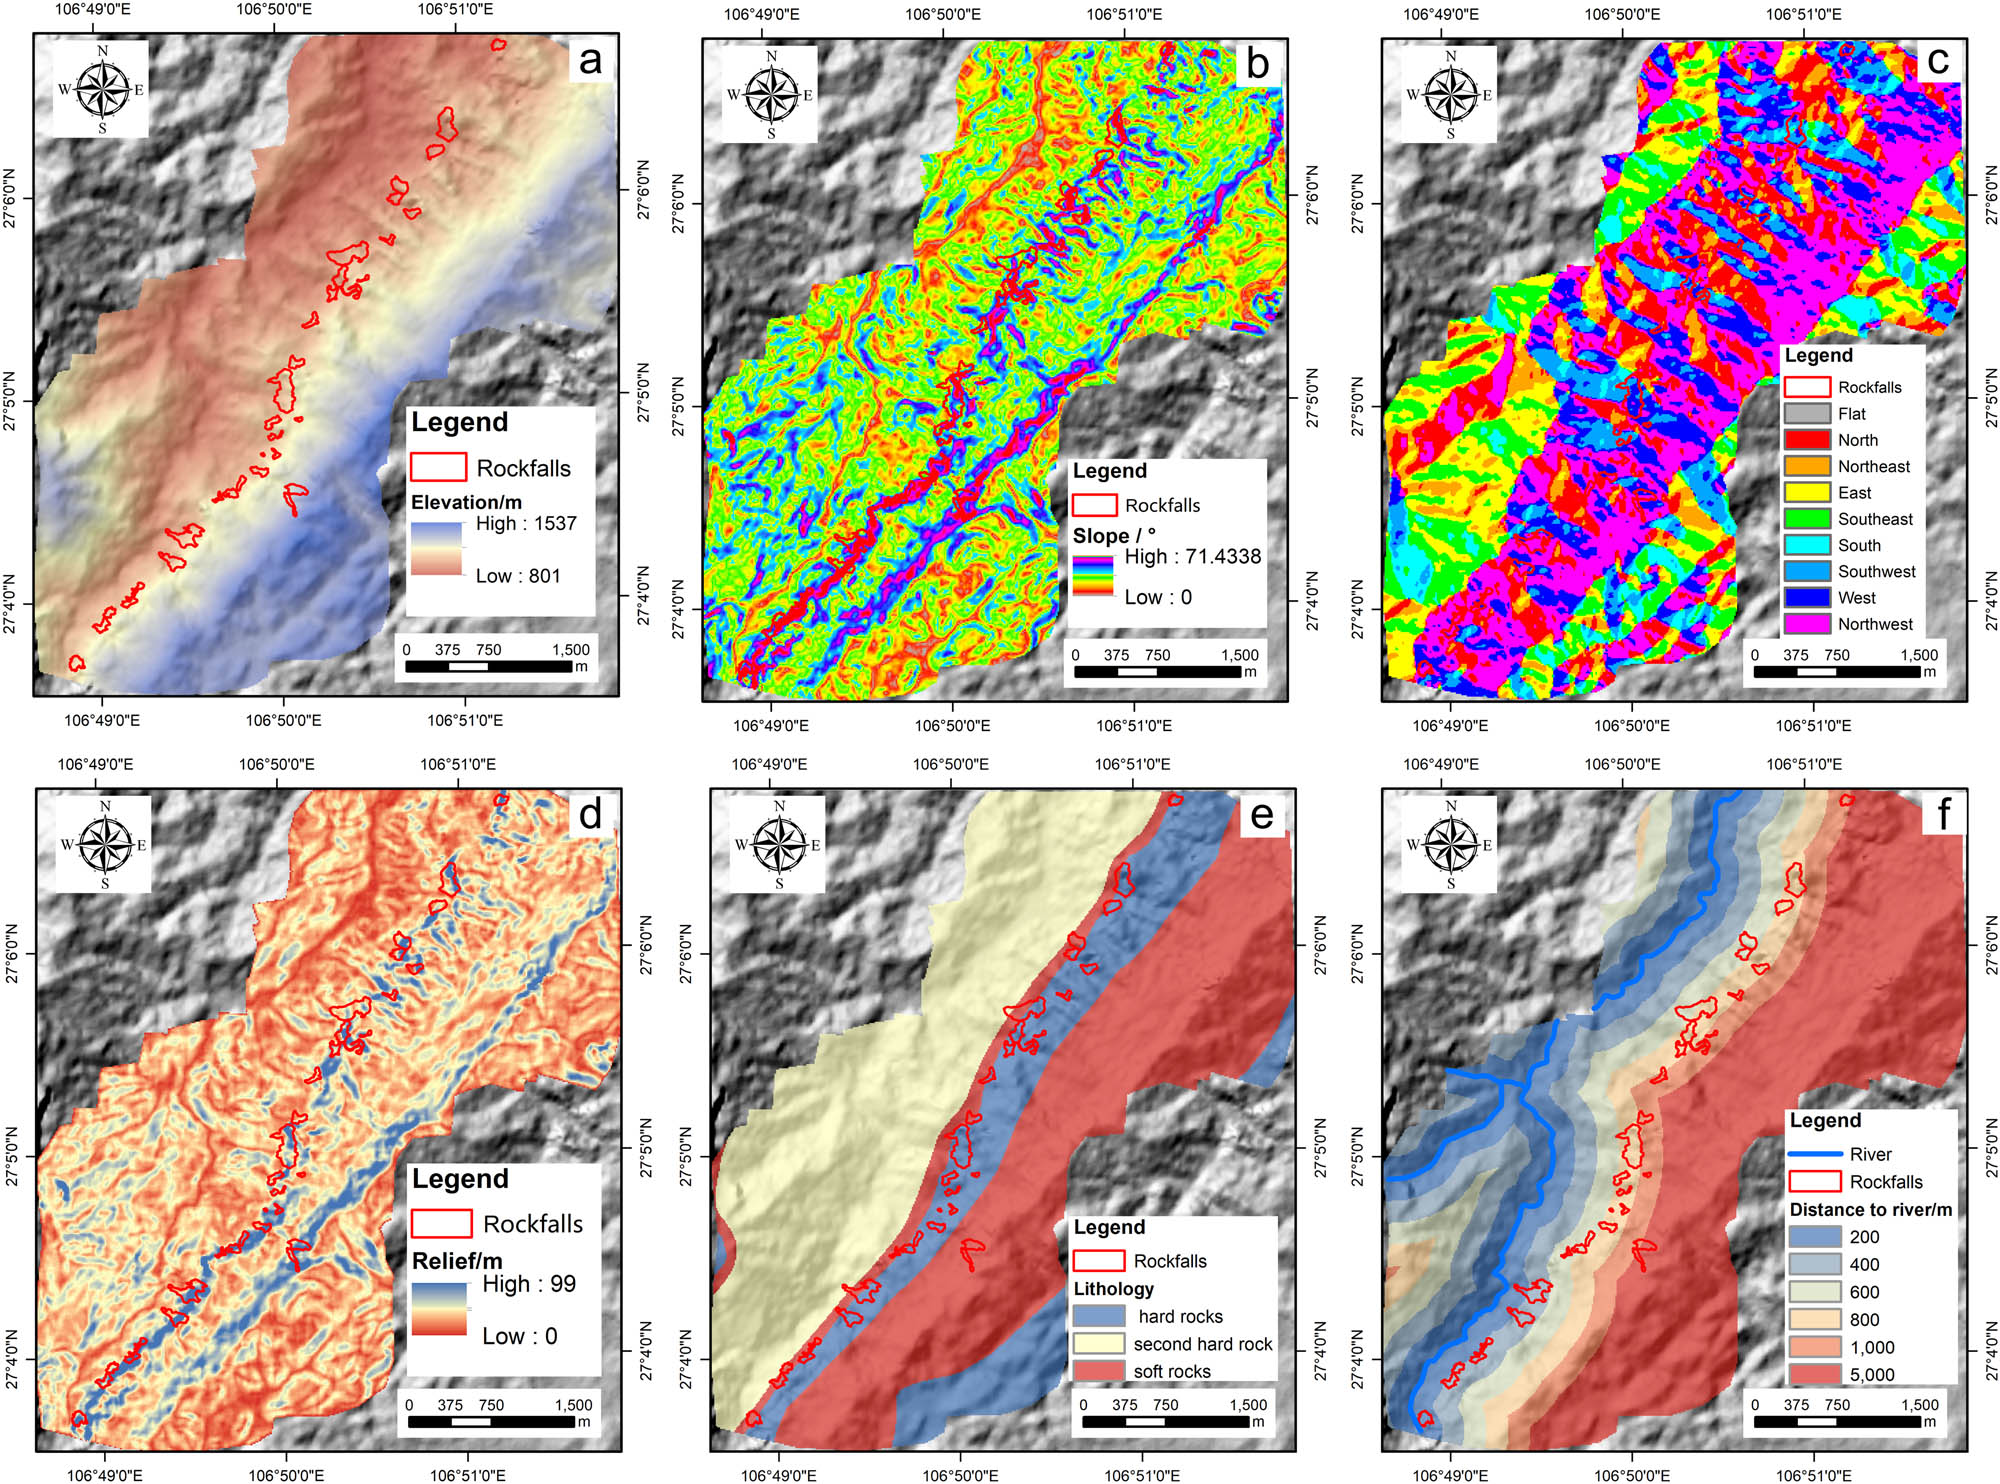
Maps of evaluation factors for the rockfalls. (a) elevation; (b) slope; (c) aspect; (d) relief; (e) lithology; (f) distance to the river.
The elevation range of the study area was 893–1,430 m. According to 100 m intervals, the study area can be divided into seven categories: 893–900, 900–1,000, 1,000–1,100, 1,100–1,200, 1,200–1,300, 1,300–1,400, and 1,400–1,430 m, covering 2.49 km2 respectively, 3.74, 3.29, 2.33, 2.40, 2.48, and 2.46 km2. The analysis shows that the rockfall distribution in different elevation ranges has obvious normal distribution characteristics, and the peak value appears in the range of 1,000–1,100 m. The density of the rockfall surface was 0.057/km2, and the rockfall area density was low at elevations below 900 m and over 1,200 m (Figure 9a).

Relationship between topographic factors and rockfall. (a) elevation; (b) slope; (c) aspect; (d) relief; (e) lithology; and (f) distance to the river.
The slope range of the study area is 0°–80°, and the study area is divided into eight categories at an interval of 10°: 0°–10°, 10°–20°, 20°–30°, 30°–40°, 40°–50°, 50°–60°, 60°–70°, and 70°–80°, and the eight categories account for 1.61 km2, respectively, 5.36, 6.72, 3.44, 1.11, 0.61, 0.33, and 0.05 km2. The rockfall occurs in the range of 30°–60°, and the slope range of 40°–50° is the most frequent. The rock mass in this range was relatively broken and has a better open surface; therefore, rockfall hazards are mainly developed. When the slope is greater than 60°, the slope surface is a rock mass with better integrity; therefore, it is not easy for rockfalls to occur. Within the slope range of 0°–80°, the rockfall area density generally increases with an increase in the slope (Figure 9b).
The study area was divided into nine categories such as flat, N, NE, E, SE, S, SW, W, and NW, covering 0.17 km², respectively, 2.96, 1.65, 2.08, 2.19, 1.10, 1.60, 2.62, and 4.80 km2. The rockfall is mainly distributed in the range of the W and NW aspects. The changing trend of the rockfall area density in different aspects is consistent with the rockfall number. The slope direction with the highest rockfall area density was in the W direction, which was 0.045 km2 (Figure 9c).
The range of relief in the study area was 0–99 m. According to the natural discontinuous method, the study can be divided into five categories: 0–10, 10–18, 18–28, 28–44, and 44–99 m, covering an area of 6.10, 8.41, 3.78, 1.04, and 0.17 km2, respectively. The rockfall is mainly distributed in the range of 10–44 m. In the range of relief at 0–99 m, there is a negative correlation between the rockfall area density and relief, and the density of rockfall increases with the increase in relief (Figure 9d).
In the study area, the lithology formations can be categorized into three types: hard rock, second hard rock, and soft rock, covering areas of 3.87, 7.69, and 7.61 km2, respectively (Figure 8e). The hard rock group has the highest density, and its collapsed areas account for 64.3% of the total, with a density of 0.062/km2 (Figure 9e).
To better understand the distribution of collapsed areas, the buffer zone around the main river was divided into six zones: <200, 200–400, 400–600, 600–800, 800–1,000, and >1,000 m (as shown in Figure 8f). The areas of these zones are 3.67, 2.88, 2.15, 1.65, 1.43, and 7.35 km2, respectively. The collapsed areas are concentrated in the range of 600–800 m from the river, representing 46.83% of the total collapsed area, with a density of 0.106/km2 (Figure 9f).
According to the statistics of the relationship between rockfall and elevation, slope, aspect, relief, lithology, and distance to the river, the results show that rockfall mainly occurs at elevations of 1,000–1,100 m, a slope of 40°–50°, the west aspect, relief of 10–44 m, the hard rock formations, and distance from river between 600–800 m.
4.4 Rockfall susceptibility mapping
The SVM model was utilized to assess the susceptibility mapping of rockfalls. A sample set of 100 independent units was randomly selected in the rockfall area, and an equal number of independent units were chosen in the nonrockfall area for susceptibility assessment. The sample set was split into two parts, with 70% of the units being randomly selected as the training sample set and the remaining 30% as the validation sample set. The radial basis kernel function was used as the kernel function of the model, and the parameter values of the SVM model, namely, c and γ, were determined via cross-validation. The resulting parameter values were c = 12 and γ = 0.8.
Subsequently, the trained model was used to assess all the units in the study area, and the susceptibility levels of the area were classified into five categories: very low, low, moderate, high, and very high. This classification was based on the natural breakpoint method combined with the results obtained from the SVM model. The resulting rockfall susceptibility zoning map of the study area is depicted in Figure 10a. Furthermore, the historical rockfall map was overlaid to obtain the number and area of rockfalls in each zone (Figure 10b).

(a) Rockfall susceptibility zoning map of the study area. (b) The proportion of the area within each partition and the proportion of the rockfall area. (c) ROC curve.
The research findings indicate that high and very high rockfall-prone areas exhibit a band-like distribution in the central part of the study area. With respect to the proportion of historical rockfalls in each level of rockfall-prone areas, the low and very low rockfall-prone areas cover 75.60% of the total area, but only 7.39% of historical rockfalls occurred in this area. Although the high and very high rockfall-prone areas account for only 8.22% of the province’s total area, 64.53% of historical rockfalls occurred in this area. As the level of rockfall-prone areas ascends from low to high, the area percentage decreases, while the number of historical rockfall sites increases, fully conforming to the characteristics of geohazard susceptibility zoning. Furthermore, the evaluation results are essentially consistent with the distribution of historical rockfall disaster points, signifying the accuracy and dependability of the zoning outcomes.
To evaluate the effectiveness of the SVM model, the ROC curve was employed. The ROC curve plots the true positive rate on the vertical axis and the false positive rate on the horizontal axis, and the model’s fit is calculated by drawing different susceptibility thresholds. The area under the ROC curve (AUC) ranges from 0.5 to 1, with higher values indicating better predictive ability of the model. As depicted in Figure 10c, the AUC of the SVM model curve is 0.896, indicating a prediction accuracy of 89.6%. This AUC value is derived from the analysis conducted on the testing samples, underscoring the model’s robust predictive performance in real-world scenarios. Therefore, it can be concluded that using the SVM model for rockfall susceptibility evaluation is highly accurate.
5 Discussion
5.1 Relationships and correlations
5.1.1 Relation between volume and area of rockfall
In this study, the correlation between the volume and area of rockfall was established based on a combination of UAV image interpretation and field surveys. The areas of the rockfall were primarily derived from UAV-interpreted rockfall inventories, while the volumes were estimated by measuring the thickness of rockfall deposits during field surveys, combined with the areas identified from UAV data. This method of volume estimation integrates direct field measurements with high-resolution UAV imaging, ensuring a robust empirical basis for modeling the relationship (Figure 11). The correlation formula, Log(V) = 0.70692 Log(A) + 0.684 with an R² of 0.92316, reflects this comprehensive approach. Therefore, the rockfall formula can be used to estimate the rockfall volume in the area. Considering the uncertainty in the empirical equation, two empirical relations were used to determine the boundary of the affected region, which are the upper 95% and the lower 95% prediction intervals, respectively.

Relationship between volume and area of rockfall.
5.1.2 Relationship between slope height and rockfall scale
The slope height has a significant effect on the rockfall scale. The discrepancy in elevation has a significant effect on the shape and distribution of rockfall accumulation. The sizes with the same discrepancy in elevation also varied significantly. The relationship between the slope height (H) and rockfall area (A) and volume (V) is shown in Figure 12. There is a power function relationship between rockfall area (A) and slope height (H) in log-log coordinates: A = 56.363 h 1.1052 and R 2 = 0.5749. There is also a power function relationship between rockfall volume (V) and slope height (H): V = 56.792 h 1.4354 , R 2 = 0.5249, the rockfall area and volume are significantly related to the slope height, indicating that the rockfall scale is significantly affected by the slope height.

Relationship between rockfall scale and slope height. (a) Relationship between area and slope height. (b) Relationship between volume and slope height.
5.1.3 Relationship between runout distance and rockfall scale
The relationship between the runout distance of the 33 rockfalls and the rockfall area (A) and volume (V) is shown in Figure 13. There is also a positive correlation power function between the runout distance L and the rockfall area A and volume V in the log-log coordinate. The determination coefficients are 0.5487 and 0.5031, respectively, indicating that the rockfall volume is more affected by the slope height than the migration distance.

Relationship between rockfall scale and runout distance. (a) Relationship between area and runout distance. (b) Relationship between volume and runout distance.
5.1.4 Relationship between runout distance and slope height
Generally, the slope height of a rockfall is positively correlated with its horizontal runout distance. For a sliding body of the same volume, the higher the slope height, the greater the potential energy of the sliding body, so that the sliding distance will be longer. As shown in Figure 14, there is a significant linear growth relationship between the runout distance of the landslide in the study area and its slope height, which meets the requirement of

Relationship between rockfall runout distance and slope height.
We analyzed the probability density of the equivalent friction coefficient, defined as the ratio of landslide height (H) to landslide travel distance (L), for 33 rockfalls, as shown in Figure 15. The H/L ratio of rockfall ranges from 0.1 to 1.02, with an average of 0.69.

Probability density of the H/L of the rockfalls.
5.2 Advantages, disadvantages, and uncertainty
Rockfall is a natural hazard that threatens infrastructure, property, and human lives, and it is crucial to identify its geological features and assess its potential danger. The use of UAVs and remote sensing technologies has shown great potential in quantitatively extracting geological feature information of rockfall. A method for the quantitative extraction of rockfall geological feature information and susceptibility evaluation using UAV remote sensing technology is proposed, including on-site operation, photo processing, and rockfall hazard identification and susceptibility evaluation. The method has advantages in quickly obtaining surface data and providing high-resolution 3D models, offering significant advantages over traditional methods. Traditional pixel-based classification methods struggle with high-resolution data from UAVs due to sensitivity to noise and variations in image quality. However, modern deep learning approaches like CNNs process large and complex datasets effectively. Despite their proficiency, these techniques require extensive computational resources and training data. Our object-based image analysis (OBIA) approach not only improves accuracy but is also more adaptable to real-time applications in challenging terrains due to its lower resource demands, illustrating its efficacy and practical advantages. However, it also has limitations in requiring technical proficiency from operators, encountering adverse weather or environmental interference, and demanding high equipment investment and resources. Uncertainty in the method mainly comes from the on-site operation stage, and appropriate processing and correction are necessary to improve data reliability and accuracy.
SVM is a popular approach in assessing the susceptibility zoning of geological hazards, including rockfall. The SVM model accurately predicts the high and very high rockfall-prone areas and handles complex datasets with a high degree of accuracy. We contrasted the SVM approach, which utilizes a radial basis function kernel, with modern techniques such as CNNs, widely used in image recognition, and random forests, known for their robust classification capabilities. Our findings indicated that SVM displayed comparable accuracy to CNNs but was more efficient in terms of training time and interpretability and, crucially, does not require extensive training datasets, which is particularly advantageous in geologically diverse areas where data collection is challenging. However, the SVM model requires careful parameter selection, and the choice of kernel function can affect its accuracy. Moreover, the generalizability of the model is uncertain and may be affected by changes in the environment. Future studies should focus on developing more robust and reliable modeling techniques that can handle the complexity and uncertainty associated with geological hazard evaluation.
In conclusion, the proposed method of using UAV remote sensing technology and SVM model for rockfall geological feature information extraction and susceptibility evaluation has significant advantages over traditional methods. However, it also has limitations and uncertainties that need to be carefully considered before applying it to real-world scenarios. Future research should focus on developing more robust and reliable modeling techniques that can handle the complexity and uncertainty associated with geological hazard evaluation.
6 Conclusions
This study introduces an efficient, object-oriented method for extracting rockfall information using UAV remote sensing, well suited to the complex terrains of mountainous forests. The method not only offers significant time and cost advantages but also maintains a high spatial resolution ideal for quick data collection after rockfall events. Our object-oriented approach achieved an extraction accuracy of 93% and a Kappa coefficient of 0.7967, showing high identification accuracy. Analysis of rockfall distribution revealed that most occurrences are within the 1,000–10,000 m² size range and volumes largely between 10,000 and 100,000 m³. These findings underscore a significant correlation between rockfall volume and other geographic characteristics such as area, slope height, and runout distance, with a power function relationship evident on logarithmic scales.
Critical zones for rockfall were pinpointed at elevations of 1,000–1,100 m, on slopes of 40°–50°, with west aspects, and near hard rock formations 600–800 m from rivers. Employing the SVM model, the study conducted a susceptibility regionalization that indicated high and extremely high-risk areas correspond closely with historical landslide data, validating the model’s effectiveness and reliability with an AUC of 0.896 in the ROC analysis. These insights provide a scientific basis for future dedicated risk assessments and geological engineering initiatives aimed at mitigating economic losses and minimizing casualties from geological hazards in Jinzhong Town.
-
Funding information: This study was supported by the Guizhou Province Department of Water Resources Science and Technology Funding Project (Project Number: KT202306) and the Guizhou Provincial Basic Research Program (Natural Science) (ZK [2021] Basic 200, ZK [2021] Basic 512), the Science and Technology project of Guizhou Provincial Department of Communications (2020-123-003) and the Startup Research Foundation for High-Level Talents of Guizhou University ((2017)76).
-
Author contributions: Conceptualization, L.Z. and Y.Q.; methodology, L.Z. and Y.Q.; software, Y.Q.; validation, Y.Q.; formal analysis, W.Z.; investigation, Y.Q. and L.Z.; resources, K.L. and G.Y.; data curation, Y.Q. and G.Y.; writing – original draft preparation, L.Z. and Y.Q.; writing – review and editing, K.L. and G.Y.; visualization, Y.Q.; supervision, G.Y. and W.Z.; project administration, Y.Q.; funding acquisition, Y.Q. All authors have read and agreed to the published version of the manuscript.
-
Conflict of interest: The authors declare no conflict of interest.
-
Data availability statement: NA.
References
[1] Varnes DJ. Landslide Varnes landslide hazard zonation: a review of principles and practice. Nat Hazards. 1984;3:63.Search in Google Scholar
[2] Wang X, Frattini P, Stead D, Sun J, Liu H, Valagussa A, et al. Dynamic rockfall risk analysis. Eng Geol. 2020;272:105622. 10.1016/j.enggeo.2020.105622.Search in Google Scholar
[3] Dussauge C, Grasso J-R, Helmstetter A. Statistical analysis of rockfall volume distributions: implications for rockfall dynamics. J Geophys Res. 2003;108(B6):2286. 10.1029/2001JB000650.Search in Google Scholar
[4] Moos C, Khelidj N, Guisan A, Lischke H, Randin CF. A quantitative assessment of rockfall influence on forest structure in the swiss alps. Eur J For Res. 2021;140(1):91–104. 10.1007/s10342-020-01317-0.Search in Google Scholar
[5] Chau KT, Wong RHC, Liu J, Lee CF. Rockfall hazard analysis for hong kong based on rockfall inventory. Rock Mech Rock Eng. 2003;36(5):383–408. 10.1007/s00603-002-0035-z.Search in Google Scholar
[6] Agliardi F, Crosta GB. High resolution three-dimensional numerical modelling of rockfalls. Int J Rock Mech Min Sci. 2003;40(4):455–71. 10.1016/S1365-1609(03)00021-2.Search in Google Scholar
[7] Frattini P, Crosta G, Carrara A, Agliardi F. Assessment of rockfall susceptibility by integrating statistical and physically based approaches. Geomorphology. 2008;94(3–4):419–37. 10.1016/j.geomorph.2006.10.037.Search in Google Scholar
[8] Weidinger JT, Korup O, Munack H, Altenberger U, Dunning SA, Tippelt G, et al. Giant rockslides from the Inside. Earth Planet Sci Lett. 2014;389:62–73. 10.1016/j.epsl.2013.12.017.Search in Google Scholar
[9] Korup O, Densmore AL, Schlunegger F. The role of landslides in mountain range evolution. Geomorphology. 2010;120(1–2):77–90. 10.1016/j.geomorph.2009.09.017.Search in Google Scholar
[10] Gökçeoǧlu C, Ercanoǧlu M. Uncertainties on the parameters employed of landslide susceptibility maps. Yerbilimleri. 2001;22(23):189–206.Search in Google Scholar
[11] Corona C, Trappmann D, Stoffel M. Parameterization of rockfall source areas and magnitudes with ecological recorders: when disturbances in trees serve the calibration and validation of simulation runs. Geomorphology. 2013;202:33–42. 10.1016/j.geomorph.2013.02.001.Search in Google Scholar
[12] Wen H, Hu J, Zhang J, Zhou X, Liao M. Explainable machine learning model for rockfall susceptibility evaluation. Geo-risk. 2023;2023:102–10.10.1061/9780784484982.011Search in Google Scholar
[13] Wen H, Hu J, Zhang J, Xiang X, Liao M. Rockfall susceptibility mapping using XGBoost model by hybrid optimized factor screening and hyperparameter. Geocarto Int. 2022;37(27):16872–99. 10.1080/10106049.2022.2120547.Search in Google Scholar
[14] Fanos AM, Pradhan B, Alamri A, Lee C-W. Machine learning-based and 3D Kinematic models for rockfall hazard assessment using LiDAR data and GIS. Remote Sens. 2020;12(11):1755. 10.3390/rs12111755.Search in Google Scholar
[15] Malamud BD, Turcotte DL, Guzzetti F, Reichenbach P. Landslide inventories and their statistical properties. Earth Surf Process Landforms. 2004;29(6):687–711. 10.1002/esp.1064.Search in Google Scholar
[16] Lahousse T, Chang KT, Lin YH. landslide mapping with multi-scale object-based image analysis – a case study in the baichi Watershed, Taiwan. Nat Hazards Earth Syst. 2011;11(10):2715–26. 10.5194/nhess-11-2715-2011.Search in Google Scholar
[17] Qin Y, Yang G, Lu K, Sun Q, Xie J, Wu Y. Performance evaluation of five gis-based models for landslide susceptibility prediction and mapping: a case study of Kaiyang County, China. Sustainability. 2021;13(11):6441. 10.3390/su13116441.Search in Google Scholar
[18] Behling R, Roessner S, Golovko D, Kleinschmit B. Derivation of long-term spatiotemporal landslide activity – a multi-sensor time series approach. Remote Sens Environ. 2016;186:88–104. 10.1016/j.rse.2016.07.017.Search in Google Scholar
[19] Brardinoni F, Slaymaker O, Hassan MA. Landslide inventory in a rugged forested watershed: a comparison between air-photo and field survey data. Geomorphology. 2003;54(3–4):179–96. 10.1016/S0169-555X(02)00355-0.Search in Google Scholar
[20] van Westen CJ, Lulie Getahun F. Analyzing the evolution of the tessina landslide using aerial photographs and digital elevation models. Geomorphology. 2003;54(1–2):77–89. 10.1016/S0169-555X(03)00057-6.Search in Google Scholar
[21] Guzzetti F, Mondini AC, Cardinali M, Fiorucci F, Santangelo M, Chang K-T. Landslide inventory maps: new tools for an old problem. Earth Sci Rev. 2012;112(1–2):42–66. 10.1016/j.earscirev.2012.02.001.Search in Google Scholar
[22] Jaboyedoff M, Oppikofer T, Abellán A, Derron M-H, Loye A, Metzger R, et al. Use of LIDAR in landslide investigations: a review. Nat Hazards. 2012;61(1):5–28. 10.1007/s11069-010-9634-2.Search in Google Scholar
[23] McKean J, Roering J. Objective landslide detection and surface morphology mapping using high-resolution airborne laser altimetry. Geomorphology. 2004;57(3–4):331–51. 10.1016/S0169-555X(03)00164-8.Search in Google Scholar
[24] Schulz WH. Landslide susceptibility revealed by LIDAR imagery and historical records, seattle, Washington. Eng Geol. 2007;89(1–2):67–87. 10.1016/j.enggeo.2006.09.019.Search in Google Scholar
[25] Runqiu H, Xiujun D. Application of three-dimensional laser scanning and surveying in geological investigation of high rock slope. J China Univ Geosci. 2008;19(2):184–90. 10.1016/S1002-0705(08)60037-0.Search in Google Scholar
[26] Fanos AM, Pradhan B. A novel rockfall hazard assessment using laser scanning data and 3D modelling in GIS. CATENA. 2019;172:435–50. 10.1016/j.catena.2018.09.012.Search in Google Scholar
[27] Ferrero AM, Migliazza M, Roncella R, Rabbi E. Rock slopes risk assessment based on advanced geostructural survey techniques. Landslides. 2011;8(2):221–31. 10.1007/s10346-010-0246-4.Search in Google Scholar
[28] Bonano M, Calò F, Manunta M, Paglia L, Zeni G. Long-Term analysis of landslides via SBAS-DInSAR technique. In: Margottini C, Canuti P, Sassa K, editors. Landslide science and practice. Vol. 2, Berlin Heidelberg: Berlin: Springer; 2013. p. 141–6. Early Warning, Instrumentation and Monitoring.10.1007/978-3-642-31445-2_18Search in Google Scholar
[29] Singhroy V, Molch K. Characterizing and monitoring rockslides from SAR techniques. Adv Space Res. 2004;33(3):290–5. 10.1016/S0273-1177(03)00470-8.Search in Google Scholar
[30] Monserrat O, Crosetto M, Luzi G. A review of ground-based sar interferometry for deformation measurement. ISPRS J Photogramm. 2014;93:40–8. 10.1016/j.isprsjprs.2014.04.001.Search in Google Scholar
[31] Frukacz M, Wieser A. On the impact of rockfall catch fences on ground-based radar interferometry. Landslides. 2017;14(4):1431–40. 10.1007/s10346-017-0795-x.Search in Google Scholar
[32] Miles C, Gomez F, Rosenblad BL, Fulks J, Loehr JE. Quantifying measurement capabilities of ground-based interferometric radar for rockfall hazard applications. Geotech Test J. 2020;43(4):985–1002. 10.1520/GTJ20190018.Search in Google Scholar
[33] Liang R, Dai K, Shi X, Guo B, Dong X, Liang F, et al. Automated mapping of Ms 7.0 Jiuzhaigou earthquake (China) post-disaster landslides based on high-resolution UAV imagery. Remote Sens. 2021;13(7):1330. 10.3390/rs13071330.Search in Google Scholar
[34] Fan X, Scaringi G, Korup O, West AJ, Westen CJ, Tanyas H, et al. Earthquake – induced chains of geologic hazards: patterns, mechanisms, and impacts. Rev Geophys. 2019;57(2):421–503. 10.1029/2018RG000626.Search in Google Scholar
[35] Niethammer U, Rothmund S, Schwaderer U, Zeman J, Joswig M. Open source image-processing tools for low-cost UAV-BASED landslide investigations. Int Arch Photogramm Remote Sens Spat Inf Sci. 2012;XXXVIII-1/C22:161–6. 10.5194/isprsarchives-XXXVIII-1-C22-161-2011.Search in Google Scholar
[36] Jiang W, Xi J, Li Z, Zang M, Chen B, Zhang C, et al. Deep learning for landslide detection and segmentation in high-resolution optical images along the sichuan-tibet transportation corridor. Remote Sens. 2022;14:5490. 10.3390/rs14215490.Search in Google Scholar
[37] Lucieer A, Malenovský Z, Veness T, Wallace L, Hyper U-I. HyperUAS-imaging spectroscopy from a multirotor unmanned aircraft system. J Field Robot. 2014;31(4):571–90. 10.1002/rob.21508.Search in Google Scholar
[38] Prosdocimi M, Calligaro S, Sofia G, Dalla Fontana G, Tarolli P. Bank erosion in agricultural drainage networks: new challenges from structure-from-motion photogrammetry for post-event analysis. Earth Surf Process Landforms. 2015;40(14):1891–906. 10.1002/esp.3767.Search in Google Scholar
[39] Dandois JP, Ellis EC. Remote sensing of vegetation structure using computer vision. Remote Sens. 2010;2(4):1157–76. 10.3390/rs2041157.Search in Google Scholar
[40] Jaakkola A, Hyyppä J, Kukko A, Yu X, Kaartinen H, Lehtomäki M, et al. A low-cost multi-sensoral mobile mapping system and its feasibility for tree measurements. ISPRS J Photogramm. 2010;65(6):514–22. 10.1016/j.isprsjprs.2010.08.002.Search in Google Scholar
[41] Breckenridge RP, Dakins M, Bunting S, Harbour JL, Lee RD. Using unmanned helicopters to assess vegetation cover in sagebrush steppe ecosystems. Rangel Ecol Manag. 2012;65(4):362–70. 10.2111/REM-D-10-00031.1.Search in Google Scholar
[42] Adams SM, Levitan ML, Friedland CJ. High resolution imagery collection for post-disaster studies utilizing unmanned aircraft systems (UAS). Photogramm Eng Remote Sens. 2014;80(12):1161–8. 10.14358/PERS.80.12.1161.Search in Google Scholar
[43] Fernández-Hernandez J, González-Aguilera D, Rodríguez-Gonzálvez P, Mancera-Taboada J. Image-based modelling from unmanned aerial vehicle (UAV) photogrammetry: an effective, low-cost tool for archaeological applications. Archaeometry. 2015;57(1):128–45. 10.1111/arcm.12078.Search in Google Scholar
[44] Garnica-Peña RJ, Alcántara-Ayala I. The use of UAVs for landslide disaster risk research and disaster risk management: a literature review. J Mt Sci. 2021;18(2):482–98. 10.1007/s11629-020-6467-7.Search in Google Scholar
[45] Greenwood F, Nelson EL, Greenough PG. Flying into the hurricane: A case study of UAV use in damage assessment during the 2017 hurricanes in Texas and Florida. PLoS One. 2020;15:e0227808. 10.1371/journal.pone.0227808.Search in Google Scholar PubMed PubMed Central
[46] Schaefer M, Teeuw R, Day S, Zekkos D, Weber P, Meredith T, et al. Low-cost UAV surveys of hurricane damage in Dominica: automated processing with co-registration of pre-hurricane imagery for change analysis. Nat Hazards. 2020;101:755–84. 10.1007/s11069-020-03893-1.Search in Google Scholar
[47] Xu Z, Yang J, Peng C, Wu Y, Jiang X, Li R, et al. Development of an UAS for post-earthquake disaster surveying and its application in Ms7.0 Lushan Earthquake, Sichuan, China. Comput Geosci. 2014;68:22–30. 10.1016/j.cageo.2014.04.001.Search in Google Scholar
[48] Franke KW, Rollins KM, Ledezma C, Hedengren JD, Wolfe D, Ruggles S, et al. Reconnaissance of two liquefaction sites using small unmanned aerial vehicles and structure from motion computer vision following the april 1, 2014 chile earthquake. J Geotech Geoenviron Eng. 2017;143(5):04016125. 10.1061/(asce)gt.1943-5606.0001647.Search in Google Scholar
[49] Li X-n, Ling S-x, Sun C-w, Xu J-x, Huang T. Integrated rockfall hazard and risk assessment along highways: An example for Jiuzhaigou area after the 2017 Ms 7.0 Jiuzhaigou earthquake, China. J Mt Sci. 2019;16:1318–35. 10.1007/s11629-018-5355-x.Search in Google Scholar
[50] Wang J, Zhu S, Luo X, Chen G, Xu Z, Liu X, et al. Refined micro-scale geological disaster susceptibility evaluation based on UAV tilt photography data and weighted certainty factor method in Mountainous Area. Ecotoxicol Environ Saf. 2020;189:110005. 10.1016/j.ecoenv.2019.110005.Search in Google Scholar PubMed
[51] Yating X, Xingmin M, Peng G, Kai L, Guan C. The correlation of spatial distribution between surface deformation and landslides by SBAS-InSAR and spatial analysis in Longnan Region, China. Open Civil Eng J. 2015;9:867–76. 10.2174/1874149501509010867.Search in Google Scholar
[52] Nikolakopoulos KG, Kyriou A, Koukouvelas IK. Developing a guideline of unmanned aerial vehicle’s acquisition geometry for landslide mapping and monitoring. Appl Sci. 2022;12:4598. 10.3390/app12094598.Search in Google Scholar
[53] Luo W, Gan S, Yuan X, Gao S, Bi R, Hu L. Test and analysis of vegetation coverage in open-pit phosphate mining area around dianchi lake using UAV–VDVI. Sensors. 2022;22:6388. 10.3390/s22176388.Search in Google Scholar PubMed PubMed Central
[54] Wang Y, Yin D, Lou L, Li X, Cheng P, Huang Y. Luotuo mountain waste dump cover interpretation combining deep learning and VDVI based on data from an unmanned aerial vehicle (UAV). Remote Sens. 2022;14:4043. 10.3390/rs14164043.Search in Google Scholar
[55] Zhou H, Fu L, Sharma RP, Lei Y, Guo J. A hybrid approach of combining random forest with texture analysis and VDVI for desert vegetation mapping based on UAV RGB data. Remote Sens. 2021;13:1891. 10.3390/rs13101891.Search in Google Scholar
[56] Zheng D, Frost JD, Huang RQ, Liu FZ. Failure process and modes of rockfall induced by underground mining: A case study of Kaiyang Phosphorite Mine rockfalls. Eng Geol. 2015;197:145–57. 10.1016/j.enggeo.2015.08.011.Search in Google Scholar
[57] Mignelli C, Lo Russo S, Peila D. Rockfall risk management assessment: the RO.MA. approach. Nat Hazards. 2012;62:1109–23. 10.1007/s11069-012-0137-1.Search in Google Scholar
[58] Colomina I, Molina P. Unmanned aerial systems for photogrammetry and remote sensing: A review. ISPRS J Photogramm Remote Sens. 2014;92:79–97. 10.1016/j.isprsjprs.2014.02.013.Search in Google Scholar
[59] Jiménez-Jiménez SI, Ojeda-Bustamante W, Marcial-Pablo M, Enciso J. Digital terrain models generated with low-cost UAV photogrammetry: methodology and accuracy. ISPRS Int J Geo-Inf. 2021;10(5):285. 10.3390/ijgi10050285.Search in Google Scholar
[60] Huang H, Long J, Yi W, Yi Q, Zhang G, Lei B. A method for using unmanned aerial vehicles for emergency investigation of single geo-hazards and sample applications of this method. Nat Hazards Earth Syst Sci. 2017;17:1961–79. 10.5194/nhess-17-1961-2017.Search in Google Scholar
[61] Niethammer U, James MR, Rothmund S, Travelletti J, Joswig M. UAV-based remote sensing of the Super-Sauze landslide: Evaluation and results. Eng Geol. 2012;128:2–11. 10.1016/j.enggeo.2011.03.012.Search in Google Scholar
[62] Lucieer A, Jong SMd, Turner D. Mapping landslide displacements using Structure from Motion (SfM) and image correlation of multi-temporal UAV photography. Prog Phys Geogr: Earth Environ. 2013;38:97–116. 10.1177/0309133313515293.Search in Google Scholar
[63] Kyriou A, Nikolakopoulos K, Koukouvelas I. How image acquisition geometry of UAV campaigns affects the derived products and their accuracy in areas with complex geomorphology. ISPRS Int J Geo-Inf. 2021;10(6):408. 10.3390/ijgi10060408.Search in Google Scholar
[64] Santamaria E, Pastor E, Barrado C, Prats X, Royo P, Perez M. Flight plan specification and management for unmanned aircraft systems. J Intell Robotic Syst. 2012;67:155–81. 10.1007/s10846-011-9648-3.Search in Google Scholar
[65] James MR, Robson S, d’Oleire-Oltmanns S, Niethammer U. Optimising UAV topographic surveys processed with structure-from-motion: Ground control quality, quantity and bundle adjustment. Geomorphology. 2017;280:51–66. 10.1016/j.geomorph.2016.11.021.Search in Google Scholar
[66] Westoby MJ, Brasington J, Glasser NF, Hambrey MJ, Reynolds JM. ‘Structure-from-Motion’ photogrammetry: A low-cost, effective tool for geoscience applications. Geomorphology. 2012;179:300–14. 10.1016/j.geomorph.2012.08.021.Search in Google Scholar
[67] Snavely N, Seitz SM, Szeliski R. Modeling the world from internet photo collections. Int J Comput Vis. 2007;80:189–210. 10.1007/s11263-007-0107-3.Search in Google Scholar
[68] Rossi G, Tanteri L, Tofani V, Vannocci P, Moretti S, Casagli N. Multitemporal UAV surveys for landslide mapping and characterization. Landslides. 2018;15:1045–52. 10.1007/s10346-018-0978-0.Search in Google Scholar
[69] Huang H, Song K, Yi W, Long J, Liu Q, Zhang G. Use of multi-source remote sensing images to describe the sudden Shanshucao landslide in the Three Gorges Reservoir, China. Bull Eng Geol Environ. 2018;78:2591–610. 10.1007/s10064-018-1261-2.Search in Google Scholar
[70] Comert R, Avdan U, Gorum T, Nefeslioglu HA. Mapping of shallow landslides with object-based image analysis from unmanned aerial vehicle data. Eng Geol. 2019;260:105264. 10.1016/j.enggeo.2019.105264.Search in Google Scholar
[71] Amatya P, Kirschbaum D, Stanley T. Use of very high-resolution optical data for landslide mapping and susceptibility analysis along the Karnali Highway, Nepal. Remote Sens. 2019;11(19):2284. 10.3390/rs11192284.Search in Google Scholar
[72] Guzzetti F, Mondini AC, Cardinali M, Fiorucci F, Santangelo M, Chang K-T. Landslide inventory maps: New tools for an old problem. Earth-Sci Rev. 2012;112:42–66. 10.1016/j.earscirev.2012.02.001.Search in Google Scholar
[73] Keyport RN, Oommen T, Martha TR, Sajinkumar KS, Gierke JS. A comparative analysis of pixel- and object-based detection of landslides from very high-resolution images. Int J Appl Earth Obs Geoinf. 2018;64:1–11. 10.1016/j.jag.2017.08.015.Search in Google Scholar
[74] Moosavi V, Talebi A, Shirmohammadi B. Producing a landslide inventory map using pixel-based and object-oriented approaches optimized by Taguchi method. Geomorphology. 2014;204:646–56. 10.1016/j.geomorph.2013.09.012.Search in Google Scholar
[75] Blaschke T. Object based image analysis for remote sensing. ISPRS J Photogramm Remote Sens. 2010;65:2–16. 10.1016/j.isprsjprs.2009.06.004.Search in Google Scholar
[76] Dragut L, Eisank C. Object representations at multiple scales from digital elevation models. Geomorphol (Amst). 2011;129:183–9. 10.1016/j.geomorph.2011.03.003.Search in Google Scholar PubMed PubMed Central
[77] Feizizadeh B, Blaschke T, Tiede D, Moghaddam MHR. Evaluating fuzzy operators of an object-based image analysis for detecting landslides and their changes. Geomorphology. 2017;293:240–54. 10.1016/j.geomorph.2017.06.002.Search in Google Scholar
[78] Hofmann P, Blaschke T, Strobl J. Quantifying the robustness of fuzzy rule sets in object-based image analysis. Int J Remote Sens. 2011;32:7359–81. 10.1080/01431161.2010.523727.Search in Google Scholar
[79] Heleno S, Matias M, Pina P, Sousa AJ. Semiautomated object-based classification of rain-induced landslides with VHR multispectral images on Madeira Island. Nat Hazards Earth Syst Sci. 2016;16:1035–48. 10.5194/nhess-16-1035-2016.Search in Google Scholar
[80] Möller M, Lymburner L, Volk M. The comparison index: A tool for assessing the accuracy of image segmentation. Int J Appl Earth Obs Geoinf. 2007;9:311–21. 10.1016/j.jag.2006.10.002.Search in Google Scholar
[81] Wu H, Cheng Z, Shi W, Miao Z, Xu C. An object-based image analysis for building seismic vulnerability assessment using high-resolution remote sensing imagery. Nat Hazards. 2014;71:151–74. 10.1007/s11069-013-0905-6.Search in Google Scholar
[82] Wu X, Ren F, Niu R. Landslide susceptibility assessment using object mapping units, decision tree, and support vector machine models in the Three Gorges of China. Environ Earth Sci. 2013;71:4725–38. 10.1007/s12665-013-2863-4.Search in Google Scholar
[83] Cristianini N, Shawe-Taylor J. An Introduction to Support Vector Machines and Other Kernel-based Learning Methods. Cambridge: Cambridge University Press; 2000.10.1017/CBO9780511801389Search in Google Scholar
[84] Comber A, Fisher P, Brunsdon C, Khmag A. Spatial analysis of remote sensing image classification accuracy. Remote Sens Environ. 2012;127:237–46. 10.1016/j.rse.2012.09.005.Search in Google Scholar
© 2024 the author(s), published by De Gruyter
This work is licensed under the Creative Commons Attribution 4.0 International License.
Articles in the same Issue
- Regular Articles
- Theoretical magnetotelluric response of stratiform earth consisting of alternative homogeneous and transitional layers
- The research of common drought indexes for the application to the drought monitoring in the region of Jin Sha river
- Evolutionary game analysis of government, businesses, and consumers in high-standard farmland low-carbon construction
- On the use of low-frequency passive seismic as a direct hydrocarbon indicator: A case study at Banyubang oil field, Indonesia
- Water transportation planning in connection with extreme weather conditions; case study – Port of Novi Sad, Serbia
- Zircon U–Pb ages of the Paleozoic volcaniclastic strata in the Junggar Basin, NW China
- Monitoring of mangrove forests vegetation based on optical versus microwave data: A case study western coast of Saudi Arabia
- Microfacies analysis of marine shale: A case study of the shales of the Wufeng–Longmaxi formation in the western Chongqing, Sichuan Basin, China
- Multisource remote sensing image fusion processing in plateau seismic region feature information extraction and application analysis – An example of the Menyuan Ms6.9 earthquake on January 8, 2022
- Identification of magnetic mineralogy and paleo-flow direction of the Miocene-quaternary volcanic products in the north of Lake Van, Eastern Turkey
- Impact of fully rotating steel casing bored pile on adjacent tunnels
- Adolescents’ consumption intentions toward leisure tourism in high-risk leisure environments in riverine areas
- Petrogenesis of Jurassic granitic rocks in South China Block: Implications for events related to subduction of Paleo-Pacific plate
- Differences in urban daytime and night block vitality based on mobile phone signaling data: A case study of Kunming’s urban district
- Random forest and artificial neural network-based tsunami forests classification using data fusion of Sentinel-2 and Airbus Vision-1 satellites: A case study of Garhi Chandan, Pakistan
- Integrated geophysical approach for detection and size-geometry characterization of a multiscale karst system in carbonate units, semiarid Brazil
- Spatial and temporal changes in ecosystem services value and analysis of driving factors in the Yangtze River Delta Region
- Deep fault sliding rates for Ka-Ping block of Xinjiang based on repeating earthquakes
- Improved deep learning segmentation of outdoor point clouds with different sampling strategies and using intensities
- Platform margin belt structure and sedimentation characteristics of Changxing Formation reefs on both sides of the Kaijiang-Liangping trough, eastern Sichuan Basin, China
- Enhancing attapulgite and cement-modified loess for effective landfill lining: A study on seepage prevention and Cu/Pb ion adsorption
- Flood risk assessment, a case study in an arid environment of Southeast Morocco
- Lower limits of physical properties and classification evaluation criteria of the tight reservoir in the Ahe Formation in the Dibei Area of the Kuqa depression
- Evaluation of Viaducts’ contribution to road network accessibility in the Yunnan–Guizhou area based on the node deletion method
- Permian tectonic switch of the southern Central Asian Orogenic Belt: Constraints from magmatism in the southern Alxa region, NW China
- Element geochemical differences in lower Cambrian black shales with hydrothermal sedimentation in the Yangtze block, South China
- Three-dimensional finite-memory quasi-Newton inversion of the magnetotelluric based on unstructured grids
- Obliquity-paced summer monsoon from the Shilou red clay section on the eastern Chinese Loess Plateau
- Classification and logging identification of reservoir space near the upper Ordovician pinch-out line in Tahe Oilfield
- Ultra-deep channel sand body target recognition method based on improved deep learning under UAV cluster
- New formula to determine flyrock distance on sedimentary rocks with low strength
- Assessing the ecological security of tourism in Northeast China
- Effective reservoir identification and sweet spot prediction in Chang 8 Member tight oil reservoirs in Huanjiang area, Ordos Basin
- Detecting heterogeneity of spatial accessibility to sports facilities for adolescents at fine scale: A case study in Changsha, China
- Effects of freeze–thaw cycles on soil nutrients by soft rock and sand remodeling
- Vibration prediction with a method based on the absorption property of blast-induced seismic waves: A case study
- A new look at the geodynamic development of the Ediacaran–early Cambrian forearc basalts of the Tannuola-Khamsara Island Arc (Central Asia, Russia): Conclusions from geological, geochemical, and Nd-isotope data
- Spatio-temporal analysis of the driving factors of urban land use expansion in China: A study of the Yangtze River Delta region
- Selection of Euler deconvolution solutions using the enhanced horizontal gradient and stable vertical differentiation
- Phase change of the Ordovician hydrocarbon in the Tarim Basin: A case study from the Halahatang–Shunbei area
- Using interpretative structure model and analytical network process for optimum site selection of airport locations in Delta Egypt
- Geochemistry of magnetite from Fe-skarn deposits along the central Loei Fold Belt, Thailand
- Functional typology of settlements in the Srem region, Serbia
- Hunger Games Search for the elucidation of gravity anomalies with application to geothermal energy investigations and volcanic activity studies
- Addressing incomplete tile phenomena in image tiling: Introducing the grid six-intersection model
- Evaluation and control model for resilience of water resource building system based on fuzzy comprehensive evaluation method and its application
- MIF and AHP methods for delineation of groundwater potential zones using remote sensing and GIS techniques in Tirunelveli, Tenkasi District, India
- New database for the estimation of dynamic coefficient of friction of snow
- Measuring urban growth dynamics: A study in Hue city, Vietnam
- Comparative models of support-vector machine, multilayer perceptron, and decision tree predication approaches for landslide susceptibility analysis
- Experimental study on the influence of clay content on the shear strength of silty soil and mechanism analysis
- Geosite assessment as a contribution to the sustainable development of Babušnica, Serbia
- Using fuzzy analytical hierarchy process for road transportation services management based on remote sensing and GIS technology
- Accumulation mechanism of multi-type unconventional oil and gas reservoirs in Northern China: Taking Hari Sag of the Yin’e Basin as an example
- TOC prediction of source rocks based on the convolutional neural network and logging curves – A case study of Pinghu Formation in Xihu Sag
- A method for fast detection of wind farms from remote sensing images using deep learning and geospatial analysis
- Spatial distribution and driving factors of karst rocky desertification in Southwest China based on GIS and geodetector
- Physicochemical and mineralogical composition studies of clays from Share and Tshonga areas, Northern Bida Basin, Nigeria: Implications for Geophagia
- Geochemical sedimentary records of eutrophication and environmental change in Chaohu Lake, East China
- Research progress of freeze–thaw rock using bibliometric analysis
- Mixed irrigation affects the composition and diversity of the soil bacterial community
- Examining the swelling potential of cohesive soils with high plasticity according to their index properties using GIS
- Geological genesis and identification of high-porosity and low-permeability sandstones in the Cretaceous Bashkirchik Formation, northern Tarim Basin
- Usability of PPGIS tools exemplified by geodiscussion – a tool for public participation in shaping public space
- Efficient development technology of Upper Paleozoic Lower Shihezi tight sandstone gas reservoir in northeastern Ordos Basin
- Assessment of soil resources of agricultural landscapes in Turkestan region of the Republic of Kazakhstan based on agrochemical indexes
- Evaluating the impact of DEM interpolation algorithms on relief index for soil resource management
- Petrogenetic relationship between plutonic and subvolcanic rocks in the Jurassic Shuikoushan complex, South China
- A novel workflow for shale lithology identification – A case study in the Gulong Depression, Songliao Basin, China
- Characteristics and main controlling factors of dolomite reservoirs in Fei-3 Member of Feixianguan Formation of Lower Triassic, Puguang area
- Impact of high-speed railway network on county-level accessibility and economic linkage in Jiangxi Province, China: A spatio-temporal data analysis
- Estimation model of wild fractional vegetation cover based on RGB vegetation index and its application
- Lithofacies, petrography, and geochemistry of the Lamphun oceanic plate stratigraphy: As a record of the subduction history of Paleo-Tethys in Chiang Mai-Chiang Rai Suture Zone of Thailand
- Structural features and tectonic activity of the Weihe Fault, central China
- Application of the wavelet transform and Hilbert–Huang transform in stratigraphic sequence division of Jurassic Shaximiao Formation in Southwest Sichuan Basin
- Structural detachment influences the shale gas preservation in the Wufeng-Longmaxi Formation, Northern Guizhou Province
- Distribution law of Chang 7 Member tight oil in the western Ordos Basin based on geological, logging and numerical simulation techniques
- Evaluation of alteration in the geothermal province west of Cappadocia, Türkiye: Mineralogical, petrographical, geochemical, and remote sensing data
- Numerical modeling of site response at large strains with simplified nonlinear models: Application to Lotung seismic array
- Quantitative characterization of granite failure intensity under dynamic disturbance from energy standpoint
- Characteristics of debris flow dynamics and prediction of the hazardous area in Bangou Village, Yanqing District, Beijing, China
- Rockfall mapping and susceptibility evaluation based on UAV high-resolution imagery and support vector machine method
- Statistical comparison analysis of different real-time kinematic methods for the development of photogrammetric products: CORS-RTK, CORS-RTK + PPK, RTK-DRTK2, and RTK + DRTK2 + GCP
- Hydrogeological mapping of fracture networks using earth observation data to improve rainfall–runoff modeling in arid mountains, Saudi Arabia
- Petrography and geochemistry of pegmatite and leucogranite of Ntega-Marangara area, Burundi, in relation to rare metal mineralisation
- Prediction of formation fracture pressure based on reinforcement learning and XGBoost
- Hazard zonation for potential earthquake-induced landslide in the eastern East Kunlun fault zone
- Monitoring water infiltration in multiple layers of sandstone coal mining model with cracks using ERT
- Study of the patterns of ice lake variation and the factors influencing these changes in the western Nyingchi area
- Productive conservation at the landslide prone area under the threat of rapid land cover changes
- Sedimentary processes and patterns in deposits corresponding to freshwater lake-facies of hyperpycnal flow – An experimental study based on flume depositional simulations
- Study on time-dependent injectability evaluation of mudstone considering the self-healing effect
- Detection of objects with diverse geometric shapes in GPR images using deep-learning methods
- Behavior of trace metals in sedimentary cores from marine and lacustrine environments in Algeria
- Spatiotemporal variation pattern and spatial coupling relationship between NDVI and LST in Mu Us Sandy Land
- Formation mechanism and oil-bearing properties of gravity flow sand body of Chang 63 sub-member of Yanchang Formation in Huaqing area, Ordos Basin
- Diagenesis of marine-continental transitional shale from the Upper Permian Longtan Formation in southern Sichuan Basin, China
- Vertical high-velocity structures and seismic activity in western Shandong Rise, China: Case study inspired by double-difference seismic tomography
- Spatial coupling relationship between metamorphic core complex and gold deposits: Constraints from geophysical electromagnetics
- Disparities in the geospatial allocation of public facilities from the perspective of living circles
- Research on spatial correlation structure of war heritage based on field theory. A case study of Jinzhai County, China
- Formation mechanisms of Qiaoba-Zhongdu Danxia landforms in southwestern Sichuan Province, China
- Magnetic data interpretation: Implication for structure and hydrocarbon potentiality at Delta Wadi Diit, Southeastern Egypt
- Deeply buried clastic rock diagenesis evolution mechanism of Dongdaohaizi sag in the center of Junggar fault basin, Northwest China
- Application of LS-RAPID to simulate the motion of two contrasting landslides triggered by earthquakes
- The new insight of tectonic setting in Sunda–Banda transition zone using tomography seismic. Case study: 7.1 M deep earthquake 29 August 2023
- The critical role of c and φ in ensuring stability: A study on rockfill dams
- Evidence of late quaternary activity of the Weining-Shuicheng Fault in Guizhou, China
- Extreme hydroclimatic events and response of vegetation in the eastern QTP since 10 ka
- Spatial–temporal effect of sea–land gradient on landscape pattern and ecological risk in the coastal zone: A case study of Dalian City
- Study on the influence mechanism of land use on carbon storage under multiple scenarios: A case study of Wenzhou
- A new method for identifying reservoir fluid properties based on well logging data: A case study from PL block of Bohai Bay Basin, North China
- Comparison between thermal models across the Middle Magdalena Valley, Eastern Cordillera, and Eastern Llanos basins in Colombia
- Mineralogical and elemental analysis of Kazakh coals from three mines: Preliminary insights from mode of occurrence to environmental impacts
- Chlorite-induced porosity evolution in multi-source tight sandstone reservoirs: A case study of the Shaximiao Formation in western Sichuan Basin
- Predicting stability factors for rotational failures in earth slopes and embankments using artificial intelligence techniques
- Origin of Late Cretaceous A-type granitoids in South China: Response to the rollback and retreat of the Paleo-Pacific plate
- Modification of dolomitization on reservoir spaces in reef–shoal complex: A case study of Permian Changxing Formation, Sichuan Basin, SW China
- Geological characteristics of the Daduhe gold belt, western Sichuan, China: Implications for exploration
- Rock physics model for deep coal-bed methane reservoir based on equivalent medium theory: A case study of Carboniferous-Permian in Eastern Ordos Basin
- Enhancing the total-field magnetic anomaly using the normalized source strength
- Shear wave velocity profiling of Riyadh City, Saudi Arabia, utilizing the multi-channel analysis of surface waves method
- Effect of coal facies on pore structure heterogeneity of coal measures: Quantitative characterization and comparative study
- Inversion method of organic matter content of different types of soils in black soil area based on hyperspectral indices
- Detection of seepage zones in artificial levees: A case study at the Körös River, Hungary
- Tight sandstone fluid detection technology based on multi-wave seismic data
- Characteristics and control techniques of soft rock tunnel lining cracks in high geo-stress environments: Case study of Wushaoling tunnel group
- Influence of pore structure characteristics on the Permian Shan-1 reservoir in Longdong, Southwest Ordos Basin, China
- Study on sedimentary model of Shanxi Formation – Lower Shihezi Formation in Da 17 well area of Daniudi gas field, Ordos Basin
- Multi-scenario territorial spatial simulation and dynamic changes: A case study of Jilin Province in China from 1985 to 2030
- Review Articles
- Major ascidian species with negative impacts on bivalve aquaculture: Current knowledge and future research aims
- Prediction and assessment of meteorological drought in southwest China using long short-term memory model
- Communication
- Essential questions in earth and geosciences according to large language models
- Erratum
- Erratum to “Random forest and artificial neural network-based tsunami forests classification using data fusion of Sentinel-2 and Airbus Vision-1 satellites: A case study of Garhi Chandan, Pakistan”
- Special Issue: Natural Resources and Environmental Risks: Towards a Sustainable Future - Part I
- Spatial-temporal and trend analysis of traffic accidents in AP Vojvodina (North Serbia)
- Exploring environmental awareness, knowledge, and safety: A comparative study among students in Montenegro and North Macedonia
- Determinants influencing tourists’ willingness to visit Türkiye – Impact of earthquake hazards on Serbian visitors’ preferences
- Application of remote sensing in monitoring land degradation: A case study of Stanari municipality (Bosnia and Herzegovina)
- Optimizing agricultural land use: A GIS-based assessment of suitability in the Sana River Basin, Bosnia and Herzegovina
- Assessing risk-prone areas in the Kratovska Reka catchment (North Macedonia) by integrating advanced geospatial analytics and flash flood potential index
- Analysis of the intensity of erosive processes and state of vegetation cover in the zone of influence of the Kolubara Mining Basin
- GIS-based spatial modeling of landslide susceptibility using BWM-LSI: A case study – city of Smederevo (Serbia)
- Geospatial modeling of wildfire susceptibility on a national scale in Montenegro: A comparative evaluation of F-AHP and FR methodologies
- Geosite assessment as the first step for the development of canyoning activities in North Montenegro
- Urban geoheritage and degradation risk assessment of the Sokograd fortress (Sokobanja, Eastern Serbia)
- Multi-hazard modeling of erosion and landslide susceptibility at the national scale in the example of North Macedonia
- Understanding seismic hazard resilience in Montenegro: A qualitative analysis of community preparedness and response capabilities
- Forest soil CO2 emission in Quercus robur level II monitoring site
- Characterization of glomalin proteins in soil: A potential indicator of erosion intensity
- Power of Terroir: Case study of Grašac at the Fruška Gora wine region (North Serbia)
- Special Issue: Geospatial and Environmental Dynamics - Part I
- Qualitative insights into cultural heritage protection in Serbia: Addressing legal and institutional gaps for disaster risk resilience