Hydrogeological mapping of fracture networks using earth observation data to improve rainfall–runoff modeling in arid mountains, Saudi Arabia
-
Anis Chaabani


Abstract
Rainfall–runoff modeling is essential for the hydrological analysis of basins; however, the traditional modeling approach does not incorporate geological features such as fractures and fissures in the modeling task. These features are significant in the water loss during a rainstorm, which should be incorporated to obtain realistic rainfall–runoff results. A novel approach is presented here in to quantify the geological features and link them to the curve number (CN) method. The proposed methodology has not been applied in the literature. This approach is validated on five gauged basins, namely, Yiba, Al Lith, Liyya, Habawnah, and Tabalah, in the southwest part of Saudi Arabia. Four major stages are conducted. The first stage is the extraction of the geological lineaments using remote sensing and geographical information system technology; the second stage is estimating CN from rainfall–runoff data; the third stage is developing a relationship between CN and lineament density (LD); and the final stage is evaluating the developed equations on hydrological response. The least-squares method is employed to minimize the difference between observed and predicted runoff and determine the optimum range of CN. The research provides a comprehensive understanding of hydrological processes in fractured geologic systems and explores the influence of fractures on curve number. This study identifies two major lineament trends aligned with the Arabian trend direction, namely, north-northwest (NNW)–south-southeast (SSE) and north-northeast (NNE)–south-southwest (SSW). Furthermore, a moderate inverse correlation is established between LD and CN, highlighting the significance of geologic fractures on the hydrological response. The findings of this study provide insight into how the geological fissures in the mountainous region affected the rainfall–runoff response that leads to a low value of CN due to the water loss in the fissures and faults. As a result, this study clearly demonstrates the importance of the geological structures on rainfall–runoff responses.
1 Introduction
Mapping of geological lineaments such as faults, joints, and fractures is an important approach in the field of hydrology for rainfall–runoff response analysis because faults act as water storage and cause changes in groundwater. A geological lineament is a linear feature on the earth’s surface that shows a straight or nearly straight feature and is found on different geological structures [1,2]. Remote sensing application for the detection of geological lineament is useful for hydrogeological study [3,4,5,6,7,8], geological hazards research for earthquakes and landslides [9,10,11,12,13,14] and hot springs [13,15].
Remote sensing data from optical and radar systems are often employed for lineament extraction and characterization of active faults. Modern optical sensors favored by certain researchers include Landsat thematic mapper, enhanced thematic mapper, Operational Land Imager (OLI)/thermal infrared sensor, advanced spaceborne thermal emission and reflection radiometer and Sentinel 2 [16]. Sentinel 1, interferometric synthetic aperture radar, advanced land observing satellite, phased array L-band synthetic aperture radar, and digital elevation model are examples of radar-based sensors that have been widely used for lineament and active fault characterization [14,17].
Analysis and mapping of geological lineament have been performed in arid and sub-arid regions due to sparse vegetation and exposure of bedrock [18,19]. Lineament studies performed in Saudi Arabia include Wajid Group [20], North East of Wadi Ar Rika Quadrangle [21], Bulghah area [22], Neom mega-project area [23,24], southern Arabian Shield [25], Al Qunfudhah Area [26], and Wadi Fatima [27].
Remote sensing imaging provides an effective tool for identifying geological features like lineaments and is valuable for mapping lithology [28,29]. Studies show several remote sensing and geographical information system (GIS) techniques to delineate, analyze, and identify geologic lineament features, including manual approaches, semi-automatic methods, and automatic methods [30]. Manual lineament feature extraction approach is performed by using human operating visualization, and extraction utilizes image enhancement techniques, e.g., manual digitization, visual analysis and interpretation, band ratio, directional filtering, and transformation [31,32,33]. Semi-automated geological lineament extraction is the process of lineament detection and identification based on some digital image analysis techniques and visual interpretation [30]. The lineaments can be obtained using digital image analysis after pre-processing and enhancement, and the user may also choose to manually modify any discovered lineaments [34]. The extraction of lineaments is automated using computer software. The automated processing includes enhancement, filtering, edge detection, and finally, lineament extraction [30]. There are several methods and algorithms used by different researchers for automatic linear extraction, i.e., lineament extraction and stripe statistical analysis [35], High Transform [36], TecLines [37], segment tracing algorithm [37], lineament detection and analysis [38], and Canny algorithm [39]. The Canny algorithm will be used to perform linear extraction, comparing curve number (CN) and rainfall–runoff response.
The second stage of the research is to perform the calculation of the Natural Resources Conservation Service Curve Number (NRCS-CN) and analyze rainfall and runoff in the study area [40]. The CN method depends on land use and soil type parameters to calculate and predict runoff potential. The most often used approach for determining the direct runoff depth, Q, from a given storm rainfall depth, P, is the NRCS-CN method. The United States Department of Agriculture Soil Conservation Service developed the approach in 1954 [41].
A previous study showed relatively large values of CN that have been observed between 61 and 99. CN values were calculated using rainfall and runoff data from certain gauged catchments in Saudi Arabia’s western area (Yiba catchment and its sub-basins) [42].
Among the benefits of CN include its ability to anticipate the link between rainfall and runoff, as well as its responsiveness to the main characteristics of runoff-producing catchments, such as soil type, land use, surface condition, and antecedent moisture condition [43,44]. However, complex rainfall–runoff correlations that are not always reflected in a single metric come from the dynamic nature of rainfall patterns, including volume, severity, and frequency, as well as landscape and soil features [45]. The empirical approaches, like the Soil Conservation Service Curve Number (NRCS-CN), have only yielded limited and untested system information in complicated basins [46]. In addition, the NRCS-CN also has some limitations such as lack of a land slope factor, and an improvement has been done by Shi and Wang [47].
CN is considered a sensitive parameter in the hydrological field such as runoff estimation and design of stormwater management systems. It should be estimated accurately. Hydrologists use soil conservation service tables to estimate CNs, which have a high degree of subjectivity. The NRCS-CN approach supposes a constant land cover condition over time and does not include geological features (fractures, fissures) in the modeling concept, which these features are very significant in hydrological systems and can influence infiltration rates and runoff. The current hydrological model considers mountains as impermeable surfaces, resulting in a high curve number (CN) value, which can lead to unrealistic hydrological responses in certain scenarios [48]. However, mountain areas contain fractures and cracks may contribute to the infiltration process. In such cases, method adjustments are needed to accurately account for fractures and fissures in mountainous areas. From previous studies in the literature, lineament and fracture density have been found to be utilized as one of the factors for analyzing groundwater potential (GWP) in different regions worldwide. Its significance in hydrological studies lies in its role as pathways for the movement of groundwater. Lineaments can be described as permeable zones and are positively associated with high GWP. In the same context, a study conducted by Akinluyi et al. [6] in southwestern Nigeria seeks to investigate the influence of lineaments on the groundwater yield of the basement terrain of Ondo State using optical remote sensing. This research assists in optimizing hydrogeological investigation to predict GWP based on structural lineaments and hydro-lithological characteristics. A recent study was carried out in the western part of Saudi Arabia, showed the CN value ranges between 45 and 85 at the initial abstraction ratio, λ = 0.2 and transmission losses, which are common in arid environments, are accounted for by the low CN values [49]. This transmission loss probably happened due to the occurrence of the high degree of permeability of the alluvium in the wadi and the geological fractures in the mountainous rocks in which the water infiltrated easily toward the ground.
This research will investigate the link between hydrological response and geological features in arid basins and will focus on the influence of local fracture density on CN and runoff. The integration of remote sensing and GIS technology will be employed for the automatic extraction of geological lineaments (including fractures and faults) based on the method used in previous studies [1,50]. Then, a best-fitting technique, based on the least-squares method (LSM), will be used to find out the empirical relationship between CN and line density, and therefore, an optimum range of CN range will be obtained.
The study aims to explore the effect of geological features on hydrological characterization and to quantify their impacts on CN and rainfall–runoff response in arid regions. Understanding this relationship is vital for making informed decisions about land development, water resource management, and climate change adaptation.
2 Study area
The study area is located in the southwestern part of Saudi Arabia (Figure 1). This region is particularly found in the eastern part of the Asir escarpment, with an elevation reaching up to 300 m that extends from the Red Sea coast. The climate conditions are arid and subarid, with extreme temperatures. The essential elements of climate parameters are wind speed, sunshine duration, temperature, relative humidity, and rainfall. In this research, five basins, namely, Yiba, Al Lith, Liyya, Habawnah, and Tabalah, are proposed to be investigated. Except for the two basins Habawnah and Tabalah, all basins drain toward the Red Sea, whereas these two basins drain toward the Rub al Khali from the mountainous region. In the research area, several measuring devices were used. Over the basins, there are around 100 rainfall gauges. Each of these basins is divided into sub-basins, and a total of 19 sub-basins are found. The annual pan evaporation is 3,955 mm, with the mean monthly evaporation ranging between 176 and 498 mm. Rainfall in Saudi Arabia is small and irregular, but it can be heavy and widespread during local storms. Due to its geographic location in the subtropical zone, the western region of Saudi Arabia receives a modest quantity of rainfall with a lengthy history of dry times [51]. The average annual rainfall of the basin is 187 mm. Most of the rainfall occurs in March, April, and May.

Location map of the study area.
In this study, 161 rainfall–runoff events during the years 1984–1987 were examined. The data are collected from the Ministry of Environment, Water, and Agriculture, Saudi Arabia.
Figure 2 (top two images) shows the selected rainfall–runoff events (hyetographs and hydrographs) at certain sites in distinct basins. The figure demonstrates the typical shape of the hydrographs in Saudi Arabia. The storms have common characteristics, such as shorter durations (between 4 and 6 h), and the amount of rainfall is not significant. The resulting runoff hydrographs exhibit a sharp overall shape, with steep and sharp rising limbs and quickly decreasing falling limbs. These features are typical of the arid environment in Saudi Arabia [52]. The runoff duration for the Al Lith Basin on December 19, 1984, at station J418 was 4 h. In contrast, for the Yiba Basin, during a specific event on August 19, 1985, the runoff duration was 22 h. Figure 2 (bottom two images) shows the monthly rainfall–runoff time series, which indicates minimal to no rainfall.

Top two images are selected rainfall–runoff events (hyetographs and hydrographs), and the bottom two images are monthly rainfall–runoff events (Ministry of Environment, Water, and Agriculture, Saudi Arabia).
3 Geological and tectonic setting
The Asir cliff in the western portion of the Arabian shield is made up of crystalline igneous and metamorphic rocks that are thought to be Pre-Cambrian in age and slope northeast, east, and southeast topographically and structurally [53]. The study region is geologically located in the Asir escarpment, which is part of the Arabian-Nubian Shield (ANS), and the formation dates to the Neoproterozoic age [54]. Due to uplift and erosion along the Red Sea’s sides in the Oligocene and earlier, the ANS, which is located in northeastern Africa and western Arabia, exposed crystalline basement rocks that are mostly Neoproterozoic in age [55].
Rock units in Wadi Al Lith, such as the Quaternary Deposit (alluvium), represent 9% of the total catchment; most of the area is covered by diorite and gabbro, whereas in Wadi Tabalah and Yiba, the area is mainly made up of tonalite and quartz diorite. The rock units in Wadi Habawnah (Figure 3b) are made up of around 10% pyritic, graphitic slate, and schist, 10% or less dacitic crystal and lithic tuff, 30% slate and wacke, and 50% greenstone and andesitic flow rocks. Mafic to felsic sills and a discontinuous strip of flinty porphyritic rhyolite or dacite along the quadrangle’s western boundary make up the unit. In Wadi Yiba, minor folds, bedding, and foliation often have geometries and orientations that correspond to the larger N-S trending fold [56].

Geological setting of study basins: (a) Al Lith, (b) Tabalah, (c) Yiba, (d) Habawnah, and (e) Liyyah.
According to Wheater et al. [57], annual precipitation is closely correlated with altitude; in Saudi Arabia, Asir Mountain receives the most precipitation [26,58]. The variation of the geological fractures present in the study basins influences the range of values of NRCS-CN values. The ability of bedrock to transmit water is influenced by three fracture characteristics: fracture aperture, connectedness, and density. Bedrock close to the surface often has wider apertures and a higher fracture density due to unloading and weathering processes [59].
4 Land use/land cover (LULC)
Classification of LULC plays a crucial role in rainfall–runoff modeling and water resource management. Accurately identifying LULC provides insights for a deeper understanding of patterns, changes, and impacts on the hydrological regime [60]. Classification of LULC has been made using Landsat 8 image (OLI) access via Earth Explorer website (https://earthexplorer.usgs.gov/). A supervised classification was performed to select training sites for different LULC regions. The maximum-likelihood classification is a popular method for supervised classification [61,62]. ENVI software was used to perform LULC map in the region. In this approach, we determine the spectral responses of established land cover categories, such as vegetation, alluvium, and rocks (used as training classes). The software then assigns each pixel in the image to the land cover type that most closely matches its spectral response. Therefore, the study region is classified into three major classes, such as rock, alluvium, and vegetation. To estimate the CN, the percentages of each LULC were calculated as shown in Table 1. Furthermore, enhancement, interpretation, and mapping were conducted within a GIS environment. In hydrological modeling, the CN parameter is used to evaluate a given land area’s potential for runoff depending on the features of the land cover. The CN was computed by considering the proportion of each kind of LULC, which provides important details about the hydrological response of the catchment. According to our classification except for the Liyyah (the alluvial deposits represent 40% of the study area), all other regions are characterized by a rock coverage exceeding 70%. Additionally, the Tabalah and Habawnah basins exhibit a relatively lower extent of vegetation coverage (Figure 4).
Area and percentage of rock, alluvium, and vegetation of the sub-basins
| Basin | Sub-basin | Code | Area Rock (km2) | Area alluvium (km2) | Area vegetation (km2) | Rock (%) | Alluvium (%) | Vegetation (%) |
|---|---|---|---|---|---|---|---|---|
| Al Lith | J415 | AL5 | 951.6 | 3.1 | 20.9 | 97.5 | 0.3 | 2.1 |
| J416 | AL3 | 293.5 | 3.3 | 2.8 | 98.0 | 1.1 | 0.9 | |
| J417 | AL4 | 711.0 | 18.7 | 6.4 | 96.6 | 2.5 | 0.9 | |
| J418 | AL2 | 664.8 | 36.9 | 6.4 | 91.8 | 5.1 | 3.1 | |
| Tabalah | B405 | Tb3 | 342.7 | 128.6 | 22.5 | 72.3 | 27.1 | 0.6 |
| B412 | Tb2 | 470.9 | 86.3 | 2.9 | 84.0 | 15.4 | 0.6 | |
| B413 | Tb1 | 12.1 | 43.2 | 3.2 | 20.7 | 73.9 | 5.5 | |
| Yiba | SA401 | Yb4 | 246.1 | 32.3 | 27.5 | 80.4 | 10.6 | 9.0 |
| SA422 | Yb5 | 306.8 | 124.6 | 27.9 | 66.8 | 27.1 | 6.1 | |
| SA423 | Yb3 | 403.7 | 138.3 | 70.5 | 65.9 | 22.6 | 11.5 | |
| SA424 | Yb2 | 708.4 | 240.8 | 20.4 | 73.1 | 24.8 | 2.5 | |
| Habawnah | N404 | Hb2 | 689.2 | 119.6 | 1.8 | 85.0 | 14.8 | 0.2 |
| N405 | Hb3 | 765 | 174.1 | 1.3 | 81.4 | 18.8 | 0.1 | |
| N406 | Hb4 | 791.2 | 278.1 | 2.8 | 73.8 | 25.6 | 0.3 | |
| N407 | Hb5 | 490 | 253.2 | 1.0 | 65.8 | 34.0 | 0.1 | |
| N408 | Hb1 | 1102.8 | 302.0 | 3.3 | 78.3 | 21.5 | 0.2 | |
| Liyyah | SA421 | Ly4 | 244.3 | 129.5 | 3.2 | 33.5 | 17.7 | 5.5 |
| SA425 | Ly3 | 179.2 | 44.9 | 356.1 | 46.7 | 11.7 | 48.8 | |
| SA426 | Ly2 | 56.9 | 43.2 | 7.1 | 53.1 | 40.3 | 41.7 |

LULC map: (a) Al Lith, (b) Tabalah, (c) Yiba, (d) Habawnah, and (e) Liyyah.
5 Methodology
To accomplish the research task, four major stages are conducted. The first stage is the extraction of the geological lineaments using remote sensing and GIS technology; the second stage is estimating CN from rainfall–runoff data; the third stage is developing a relationship between CN and lineament density (LD); and the final stage is evaluating the developed equations on hydrological response. The workflow chart of the study is shown in Figure 5.

Flow chart of the methodology.
The extraction of geological lineament will be performed further in three different steps. The first step is the selection of the initial input of data for the lineament’s extraction. Satellite data, aerial images, and geological ground data, among other sources, can be used to identify and map lineaments. Satellite data were chosen as the best alternative for lineament mapping and extraction in this investigation. The next step is the extraction and mapping of lineaments from satellite images. Convolution filtering and multiband analysis methods for lineament extraction are used. The evaluation of the lineament thematic maps is the final phase. The LD map, direction map, intersection length map, and orientation analysis map are among these maps. The algorithm of LINE consists of three stages: edge detection, thresholding, and curve extraction. Edge detection of remote sensing is one of the most important methods in lineament extraction [63]. In an image, the edges surrounding various objects contain the most valuable information. The Canny edge detection algorithm is another effective tool for detecting edges in an image. The effectiveness of the lineament plots is confirmed by comparing them with the geological map.
The next step is related to the validation of the geological lineaments with the tectonic structures of the geological maps. A visual interpretation was made between the extracted and existing lineaments and faults, and then, they were plotted using the rose diagram to determine their direction and orientation. The LD will be performed using GIS techniques, to quantify the characteristics of the identified lineaments, to verify the consistency between existing tectonic structures (field data from maps) and extracted data from satellite images, and to incorporate it in the hydrologic model [14].
The second stage is calculating the NRCS-CN from rainfall–runoff events. The NRCS-CN method is based on the principle of mass conservation between precipitation, initial abstraction, runoff, and infiltration. The method is given by [64]
where Q is the direct runoff depth (effective rainfall), P is the rainfall depth of the event,
P and Q pairs are immediately used to determine the maximum possible retention, S, describing the catchment as
The aforementioned formula becomes the common quadratic formula for S if
Once we obtain the value of S, CN is calculated as
The CN obtained from the aforementioned analysis is called CN event (CNe) and is related to P, Q, and
Using remote sensing techniques, we shall estimate the
where
where i is the event number, and n is the total number of events.
The estimated effective rainfall
The estimated and observed effective rainfall was compared for all basins to assess the performance of the NRCS-CN model.
The observed CN (
The verification of the developed equations for quantifying the effect of faults and geological lineaments on rainfall–runoff response is implemented. The developed equation for
6 Results and discussion
Lineaments are extracted from the Landsat 8 OLI image with band 5 specifically. The OLI multispectral sensor collects data in the visible and near-infrared, short-wave infrared, and other spectral bands. To apply lineament extraction, the image was corrected by performing radiometric calibration and atmospheric correction to mask the effects of clouds and water. LD is an essential parameter for lineament mapping.
LD is a geological or geomorphological metric that quantifies the concentration or abundance of linear features, such as faults, fractures, or other linear geological structures, within a specific area. It is typically expressed as the number of lineaments per unit area, often measured in lineaments per kilometer or lineaments per square kilometer. Because it tells us about a region’s geology and tectonic features, LD is a useful quantity in geology, geophysics, and remote sensing. Low LD may reflect relatively stable geological conditions, whereas high LD may signify regions of greater geological activity or structural complexity. It is often utilized in environmental and geological research, resource exploration, and the evaluation of geological hazards [48].
Geological faults were digitized from field observations, and the LD was generated using the line density tool in ArcGIS software and classified into sub-basins using zonal statistics.
In Al Lith and Tabalah catchments, high LD is found in diorite, tonalite, and gabbro with an average length of 1,654 and 1,700 m, respectively. Lineament extraction analysis has been performed in Wadi Al Lith for geothermal potential, which discovered that with a frequency percentage of 52% and an average lineament length of 835 m, the primary surface lineaments are structurally oriented in the north-northeast (NNE)–south-southwest (SSW) and NE–SW directions [28], whereas in Yiba and Habawnah, volcanic rocks have the highest LD with an average lineament length of 1,757 and 1,606 m, respectively. Lineament extraction is also carried out in Abha, which is nearest to Wadi Yiba. Field-structural mapping demonstrates that the Wadi Yiba region underwent at least three deformation stages (D1–D3) [56]. In Wadi Habawnah, the aquifer replenishment, storage, and leaking have considerable potential in areas with lineament densities that range from high to extremely high [66].
The geological features from field observations (geological maps) and the extracted lineaments were integrated into the RockWorks software to plot the rose diagram. Rose diagram analysis is an essential step in interpreting the spatial distribution and orientation of tectonic structures and in evaluating lineaments derived through comparison with field data. Assessing the accuracy of these measurements is crucial for reliable geological interpretations and models. As a result, the most frequent directions of extracted lineaments are identified (Figure 6).

Extracted lineaments superimposed on the hill-shaded map of the basin, observed faults, and line density are presented in colors: (a) Al Lith, (b) Tabalah, (c) Yiba, (d) Habawnah, and (e) Liyyah.
The extracted lineament shows a trend of two dominant directions, which are north-northwest (NNW)–south-southeast (SSE) (N20–60 W) and NNE–SSW (N0–45 E). All three wadis (excluding Habawnah and Liyyah) exhibit a general NW–SW trend, as shown in Figure 7. This suggests that the lineaments within these wadis predominantly follow a northwest–southeast orientation. Most of the major wadis that drain into the Red Sea have a NE–ENE pattern [67,68].


Comparison of rose diagram of lineaments extracted from remote sensing and lineaments extracted from geological maps. The small case letter (right side) indicates the extracted lineament from remote sensing data, and the left side shows the field observation taken from geological map for the five wadis – Al Lith, Tabalah, Yiba, Habawnah, and Liyyah arranged in an alphabetical order (a–e).
As a result of this study, each lineament trend may indicate an underlying tectonic and structural setting. The N–S, NNE–SSW, and NNW–SSE lineament traces discovered in the northern (Al Lith), center (Yiba and Tabalah), and southern regions (Liyyah and Habawnah) of the examined area are consistent with the N–S trending basement faults (Arabian trend). A similar trend has been seen in Jizan, which is near Wadi Habawnah, and fractures are found in sub-volcanic plutons and Asir dykes [69]. For several of the principal wadis, the NNW direction is just as significant as its conjugate perpendicular tendency [28]. In Wadi Riyan, which is located at northeast of Abha, trend analysis reveals that the principal surface fracture trend region is in the NNW and NNE and that surface geology and Landsat data also revealed minor trends in the north–south and east–west [70]. The E–W extensional tectonics are most likely responsible for this pattern.
Several extracted lineaments correlate with faults and fault zones found and depicted on geological maps. As a result, lineament analyses reveal structural patterns representing tectonic features in their actual distribution and orientation in the study area.
In Al Lith, both the field observations and extracted lineaments exhibit a similar trending orientation along the NNW–SSE direction. Similarly, in Tabalah and Wadi Yiba, the orientations were observed to be similar, except for the field-observed faults in the Tabalah catchment, which are slightly inclined toward the west direction. However, there is a discrepancy in the trend between the field observations and extracted lineaments in Wadi Liyyah. The field observations indicate a trending orientation of NNW–SSE, while the extracted lineament orientation shows toward NNE–SSW. The fundamental reason for the difference in trending orientations in Wadi Liyyah may certainly be data restrictions resulting from the catchments’ location across national borders. Part of the catchment found in Yemen, obtaining reliable and thorough data during field observations might be difficult. When compared to extracted line segments derived by software analysis, this may result in differences in the quality, accessibility, and availability of the data [71].
The second phase of the investigation involves determining the NRCS-CN value for each wadi and finding a relationship between line density and CNr. In the first part, we have classified LULC map into three types, namely, rock, alluvium, and vegetation, and we have estimated the percentage of each class for all basins. To obtain NRCS-CN, only rock and alluvium were used, while the area of vegetation located in the alluvium and rock types were added to the alluvium and the rock area, respectively. Therefore, vegetation is not included in the analysis, while its area is added to either rock or alluvium. An initial abstraction of 0.01 was used as the best value in the arid region and the NRCS-CN table at
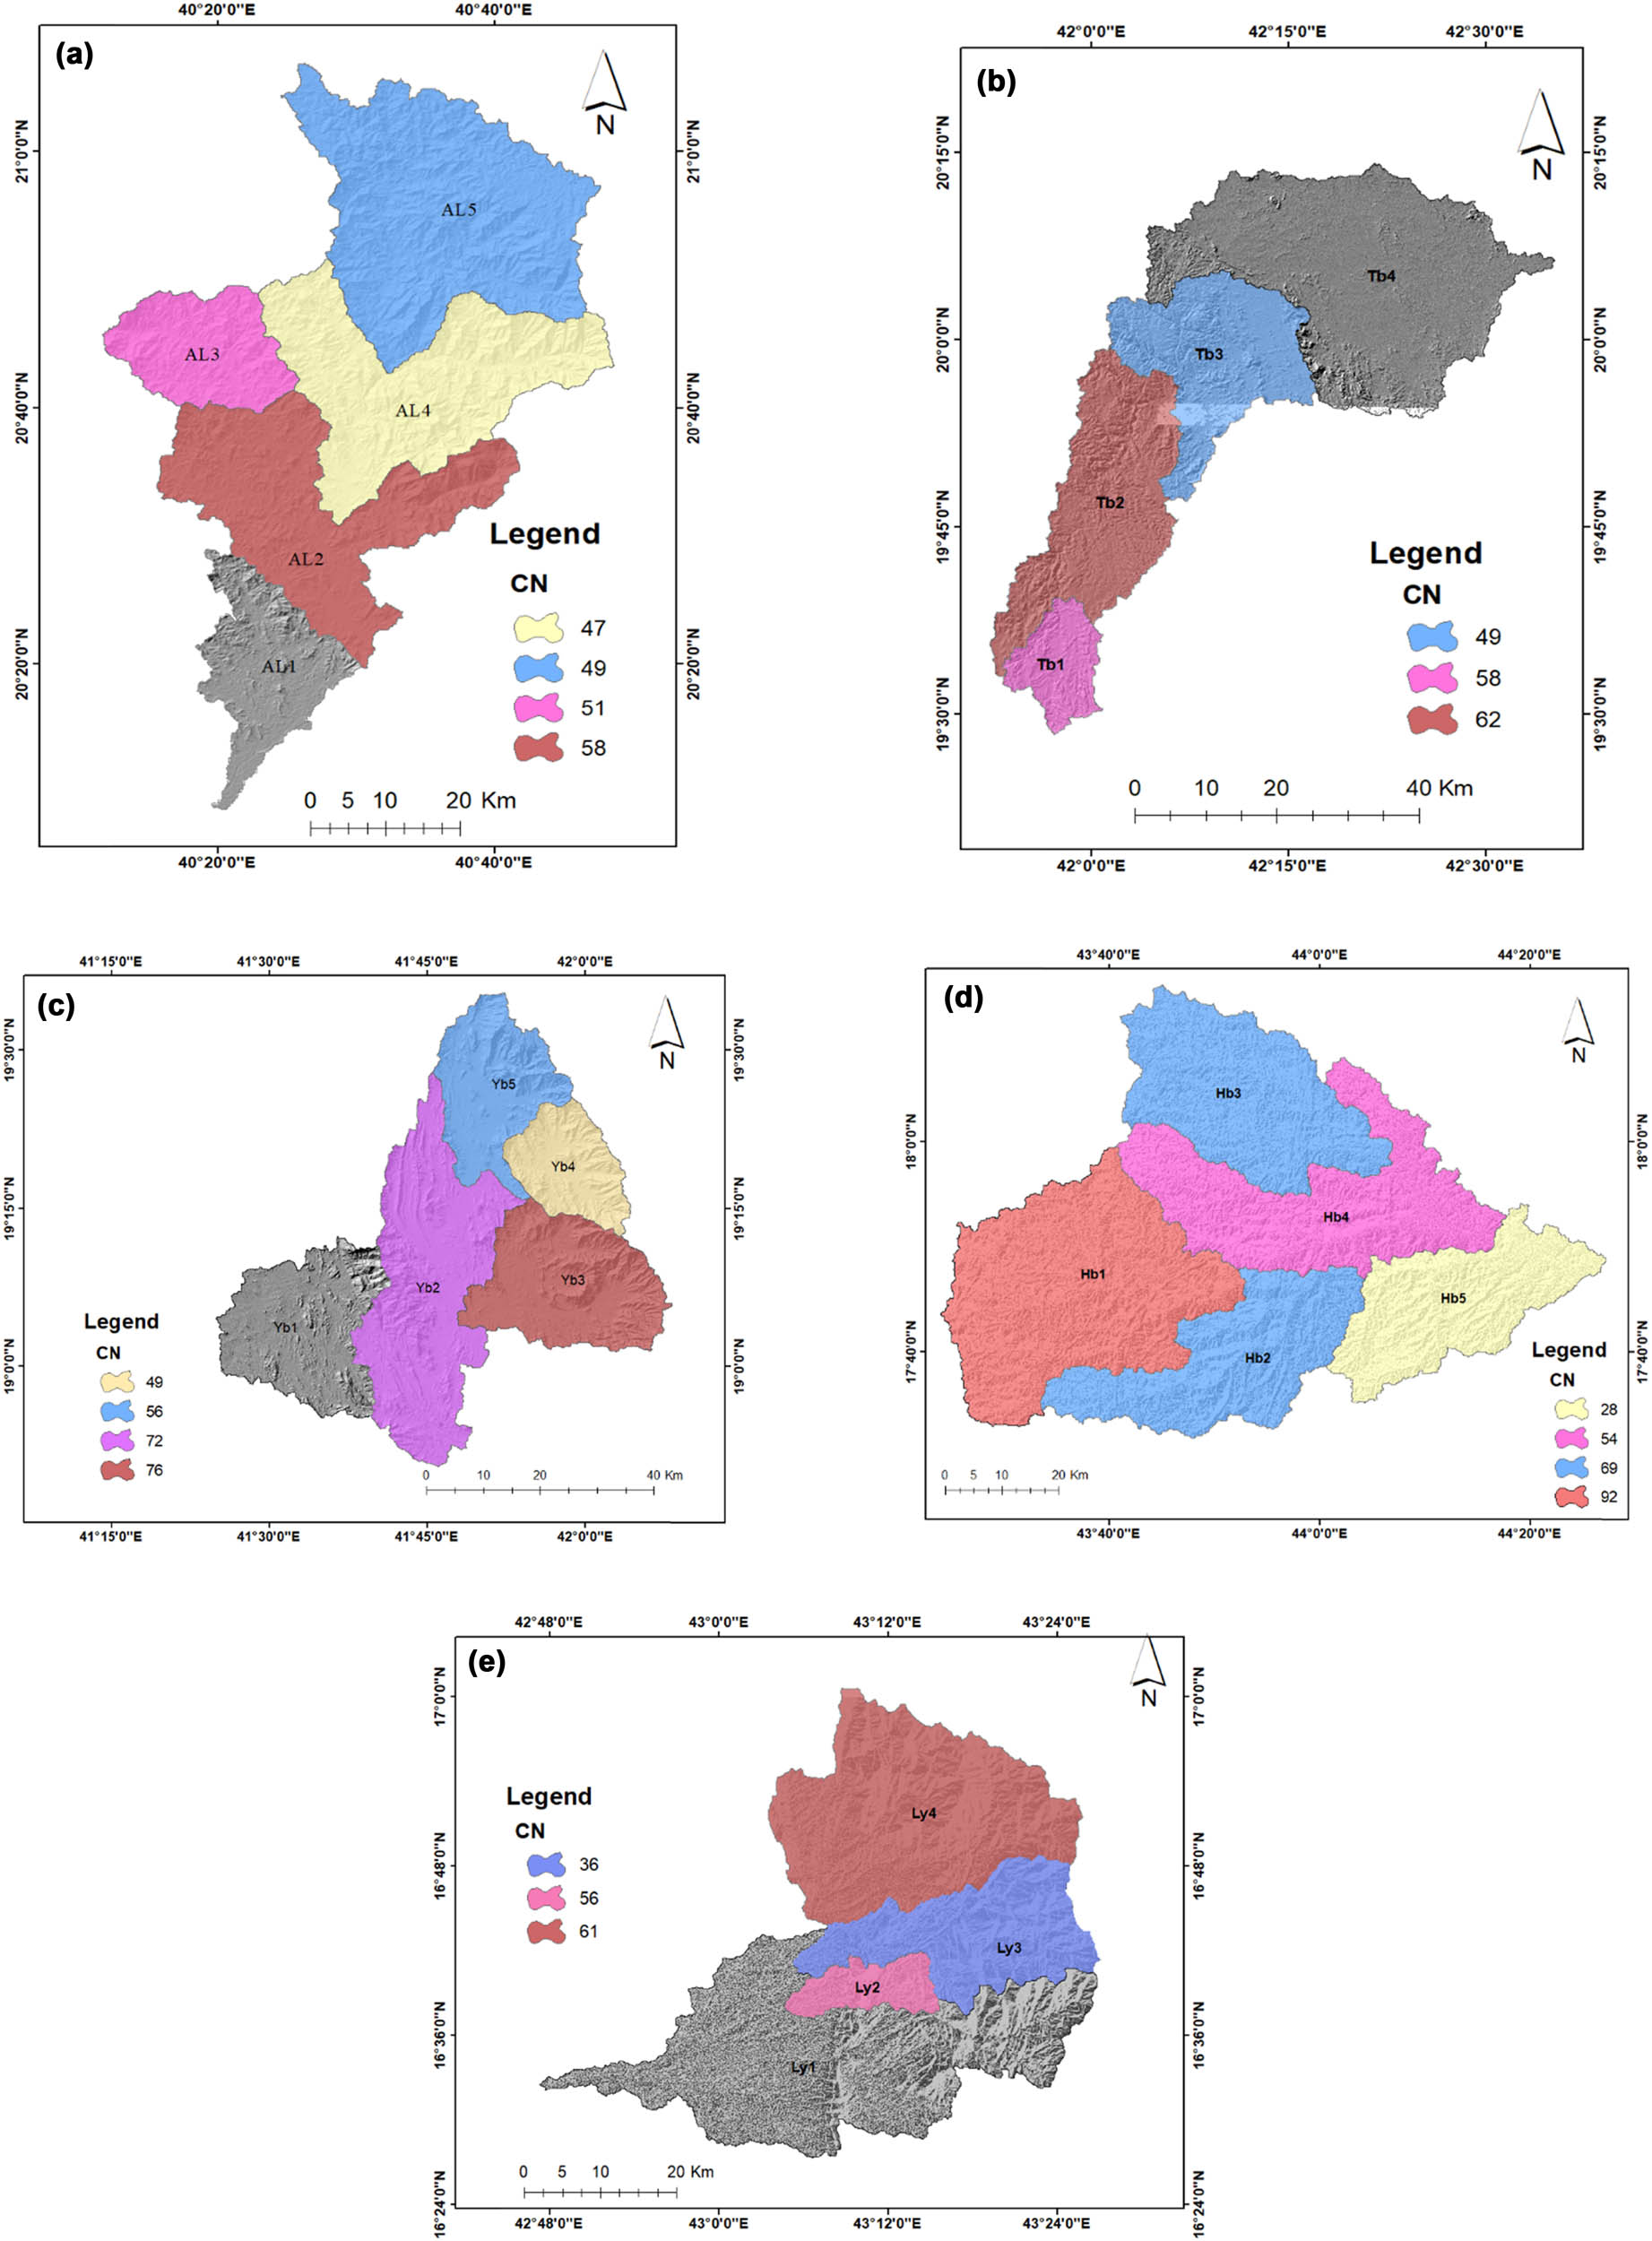
CN for five wadis: (a) Al Lith, (b) Tabalah, (c) Yiba, (d) Habawnah, and (e) Liyyah.
CN at
| Basin | Sub-basin | Code | CN at
|
CNr | CNa |
|---|---|---|---|---|---|
| AL Lith | J415 | AL5 | 49 | 49 | 46 |
| J416 | AL3 | 51 | 51 | 49 | |
| J417 | AL4 | 48 | 48 | 47 | |
| J418 | AL2 | 58 | 59 | 40 | |
| Tabalah | B405 | Tb3 | 45 | 46 | 45 |
| B412 | Tb2 | 62 | 66 | 41 | |
| B413 | Tb1 | 61 | 93 | 50 | |
| Yiba | SA401 | Yb4 | 49 | 49 | 45 |
| SA422 | Yb5 | 56 | 58 | 50 | |
| SA423 | Yb3 | 76 | 85 | 48 | |
| SA424 | Yb2 | 72 | 82 | 41 | |
| Habawnah | N404 | Hb2 | 69 | 72 | 49 |
| N405 | Hb3 | 69 | 72 | 54 | |
| N406 | Hb4 | 54 | 55 | 50 | |
| N407 | Hb5 | 28 | 27 | 30 | |
| N408 | Hb1 | 92 | 94 | 92 | |
| Liyyah | SA421 | Ly4 | 61 | 64 | 50 |
| SA425 | Ly3 | 36 | 36 | 38 | |
| SA426 | Ly2 | 57 | 67 | 44 |
The LSM is a minimization of the sum of squared differences between CNe and CNc (equations (5) and (6)) as well as observed direct runoff (Q) and the estimated runoff
Different statistical techniques have been used, including RMSE, correlation coefficient (r), and coefficient of determination (R 2), to validate the outcome of the results according to Table 5 and Figure 9, which can be produced using equation (9).

Scatter plot shows the observed and estimated effective rainfall of Wadis Al Lith, Tabalah, Yiba, Tabalah and Liyyah catchments, and all wadis plotted in one graph.
The amount of variance in the dependent variable (seen effective rainfall) that can be explained by the independent variable (estimated effective rainfall) is measured by the coefficient of determination, which can be represented as R 2.
An R-squared value and the correlation coefficient value greater than 0.94 for Al Lith and Yiba suggest that the relationship between observed and estimated effective rainfall in these catchments is highly linear and that the estimated values are closely aligned with the observed values. For the other catchments (Tabalah, Habawnah, and Liyyah), the value of the correlation coefficient and R 2 is greater than 0.6. While not as high as the values for Al Lith and Yiba, an R-squared value greater than 0.6 still indicates a reasonably good linear relationship between observed and estimated effective rainfall. Therefore, the calculated effective rainfall is strongly connected with the observed values for all catchments, with Al Lith and Yiba showing especially significant relationships. This may indicate that the estimated effective rainfall is reliable and that the model that produced them works well for these catchments [73].
Comparing LD and CN involves assessing the relationship or correlation between these two geospatial parameters. LD, as previously mentioned, quantifies the concentration of linear geological features within a given area, while the CN is a hydrological parameter used to assess runoff potential and soil infiltration characteristics in a catchment. Based on each sub-catchment, comparisons of line density and CN have been made, as shown in Figure 10. The coefficients of determination (R 2) are carried out to determine the relationship between the distribution of CNs and LD. Therefore, all wadis suggest an inverse relationship between CN and LD, according to the findings. A negative correlation between LD and high CNs suggests that areas with more geological features (lineaments) may have better surface infiltration characteristics and lower runoff potential. This could indicate that the presence of geological features enhances soil permeability, allowing water to infiltrate into the ground more effectively. Areas with higher LD and lower CNs may be favorable for groundwater recharge [52]. The geological features could act as pathways for water to enter and replenish the groundwater aquifers beneath the surface.

Scatter plot between line density and CN for rock. The black dotted line indicates the trend line for the data, and the data are represented by red dots.
Wadi Al-Lith shows the highest R 2, equal to 0.72. Wadis Habawnah and Tabalah provide a moderate correlation for estimation, while poor correlations are observed in Wadi Yiba and Wadi Liyyah between the fracture density and the CN. The graphs c, d, and e show a high variability between CN and line density, which is reflected in the low R 2; therefore, more data is needed to verify this relation in further research. The lack of geological information, particularly upstream of Wadi Liyyah, does not make it possible to accurately assess the fractures present in the mountain. This basin shows that there are limited geological faults in the area that have been observed, making it impossible to map the fault pattern outside of the territory of the country and indicating that trends between CN and extract lineament are not well correlated.
The linear trend is shown to be the best when compared with other models and provides the highest R 2. The developed linear equations with low R 2 can be improved in the future by having more data.
The scatter plot in Figure 11 demonstrates that the observed and calculated CNs for rocks exhibit a somewhat positive linear relationship. The R 2 value in this instance is 0.66. Even if the R 2 number is not particularly high, it still indicates some degree of connection between the two variables. The correlation coefficient between the CN values is 0.68. The correlation coefficient “r” measures the strength of a linear relationship between two variables. A value of 0.68 indicates a moderately strong positive linear correlation between the observed and estimated CNs.

Scatter plot between observed and estimated CN for rocks.
We calculated the estimated effective rainfall and plotted it against the observed effective rainfall using the developed equation (Table 3) and applied it to each sub-catchment to validate the equations. To obtain the estimated effective rainfall, the observed CN of rock
Developed equations for CN estimation for rock (
| Basin | R2 | Equation derived from Figure 10 | LD range |
|---|---|---|---|
| Al Lith | 0.72 |
|
|
| Tabalah | 0.51 |
|
|
| Yiba | 0.30 |
|
|
| Habawnah | 0.50 |
|
|
| Liyyah | 0.25 |
|
|
| All | 0.26 |
|
|
Comparison between observed CN (
| Basin | Sub-basin | Code |
|
|
|---|---|---|---|---|
| AL Lith | J415 | AL5 | 49 | 73 |
| J416 | AL3 | 51 | 65 | |
| J417 | AL4 | 48 | 68 | |
| J418 | AL2 | 59 | 63 | |
| Tabalah | B405 | Tb3 | 46 | 71 |
| B412 | Tb2 | 66 | 62 | |
| B413 | Tb1 | 93 | 78 | |
| Yiba | SA401 | Yb4 | 49 | 73 |
| SA422 | Yb5 | 58 | 57 | |
| SA423 | Yb3 | 85 | 79 | |
| SA424 | Yb2 | 82 | 70 | |
| Habawnah | N404 | Hb2 | 72 | 72 |
| N405 | Hb3 | 72 | 62 | |
| N406 | Hb4 | 55 | 70 | |
| N407 | Hb5 | 27 | 30 | |
| N408 | Hb1 | 94 | 89 | |
| Liyyah | SA421 | Ly4 | 64 | 57 |
| SA425 | Ly3 | 36 | 43 | |
| SA426 | Ly2 | 67 | 53 |
The scatter plot in Figure 12 and the statistical analysis of the developed model in Table 5 show that in Wadi Al Lith and Wadi Yiba, the coefficient of determination (R-squared) between estimated effective rainfall and observed effective rainfall is significantly higher than in the other wadis, where it is higher than to 0.52. The RMSE of less than 2.10 mm indicates a strong and highly linear relationship between the estimated and observed effective rainfall in Wadi Habawnah and Wadi Tabalah. In these two wadis, the models used for estimating effective rainfall seem to be reliable.
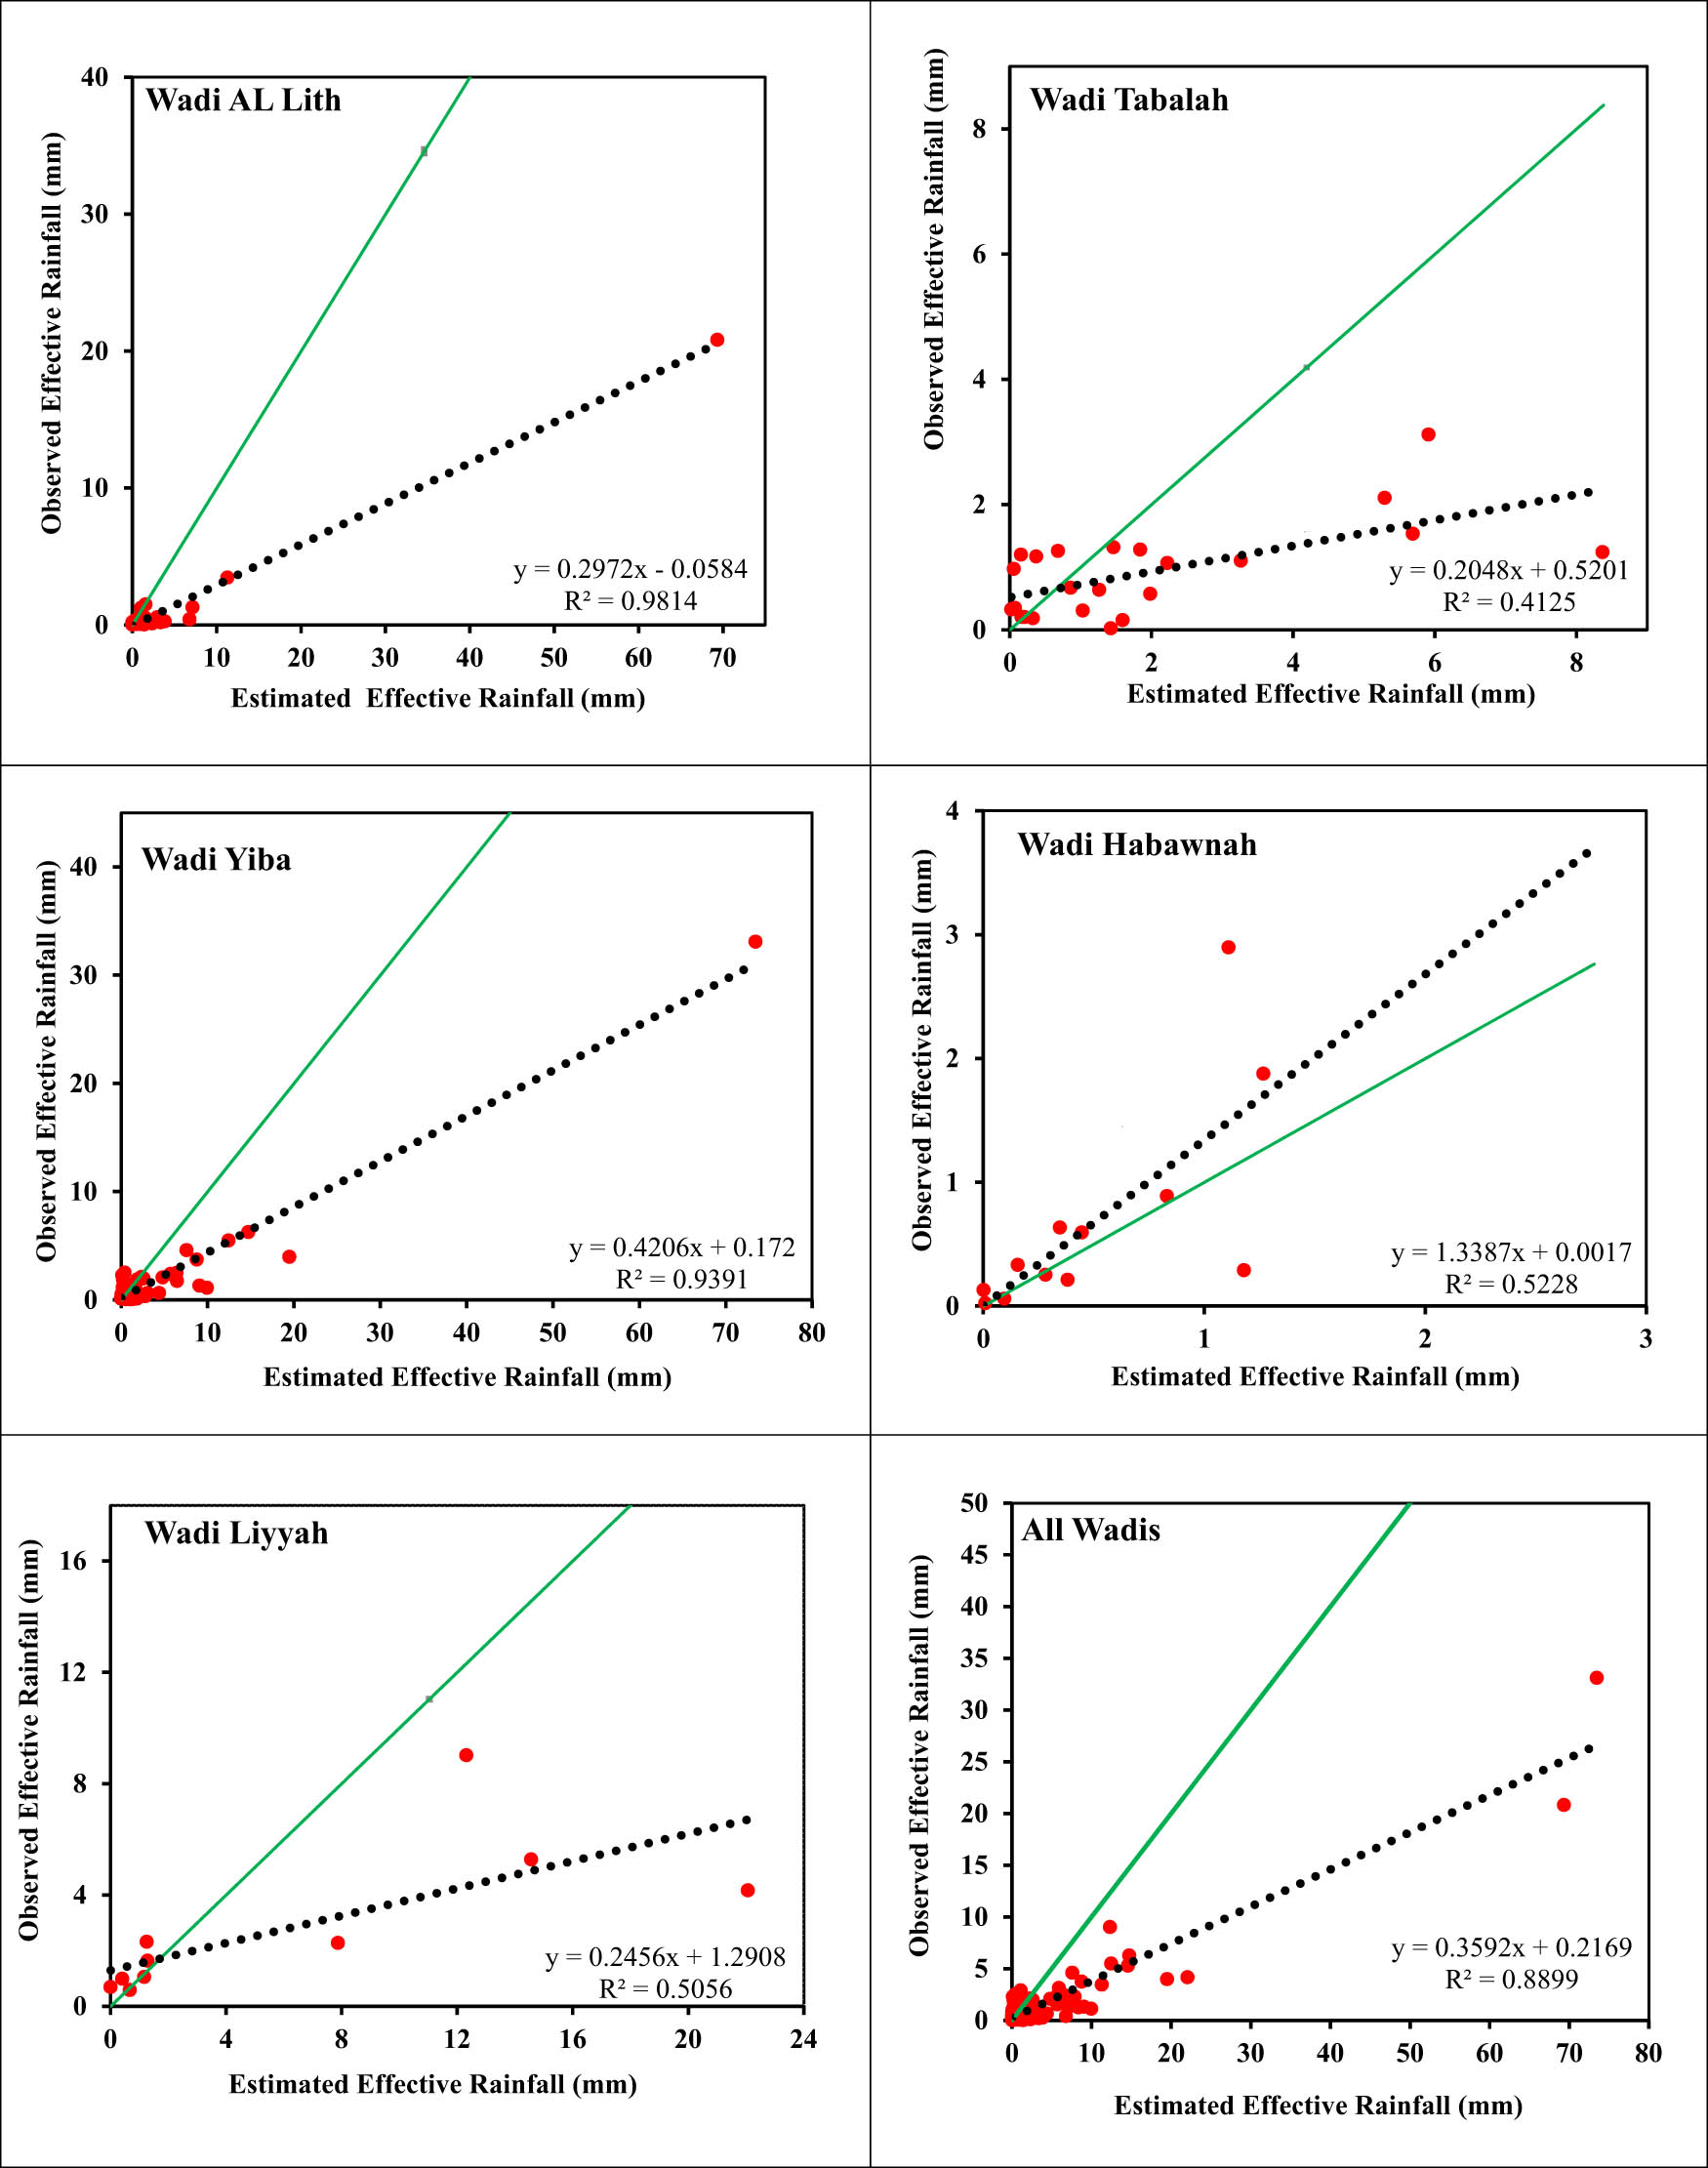
Scatter plot between observed effective rainfall and estimated effective rainfall based on the developed equations of the CN of rock with LD (Table 3).
Statistical analysis between observed effective rainfall and estimated effective rainfall from both the data and the model
| Basin | Derived from the data using equation (9) | Derived from the model using equation (10) | |||||
|---|---|---|---|---|---|---|---|
| RMSE (mm) | r | R 2 | RMSE (mm) | r | R 2 | % Data outbound C.L (±95%) | |
| Al Lith | 2.75 | 0.99 | 0.98 | 8.27 | 0.99 | 0.98 | 8.10 |
| Tabalah | 2.74 | 0.78 | 0.60 | 2.10 | 0.64 | 0.41 | 4.34 |
| Yiba | 6.45 | 0.98 | 0.96 | 5.50 | 0.97 | 0.94 | 8 |
| Habawnah | 0.45 | 0.84 | 0.70 | 0.61 | 0.72 | 0.52 | 16.6 |
| Liyyah | 6.66 | 0.84 | 0.70 | 6.71 | 0.71 | 0.51 | 10 |
| All wadis | 5.09 | 0.92 | 0.84 | 5.84 | 0.94 | 0.89 | 6.36 |
This low RMSE value suggests that the variability in observed effective rainfall can be explained by the estimated values, which is a strong indication of the model’s reliability. However, in the other wadis (Yiba, Al Lith, and Liyyah), the RMSE value of greater than 5.50 mm suggests a moderate linear relationship between estimated and observed effective rainfall. This might indicate that the models used for estimating effective rainfall in these wadis are reasonably accurate [74].
Table 5 and Figure 13 show the percentage of data points that fall outside the ± 95% confidence limits to better assess the developed model for all basins using the developed equations of the CN of rock with LD. As a result, a higher percentage of data points outside confidence limits is found in the Habawnah Basin (16.6%), which represents a high uncertainty compared to other basins. This highest value could be due to limitations of the data employed to evaluate the model, such as the smaller number of measured data or inaccuracies in some hydrological parameters. However, Tabalah Basin has the lowest percentage (4.34%), demonstrating less data outside the confidence limits. Overall, a combined analysis of all basins shows a relatively low number of data points falling outside the confidence bounds (6.36%). It indicates that the models used for estimating effective rainfall have a satisfactory level of reliability.

Scatter plot between estimated and observed effective rainfall based on the developed equations of the CN of rock with LD, with 95% confidence interval: the gray line is a line of the perfect fit; the green line represents the upper limit (95%), and the red line is the lower limit (95%).
7 Conclusions
Faults, joints, and bedrock fractures are examples of subsurface features that can have a substantial impact on an area’s ability to withstand infiltration. Highly fractured rocks or fissured soils typically have higher permeabilities, which facilitate easier water flow through them. The CN may be impacted by this greater permeability since it impacts how quickly water seeps into the ground. Due to the greater capacity of the fractured subsurface to absorb water, runoff potential is lowered in places with a high fracture density, which might result in a lower CN. The relationship between CN and geologic fractures can have significant implications for understanding and managing water resources, particularly in areas with fractured rock systems.
According to our findings, the following points can be drawn from the study:
This study proposes an approach for quantifying and parameterizing lineament features for CN estimation in mountainous regions, and consequently, it can be used to enhance rainfall–runoff response in catchments that contain mountains with a high density of geological features.
An automatic extraction of lineament from the Landsat image was performed. The results were validated by comparing them with the rose diagram of the observed faults, which show relatively reasonable agreement.
Some relationships between LD and CN were established for enhancing the prediction of hydrological response with the range of applications given in Table 3 (LD range). A negative correlation between LD and high CNs suggests that areas with more geological features may have higher surface infiltration characteristics and lower runoff potential. Low values would result in arid and semi-arid regions, where strong infiltration in a dry substrate and fractured mountains causes transmission losses to be the predominant features.
The correlation coefficient of 0.68 indicates a moderately strong positive linear correlation between observed and estimated CNs, and therefore, the developed relationship between CN and fracture density could be used by hydrologists to best management of water resources in these basins. Further research is needed to improve the developed equation in other basins in Kingdom of Saudi Arabia.
The RMSE between estimated effective rainfall and observed effective rainfall based on the developed equations for Wadi Tabalah and Wadi Habawnah is 2.10 and 0.61 mm, respectively, which is relatively low and indicates a strong relationship between CN and lineaments density. However, a relatively high RMSE is indicated for other wadis (Yiba, Al Lith, and Liyyah), which indicates that the models used for estimating effective rainfall in these study areas may need further analysis by incorporating more data. The percentage of data points beyond the ±95% confidence limit was also calculated. According to the results, Habawnah Basin (16.6%) has a higher percentage of data points out of confidence bounds, which suggests that it has a higher level of uncertainty. The low values of confidence level derived from the developed equations for some studied basins may be attributed to a variety of factors, including the limited number of data used to assess the model, inaccuracies in certain hydrological parameters (e.g., CN), or disparities between observed and estimated values. In contrast, the lowest percentage (4.34%) is found in Tabalah Basin, indicating that there is less data outside the confidence interval. An analysis combining all basins found the number of data points outside the confidence bounds to be relatively low (6.36%), which demonstrates an adequate degree of reliability, and consequently, the model could be used for runoff estimation.
Overall, the low values of CN in the arid catchment are interpreted by the LD available in the mountainous area together with transmission losses in the stream alluvium. The alluvial deposits and the huge mountain are the regions that can be thought of as prospective groundwater direct recharge locations.
This study highlights the importance of fracture densities in arid catchments and their contribution to increase the infiltration rates. The results obtained in this research can be better exploited in integrated watershed management and groundwater management by incorporating more recent hydrological measurement and geological data to improve the proposed methodology.
Acknowledgement
This project was funded by the Deanship of Scientific Research (DSR), King Abdulaziz University, Jeddah, under Grant No. (GPIP: 644-155-2024). The authors, therefore, acknowledge with thanks DSR technical and financial support.
-
Funding information: This project was funded by the Deanship of Scientific Research (DSR), King Abdulaziz University, Jeddah, under Grant No. (GPIP: 644-155-2024). The authors, therefore, acknowledge with thanks DSR technical and financial support.
-
Author contributions: E.A. and A.E.; methodology, E.A, A.C and R.S.; validation, E.A., A.E., and M.F.; formal analysis, E.A, A.C. and M.E.; writing original draft preparation, E.A., A.E., and M.E.; writing review and editing, A.E., R.S., and M.E.
-
Conflict of interest: Authors state no conflict of interest.
References
[1] Enoh MA, Okeke FI, Okeke UC. Automatic lineaments mapping and extraction in relationship to natural hydrocarbon seepage in Ugwueme, South-Eastern Nigeria. Geodesy Cartogr. 2021;47(1):34–44.10.3846/gac.2021.12099Search in Google Scholar
[2] Hung L, Batelaan O, De Smedt F, eds. Lineament extraction and analysis, comparison of LANDSAT ETM and ASTER imagery. Case study: Suoimuoi tropical karst catchment, Vietnam. Remote sensing for environmental monitoring, GIS applications, and geology V. Boston, USA: SPIE; 2005.10.1117/12.627699Search in Google Scholar
[3] Corgne S, Magagi R, Yergeau M, Sylla D. An integrated approach to hydro-geological lineament mapping of a semi-arid region of West Africa using Radarsat-1 and GIS. Remote Sens Environ. 2010;114(9):1863–75.10.1016/j.rse.2010.03.004Search in Google Scholar
[4] Assatse WT, Nouck PN, Tabod CT, Akame JM, Biringanine GN. Hydrogeological activity of lineaments in Yaoundé Cameroon region using remote sensing and GIS techniques. Egypt J Remote Sens Space Sci. 2016;19(1):49–60.10.1016/j.ejrs.2015.12.006Search in Google Scholar
[5] Sander P. Lineaments in groundwater exploration: a review of applications and limitations. Hydrogeol J. 2007;15(1):71–4.10.1007/s10040-006-0138-9Search in Google Scholar
[6] Akinluyi FO, Olorunfemi MO, Bayowa OG. Investigation of the influence of lineaments, lineament intersections and geology on groundwater yield in the basement complex terrain of Ondo State, Southwestern Nigeria. Appl Water Sci. 2018;8(1):1–13.10.1007/s13201-018-0686-xSearch in Google Scholar
[7] Bhuiyan C. Hydrological characterisation of geological lineaments: a case study from the Aravalli terrain, India. Hydrogeol J. 2015;23(4):673–86.10.1007/s10040-015-1239-0Search in Google Scholar
[8] Hidayatulloh A, Chaabani A, Zhang L, Elhag M. DEM Study on Hydrological Response in Makkah City, Saudi Arabia. Sustainability. 2022;14(20):13369.10.3390/su142013369Search in Google Scholar
[9] Arnous MO, Green DR. GIS and remote sensing as tools for conducting geo-hazards risk assessment along Gulf of Aqaba coastal zone, Egypt. J Coast Conserv. 2011;15(4):457–75.10.1007/s11852-010-0136-xSearch in Google Scholar
[10] León R, Somoza L. GIS-based mapping for marine geohazards in seabed fluid leakage areas (Gulf of Cadiz, Spain). Mar Geophys Res. 2011;32(1):207–23.10.1007/s11001-011-9135-zSearch in Google Scholar
[11] Fadda EH, Abulibdeh AO, Al Balushi AS, eds. Using geomatics techniques to produce a geospatial database system for geological hazards in the Al-Salt area. Proceedings of the 3rd International Conference on Vision, Image and Signal Processing; 2019.10.1145/3387168.3387170Search in Google Scholar
[12] Koike K, Nagano S, Ohmi M. Lineament analysis of satellite images using a Segment Tracing Algorithm (STA). Comput Geosci. 1995;21(9):1091–104.10.1016/0098-3004(95)00042-7Search in Google Scholar
[13] Simon N, Roslee R, Marto NL, Akhir JM, Rafek AG, Lai GT. Lineaments and their association with landslide occurrences along the Ranau-Tambunan Road, Sabah. EJGE. 2014;19:645–55.Search in Google Scholar
[14] Adem E, Chaabani A, Elfeki A, Zhang L, Elhag M. SBAS-InSAR/GNSS Surface Deformation Assessment in Arid Environments of Najran, Saudi Arabia. Earth Syst Environ. 2023;7(3):601–16.10.1007/s41748-023-00346-0Search in Google Scholar
[15] Aziz SN. General geology and structural analysis of Jeli Hot Spring, Jeli, Kelantan. Kota Bharu, Malaysia: Faculty of Earth Science; 2016.Search in Google Scholar
[16] Elhag M, Alshamsi D. Integration of remote sensing and geographic information systems for geological fault detection on the island of Crete, Greece. Geosci Instrum Methods Data Syst. 2019;8(1):45–54.10.5194/gi-8-45-2019Search in Google Scholar
[17] Elmahdy SI, Mohamed MM, Ali TA. Automated detection of lineaments express geological linear features of a tropical region using topographic fabric grain algorithm and the SRTM DEM. Geocarto Int. 2021;36(1):76–95.10.1080/10106049.2019.1594393Search in Google Scholar
[18] Ahmadirouhani R, Rahimi B, Karimpour MH, Shafaroudi AM, Najafi SA, Pour AB. Fracture mapping of lineaments and recognizing their tectonic significance using SPOT-5 satellite data: A case study from the Bajestan area, Lut Block, east of Iran. J Afr Earth Sci. 2017;134:600–12.10.1016/j.jafrearsci.2017.07.027Search in Google Scholar
[19] Shahbandeh M, Elhag M. Microclimate changes and trend analysis of remotely sensed environmental parameters in West Asia Semi-arid region. Environ Dev Sustainability. 2023;26:14433–47.10.1007/s10668-023-03201-4Search in Google Scholar
[20] Benaafi M, Hariri M, Abdullatif O, Makkawi M, Al-Shaibani A. Analysis of lineaments within the Wajid Group, SW Saudi Arabia, and their tectonic significance. Arab J Geosci. 2017;10:1–17.10.1007/s12517-017-2860-0Search in Google Scholar
[21] Abdelazeem M, El-Sawy ESK, Gobashy MM. Analysis of magnetic gradients at North East of Wadi Ar Rika quadrangle, Saudi Arabia, to delineate subsurface linear features and faults. NRIAG J Astron Geophys. 2013;2(1):27–38.10.1016/j.nrjag.2013.06.006Search in Google Scholar
[22] Madani A, Niyazi B. Evaluation of the relationship between the main lineament trends and the geometry of the drainage network using SPOT-5 and SRTM data: a case study from Bulghah area, Saudi Arabia. Arab J Geosci. 2015;8:10995–1005.10.1007/s12517-015-1934-0Search in Google Scholar
[23] Kahal AY. Geological assessment of the Neom mega-project area, northwestern Saudi Arabia: an integrated approach. Arab J Geosci. 2020;13:1–10.10.1007/s12517-020-05345-3Search in Google Scholar
[24] Kahal AY, Abdelrahman K, Alfaifi HJ, Yahya MM. Landslide hazard assessment of the Neom promising city, northwestern Saudi Arabia: An integrated approach. J King Saud University-Science. 2021;33(2):101279.10.1016/j.jksus.2020.101279Search in Google Scholar
[25] Jallouli C, Abdelfattah AK, El-Waheidi MM, Alqaysi S, Mogren S, Alzahrani H. Geophysical evidences on reactivation of NE faults in southern Arabian Shield and its tectonic implications. J King Saud Univ-Sci. 2023;35(1):102445.10.1016/j.jksus.2022.102445Search in Google Scholar
[26] Abdelkareem M, Bamousa AO, Hamimi Z, Kamal El-Din GM. Multispectral and RADAR images integration for geologic, geomorphic, and structural investigation in southwestern Arabian Shield, Al Qunfudhah area, Saudi Arabia. J Taibah Univ Sci. 2020;14(1):383–401.10.1080/16583655.2020.1741957Search in Google Scholar
[27] Al-Garni MA. Magnetic survey for delineating subsurface structures and estimating magnetic sources depth, Wadi Fatima, KSA. J King Saud Univ-Sci. 2010;22(2):87–96.10.1016/j.jksus.2010.02.005Search in Google Scholar
[28] Hussein MT, Lashin A, Al Bassam A, Al Arifi N, Al Zahrani I. Geothermal power potential at the western coastal part of Saudi Arabia. Renew Sustain Energy Rev. 2013;26:668–84.10.1016/j.rser.2013.05.073Search in Google Scholar
[29] Elhag M, Bahrawi J, Aljahdali MH, Eleftheriou G, Labban AH, Alqarawy A. Vertical displacement assessment in temporal analysis of the transboundary islands of Tiran and Sanafir, Egypt-Saudi Arabia. Arab J Geosci. 2022;15(12):1121.10.1007/s12517-022-10398-7Search in Google Scholar
[30] Ahmadi H, Pekkan E. Fault-based geological lineaments extraction using remote sensing and GIS – a review. Geosciences. 2021;11(5):183.10.3390/geosciences11050183Search in Google Scholar
[31] Scheiber T, Fredin O, Viola G, Jarna A, Gasser D, Łapińska-Viola R. Manual extraction of bedrock lineaments from high-resolution LiDAR data: methodological bias and human perception. Gff. 2015;137(4):362–72.10.1080/11035897.2015.1085434Search in Google Scholar
[32] Azman AI, Ab Talib J, Sokiman MS, eds. The integration of remote sensing data for lineament mapping in the semanggol formation, Northwest Peninsular Malaysia. IOP Conference Series: Earth and Environmental Science. IOP Publishing; 2020.10.1088/1755-1315/540/1/012026Search in Google Scholar
[33] Das S, Pardeshi SD, Kulkarni PP, Doke A. Extraction of lineaments from different azimuth angles using geospatial techniques: a case study of Pravara basin, Maharashtra, India. Arab J Geosci. 2018;11(8):1–13.10.1007/s12517-018-3522-6Search in Google Scholar
[34] Jordan G, Schott B. Application of wavelet analysis to the study of spatial pattern of morphotectonic lineaments in digital terrain models. A case study. Remote Sens Environ. 2005;94(1):31–8.10.1016/j.rse.2004.08.013Search in Google Scholar
[35] Zlatopolsky AA. Program LESSA (Lineament Extraction and Stripe Statistical Analysis) automated linear image features analysis – experimental results. Comput Geosci. 1992;18(9):1121–6.10.1016/0098-3004(92)90036-QSearch in Google Scholar
[36] Wang J, Howarth PJ. Use of the Hough transform in automated lineament. IEEE Trans Geosci Remote Sens. 1990;28(4):561–7.10.1109/TGRS.1990.572949Search in Google Scholar
[37] Rahnama M, Gloaguen R. TecLines: A MATLAB-based toolbox for tectonic lineament analysis from satellite images and DEMs, part 1: Line segment detection and extraction. Remote Sens. 2014;6(7):5938–58.10.3390/rs6075938Search in Google Scholar
[38] Masoud A, Koike K. Applicability of computer-aided comprehensive tool (LINDA: LINeament Detection and Analysis) and shaded digital elevation model for characterizing and interpreting morphotectonic features from lineaments. Comput Geosci. 2017;106:89–100.10.1016/j.cageo.2017.06.006Search in Google Scholar
[39] Marghany M, Hashim M. Lineament mapping using multispectral remote sensing satellite data. Int J Phys Sci. 2010;5(10):1501–7.10.3923/rjasci.2010.126.130Search in Google Scholar
[40] Farran MM, Elfeki A, Elhag M, Chaabani A. A comparative study of the estimation methods for NRCS curve number of natural arid basins and the impact on flash flood predications. Arab J Geosci. 2021;14(2):1–23.10.1007/s12517-020-06341-3Search in Google Scholar
[41] Rallison RE, ed. Origin and evolution of the SCS runoff equation. ASCE; 1980.Search in Google Scholar
[42] Alagha MO, Gutub SA, Elfeki AM. Estimation of NRCS curve number from watershed morphometric parameters: A case study of Yiba watershed in Saudi Arabia. Int J Civ Eng Technol. 2016;7:247–65.Search in Google Scholar
[43] Ponce VM, Hawkins RH. Runoff curve number: Has it reached maturity? J Hydrol Eng. 1996;1(1):11–9.10.1061/(ASCE)1084-0699(1996)1:1(11)Search in Google Scholar
[44] Ejaz N, Elhag M, Bahrawi J, Zhang L, Gabriel HF, Rahman KU. Soil erosion modelling and accumulation using RUSLE and remote sensing techniques: case study Wadi Baysh, Kingdom of Saudi Arabia. Sustainability. 2023;15(4):3218.10.3390/su15043218Search in Google Scholar
[45] Muche ME, Hutchinson SL, Hutchinson JS, Johnston JM. Phenology-adjusted dynamic curve number for improved hydrologic modeling. J Environ Manag. 2019;235:403–13.10.1016/j.jenvman.2018.12.115Search in Google Scholar PubMed PubMed Central
[46] Merizalde MJ, Muñoz P, Corzo G, Muñoz DF, Samaniego E, Célleri R. Integrating geographic data and the SCS-CN method with LSTM networks for enhanced runoff forecasting in a complex mountain basin. Front Water. 2023;5:1233899.10.3389/frwa.2023.1233899Search in Google Scholar
[47] Shi W, Wang N. An improved SCS-CN method incorporating slope, soil moisture, and storm duration factors for runoff prediction. Water. 2020;12(5):1335.10.3390/w12051335Search in Google Scholar
[48] Elhag M, Hidayatulloh A, Bahrawi J, Chaabani A, Budiman J. Using inconsistencies of wadi morphometric parameters to understand patterns of soil erosion. Arab J Geosci. 2022;15(14):1299.10.1007/s12517-022-10422-wSearch in Google Scholar
[49] Farran MM, Elfeki AM. Statistical analysis of NRCS curve number (NRCS-CN) in arid basins based on historical data. Arab J Geosci. 2020;13(1):1–15.10.1007/s12517-019-4993-9Search in Google Scholar
[50] Hashim M, Misbari S, Pour AB. Landslide mapping and assessment by integrating Landsat-8, PALSAR-2 and GIS techniques: a case study from Kelantan State, Peninsular Malaysia. J Indian Soc Remote Sens. 2018;46(2):233–48.10.1007/s12524-017-0675-9Search in Google Scholar
[51] Subyani AM, Hajjar AF. Rainfall analysis in the contest of climate change for Jeddah area, Western Saudi Arabia. Arab J Geosci. 2016;9:1–15.10.1007/s12517-015-2102-2Search in Google Scholar
[52] Budiman J, Bahrawi J, Hidayatulloh A, Almazroui M, Elhag M. Volumetric Quantification of Flash Flood Using Microwave Data on a Watershed Scale in Arid Environments, Saudi Arabia. Sustainability. 2021;13(8):4115.10.3390/su13084115Search in Google Scholar
[53] Tariki AH. Geology of Saudi Arabia. Texas, USA: The University of Texas at Austin; 1947.Search in Google Scholar
[54] Farran MM, Al‐Amri N, Elfeki AM. Aquifer recharge from flash floods in the arid environment: A mass balance approach at the catchment scale. Hydrol Process. 2021;35(8):e14318.10.1002/hyp.14318Search in Google Scholar
[55] Stern RJ. Crustal evolution in the East African Orogen: a neodymium isotopic perspective. J Afr Earth Sci. 2002;34(3–4):109–7.10.1016/S0899-5362(02)00012-XSearch in Google Scholar
[56] Hamimi Z, El-Shafei M, Kattu G, Matsah M. Transpressional regime in southern Arabian shield: insights from Wadi Yiba area, Saudi Arabia. Mineral Petrol. 2013;107:849–60.10.1007/s00710-012-0198-6Search in Google Scholar
[57] Wheater H, Butler A, Stewart E, Hamilton G. A multivariate spatial-temporal model of rainfall in southwest Saudi Arabia. I. Spatial rainfall characteristics and model formulation. J Hydrol. 1991;125(3–4):175–99.10.1016/0022-1694(91)90028-GSearch in Google Scholar
[58] Bahrawi J, Alqarawy A, Chabaani A, Elfeki A, Elhag M. Spatiotemporal analysis of the annual rainfall in the Kingdom of Saudi Arabia: predictions to 2030 with different confidence levels. Theor Appl Climatol. 2021;146(3):1479–99.10.1007/s00704-021-03778-8Search in Google Scholar
[59] Wilson JL, Guan H. Mountain‐block hydrology and mountain‐front recharge. Groundw Recharge a Desert Environ: Southwest U S. 2004;9:113–37.10.1029/009WSA08Search in Google Scholar
[60] Elhag M, Boteva S. Quantitative analysis of different environmental factor impacts on land cover in Nisos Elafonisos, Crete, Greece. Int J Environ Res Public Health. 2020;17(18):6437.10.3390/ijerph17186437Search in Google Scholar PubMed PubMed Central
[61] Abdulrazzak M, Elfeki A, Kamis A, Kassab M, Alamri N, Chaabani A, et al. Flash flood risk assessment in urban arid environment: case study of Taibah and Islamic universities’ campuses, Medina, Kingdom of Saudi Arabia. Geomatics, Nat Hazards Risk. 2019;10(1):780–96.10.1080/19475705.2018.1545705Search in Google Scholar
[62] Kharazmi R, Rahdari MR, Rodríguez-Seijo A, Elhag M. Long-term time series analysis of land cover changes in an arid environment using Landsat data:(a case study of Hamoun Biosphere Reserve, Iran). Desert. 2023;28(1):123–44.Search in Google Scholar
[63] Bahiru TK, Aldosary AS, Kafy A-A, Rahman MT, Nath H, Kalaivani S, et al. Geospatial approach in modeling linear, areal, and relief morphometric interactions in Dabus river basin ecology for sustainable water resource management. Groundw Sustain Dev. 2024;24:101067.10.1016/j.gsd.2023.101067Search in Google Scholar
[64] SCS U. National engineering handbook, section 4: hydrology. Washington, DC: US Soil Conservation Service, USDA; 1985.Search in Google Scholar
[65] Hawkins RH. Improved prediction of storm runoff in mountain watersheds. J Irrig Drain Div. 1973;99(4):519–23.10.1061/JRCEA4.0000957Search in Google Scholar
[66] Ghanim AA, Al-Areeq AM, Benaafi M, Al-Suwaiyan MS, Aghbari AAA, Alyami M. Mapping groundwater potential zones in the Habawnah Basin of Southern Saudi Arabia: An AHP-and GIS-based approach. Sustainability. 2023;15(13):10075.10.3390/su151310075Search in Google Scholar
[67] Qari MH, Hussein MT, Bazuhair AS. Groundwater exploration in western Saudi Arabia using Landsat-TM imagery. Earth Sci. 1999;11(1):1–14.10.4197/Ear.11-1.1Search in Google Scholar
[68] Elhag M, Bahrawi J, Zhang L, Ejaz N. Assessment and quantification of sediment retention and dam management in arid environments using remote sensing techniques. Arab J Geosci. 2023;16(10):559.10.1007/s12517-023-11661-1Search in Google Scholar
[69] Fedorik J, Delaunay A, Losi G, Panara Y, Menegoni N, Afifi AM, et al. Structure and fracture characterization of the Jizan group: Implications for subsurface CO2 basalt mineralization. Front Earth Sci. 2023;10:946532.10.3389/feart.2022.946532Search in Google Scholar
[70] Mohamed A, Othman A, Galal WF, Abdelrady A. Integrated geophysical approach of groundwater potential in Wadi Ranyah, Saudi Arabia, using gravity, electrical resistivity, and remote-sensing techniques. Remote Sens. 2023;15(7):1808.10.3390/rs15071808Search in Google Scholar
[71] Bahrawi J, Ewea H, Kamis A, Elhag M. Potential flood risk due to urbanization expansion in arid environments, Saudi Arabia. Nat Hazards. 2020;104:795–809.10.1007/s11069-020-04190-7Search in Google Scholar
[72] Elhag M, Abdurahman SG. Advanced remote sensing techniques in flash flood delineation in Tabuk City, Saudi Arabia. Nat Hazards. 2020;103(3):3401–13.10.1007/s11069-020-04135-0Search in Google Scholar
[73] Elhag M, Yilmaz N. Insights of remote sensing data to surmount rainfall/runoff data limitations of the downstream catchment of Pineios River, Greece. Env Earth Sci. 2021;80(1):1–13.10.1007/s12665-020-09289-5Search in Google Scholar
[74] Elhag M, Galal HK, Alsubaie H. Understanding of morphometric features for adequate water resource management in arid environments. Geosci Instrum Methods Data Syst. 2017;6(2):293–300.10.5194/gi-6-293-2017Search in Google Scholar
© 2024 the author(s), published by De Gruyter
This work is licensed under the Creative Commons Attribution 4.0 International License.
Articles in the same Issue
- Regular Articles
- Theoretical magnetotelluric response of stratiform earth consisting of alternative homogeneous and transitional layers
- The research of common drought indexes for the application to the drought monitoring in the region of Jin Sha river
- Evolutionary game analysis of government, businesses, and consumers in high-standard farmland low-carbon construction
- On the use of low-frequency passive seismic as a direct hydrocarbon indicator: A case study at Banyubang oil field, Indonesia
- Water transportation planning in connection with extreme weather conditions; case study – Port of Novi Sad, Serbia
- Zircon U–Pb ages of the Paleozoic volcaniclastic strata in the Junggar Basin, NW China
- Monitoring of mangrove forests vegetation based on optical versus microwave data: A case study western coast of Saudi Arabia
- Microfacies analysis of marine shale: A case study of the shales of the Wufeng–Longmaxi formation in the western Chongqing, Sichuan Basin, China
- Multisource remote sensing image fusion processing in plateau seismic region feature information extraction and application analysis – An example of the Menyuan Ms6.9 earthquake on January 8, 2022
- Identification of magnetic mineralogy and paleo-flow direction of the Miocene-quaternary volcanic products in the north of Lake Van, Eastern Turkey
- Impact of fully rotating steel casing bored pile on adjacent tunnels
- Adolescents’ consumption intentions toward leisure tourism in high-risk leisure environments in riverine areas
- Petrogenesis of Jurassic granitic rocks in South China Block: Implications for events related to subduction of Paleo-Pacific plate
- Differences in urban daytime and night block vitality based on mobile phone signaling data: A case study of Kunming’s urban district
- Random forest and artificial neural network-based tsunami forests classification using data fusion of Sentinel-2 and Airbus Vision-1 satellites: A case study of Garhi Chandan, Pakistan
- Integrated geophysical approach for detection and size-geometry characterization of a multiscale karst system in carbonate units, semiarid Brazil
- Spatial and temporal changes in ecosystem services value and analysis of driving factors in the Yangtze River Delta Region
- Deep fault sliding rates for Ka-Ping block of Xinjiang based on repeating earthquakes
- Improved deep learning segmentation of outdoor point clouds with different sampling strategies and using intensities
- Platform margin belt structure and sedimentation characteristics of Changxing Formation reefs on both sides of the Kaijiang-Liangping trough, eastern Sichuan Basin, China
- Enhancing attapulgite and cement-modified loess for effective landfill lining: A study on seepage prevention and Cu/Pb ion adsorption
- Flood risk assessment, a case study in an arid environment of Southeast Morocco
- Lower limits of physical properties and classification evaluation criteria of the tight reservoir in the Ahe Formation in the Dibei Area of the Kuqa depression
- Evaluation of Viaducts’ contribution to road network accessibility in the Yunnan–Guizhou area based on the node deletion method
- Permian tectonic switch of the southern Central Asian Orogenic Belt: Constraints from magmatism in the southern Alxa region, NW China
- Element geochemical differences in lower Cambrian black shales with hydrothermal sedimentation in the Yangtze block, South China
- Three-dimensional finite-memory quasi-Newton inversion of the magnetotelluric based on unstructured grids
- Obliquity-paced summer monsoon from the Shilou red clay section on the eastern Chinese Loess Plateau
- Classification and logging identification of reservoir space near the upper Ordovician pinch-out line in Tahe Oilfield
- Ultra-deep channel sand body target recognition method based on improved deep learning under UAV cluster
- New formula to determine flyrock distance on sedimentary rocks with low strength
- Assessing the ecological security of tourism in Northeast China
- Effective reservoir identification and sweet spot prediction in Chang 8 Member tight oil reservoirs in Huanjiang area, Ordos Basin
- Detecting heterogeneity of spatial accessibility to sports facilities for adolescents at fine scale: A case study in Changsha, China
- Effects of freeze–thaw cycles on soil nutrients by soft rock and sand remodeling
- Vibration prediction with a method based on the absorption property of blast-induced seismic waves: A case study
- A new look at the geodynamic development of the Ediacaran–early Cambrian forearc basalts of the Tannuola-Khamsara Island Arc (Central Asia, Russia): Conclusions from geological, geochemical, and Nd-isotope data
- Spatio-temporal analysis of the driving factors of urban land use expansion in China: A study of the Yangtze River Delta region
- Selection of Euler deconvolution solutions using the enhanced horizontal gradient and stable vertical differentiation
- Phase change of the Ordovician hydrocarbon in the Tarim Basin: A case study from the Halahatang–Shunbei area
- Using interpretative structure model and analytical network process for optimum site selection of airport locations in Delta Egypt
- Geochemistry of magnetite from Fe-skarn deposits along the central Loei Fold Belt, Thailand
- Functional typology of settlements in the Srem region, Serbia
- Hunger Games Search for the elucidation of gravity anomalies with application to geothermal energy investigations and volcanic activity studies
- Addressing incomplete tile phenomena in image tiling: Introducing the grid six-intersection model
- Evaluation and control model for resilience of water resource building system based on fuzzy comprehensive evaluation method and its application
- MIF and AHP methods for delineation of groundwater potential zones using remote sensing and GIS techniques in Tirunelveli, Tenkasi District, India
- New database for the estimation of dynamic coefficient of friction of snow
- Measuring urban growth dynamics: A study in Hue city, Vietnam
- Comparative models of support-vector machine, multilayer perceptron, and decision tree predication approaches for landslide susceptibility analysis
- Experimental study on the influence of clay content on the shear strength of silty soil and mechanism analysis
- Geosite assessment as a contribution to the sustainable development of Babušnica, Serbia
- Using fuzzy analytical hierarchy process for road transportation services management based on remote sensing and GIS technology
- Accumulation mechanism of multi-type unconventional oil and gas reservoirs in Northern China: Taking Hari Sag of the Yin’e Basin as an example
- TOC prediction of source rocks based on the convolutional neural network and logging curves – A case study of Pinghu Formation in Xihu Sag
- A method for fast detection of wind farms from remote sensing images using deep learning and geospatial analysis
- Spatial distribution and driving factors of karst rocky desertification in Southwest China based on GIS and geodetector
- Physicochemical and mineralogical composition studies of clays from Share and Tshonga areas, Northern Bida Basin, Nigeria: Implications for Geophagia
- Geochemical sedimentary records of eutrophication and environmental change in Chaohu Lake, East China
- Research progress of freeze–thaw rock using bibliometric analysis
- Mixed irrigation affects the composition and diversity of the soil bacterial community
- Examining the swelling potential of cohesive soils with high plasticity according to their index properties using GIS
- Geological genesis and identification of high-porosity and low-permeability sandstones in the Cretaceous Bashkirchik Formation, northern Tarim Basin
- Usability of PPGIS tools exemplified by geodiscussion – a tool for public participation in shaping public space
- Efficient development technology of Upper Paleozoic Lower Shihezi tight sandstone gas reservoir in northeastern Ordos Basin
- Assessment of soil resources of agricultural landscapes in Turkestan region of the Republic of Kazakhstan based on agrochemical indexes
- Evaluating the impact of DEM interpolation algorithms on relief index for soil resource management
- Petrogenetic relationship between plutonic and subvolcanic rocks in the Jurassic Shuikoushan complex, South China
- A novel workflow for shale lithology identification – A case study in the Gulong Depression, Songliao Basin, China
- Characteristics and main controlling factors of dolomite reservoirs in Fei-3 Member of Feixianguan Formation of Lower Triassic, Puguang area
- Impact of high-speed railway network on county-level accessibility and economic linkage in Jiangxi Province, China: A spatio-temporal data analysis
- Estimation model of wild fractional vegetation cover based on RGB vegetation index and its application
- Lithofacies, petrography, and geochemistry of the Lamphun oceanic plate stratigraphy: As a record of the subduction history of Paleo-Tethys in Chiang Mai-Chiang Rai Suture Zone of Thailand
- Structural features and tectonic activity of the Weihe Fault, central China
- Application of the wavelet transform and Hilbert–Huang transform in stratigraphic sequence division of Jurassic Shaximiao Formation in Southwest Sichuan Basin
- Structural detachment influences the shale gas preservation in the Wufeng-Longmaxi Formation, Northern Guizhou Province
- Distribution law of Chang 7 Member tight oil in the western Ordos Basin based on geological, logging and numerical simulation techniques
- Evaluation of alteration in the geothermal province west of Cappadocia, Türkiye: Mineralogical, petrographical, geochemical, and remote sensing data
- Numerical modeling of site response at large strains with simplified nonlinear models: Application to Lotung seismic array
- Quantitative characterization of granite failure intensity under dynamic disturbance from energy standpoint
- Characteristics of debris flow dynamics and prediction of the hazardous area in Bangou Village, Yanqing District, Beijing, China
- Rockfall mapping and susceptibility evaluation based on UAV high-resolution imagery and support vector machine method
- Statistical comparison analysis of different real-time kinematic methods for the development of photogrammetric products: CORS-RTK, CORS-RTK + PPK, RTK-DRTK2, and RTK + DRTK2 + GCP
- Hydrogeological mapping of fracture networks using earth observation data to improve rainfall–runoff modeling in arid mountains, Saudi Arabia
- Petrography and geochemistry of pegmatite and leucogranite of Ntega-Marangara area, Burundi, in relation to rare metal mineralisation
- Prediction of formation fracture pressure based on reinforcement learning and XGBoost
- Hazard zonation for potential earthquake-induced landslide in the eastern East Kunlun fault zone
- Monitoring water infiltration in multiple layers of sandstone coal mining model with cracks using ERT
- Study of the patterns of ice lake variation and the factors influencing these changes in the western Nyingchi area
- Productive conservation at the landslide prone area under the threat of rapid land cover changes
- Sedimentary processes and patterns in deposits corresponding to freshwater lake-facies of hyperpycnal flow – An experimental study based on flume depositional simulations
- Study on time-dependent injectability evaluation of mudstone considering the self-healing effect
- Detection of objects with diverse geometric shapes in GPR images using deep-learning methods
- Behavior of trace metals in sedimentary cores from marine and lacustrine environments in Algeria
- Spatiotemporal variation pattern and spatial coupling relationship between NDVI and LST in Mu Us Sandy Land
- Formation mechanism and oil-bearing properties of gravity flow sand body of Chang 63 sub-member of Yanchang Formation in Huaqing area, Ordos Basin
- Diagenesis of marine-continental transitional shale from the Upper Permian Longtan Formation in southern Sichuan Basin, China
- Vertical high-velocity structures and seismic activity in western Shandong Rise, China: Case study inspired by double-difference seismic tomography
- Spatial coupling relationship between metamorphic core complex and gold deposits: Constraints from geophysical electromagnetics
- Disparities in the geospatial allocation of public facilities from the perspective of living circles
- Research on spatial correlation structure of war heritage based on field theory. A case study of Jinzhai County, China
- Formation mechanisms of Qiaoba-Zhongdu Danxia landforms in southwestern Sichuan Province, China
- Magnetic data interpretation: Implication for structure and hydrocarbon potentiality at Delta Wadi Diit, Southeastern Egypt
- Deeply buried clastic rock diagenesis evolution mechanism of Dongdaohaizi sag in the center of Junggar fault basin, Northwest China
- Application of LS-RAPID to simulate the motion of two contrasting landslides triggered by earthquakes
- The new insight of tectonic setting in Sunda–Banda transition zone using tomography seismic. Case study: 7.1 M deep earthquake 29 August 2023
- The critical role of c and φ in ensuring stability: A study on rockfill dams
- Evidence of late quaternary activity of the Weining-Shuicheng Fault in Guizhou, China
- Extreme hydroclimatic events and response of vegetation in the eastern QTP since 10 ka
- Spatial–temporal effect of sea–land gradient on landscape pattern and ecological risk in the coastal zone: A case study of Dalian City
- Study on the influence mechanism of land use on carbon storage under multiple scenarios: A case study of Wenzhou
- A new method for identifying reservoir fluid properties based on well logging data: A case study from PL block of Bohai Bay Basin, North China
- Comparison between thermal models across the Middle Magdalena Valley, Eastern Cordillera, and Eastern Llanos basins in Colombia
- Mineralogical and elemental analysis of Kazakh coals from three mines: Preliminary insights from mode of occurrence to environmental impacts
- Chlorite-induced porosity evolution in multi-source tight sandstone reservoirs: A case study of the Shaximiao Formation in western Sichuan Basin
- Predicting stability factors for rotational failures in earth slopes and embankments using artificial intelligence techniques
- Origin of Late Cretaceous A-type granitoids in South China: Response to the rollback and retreat of the Paleo-Pacific plate
- Modification of dolomitization on reservoir spaces in reef–shoal complex: A case study of Permian Changxing Formation, Sichuan Basin, SW China
- Geological characteristics of the Daduhe gold belt, western Sichuan, China: Implications for exploration
- Rock physics model for deep coal-bed methane reservoir based on equivalent medium theory: A case study of Carboniferous-Permian in Eastern Ordos Basin
- Enhancing the total-field magnetic anomaly using the normalized source strength
- Shear wave velocity profiling of Riyadh City, Saudi Arabia, utilizing the multi-channel analysis of surface waves method
- Effect of coal facies on pore structure heterogeneity of coal measures: Quantitative characterization and comparative study
- Inversion method of organic matter content of different types of soils in black soil area based on hyperspectral indices
- Detection of seepage zones in artificial levees: A case study at the Körös River, Hungary
- Tight sandstone fluid detection technology based on multi-wave seismic data
- Characteristics and control techniques of soft rock tunnel lining cracks in high geo-stress environments: Case study of Wushaoling tunnel group
- Influence of pore structure characteristics on the Permian Shan-1 reservoir in Longdong, Southwest Ordos Basin, China
- Study on sedimentary model of Shanxi Formation – Lower Shihezi Formation in Da 17 well area of Daniudi gas field, Ordos Basin
- Multi-scenario territorial spatial simulation and dynamic changes: A case study of Jilin Province in China from 1985 to 2030
- Review Articles
- Major ascidian species with negative impacts on bivalve aquaculture: Current knowledge and future research aims
- Prediction and assessment of meteorological drought in southwest China using long short-term memory model
- Communication
- Essential questions in earth and geosciences according to large language models
- Erratum
- Erratum to “Random forest and artificial neural network-based tsunami forests classification using data fusion of Sentinel-2 and Airbus Vision-1 satellites: A case study of Garhi Chandan, Pakistan”
- Special Issue: Natural Resources and Environmental Risks: Towards a Sustainable Future - Part I
- Spatial-temporal and trend analysis of traffic accidents in AP Vojvodina (North Serbia)
- Exploring environmental awareness, knowledge, and safety: A comparative study among students in Montenegro and North Macedonia
- Determinants influencing tourists’ willingness to visit Türkiye – Impact of earthquake hazards on Serbian visitors’ preferences
- Application of remote sensing in monitoring land degradation: A case study of Stanari municipality (Bosnia and Herzegovina)
- Optimizing agricultural land use: A GIS-based assessment of suitability in the Sana River Basin, Bosnia and Herzegovina
- Assessing risk-prone areas in the Kratovska Reka catchment (North Macedonia) by integrating advanced geospatial analytics and flash flood potential index
- Analysis of the intensity of erosive processes and state of vegetation cover in the zone of influence of the Kolubara Mining Basin
- GIS-based spatial modeling of landslide susceptibility using BWM-LSI: A case study – city of Smederevo (Serbia)
- Geospatial modeling of wildfire susceptibility on a national scale in Montenegro: A comparative evaluation of F-AHP and FR methodologies
- Geosite assessment as the first step for the development of canyoning activities in North Montenegro
- Urban geoheritage and degradation risk assessment of the Sokograd fortress (Sokobanja, Eastern Serbia)
- Multi-hazard modeling of erosion and landslide susceptibility at the national scale in the example of North Macedonia
- Understanding seismic hazard resilience in Montenegro: A qualitative analysis of community preparedness and response capabilities
- Forest soil CO2 emission in Quercus robur level II monitoring site
- Characterization of glomalin proteins in soil: A potential indicator of erosion intensity
- Power of Terroir: Case study of Grašac at the Fruška Gora wine region (North Serbia)
- Special Issue: Geospatial and Environmental Dynamics - Part I
- Qualitative insights into cultural heritage protection in Serbia: Addressing legal and institutional gaps for disaster risk resilience