A method for fast detection of wind farms from remote sensing images using deep learning and geospatial analysis
-
 ,
,

Abstract
The wind power industry is increasing worldwide every year. Thus, obtaining timely and detailed information on wind farms’ number and spatial distribution is critical for quantitatively estimating wind energy utilization and for planning the construction of new wind farms. Therefore, this study proposes a method for quickly identifying wind farms in a large-scale area. Given that wind farms mainly comprise individual objects such as wind turbines and substations, we labeled sample images of wind turbines and substations on a global scale. Then, these sample images are used to train a target recognition model and an object classification model and detect the specific locations of wind turbines and substations in the study area. Additionally, we deeply analyzed the location features of the wind turbines and further improved the recognition accuracy based on these known features using geographic constraints. Based on the location information of wind turbines and substations, a clustering model organizes them effectively into complete wind farms. A comprehensive evaluation of the clustering model verifies its scientific validity and reliability. Specifically, this framework was systematically tested throughout Vietnam with remarkable results, using high-resolution historical images provided by Google Earth. Indeed, our framework achieved 90.45% recall and 95.73% accuracy for wind turbines and 81.37% recall and 78.96% accuracy for substations. Finally, we successfully obtained the spatial location and distribution of 15 completed wind farms, demonstrating that the proposed scheme can quickly and accurately identify wind power plants in a large-scale area, which supports wind power management and energy utilization planning.
1 Introduction
With the proposal of a carbon neutrality goal and the growing global energy demand, wind energy, as a clean and harmless renewable energy source, is increasingly emphasized by countries worldwide for its natural green and low carbon emission characteristics [1,2,3]. As of 2022, the global total installed capacity of wind energy is 906 GW, adding 78 GW compared to 2021, a year-on-year growth of 9%, with this growth rate expected to grow [4]. Therefore, obtaining timely information on the number and spatial distribution of wind turbines will provide important data to support governments in formulating sustainable energy policies, making investment decisions, and protecting the environment and climate. Such information will help promote the development of the renewable energy sector and reduce the dependence on fossil fuels, thus contributing to achieve sustainability goals regarding energy and the environment. Nevertheless, the spatial distribution of wind farms is challenging to obtain promptly due to their short construction period [5]. Due to the rapid growth rate of installed wind energy capacity, the use of manual surveys is not only laborious but also inefficient. Therefore, the development of an automatic and fast method for detecting wind turbines is urgently needed.
With the continuous development of remote sensing technology, extracting targets from remotely sensed images is possible [6], providing valuable and timely information about wind farms’ spatial and spectral attributes to support detection and monitoring tasks. Wind farms mainly comprise wind turbines, so the main goal is to identify wind turbines. Chen and Yue used a traditional FM saliency detection method for better extracting the regions of interest of windmill targets in the early stage of network training while removing irrelevant salient regions in the image to reduce the degree of interference of background information on the model. This method obtained high accuracy and recall [7]. Mandroux et al. developed an automated wind turbine detector based on an inverse method for low-resolution satellite images, utilizing wind turbine shadows and hub geometry [8]. Manso-Callejo et al. introduced a two-iteration generation based on a semantic segmentation model for wind turbine detection [9]. There are few studies on the identification and distribution of wind turbines over a wide area using remote sensing images, which employ a single remote sensing object identification method. Given that wind turbines belong to the targets in the wide-area range, in recent years, wide-area object detection has been applied to targets such as airplanes, dams, and solar photovoltaic panels [10,11,12]. For detecting targets from a wide area range, most researchers extract candidate regions for target detection [13]. For instance, Zeng et al. used a global land cover dataset to reduce the possible areas of airport candidate regions to 0.56% of the total area [14]. Fang et al. successfully applied the ResNet-50 model, which is based on a convolutional neural network framework, to achieve high accuracy (91.45%) in global-scale reservoir identification in Landsat 8 imagery [15]. Yu et al. developed the DeepSolar deep learning framework for recognizing the location and size of solar photovoltaic (PV) panels and constructed a high-fidelity solar deployment database [16]. Balaniuk et al. trained a full convolutional neural network on Google Colab using the Google Earth Engine platform and the TensorFlow 2 API to automatically identify and classify open pit mines and mine tailings dams across Brazil. Some scholars have used spatial analysis and image classification models to extract candidate regions [17]. For example, Li et al. relied on spatial analysis and the ResNet-101 model to detect unknown airports efficiently and accurately over a wide range [18,19]. Candidate region extraction methods have effective results in narrowing the search area and improving the search speed for large-range object detection.
In recent years, with the rapid development of deep learning methods in artificial intelligence, especially in computer vision, high-resolution remote sensing image analysis has ushered in a new opportunity. Compared with traditional machine learning methods, deep learning based on convolutional neural networks (CNNs) [20] has excellent feature extraction capability and accuracy. This makes deep learning methods show great potential for application in land use classification, object recognition, and object extraction at the regional scale. At the same time, considering the characteristics of blurred target features in remote sensing images and the background complexity, most researchers employ deep learning methods and achieve better accuracy and robustness. While CNN-based object detection has not been extensively applied to identify wind turbines, it has proven successful in various other object recognition tasks within remote sensing. Notable applications include detecting buildings, vehicles, airports, dams, and precision agriculture [21,22,23,24,25]. Hu et al. proposed a new DAGL-Faster algorithm (Adaptive Globally-Locally Aligned Faster R-CNN), which enhances the detection of vehicles in rainy weather [26]. Qi et al. tested the TripleSAT dataset by utilizing the single-stage detection model RetinaNet to detect storage tanks and airplanes in the dataset [27,28]. Their test results showed that RetinaNet had an average accuracy of 96.55 and 92.80% on storage tanks and airplanes, respectively.
Due to the background complexity of a remote sensing image, false detections are inevitable using deep learning methods. Thus, post-processing after detection must be improved to increase the object detection accuracy. Sun and Wu successfully applied a geospatial analysis approach for dam detection, which effectively reduced the number of false detections by 50%, resulting in a 9% improvement in recognition accuracy from 78.6 to 87.6%. The recall rate decreased slightly by 0.5% from 87 to 86.5% [29]. Spatial analysis using geographic data can help us analyze objects’ characteristics on the ground and their relationships, solve complex positioning problems, and provide new perspectives for decision-making.
This study develops a wind farm detection framework that combines remote sensing object recognition and GIS spatial analysis to extract wind farms from high-resolution remote sensing images from a large area perspective. The objectives are: (1) Combine the detection and classification models from deep learning to give the best model. (2) Combine the deep learning model with geospatial analysis to further optimize the detection results from deep learning. The above study provides data support for researchers to assess regional wind energy utilization and plan the layout of future Wind Farms. Meanwhile, the proposed method provides fast, automatic, low-cost wind farm regulation detection, especially in areas where economic conditions hinder ground-based monitoring.
2 Materials and methods
2.1 Research area
This study uses the whole area of Vietnam (latitude 8°10′–23°24′N, longitude 102°09′–109°30′E), which covers an area of 329,556 km2 (Figure 1). The main reason for choosing Vietnam as the study area is because it has a 3,000 km long coastline with relatively rich wind energy resources, with average annual wind speeds of up to 8.0 m/s or more in some areas. Additionally, 8.6% of the country’s land area is suitable for wind power generation, including the inland area and sea islands [30]. According to the World Bank, the theoretical reserves of wind energy resources in Vietnam are 2,099 GW, of which areas such as central, south-central, and southern Vietnam have great potential for development, especially in Ninh Thuan and Binh Thuan provinces. In recent years, Vietnam’s new energy sector has been developing rapidly, and the National Strategy for Green Growth 2021–2030 Toward 2050, published by the Vietnamese government, has set a target of 15–20% renewable energy share of total energy supply by 2025 [31]. In addition, we obtained administrative boundary vector data for the study area from the Global Administrative Boundaries Database. Mean wind speed data for the study area at a height of 50 m were obtained from the Global Wind Atlas, a dataset that covers the entire decadal period from 2008 to 2017. The European Space Agency provided us with 10 m resolution land use data, which contains 11 different land use types. We also obtained 30 m resolution digital elevation model (DEM) data for the study area from the U.S. Geological Survey. OpenStreetMap (OSM) data were obtained from OSM and Google tile data (17 levels) covering the study area were obtained totaling 4.6 million from Google Maps. Detailed data sources and data forms can be found in Table 1.
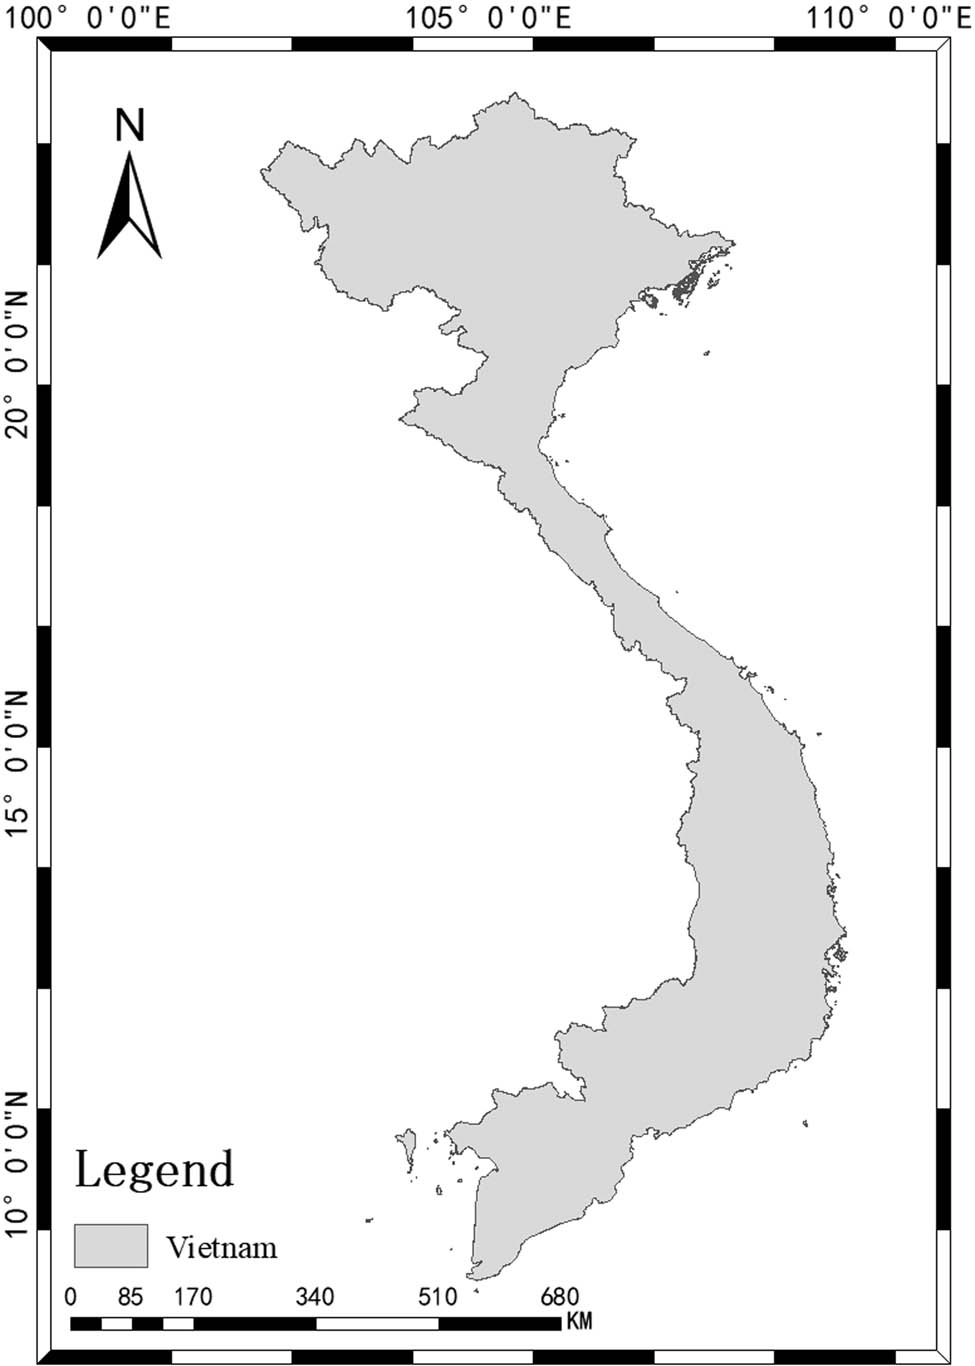
Experimental study area in Vietnam.
Data sources
| Datasets | Spatial resolution (m) | Time | Sources | URL |
|---|---|---|---|---|
| Windspeed | 10 | 2008–2017 | Global wind atlas | https://globalwindatlas.info/en |
| World cover | 10 | 2020 | European space agency | https://viewer.esa-worldcover.org/worldcover/ |
| SRTM1 | 30 | 2022 | United States geological survey | https://www.usgs.gov/ |
| Tiles | 1.2 (level 17) | 2023 | Google Earth | http://mt1.google.com/vt/lyrs=s&hl=zh-CN&x={}&y={}&z={}&s=Gali |
| Administrative boundaries | — | — | GADM organization | https://gadm.org/ |
| OSM | — | 2023 | OSM | https://www.openstreetmap.org |
2.2 Method
Figure 2 presents the proposed research framework, which is divided into three main parts: (1) Constructing remote sensing sample dataset, (2) wind turbine facility identification model construction, and (3) geospatial analysis and clustering of model detection results. It is worth noting that the resolution of the tile image is usually 256 × 256, and when the spatial resolution is high, each tile’s field of view range is small. In order to expand the field of view of the image and facilitate the subsequent validation work, we stitched the 17 levels of tiles in the study area according to a 3 × 3 size. This way, the spliced image has a wider field of view, reducing the original 4.6 million images to 510,000 and improving the model’s processing efficiency.

Wind farm detection framework.
2.2.1 Constructing remote sensing sample dataset
In order to construct the proposed model, we used the QGIS (https://qgis.org/) software to annotate 2,000 wind turbine samples and 500 substation samples as well as 1,000 background images without wind turbines and substations globally, as shown in Figure 3 (annotated samples) and Figure 4 (global distribution). After the labeling was completed, the labeled boxes were exported to a GeoJson format file, and the images containing the location of each labeled box were downloaded according to the labeled file for model training. These images were divided into a training, validation, and test set based on a 6:2:2 ratio, limited by the number of labeled samples. Note that the samples must be augmented to train a model to enhance its generalization ability. Using the image processing method to transform the sample images into geometric space and color space can enrich the sample types and expand the size of the sample set. Table 2 presents the specific transformation method. Through the expansion, we increase the original data to 10 times the original.
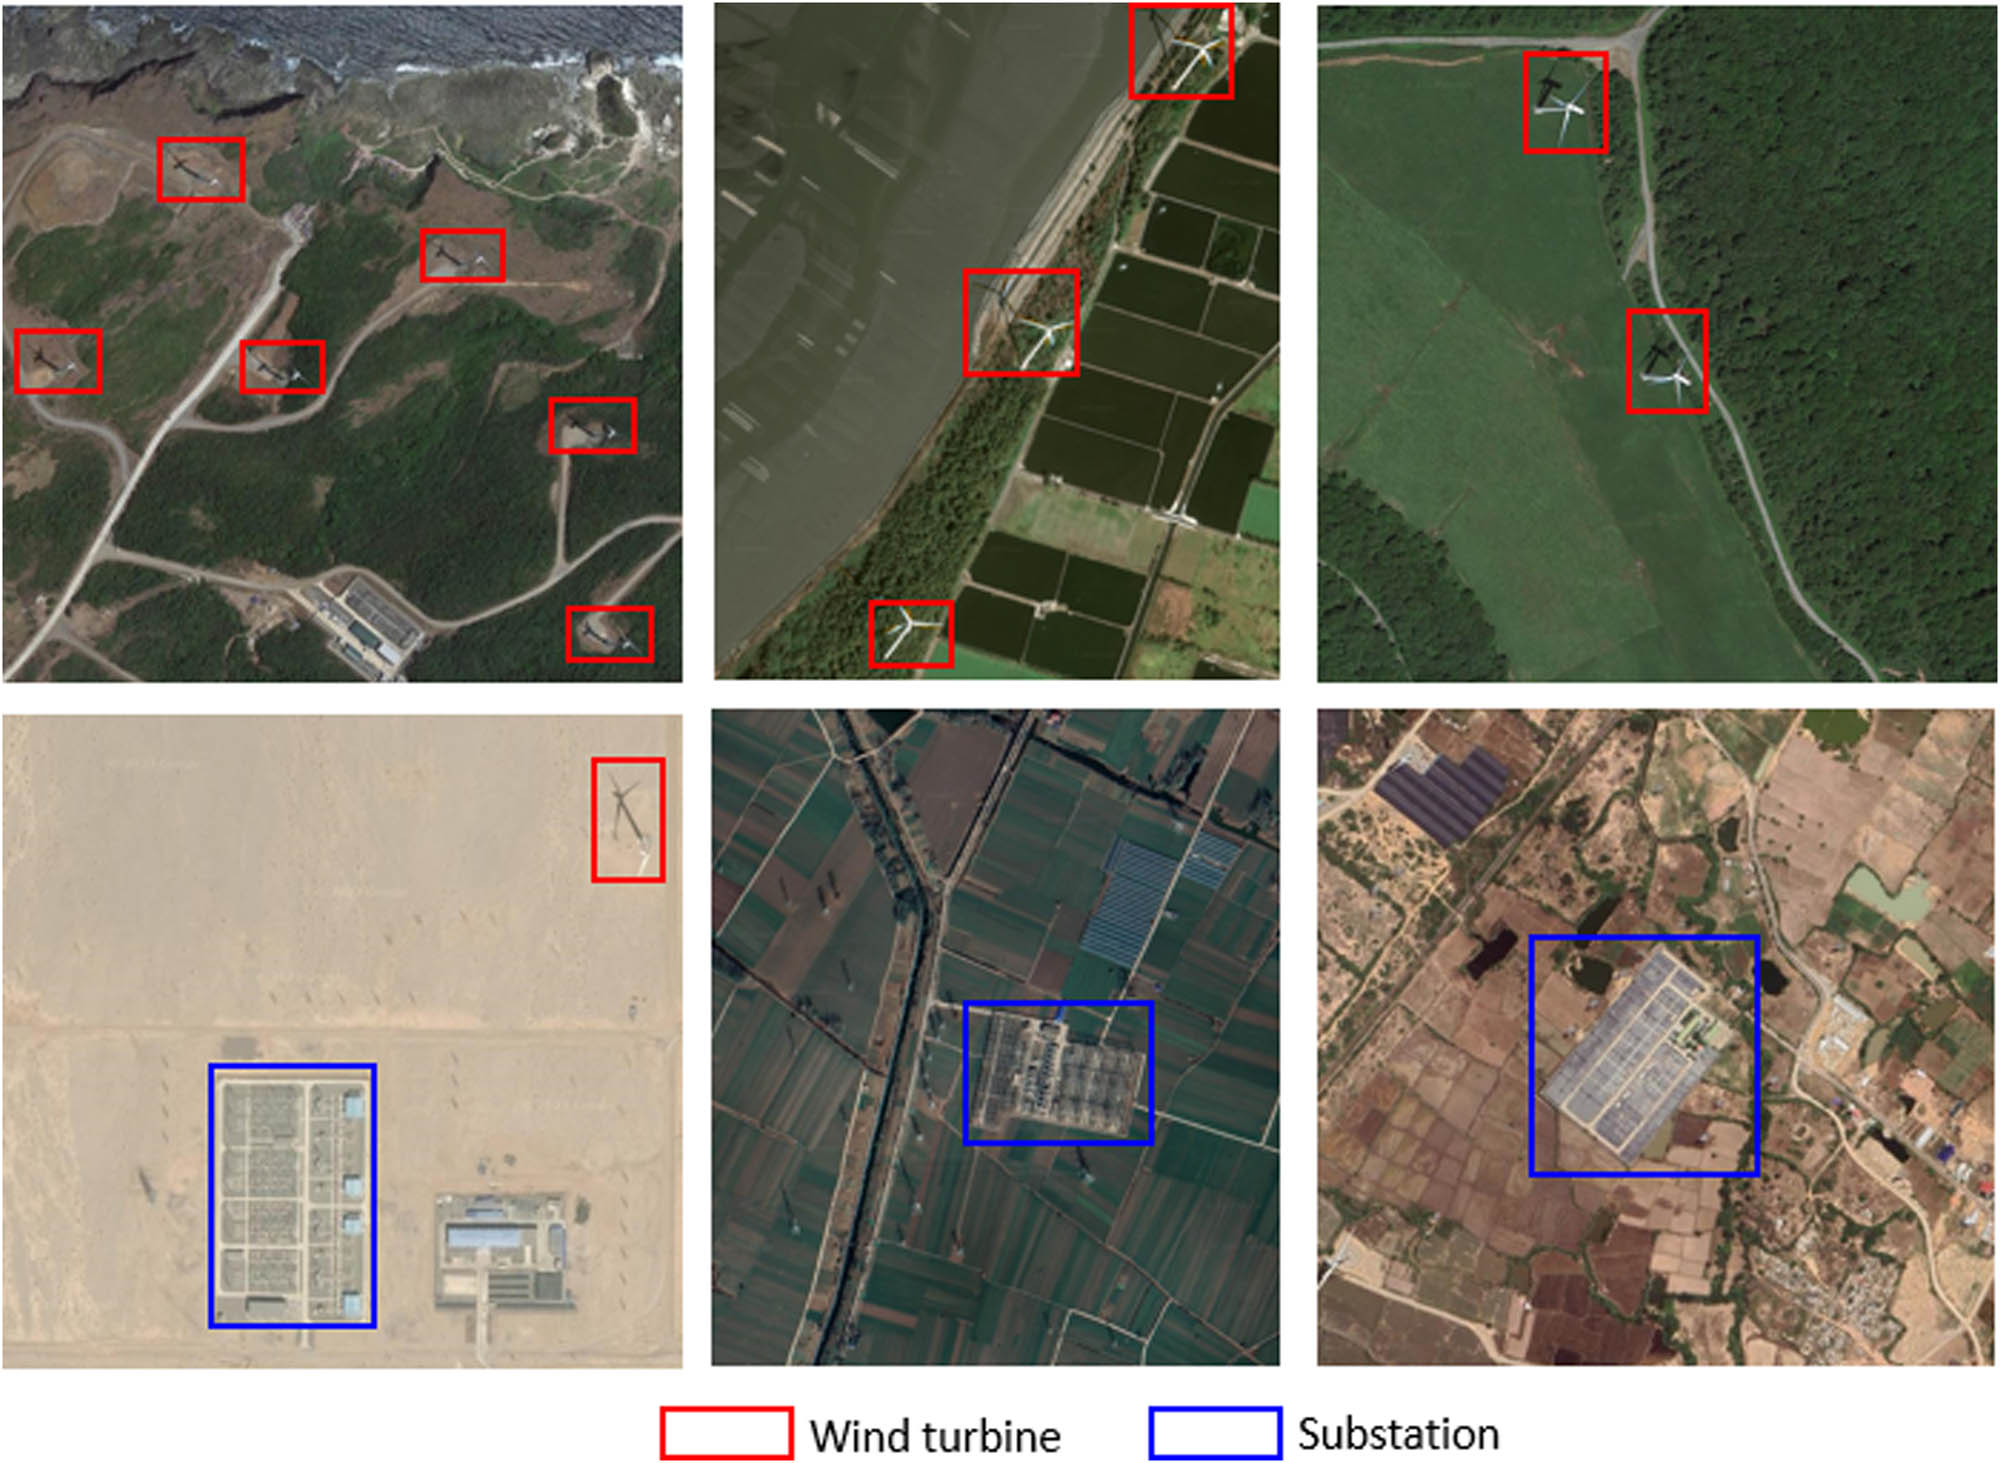
Sample annotations for wind power facility samples.

Sample distribution of wind power facilities.
Image augmentation methods
| Type | Method | Parameters | Multiplier |
|---|---|---|---|
| Rotating | 30°, 60°, 90° | 3 | |
| Geometric augmentation | Flip | Vertical direction | 2 |
| Zoom | 40, 80% | 2 | |
| Brightness value | Random 0.5–1.5 times | 1 | |
| Color augmentation | Contrast ratio | Random 0.5–1.5 times | 1 |
| Gaussian noise | — | 1 | |
| Figure | 10 |
2.2.2 Wind turbine facility identification model construction
At present, deep learning based target detection methods are mainly divided into four categories based on region proposal, object regression, anchor-free, and transformer. We selected typical methods in each category to train our detection model.
First, in the region proposal based method, we used Faster R-CNN [32] to train our model. Faster R-CNN extracts features from remote sensing images by CNN and introduces a region proposal network (RPN) to generate candidate target frames. The RPN extracts candidate frames on the image by sliding windows, calculates the probability that each frame contains a target, and then passes these candidate frames to the classifier and bounding box regressor for further processing.
Second, in the transformer-based method, we chose DETR [33] to train our model. The DETR model adopts the transformer architecture, which transforms the object detection task into an ensemble prediction problem, discarding the steps of anchor frames and non-maximum suppression that are traditionally used in object detection. the architecture of DETR consists of an encoder and a decoder, which, through the mechanism of attention, can effectively capture the global contextual information of the image, providing an end-to-end solution for remote sensing object recognition.
In the anchor-free based method, we choose Centernet [34] to train our model. Centernet discards the practice of presetting a large number of anchors in traditional object detection by directly predicting the centroid, width, and height of the bounding box, and the category of the object. The detector needs to use non-maximal suppression (NMS) to remove redundant bounding boxes in the post-processing stage, making the model not strictly end-to-end trained in the inference stage.
For the object regression based method, we chose YOLOv5 [35] to train our model. YOLOv5 is a real-time object detection model that directly predicts multiple objects in an image through a single forward propagation. The introduction of multi-scale detection and the use of CSPDarknet53 as the backbone network improve the learning ability of the model. Mosaic data enhancement techniques and lightweight design allow for better generalization while maintaining high accuracy.
Object detection over a large area usually produces a large number of false detections, so we use an object classification model to process the results of the detection model to improve the accuracy of the detection. We chose the EfficientNet [36] model, which was proposed by Google in 2019, to achieve more efficient model design through composite tuning of depth, width, and resolution. Using depth-separable convolution, efficient modules, and AutoML techniques, EfficientNet achieves superior performance in image classification tasks while reducing the number of parameters and computational cost.
In order to evaluate the effectiveness of our model training, we used accuracy and recall as the evaluation metrics, defined as follows:
where R represents the recall rate, P is the accuracy rate, TP denotes the number of wind turbines or substations correctly recognized by the model, FP is the number of false detections, N is the number of all wind turbines or substations detected, and FN is the number of missed detections.
All models were trained and validated on a workstation equipped with an Intel Core i9-9900K processor and an NVIDIA GeForce RTX 2080Ti graphics card with 32 GB of RAM and a 1.8 TB solid state drive. Table 3 provides some key parameters during model training and validation.
Hyperparameters for model training
| Model | Faster R-CNN | DETR | CenterNet | YOLOv5 | EfficientNet |
|---|---|---|---|---|---|
| Backbone | ResNet50 | ResNet50 | Hourglass | CSPDarknet-53 | MBConv |
| Batch size | 16 | 16 | 16 | 16 | 8 |
| Learning rate | 0.01 | 0.01 | 0.01 | 0.01 | 0.001 |
| Learning rate decay | 0.0001 | 0.0001 | 0.0001 | 0.0001 | 0.00001 |
| Optimizer | SGD | SGD | SGD | SGD | SGD |
| Momentum | 0.9 | 0.9 | 0.9 | 0.9 | 0.9 |
| Epoch | 200 | 200 | 200 | 200 | 200 |
2.2.3 Geospatial analysis
The aim of introducing geospatial analysis is to optimize the detection results further. Thus, we converted the pixel coordinates of the detection frame of the deep learning model into geographic coordinates to obtain the spatial location of the detection results. This process involves four key steps:
Based on the wind farm siting criteria and the actual construction situation [37], we determined the land cover types of the wind turbine and substation construction sites. Specifically, we defined woodland, shrubs, grassland, cropland, bare ground/sparse vegetation, and moss/lichen as potential wind farm construction areas based on the ESA land cover criteria. We obtained the potential wind farm areas in the study area by eliminating the ineligible land cover types.
From the DEM data of the study area, we calculated the slope of the entire area. Following wind farm construction standards, we determined the maximum construction slope to be 6°. To ensure the robustness of the results, we selected 10° as the maximum construction slope, thus excluding non-compliant areas and obtaining potential wind farm areas.
Based on the information on nature reserves and residential areas in the OSM data of the study area, we further screened out the areas that meet the criteria for wind power plant construction.
Wind speed is one of the important factors for wind farm construction. Only areas with abundant wind resources are suitable for constructing wind power plants. Based on the annual average wind speed data of the study area, we excluded the areas with annual average wind speed less than 3 m/s as shown in Figure 5 to get the potential wind farm areas.
The results obtained from the above analysis are vector data, so the potential wind farm areas in the whole study area can be obtained by superimposing these results. The model detection results were vectorially superimposed with the spatial analysis results, and those detection box locations that did not intersect with the spatial analysis results were considered erroneous detection results. All geospatial analyses were conducted in the World Geodetic System -1984 (WGS_1984).

Areas with wind speeds greater than 3 m/s at 50 m height in the study area.
2.2.4 Clustering model and evaluation metrics
Clustering aims to correlate the detected single group of wind turbines, thus forming a wind farm. This section employs Density-based spatial clustering of applications with noise (DBSCAN) [38], which is a density-based clustering algorithm that finds data points with sufficient density, divides them into clusters, and efficiently handles noisy data points. Unlike traditional clustering algorithms (e.g., K-means), DBSCAN does not require the number of clusters to be determined and can discover clusters automatically. The algorithm is based on two important parameters: the radius ε (epsilon) and the minimum number of data points (MinPts). DBSCAN starts from a core point and explores the data points in its ε-neighborhood, and a cluster is formed if at least MinPts data points are found in the ε-neighborhood. By scanning all data points step by step, DBSCAN categorizes the data points into core, boundary, and noise points to form independent clusters. This feature makes DBSCAN perform well in dealing with datasets with noise and anomalies, and it is more advantageous in discovering clusters of irregular shape and size. Figure 6 illustrates the schematic diagram of the DBSCAN algorithm.

DBSCAN algorithm schematic.
In order to evaluate the clustering results of the DBSCAN algorithm more intuitively, we evaluate our clustering model using the Silhouette Score [39].
The silhouette coefficient is the most widely used evaluation parameter in classification algorithms. The silhouette coefficients of the sample points are calculated as shown in equation (3).
where
In equation (4),
The range of the silhouette coefficients is (−1, 1), where a value closer to 1 means that the sample is very similar to a sample in this cluster and not to a sample in another cluster. The silhouette coefficient is negative if the sample point is more similar to a sample outside the cluster. Otherwise, the contour coefficient is 0, which means that the samples in the two clusters are equally similar, and thus, the two clusters should be combined.
Since a wind farm contains more than one wind turbine, we set the minimum number of neighbors (MinPts) to 2. To determine the appropriate neighbor radius (ε), we select four sets of distances according to the equal spacing, which are 5, 10, 15, and 20 km, respectively. Calculating the contour coefficients, we obtain the clustering effect under different ε values, as reported in Table 4. Specifically, the contour coefficient is 0.7726 when ε is 5 km. As ε increases to 10 km, the contour coefficient improves to 0.8559, which indicates that the clustering effect is better at 10 km compared to 5 km. However, when ε is further increased to 15 and 20 km, the contour coefficient remains at 0.8559, implying that the clustering effect is similar in both cases. Considering the clustering effect and computational cost, we set ε = 10 km as the final neighbor radius. This adjustment considers the contour coefficients at different neighbor radii to ensure our clustering parameters achieve better clustering effects while maintaining efficiency.
Silhouette coefficient scores for different distance thresholds
| MinPts | Epsilon | Silhouette score |
|---|---|---|
| 2 | 5 | 0.7726 |
| 10 | 0.8559 | |
| 15 | 0.8559 | |
| 20 | 0.8559 |
3 Results
3.1 Model detection of wind power facilities
We enhanced the divided dataset according to the image enhancement method described in Section 2.2.1. The obtained training images include 12,000 wind turbines and 8,000 validation images, as well as 3,000 training images and 2,000 validation images of substations. These augmented datasets were used to train, validate, and test the models presented in Section 2.2.2. Table 5 presents the metrics of the model on the test set, revealing that YOLOv5l is the best model. Therefore, we selected YOLOv5l as the benchmark model for the recognition model.
Model validation index
| Model | Objective type | Precision (%) | Recall (%) |
|---|---|---|---|
| Faster R-CNN | Wind turbine | 55.4 | 83.2 |
| Substation | 60.3 | 71.2 | |
| DETR | Wind turbine | 83.6 | 93.7 |
| Substation | 78.4 | 85.1 | |
| CenterNet | Wind turbine | 96.8 | 90.5 |
| Substation | 82.7 | 89.6 | |
| YOLOv5l | Wind turbine | 96.2 | 95.5 |
| Substation | 75.8 | 95.3 |
Additionally, we prepared 6,000 background images for classification model training and 4,000 background images for classification model validation. We applied the wind turbine and substation sample images to the YOLOv5l model for training. Simultaneously, we used the wind turbine, substation, and background images to train the classification model, with Figures 7 and 8 illustrating the loss curves of the detection model based on YOLOv5l and EfficientNetB4.
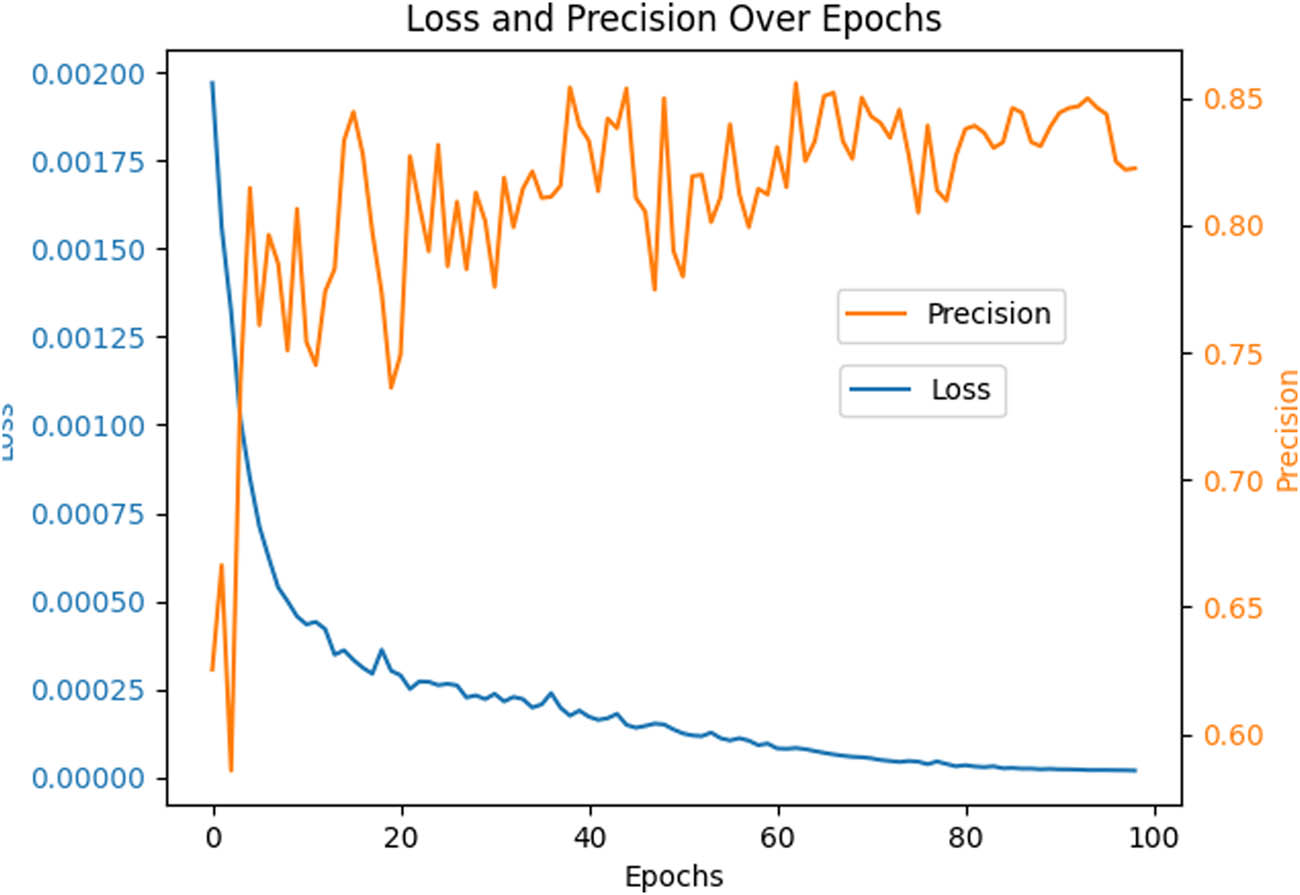
Training loss and accuracy based on YOLOv5l.

Training loss and accuracy based on EfficientNetB4.
First, we applied the detection model to the study area and obtained 4,278 detection frames for wind turbines and 5,263 for substations. Through visual interpretation, we successfully recalled 204 wind turbines and 2,731 substations. However, there were also 14 missing wind turbines and 289 missing substations. Figure 9 illustrates some unrecalled wind turbines and substations (within the green box, the ones not recalled due to incomplete target information, and within the red box, those not recalled due to insufficient training samples). In this phase, the recall rates for wind turbines and substations are 92.72 and 83.75%, respectively, and the recall rate is calculated as the ratio of the number of wind turbines correctly detected by the model to the number of wind turbines in the OSM visual search dataset. The accuracy rates for wind turbines and substations were 11.31 and 51.89%, respectively, and were calculated as the ratio of the number of wind turbines correctly identified by the model to the number of frames identified.

Model missed detection (green boxes indicate misses due to insufficient feature learning, and blue boxes indicate misses due to incomplete goals).
Subsequently, we input the recognition results from the detection model into the classification model, in which we acquired 471 wind turbines and 4,156 substations. Among them, the recall rates of wind turbines and substations were 90.45 and 81.37%, respectively. The main reason for the slight decrease in model recall after classification is that some correctly identified results were misclassified. However, the accuracy rates for wind turbines and substations were 90.22 and 78.96%, respectively, highlighting that although the classification model loses some performance in terms of recall, it improves tremendously in terms of recognition accuracy.
3.2 Geospatial analysis
Since substations are not a feature element specific to wind farms, we only considered wind turbines for the geospatial analysis. Based on the thresholds set in Section 2.2.3, we obtained the potential wind turbines in the study area, and through geospatial analysis, we finally retained 465 wind turbines. However, we also noted instances where we mistakenly deleted six groups of wind turbines, which mainly stemmed from the lack of precision in the land use data due to deleting those wind turbines closer to water bodies. Therefore, more precise data should improve our identification accuracy.
The entire study area covers 331,700 km2. In our proposed framework, we successfully recalled 199 sets of wind turbines. Although 220 wind turbines and one substation are recorded in the OSM dataset, our framework discovered 266 sets of wind turbines that were not recorded in the OSM dataset. Overall, the wind turbines were identified with a recall rate of 90.45%, and the accuracy increased from 90.45 to 95.73%. The whole detection process required 18 h, suggesting that the proposed framework can quickly and accurately update the construction of wind turbines in a large area. Furthermore, this demonstrates that the developed method improves the accuracy of wind turbine identification and provides more accurate data support for wind farm planning.
3.3 Spatial clustering
A wind farm is a power station comprising a group of wind turbines or a cluster [40], where the most critical building blocks include wind turbines and substations. Our identification framework successfully determined the geospatial locations of wind turbines and substations in the study area. Subsequently, we applied the DBSCAN clustering algorithm to cluster individual wind turbines and grouped the spatially similar wind turbines into one category. Wind turbines in the same category were grouped into the same wind farm. Then, we converted the point elements of the same category into face elements and kept the substations that intersected the face elements. This operation allowed the otherwise scattered wind turbines and substations to form a complete wind power plant. Through this clustering method, we identified 15 completed wind farms in the study area, with their distribution illustrated in Figure 10. The cluster analysis results present the distribution range of wind farms, which provides more accurate data support for land use planning and environmental assessment. This method clarifies the boundaries of wind farms and provides a more reliable basis for related decisions.

Results of the proposed framework detection.
4 Discussion
4.1 Application of classification model
The aim of this study is to detect as many wind turbines and substations as possible. Therefore, in the detection model, the confidence threshold was set to 0.4 (i.e., the score of the detection frame is retained if it is greater than the confidence level). However, this also resulted in more non-wind turbines being incorrectly detected. Figure 11 illustrates some of the misidentified objects, such as (a)-1 misidentifying a turnoff on a road as a wind turbine, (a)-2 misidentifying a high voltage tower as a wind turbine, (a)-3 misidentifying an airplane as a wind turbine, (b)-1 mis-detecting the roof of a building as a wind turbine, (b)-2 misidentifying a piece of farmland as a wind turbine, and (b)-3 misidentifying a solar PV panel as a wind turbine. In order to reduce the number of misidentifications, we introduced a classification model based on EfficientNetB4 to classify objects into three categories: wind turbines, substations, and others. Our experiments demonstrated that the recognition efficiency and accuracy can be improved by further processing the detection results using the classification model. Using YOLOv5l for detection in more areas extends the classification model samples and improves accuracy.

False detection results: a(1), a(2), and a(3) false detection for wind turbine, and b(1), b(2), and b(3) false detection for substation.
Previous studies have focused on the characteristics of the network structure to improve the model’s accuracy by improving the network structure. However, these studies are often limited to small-scale regions and do not consider the diversity of inland object species and the complexity of backgrounds in large-scale regions. Hence, we introduced a classification model to increase recognition accuracy in large-scale regions. Although this reduced recall, the recognition accuracy significantly improved. Nevertheless, this approach is suitable for recognition tasks dealing with large-scale regions. In future research, the improved model will be integrated into the present framework for higher precision detection, aiming to improve its performance and adapt it to more complex real-world application scenarios.
4.2 Geospatial analysis results
Based on the wind farm siting and construction criteria [41], we processed the acquired wind speed data, land use data, and OSM data to form potential wind turbine regions under various threshold constraints. Among these potential areas, we obtained the final wind turbine locations and conducted cluster analysis based on their locations in the geospatial space to obtain 15 completed wind farms. A detailed record of the number of wind turbines and the number of substations contained in each wind farm are reported in Table 6, which highlights that each wind farm contains at least two wind turbines and one substation, which is consistent with the actual construction situation and again verifies the accuracy of our framework. The existence of multiple substations in some wind farms is because each substation can aggregate and step up the power generated by the wind turbines in the vicinity, thus shortening the transmission lines and reducing line losses. By counting the results of the geospatial analysis, we found that the geospatial analysis improved the accuracy of wind turbine identification by 5.51%. At the same time, it should be noted that the validity of geospatial analysis depends largely on the accuracy of geographic data. Therefore, higher resolution and more accurate products such as DEM and land cover can further enhance our method’s credibility. It is worth special attention that geospatial analysis is influenced by various inter-regional economic, cultural, and geographic factors that shape the topography and landscape and directly relate to the construction and distribution of wind farms. Therefore, when applying the proposed geospatial analysis method, it is imperative to fully consider these multiple factors to accurately capture the identification accuracy of wind turbines in different regions.
Detailed statistics of wind farm identification results
| Wind farm number | Central longitude | Central latitude | Area (km2) | Number of wind turbines (group) | Number of substations (unit) |
|---|---|---|---|---|---|
| 1 | 105.80 | 9.22 | 5.42 | 52 | 1 |
| 2 | 106.11 | 9.37 | 36.65 | 39 | 1 |
| 3 | 106.45 | 9.53 | 1.32 | 6 | 1 |
| 4 | 108.01 | 10.84 | 0.61 | 5 | 1 |
| 5 | 108.36 | 11.04 | 43.97 | 37 | 3 |
| 6 | 108.68 | 11.21 | 3.20 | 38 | 3 |
| 7 | 108.93 | 11.45 | 43.99 | 67 | 8 |
| 8 | 109.04 | 11.69 | 22.15 | 69 | 6 |
| 9 | 108.56 | 11.88 | 1.61 | 12 | 1 |
| 10 | 108.22 | 13.09 | 124.81 | 57 | 3 |
| 11 | 108.09 | 13.49 | 17.46 | 25 | 1 |
| 12 | 109.26 | 13.87 | 10.52 | 27 | 4 |
| 13 | 107.92 | 13.93 | 2.62 | 7 | 1 |
| 14 | 106.77 | 16.71 | 1.89 | 22 | 1 |
| 15 | 108.70 | 13.98 | 0.64 | 2 | 1 |
| Total | 465 | 36 |
Note: The center longitude and center latitude indicate the center of mass of the polygon surrounded by all wind turbines in each wind farm.
4.3 Comparison with other research
In this study, a wind farm detection framework based on deep learning and geospatial analysis is proposed. Chen et al. utilized the modified YOLOv3 model for wind turbine detection, which has an accuracy of 95% and a recall of 94% on the test set [42]. However, they have not yet applied the method to real geographic scenarios. We applied the proposed framework to the whole Vietnam land area and achieved 90.45% recall and 95.73% accuracy. Also, our detection framework found wind farms that were not recorded in the dataset, providing a strong addition to the data update. Putra and Wijayanto [43] implemented automatic palm tree detection based on Microsoft Bing Maps using YOLOv3, and the model achieved an accuracy and recall of 86.39 and 96.40%, respectively, on the test set. However, the model only estimated palm trees in the study area, but did not count its accuracy and recall in real scenarios. Due to the diverse components of wind farms, the detection of wind farms is more complex compared to the detection of a single palm tree. Therefore, we added geospatial constraints to the detection results of the deep learning model to improve the accuracy of wind turbine detection by 5.51%. Jing et al. used deep learning and geospatial analysis to achieve dam detection in three regions of Japan, and the accuracy and recall of the detection results of this method in the three regions were 80.0 and 91.06%, respectively [13]. However, the dam detection is performed in the water system, while the wind farm detection is performed in the land area. Due to the high similarity between the geometry of wind turbines and land features such as high voltage towers, more false detection results may occur in the land area. To solve this problem, we introduce a target classification model in the deep learning detection phase, which improves the accuracy of wind turbine and substation detection results by 79.14 and 27.07%, respectively.
4.4 Limitations of the proposed framework
As a promising method for analyzing remote sensing images, deep learning provides a wide range of research possibilities. Hence, this study combined target detection techniques with spatial analysis to explore the distribution of wind farms over a large area. However, despite the significant potential of our proposed framework, there are some limitations. Indeed, during the identification process, our framework may miss some small wind turbines, mainly because we did not fully consider the characteristics of small wind turbines in our sample set. Meanwhile, our sample data are mainly set in the context of land areas, ignoring identifying offshore wind turbines. In future research, we will consider incorporating the improved algorithm into our framework to identify offshore wind farms accurately.
5 Conclusion
The main motivation for this study stems from the fact that current research on wind farm detection on a large regional scale is relatively limited. Previous studies have focused on wind farm siting planning and the wind turbines themselves, with little in-depth exploration of the distribution characteristics of wind farms on a large regional scale. Spurred by these limitations, this study integrated convolutional neural network and spatial analysis, aiming to detect wind farms quickly and accurately from high-resolution remote sensing images.
The main steps of this research method are as follows: (1) On a global scale, we labeled the samples using QGIS software and performed the augmentation and generalization process according to the sample features. (2) In the training and application phase of the deep learning model, we combined the detection and the classification models to obtain preliminary detection results. Combining these two models improved the detection accuracy of wind turbines and substations by 78.91 and 27.07%, respectively. (3) We converted the detection results to geographic coordinates and combined them with geographic information data for comprehensive analysis, further improving the detection accuracy. Through cluster analysis, we obtained spatial distribution information from 15 completed wind power plants. Additionally, our method could detect and supplement newly built wind turbines not recorded in the dataset.
Future studies will extend this method to a global scale to enable a wider range of wind farm detection and further deepen our understanding of the distribution characteristics of wind farms on a large regional scale.
-
Funding information: This study was financially supported by National Natural Science Foundation of China (No. 42301517 and No. 41601497).
-
Author contributions: Chen Ji, Qizhi Zhuang and Liang Cheng: editing data curation, Supervision. Deliang Chen, Taotao Cheng: writing-original draft preparation. Yanyan Lu, Jianbo Xiao and Siyu Hong: conceived the experiment. Taotao Cheng: analysed the results. All authors reviewed the manuscript.
-
Conflict of interest: Authors state no conflict of interest.
-
Data availability statement: The datasets generated during and/or analysed during the current study are available from the corresponding author on reasonable request.
References
[1] Shoaib M, Siddiqui I, Rehman S, Khan S, Alhems LM. Assessment of wind energy potential using wind energy conversion system. J Clean Prod. 2019;216:346–60.10.1016/j.jclepro.2019.01.128Search in Google Scholar
[2] Zhuo C, Junhong G, Wei L, Fei Z, Chan X, Zhangrong P. Changes in wind energy potential over China using a regional climate model ensemble. Renew Sustain Energy Rev. 2022;159:112219.10.1016/j.rser.2022.112219Search in Google Scholar
[3] Jung C, Schindler D. On the influence of wind speed model resolution on the global technical wind energy potential. Renew Sustain Energy Rev. 2022;156:112001.10.1016/j.rser.2021.112001Search in Google Scholar
[4] Wiser R, Bolinger M, Hoen B, Millstein D, Rand J, Barbose G, et al. Land-Based Wind Market Report: 2023 Edition: Lawrence Berkeley National Laboratory (LBNL), Berkeley, CA (United States); 2023.10.2172/1996790Search in Google Scholar
[5] Hoeser T, Kuenzer C. SyntEO: Synthetic dataset generation for earth observation and deep learning–Demonstrated for offshore wind farm detection. ISPRS J Photogramm Remote Sens. 2022;189:163–84.10.1016/j.isprsjprs.2022.04.029Search in Google Scholar
[6] Li K, Wan G, Cheng G, Meng L, Han J. Object detection in optical remote sensing images: A survey and a new benchmark. ISPRS J Photogramm Remote Sens. 2020;159:296–307.10.1016/j.isprsjprs.2019.11.023Search in Google Scholar
[7] Chen J, Yue A. Wind turbine extraction from high spatial resolution remote sensing images based on saliency detection. J Appl Remote Sens. 2018;12:016041.10.1117/1.JRS.12.016041Search in Google Scholar
[8] Mandroux N, Dagobert T, Drouyer S, Von Gioi RG. Wind turbine detection on sentinel-2 images. 2021 IEEE International Geoscience and Remote Sensing Symposium IGARSS. IEEE; 2021. p. 4888–91.10.1109/IGARSS47720.2021.9554578Search in Google Scholar
[9] Manso-Callejo M-Á, Cira C-I, Garrido RPA, Matesanz FJG. First dataset of wind turbine data created at national level with deep learning techniques from aerial orthophotographs with a spatial resolution of 0.5 m/pixel. IEEE J Sel Top Appl Earth Observ Remote Sens. 2021;14:7968–80.10.1109/JSTARS.2021.3101934Search in Google Scholar
[10] Liu Q, Xiang X, Wang Y, Luo Z, Fang F. Aircraft detection in remote sensing image based on corner clustering and deep learning. Eng Appl Artif Intell. 2020;87:103333.10.1016/j.engappai.2019.103333Search in Google Scholar
[11] Sun L, Guo H, Chen Z, Yin Z, Feng H, Wu S, et al. Check dam extraction from remote sensing images using deep learning and geospatial analysis: A case study in the Yanhe River Basin of the Loess Plateau, China. J Arid Land. 2023;15:34–51.10.1007/s40333-023-0091-7Search in Google Scholar
[12] Henry C, Poudel S, Lee S-W, Jeong H. Automatic detection system of deteriorated PV modules using drone with thermal camera. Appl Sci. 2020;10:3802.10.3390/app10113802Search in Google Scholar
[13] Jing M, Cheng L, Ji C, Mao J, Li N, Duan Z, et al. Detecting unknown dams from high-resolution remote sensing images: A deep learning and spatial analysis approach. Int J Appl Earth Observ Geoinf. 2021;104:102576.10.1016/j.jag.2021.102576Search in Google Scholar
[14] Zeng F, Cheng L, Li N, Xia N, Ma L, Zhou X, et al. A hierarchical airport detection method using spatial analysis and deep learning. Remote Sens. 2019;11:2204.10.3390/rs11192204Search in Google Scholar
[15] Fang W, Wang C, Chen X, Wan W, Li H, Zhu S, et al. Recognizing global reservoirs from Landsat 8 images: A deep learning approach. IEEE J Sel Top Appl Earth Observ Remote Sens. 2019;12:3168–77.10.1109/JSTARS.2019.2929601Search in Google Scholar
[16] Yu J, Wang Z, Majumdar A, Rajagopal R. DeepSolar: A machine learning framework to efficiently construct a solar deployment database in the United States. Joule. 2018;2:2605–17.10.1016/j.joule.2018.11.021Search in Google Scholar
[17] Balaniuk R, Isupova O, Reece S. Mining and tailings dam detection in satellite imagery using deep learning; 2020. arXiv 2020. arXiv preprint arXiv:200701076.Search in Google Scholar
[18] Li N, Cheng L, Huang L, Ji C, Jing M, Duan Z, et al. Framework for unknown airport detection in broad areas supported by deep learning and geographic analysis. IEEE J Sel Top Appl Earth Observ Remote Sens. 2021;14:6328–38.10.1109/JSTARS.2021.3088911Search in Google Scholar
[19] He K, Zhang X, Ren S, Sun J. Deep residual learning for image recognition. Proceedings of the IEEE Conference on Computer Vision and Pattern Recognition; 2016. p. 770–8.10.1109/CVPR.2016.90Search in Google Scholar
[20] Long J, Shelhamer E, Darrell T. Fully convolutional networks for semantic segmentation. Proceedings of the IEEE Conference on Computer Vision and Pattern Recognition; 2015. p. 3431–40.10.1109/CVPR.2015.7298965Search in Google Scholar
[21] Perez H, Tah JH, Mosavi A. Deep learning for detecting building defects using convolutional neural networks. Sensors. 2019;19:3556.10.3390/s19163556Search in Google Scholar PubMed PubMed Central
[22] Srivastava S, Narayan S, Mittal S. A survey of deep learning techniques for vehicle detection from UAV images. J Syst Archit. 2021;117:102152.10.1016/j.sysarc.2021.102152Search in Google Scholar
[23] Li S, Xu Y, Zhu M, Ma S, Tang H. Remote sensing airport detection based on end-to-end deep transferable convolutional neural networks. IEEE Geosci Remote Sens Lett. 2019;16:1640–4.10.1109/LGRS.2019.2904076Search in Google Scholar
[24] Balaniuk R, Isupova O, Reece S. Mining and tailings dam detection in satellite imagery using deep learning. Sensors. 2020;20:6936.10.3390/s20236936Search in Google Scholar PubMed PubMed Central
[25] Zheng Y-Y, Kong J-L, Jin X-B, Wang X-Y, Su T-L, Zuo M. CropDeep: The crop vision dataset for deep-learning-based classification and detection in precision agriculture. Sensors. 2019;19:1058.10.3390/s19051058Search in Google Scholar PubMed PubMed Central
[26] Hu M, Wu Y, Yang Y, Fan J, Jing B. DAGL-Faster: Domain adaptive faster r-cnn for vehicle object detection in rainy and foggy weather conditions. Displays. 2023;79:102484.10.1016/j.displa.2023.102484Search in Google Scholar
[27] Qi W. Object detection in high resolution optical image based on deep learning technique. Nat Hazards Res. 2022;2:384–92.10.1016/j.nhres.2022.10.002Search in Google Scholar
[28] Lin T-Y, Goyal P, Girshick R, He K, Dollár P. Focal loss for dense object detection. Proceedings of the IEEE International Conference on Computer Vision; 2017. p. 2980–8.10.1109/ICCV.2017.324Search in Google Scholar
[29] Sun P, Wu Y. Dynamic modeling framework of sediment trapped by check-dam networks: A case study of a typical watershed on the Chinese Loess Plateau. Engineering. 2022;16:176–86.10.1016/j.eng.2021.05.010Search in Google Scholar PubMed PubMed Central
[30] Luong ND. A critical review on potential and current status of wind energy in Vietnam. Renew Sustain Energy Rev. 2015;43:440–8.10.1016/j.rser.2014.11.060Search in Google Scholar
[31] Nguyen PA, Abbott M, Nguyen TLT. The development and cost of renewable energy resources in Vietnam. Uti Policy. 2019;57:59–66.10.1016/j.jup.2019.01.009Search in Google Scholar
[32] Girshick R. Fast r-cnn. Proceedings of the IEEE International Conference on Computer Vision; 2015. p. 1440–8.10.1109/ICCV.2015.169Search in Google Scholar
[33] Carion N, Massa F, Synnaeve G, Usunier N, Kirillov A, Zagoruyko S. End-to-end object detection with transformers. European Conference on Computer Vision. Springer; 2020. p. 213–29.10.1007/978-3-030-58452-8_13Search in Google Scholar
[34] Duan K, Bai S, Xie L, Qi H, Huang Q, Tian Q. CenterNet: Keypoint triplets for object detection. Proceedings of the IEEE/CVF International Conference on Computer Vision; 2019. p. 6569–78.10.1109/ICCV.2019.00667Search in Google Scholar
[35] Redmon J, Divvala S, Girshick R, Farhadi A. You only look once: Unified, real-time object detection. Proceedings of the IEEE Conference on Computer Vision and Pattern Recognition; 2016. p. 779–88.10.1109/CVPR.2016.91Search in Google Scholar
[36] Tan M, Le Q. EfficientNet: Rethinking model scaling for convolutional neural networks. International Conference on Machine Learning. PMLR; 2019. p. 6105–14.Search in Google Scholar
[37] Cetinay H, Kuipers FA, Guven AN. Optimal siting and sizing of wind farms. Renew Energy. 2017;101:51–8.10.1016/j.renene.2016.08.008Search in Google Scholar
[38] Zhang X, Chen Y, Jia J, Kuang K, Lan Y, Wu C. Multi-view density-based field-road classification for agricultural machinery: DBSCAN and object detection. Computers Electron Agric. 2022;200:107263.10.1016/j.compag.2022.107263Search in Google Scholar
[39] Punhani A, Faujdar N, Mishra KK, Subramanian M. Binning-based silhouette approach to find the optimal cluster using K-means. IEEE Access. 2022;10:115025–32.10.1109/ACCESS.2022.3215568Search in Google Scholar
[40] Jung C, Schindler D. Efficiency and effectiveness of global onshore wind energy utilization. Energy Convers Manag. 2023;280:116788.10.1016/j.enconman.2023.116788Search in Google Scholar
[41] Xu Y, Li Y, Zheng L, Cui L, Li S, Li W, et al. Site selection of wind farms using GIS and multi-criteria decision making method in Wafangdian, China. Energy. 2020;207:118222.10.1016/j.energy.2020.118222Search in Google Scholar
[42] Chen J, Chen JB, Meng Y, Deng Y, Jie Y, Zhang Y. Detection of wind turbine towers in remote sensing based on YOLOv3 model under scale and density constraints. Remote Sens Nat Resour. 2021;33.Search in Google Scholar
[43] Putra YC, Wijayanto AW. Automatic detection and counting of oil palm trees using remote sensing and object-based deep learning. Remote Sens Applic Soc Environ. 2023;29:100914.10.1016/j.rsase.2022.100914Search in Google Scholar
© 2024 the author(s), published by De Gruyter
This work is licensed under the Creative Commons Attribution 4.0 International License.
Articles in the same Issue
- Regular Articles
- Theoretical magnetotelluric response of stratiform earth consisting of alternative homogeneous and transitional layers
- The research of common drought indexes for the application to the drought monitoring in the region of Jin Sha river
- Evolutionary game analysis of government, businesses, and consumers in high-standard farmland low-carbon construction
- On the use of low-frequency passive seismic as a direct hydrocarbon indicator: A case study at Banyubang oil field, Indonesia
- Water transportation planning in connection with extreme weather conditions; case study – Port of Novi Sad, Serbia
- Zircon U–Pb ages of the Paleozoic volcaniclastic strata in the Junggar Basin, NW China
- Monitoring of mangrove forests vegetation based on optical versus microwave data: A case study western coast of Saudi Arabia
- Microfacies analysis of marine shale: A case study of the shales of the Wufeng–Longmaxi formation in the western Chongqing, Sichuan Basin, China
- Multisource remote sensing image fusion processing in plateau seismic region feature information extraction and application analysis – An example of the Menyuan Ms6.9 earthquake on January 8, 2022
- Identification of magnetic mineralogy and paleo-flow direction of the Miocene-quaternary volcanic products in the north of Lake Van, Eastern Turkey
- Impact of fully rotating steel casing bored pile on adjacent tunnels
- Adolescents’ consumption intentions toward leisure tourism in high-risk leisure environments in riverine areas
- Petrogenesis of Jurassic granitic rocks in South China Block: Implications for events related to subduction of Paleo-Pacific plate
- Differences in urban daytime and night block vitality based on mobile phone signaling data: A case study of Kunming’s urban district
- Random forest and artificial neural network-based tsunami forests classification using data fusion of Sentinel-2 and Airbus Vision-1 satellites: A case study of Garhi Chandan, Pakistan
- Integrated geophysical approach for detection and size-geometry characterization of a multiscale karst system in carbonate units, semiarid Brazil
- Spatial and temporal changes in ecosystem services value and analysis of driving factors in the Yangtze River Delta Region
- Deep fault sliding rates for Ka-Ping block of Xinjiang based on repeating earthquakes
- Improved deep learning segmentation of outdoor point clouds with different sampling strategies and using intensities
- Platform margin belt structure and sedimentation characteristics of Changxing Formation reefs on both sides of the Kaijiang-Liangping trough, eastern Sichuan Basin, China
- Enhancing attapulgite and cement-modified loess for effective landfill lining: A study on seepage prevention and Cu/Pb ion adsorption
- Flood risk assessment, a case study in an arid environment of Southeast Morocco
- Lower limits of physical properties and classification evaluation criteria of the tight reservoir in the Ahe Formation in the Dibei Area of the Kuqa depression
- Evaluation of Viaducts’ contribution to road network accessibility in the Yunnan–Guizhou area based on the node deletion method
- Permian tectonic switch of the southern Central Asian Orogenic Belt: Constraints from magmatism in the southern Alxa region, NW China
- Element geochemical differences in lower Cambrian black shales with hydrothermal sedimentation in the Yangtze block, South China
- Three-dimensional finite-memory quasi-Newton inversion of the magnetotelluric based on unstructured grids
- Obliquity-paced summer monsoon from the Shilou red clay section on the eastern Chinese Loess Plateau
- Classification and logging identification of reservoir space near the upper Ordovician pinch-out line in Tahe Oilfield
- Ultra-deep channel sand body target recognition method based on improved deep learning under UAV cluster
- New formula to determine flyrock distance on sedimentary rocks with low strength
- Assessing the ecological security of tourism in Northeast China
- Effective reservoir identification and sweet spot prediction in Chang 8 Member tight oil reservoirs in Huanjiang area, Ordos Basin
- Detecting heterogeneity of spatial accessibility to sports facilities for adolescents at fine scale: A case study in Changsha, China
- Effects of freeze–thaw cycles on soil nutrients by soft rock and sand remodeling
- Vibration prediction with a method based on the absorption property of blast-induced seismic waves: A case study
- A new look at the geodynamic development of the Ediacaran–early Cambrian forearc basalts of the Tannuola-Khamsara Island Arc (Central Asia, Russia): Conclusions from geological, geochemical, and Nd-isotope data
- Spatio-temporal analysis of the driving factors of urban land use expansion in China: A study of the Yangtze River Delta region
- Selection of Euler deconvolution solutions using the enhanced horizontal gradient and stable vertical differentiation
- Phase change of the Ordovician hydrocarbon in the Tarim Basin: A case study from the Halahatang–Shunbei area
- Using interpretative structure model and analytical network process for optimum site selection of airport locations in Delta Egypt
- Geochemistry of magnetite from Fe-skarn deposits along the central Loei Fold Belt, Thailand
- Functional typology of settlements in the Srem region, Serbia
- Hunger Games Search for the elucidation of gravity anomalies with application to geothermal energy investigations and volcanic activity studies
- Addressing incomplete tile phenomena in image tiling: Introducing the grid six-intersection model
- Evaluation and control model for resilience of water resource building system based on fuzzy comprehensive evaluation method and its application
- MIF and AHP methods for delineation of groundwater potential zones using remote sensing and GIS techniques in Tirunelveli, Tenkasi District, India
- New database for the estimation of dynamic coefficient of friction of snow
- Measuring urban growth dynamics: A study in Hue city, Vietnam
- Comparative models of support-vector machine, multilayer perceptron, and decision tree predication approaches for landslide susceptibility analysis
- Experimental study on the influence of clay content on the shear strength of silty soil and mechanism analysis
- Geosite assessment as a contribution to the sustainable development of Babušnica, Serbia
- Using fuzzy analytical hierarchy process for road transportation services management based on remote sensing and GIS technology
- Accumulation mechanism of multi-type unconventional oil and gas reservoirs in Northern China: Taking Hari Sag of the Yin’e Basin as an example
- TOC prediction of source rocks based on the convolutional neural network and logging curves – A case study of Pinghu Formation in Xihu Sag
- A method for fast detection of wind farms from remote sensing images using deep learning and geospatial analysis
- Spatial distribution and driving factors of karst rocky desertification in Southwest China based on GIS and geodetector
- Physicochemical and mineralogical composition studies of clays from Share and Tshonga areas, Northern Bida Basin, Nigeria: Implications for Geophagia
- Geochemical sedimentary records of eutrophication and environmental change in Chaohu Lake, East China
- Research progress of freeze–thaw rock using bibliometric analysis
- Mixed irrigation affects the composition and diversity of the soil bacterial community
- Examining the swelling potential of cohesive soils with high plasticity according to their index properties using GIS
- Geological genesis and identification of high-porosity and low-permeability sandstones in the Cretaceous Bashkirchik Formation, northern Tarim Basin
- Usability of PPGIS tools exemplified by geodiscussion – a tool for public participation in shaping public space
- Efficient development technology of Upper Paleozoic Lower Shihezi tight sandstone gas reservoir in northeastern Ordos Basin
- Assessment of soil resources of agricultural landscapes in Turkestan region of the Republic of Kazakhstan based on agrochemical indexes
- Evaluating the impact of DEM interpolation algorithms on relief index for soil resource management
- Petrogenetic relationship between plutonic and subvolcanic rocks in the Jurassic Shuikoushan complex, South China
- A novel workflow for shale lithology identification – A case study in the Gulong Depression, Songliao Basin, China
- Characteristics and main controlling factors of dolomite reservoirs in Fei-3 Member of Feixianguan Formation of Lower Triassic, Puguang area
- Impact of high-speed railway network on county-level accessibility and economic linkage in Jiangxi Province, China: A spatio-temporal data analysis
- Estimation model of wild fractional vegetation cover based on RGB vegetation index and its application
- Lithofacies, petrography, and geochemistry of the Lamphun oceanic plate stratigraphy: As a record of the subduction history of Paleo-Tethys in Chiang Mai-Chiang Rai Suture Zone of Thailand
- Structural features and tectonic activity of the Weihe Fault, central China
- Application of the wavelet transform and Hilbert–Huang transform in stratigraphic sequence division of Jurassic Shaximiao Formation in Southwest Sichuan Basin
- Structural detachment influences the shale gas preservation in the Wufeng-Longmaxi Formation, Northern Guizhou Province
- Distribution law of Chang 7 Member tight oil in the western Ordos Basin based on geological, logging and numerical simulation techniques
- Evaluation of alteration in the geothermal province west of Cappadocia, Türkiye: Mineralogical, petrographical, geochemical, and remote sensing data
- Numerical modeling of site response at large strains with simplified nonlinear models: Application to Lotung seismic array
- Quantitative characterization of granite failure intensity under dynamic disturbance from energy standpoint
- Characteristics of debris flow dynamics and prediction of the hazardous area in Bangou Village, Yanqing District, Beijing, China
- Rockfall mapping and susceptibility evaluation based on UAV high-resolution imagery and support vector machine method
- Statistical comparison analysis of different real-time kinematic methods for the development of photogrammetric products: CORS-RTK, CORS-RTK + PPK, RTK-DRTK2, and RTK + DRTK2 + GCP
- Hydrogeological mapping of fracture networks using earth observation data to improve rainfall–runoff modeling in arid mountains, Saudi Arabia
- Petrography and geochemistry of pegmatite and leucogranite of Ntega-Marangara area, Burundi, in relation to rare metal mineralisation
- Prediction of formation fracture pressure based on reinforcement learning and XGBoost
- Hazard zonation for potential earthquake-induced landslide in the eastern East Kunlun fault zone
- Monitoring water infiltration in multiple layers of sandstone coal mining model with cracks using ERT
- Study of the patterns of ice lake variation and the factors influencing these changes in the western Nyingchi area
- Productive conservation at the landslide prone area under the threat of rapid land cover changes
- Sedimentary processes and patterns in deposits corresponding to freshwater lake-facies of hyperpycnal flow – An experimental study based on flume depositional simulations
- Study on time-dependent injectability evaluation of mudstone considering the self-healing effect
- Detection of objects with diverse geometric shapes in GPR images using deep-learning methods
- Behavior of trace metals in sedimentary cores from marine and lacustrine environments in Algeria
- Spatiotemporal variation pattern and spatial coupling relationship between NDVI and LST in Mu Us Sandy Land
- Formation mechanism and oil-bearing properties of gravity flow sand body of Chang 63 sub-member of Yanchang Formation in Huaqing area, Ordos Basin
- Diagenesis of marine-continental transitional shale from the Upper Permian Longtan Formation in southern Sichuan Basin, China
- Vertical high-velocity structures and seismic activity in western Shandong Rise, China: Case study inspired by double-difference seismic tomography
- Spatial coupling relationship between metamorphic core complex and gold deposits: Constraints from geophysical electromagnetics
- Disparities in the geospatial allocation of public facilities from the perspective of living circles
- Research on spatial correlation structure of war heritage based on field theory. A case study of Jinzhai County, China
- Formation mechanisms of Qiaoba-Zhongdu Danxia landforms in southwestern Sichuan Province, China
- Magnetic data interpretation: Implication for structure and hydrocarbon potentiality at Delta Wadi Diit, Southeastern Egypt
- Deeply buried clastic rock diagenesis evolution mechanism of Dongdaohaizi sag in the center of Junggar fault basin, Northwest China
- Application of LS-RAPID to simulate the motion of two contrasting landslides triggered by earthquakes
- The new insight of tectonic setting in Sunda–Banda transition zone using tomography seismic. Case study: 7.1 M deep earthquake 29 August 2023
- The critical role of c and φ in ensuring stability: A study on rockfill dams
- Evidence of late quaternary activity of the Weining-Shuicheng Fault in Guizhou, China
- Extreme hydroclimatic events and response of vegetation in the eastern QTP since 10 ka
- Spatial–temporal effect of sea–land gradient on landscape pattern and ecological risk in the coastal zone: A case study of Dalian City
- Study on the influence mechanism of land use on carbon storage under multiple scenarios: A case study of Wenzhou
- A new method for identifying reservoir fluid properties based on well logging data: A case study from PL block of Bohai Bay Basin, North China
- Comparison between thermal models across the Middle Magdalena Valley, Eastern Cordillera, and Eastern Llanos basins in Colombia
- Mineralogical and elemental analysis of Kazakh coals from three mines: Preliminary insights from mode of occurrence to environmental impacts
- Chlorite-induced porosity evolution in multi-source tight sandstone reservoirs: A case study of the Shaximiao Formation in western Sichuan Basin
- Predicting stability factors for rotational failures in earth slopes and embankments using artificial intelligence techniques
- Origin of Late Cretaceous A-type granitoids in South China: Response to the rollback and retreat of the Paleo-Pacific plate
- Modification of dolomitization on reservoir spaces in reef–shoal complex: A case study of Permian Changxing Formation, Sichuan Basin, SW China
- Geological characteristics of the Daduhe gold belt, western Sichuan, China: Implications for exploration
- Rock physics model for deep coal-bed methane reservoir based on equivalent medium theory: A case study of Carboniferous-Permian in Eastern Ordos Basin
- Enhancing the total-field magnetic anomaly using the normalized source strength
- Shear wave velocity profiling of Riyadh City, Saudi Arabia, utilizing the multi-channel analysis of surface waves method
- Effect of coal facies on pore structure heterogeneity of coal measures: Quantitative characterization and comparative study
- Inversion method of organic matter content of different types of soils in black soil area based on hyperspectral indices
- Detection of seepage zones in artificial levees: A case study at the Körös River, Hungary
- Tight sandstone fluid detection technology based on multi-wave seismic data
- Characteristics and control techniques of soft rock tunnel lining cracks in high geo-stress environments: Case study of Wushaoling tunnel group
- Influence of pore structure characteristics on the Permian Shan-1 reservoir in Longdong, Southwest Ordos Basin, China
- Study on sedimentary model of Shanxi Formation – Lower Shihezi Formation in Da 17 well area of Daniudi gas field, Ordos Basin
- Multi-scenario territorial spatial simulation and dynamic changes: A case study of Jilin Province in China from 1985 to 2030
- Review Articles
- Major ascidian species with negative impacts on bivalve aquaculture: Current knowledge and future research aims
- Prediction and assessment of meteorological drought in southwest China using long short-term memory model
- Communication
- Essential questions in earth and geosciences according to large language models
- Erratum
- Erratum to “Random forest and artificial neural network-based tsunami forests classification using data fusion of Sentinel-2 and Airbus Vision-1 satellites: A case study of Garhi Chandan, Pakistan”
- Special Issue: Natural Resources and Environmental Risks: Towards a Sustainable Future - Part I
- Spatial-temporal and trend analysis of traffic accidents in AP Vojvodina (North Serbia)
- Exploring environmental awareness, knowledge, and safety: A comparative study among students in Montenegro and North Macedonia
- Determinants influencing tourists’ willingness to visit Türkiye – Impact of earthquake hazards on Serbian visitors’ preferences
- Application of remote sensing in monitoring land degradation: A case study of Stanari municipality (Bosnia and Herzegovina)
- Optimizing agricultural land use: A GIS-based assessment of suitability in the Sana River Basin, Bosnia and Herzegovina
- Assessing risk-prone areas in the Kratovska Reka catchment (North Macedonia) by integrating advanced geospatial analytics and flash flood potential index
- Analysis of the intensity of erosive processes and state of vegetation cover in the zone of influence of the Kolubara Mining Basin
- GIS-based spatial modeling of landslide susceptibility using BWM-LSI: A case study – city of Smederevo (Serbia)
- Geospatial modeling of wildfire susceptibility on a national scale in Montenegro: A comparative evaluation of F-AHP and FR methodologies
- Geosite assessment as the first step for the development of canyoning activities in North Montenegro
- Urban geoheritage and degradation risk assessment of the Sokograd fortress (Sokobanja, Eastern Serbia)
- Multi-hazard modeling of erosion and landslide susceptibility at the national scale in the example of North Macedonia
- Understanding seismic hazard resilience in Montenegro: A qualitative analysis of community preparedness and response capabilities
- Forest soil CO2 emission in Quercus robur level II monitoring site
- Characterization of glomalin proteins in soil: A potential indicator of erosion intensity
- Power of Terroir: Case study of Grašac at the Fruška Gora wine region (North Serbia)
- Special Issue: Geospatial and Environmental Dynamics - Part I
- Qualitative insights into cultural heritage protection in Serbia: Addressing legal and institutional gaps for disaster risk resilience