Spatial-temporal and trend analysis of traffic accidents in AP Vojvodina (North Serbia)
-
Emina Kričković
 ,
Tin Lukić
,
Tin Lukić

Abstract
The objective of this study is to analyse the spatial-temporal patterns of traffic accidents using data from 2011 to 2020 for the AP Vojvodina. The spatial-temporal patterns of traffic accident hotspots were identified at the municipality level using the Getis–Ord
List of abbreviations
- AP
-
Autonomous Province
- MK
-
Mann-Kendall
- RTSA
-
Road Traffic Safety Agency
- STA
-
Spatial-temporal analysis
1 Introduction
The growing trend of traffic accidents is considered a serious public health problem in most countries of the world [1,2,3]. The number of traffic accidents, the number of fatalities, as well as the number of people injured in traffic accidents is one of the crucial indicators of the health status of the population [4]. As a result of traffic accidents, very serious physical injuries occur where people are mainly restricted in carrying out their usual life activities and work [4]. Traffic accidents are caused by factors related to the road, vehicles, and the human factor. The human factor alone or in combination with other factors plays a significant role in over 90% of accidents [4,5].
The Global Status Report on Road Safety 2013 reveals that 1.24 million people lost their lives in road accidents worldwide in 2010 [6,7]. This number is deemed unacceptably high, particularly when considering the additional 50 million injuries reported annually [7,8]. Approximately 1.3 million people succumbed to road accidents, causing most countries to incur losses equivalent to 3% of their gross domestic product [9,10]. On a global scale, the number of deaths from road traffic crashes has seen a slight decrease from 2000 (19,099 per 100,000 population) to 2019 (16,714 per 100,000 population), representing a reduction of over 12% [10,11].
According to the Road Safety Annual Report 2022, among the members of the International Traffic Safety Data and Analysis Group, Norway had the lowest fatality rate in recent decades, with 1.5 deaths per 100,000 population in 2021 [12]. Three countries had a death rate above 10 – Chile (10.4), the United States (12.9), and Colombia (14.2) [12]. According to the same report, Serbia ranks fifth in the number of deaths per 100,000 population [12], which is a very serious public health problem. On the bar chart (Figure 1), a comparison of the countries with the highest number of road deaths per 100,000 inhabitants is presented.
![Figure 1
Road fatalities per 100,000 population, 2021. Source: [12], revised by authors.](/document/doi/10.1515/geo-2022-0630/asset/graphic/j_geo-2022-0630_fig_001.jpg)
Road fatalities per 100,000 population, 2021. Source: [12], revised by authors.
The trend of traffic fatalities in Malawi was investigated by Ngwira et al. using the MK statistic [13]. The same approach was used by Hossain et al. in the state of Louisiana to study the trend analysis of traffic accidents [14]. Peltzman gave one of the first examples of road safety analysis based on accident risk taking into account trends over time [15,16].
The spatio-temporal analysis makes a significant contribution when used in conjunction with spatial and statistical analysis for understanding change [17]. Spatial analysis of traffic accidents is of great importance in comprehending the conditions under which accidents occur, facilitating the planning of preventive activities at specific locations [18].
Cheng et al. proposed a comprehensive spatio-temporal analysis method integrating time-space cube analysis, spatial autocorrelation analysis, and emerging hotspot analysis to investigate the characteristics of traffic accident development and identify accident hotspots in Wujiang [19]. Hotspot analysis (Getis–Ord
In the Republic of Serbia, the number of road accidents recorded in 2020, with 492 traffic fatalities, is the lowest since the statistical monitoring and analysis of road accidents began in the Republic of Serbia [24]. According to the publication [24], there were 1,810 fatalities in road accidents in Serbia in 1981, 1,892 in 1991, 1,275 in 2001, and 731 in 2011. When comparing these figures with the situation in 2020, it is evident that the number of fatalities in road accidents in Serbia has significantly decreased compared to 1981. This decline in the number of fatalities is partly attributed to the implementation of new traffic regulations in 2009. Since that year, the Republic of Serbia has enacted more than ten laws or amendments to traffic laws and has adopted a strategy for road safety on the roads of the Republic of Serbia for the period from 2015 to 2020 [25,26].
On the territory of Serbia and the province of the Autonomous Province of Vojvodina (AP Vojvodina), there are only a few geographical studies on traffic accidents. Most previous studies have primarily focused on analysing the gender and age structure of fatalities in road accidents, the causes of fatal road accidents, and the type of vehicles involved in the accidents [10,27]. Jović Vraneš and Kosanović analysed road accidents in Serbia from 1999 to 2014 [27]. The authors examined the number of road accidents and casualties (deaths and injuries of road users), demographic characteristics, and the standard causes that led to accidents [27]. Petrović et al. analysed the changes in the number of traffic fatalities in the Republic of Serbia [28], and Lović-Obradović et al. determined the spatio-temporal variability of traffic accident mortality for the city of Belgrade [10]. Đurić and Miladinov-Mikov studied the epidemiological characteristics of road traffic accidents in the AP Vojvodina for the period 1992–2001 and found that the studied area had the highest rate of traffic fatalities per 10,000 vehicles in Europe during the mentioned period [5]. In the study "Temporal analysis of the traffic accidents occurrence in Province of Vojvodina,” Bačkalić cross-referenced the number of road accidents with traffic fatalities and injuries (period 2001–2009) from different time aspects and identified critical days and hours, as well as months and days [16]. Bačkalić et al. analysed the frequency of traffic accidents on rural roads in the territory of the AP Vojvodina from 2005 to 2011 [7], and Pljakić et al. analysed traffic zones in the city of Novi Sad, including accidents that occurred during the 3-year period (2015–2017) using
In the AP Vojvodina region, the number of registered vehicles has been consistently increasing. Data from the Chamber of Commerce of Vojvodina indicate that in 1990, there were 324,460 registered vehicles [31,32]. According to the Statistical Office of the Republic of Serbia, there were 700,468 registered vehicles in 2019 [33]. These figures highlight that the number of registered vehicles has more than doubled over three decades [32].
This study does not delve into the factors influencing the occurrence of traffic accidents in the AP Vojvodina territory due to the complexity of the overall process, requiring the involvement of numerous experts and organizations. The main objective of this study is to conduct a comprehensive spatio-temporal analysis of traffic accidents in the AP Vojvodina region to identify areas most susceptible to their frequent occurrence (from a geographer's perspective). Additionally, the study presents categories of participants in traffic accidents along with their characteristics, and analyses trends in the number of traffic accidents, injuries, and fatalities, respectively.
2 Methods
2.1 Study area
The AP Vojvodina (northern part of Serbia) is a geospatial entity with specific natural-geographic and social-economic features [4,34]. It is located in the northern part of the Republic of Serbia (Figure 2). It is situated between 44° 38′ and 46° 10′ north longitude and 18° 10′ and 21° 15′ east latitude, in south-eastern Europe, on the Balkan Peninsula and includes the southern part of the Pannonian Plain [4,34,35]. To the north lies the border with Hungary, to the east Romania, to the west it borders Croatia, while to the southwest it borders Bosnia and Herzegovina; to the south, the border is formed by the Sava and Danube rivers [4,36,37]. The studied area covers 21,506 km2 and accounts for 24.3% of the total area of the Republic of Serbia [4,34,38]. There are 45 municipalities and cities in the study area, together with the capital city of the province, Novi Sad [4].
![Figure 2
The road and railway network of the studied area and their position in Europe and Serbia. Source: [43], revised by authors.](/document/doi/10.1515/geo-2022-0630/asset/graphic/j_geo-2022-0630_fig_002.jpg)
The road and railway network of the studied area and their position in Europe and Serbia. Source: [43], revised by authors.
In 2022, the Republic Institute of Statistics recorded 1,740,230 inhabitants in the AP Vojvodina [39]. The relief of the AP Vojvodina is primarily flat, except for its mountainous regions which include Fruška Gora and Vršačke Planine. In addition to these isolated mountain ranges, the otherwise uniform lowlands are punctuated by sandstone formations, loess plains, and alluvial plains [4,37,40]. The climate in the study area is moderately continental, characterized by a wide range of extreme temperatures [4]. The mean maximum temperature in July is 21.4°C, while the mean minimum temperature in January is −1.3°C [4,41]. The mean annual air temperature is 11°C, resembling that of spring [4,41]. The region experiences varying winds in terms of intensity, direction, and duration throughout the year [4]. The prevailing winds are gentle, coming from the north and south [4,41]. The AP Vojvodina boasts abundant surface and underground water resources [4,42]. The rivers within the region are part of the Danube and Black Sea basins [4,37].
The study area is homogeneous in the physical-geographical sense but displays increasing dispersion from a social-geographical perspective. It is intricately connected to other parts of Serbia, particularly the Danube region, which, along with the Belgrade region and the influence of the Velika Morava, constitutes a pivotal area and the Danube itself serves as an axis of development [4,44]. Presently, the AP Vojvodina, alongside the Belgrade region, stands out as the most developed part of Serbia [42]. Major transportation routes, including the E-75 highway, railways, and air traffic corridors, traverse the study area [4,45].
The E-75 highway runs from Central Europe through Horgoš, Novi Sad, and onward to Belgrade [4]. It continues southeast towards Niš, with one branch leading east to the Bulgarian border and the other south towards Skopje and Thessaloniki [4,46]. As presented in Figure 2, the studied area boasts an extensive road network, with 1,620 km of main roads, 1,797 km of regional roads, and 3,021 km of local roads, totalling 6,468 km. Of these, 5,376 km have modern pavement, 128 km are paved, and 964 km are dirt roads [4,46].
The railway system is well-distributed and branched, with a crucial line connecting Vojvodina to Budapest via Novi Sad and Subotica, linking Central and Western Europe. Another line, through Belgrade, connects Vojvodina to Sofia and Istanbul in the east, as well as Athens in the south [4,45,46].
2.2 Dataset
For this research, we utilized statistical reports on traffic safety published by the Road Traffic Safety Agency (RTSA) of the Republic of Serbia from 2011 to 2020 [47,48,49,50,51,52,53,54,55,56,57,58,59,60,61,62,63,64,65,66,67,68,69,70,71,72,73,74,75,76,77,78,79,80,81,82,83,84,85,86,87,88,89,90,91,92,93,94,95,96,97,98,99,100,101,102,103,104,105,106,107,108,109,110,111,112,113,114,115,116,117,118,119,120,121,122,123,124,125,126,127,128,129,130,131,132,133,134]. These data, available on the RTSA’s official website, are open source. The publications “Analysis of the state of road safety for the period from 2011 to 2015 by local governments” and the corresponding analysis for the period from 2016 to 2020 for each municipality in the territory of the AP Vojvodina were consulted [47,48,49,50,51,52,53,54,55,56,57,58,59,60,61,62,63,64,65,66,67,68,69,70,71,72,73,74,75,76,77,78,79,80,81,82,83,84,85,86,87,88,89,90,91,92,93,94,95,96,97,98,99,100,101,102,103,104,105,106,107,108,109,110,111,112,113,114,115,116,117,118,119,120,121,122,123,124,125,126,127,128,129,130,131,132,133,134]. These reports included various analyses, and the study focused on the number of traffic accidents, fatalities, injuries, and the weighted number derived from them.
Administrative boundaries at the municipality, county, province, and state levels were obtained from the Eurostat official website in *.shp format, referenced in the WGS84 system [135]. Additional data, such as background maps, were downloaded from the open source repositories using GIS software [135]. Subsequently, the compiled data underwent a review, standardization, and unification process. All data were stored in ArcGIS Pro 3.0 software within the GIS database created specifically for this research. A schematic representation of this process is illustrated in Figure 3.
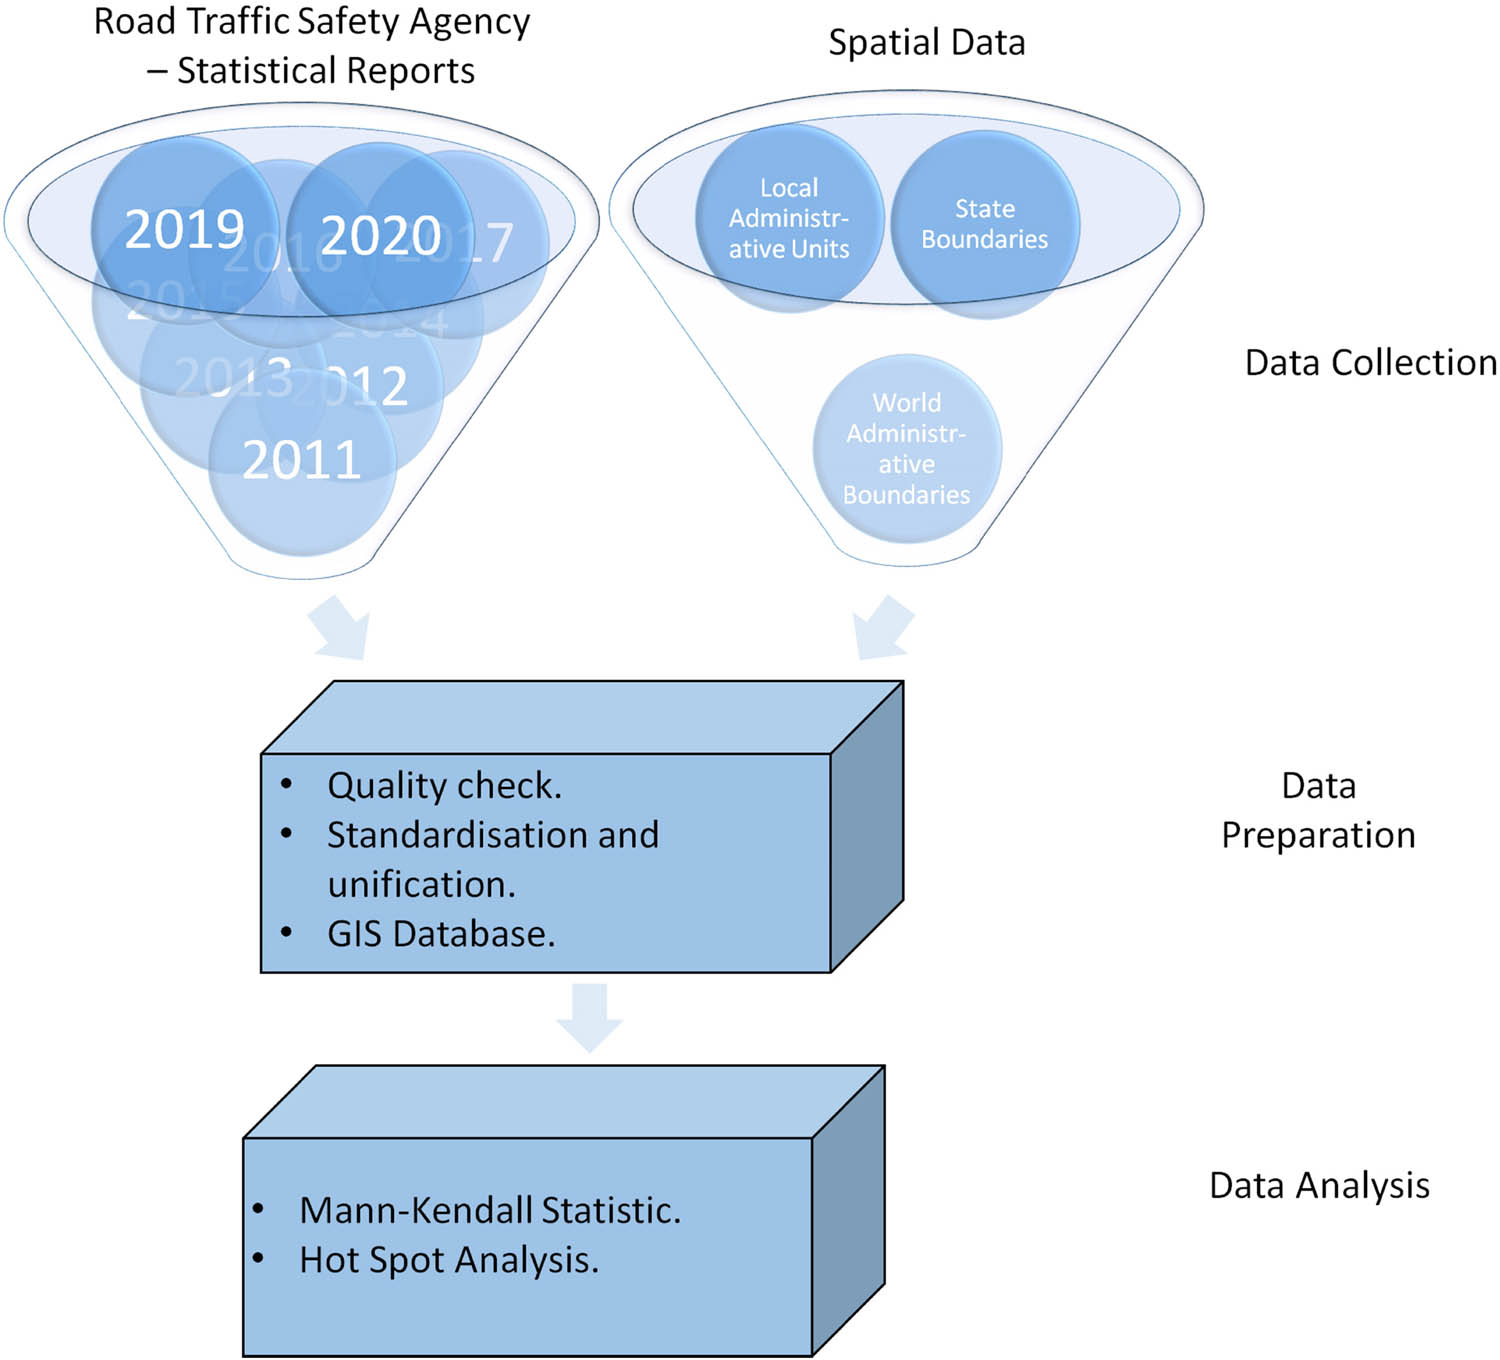
Schematic representation of the procedures carried out for this study.
2.3 Trend analysis
Before the conducted analysis of traffic safety hotspots in the AP Vojvodina, a MK statistic was applied to analyse any trends in the number of traffic accidents, fatalities, and injuries separately. The MK test can be applied in cases when it can be assumed that for the value of x i time series, the following model holds true [35,136]:
where sign (x i − x j ) is
The statistic S tends to normality for large n; with mean and variance defined as follows [34,126]:
where n is the length of the times-series, t P is the number of ties for the pth value and q is the number of tied values (i.e. equals values). The second term represents an adjustment for tied or censored data. The standardized test statistic Z is given by [35,136,137]
The presence of a statistically significant trend is evaluated using the Z value. This statistic is used to test the null hypothesis such that no trend exists [35,136]. A positive Z indicates an increasing trend in the time-series, while a negative Z indicates a decreasing trend [136]. To test either the increasing or decreasing monotonic trend at p significance level, the null hypothesis is rejected if the absolute value of Z is greater than Z (1-P/2); where Z (1-P/2) is obtained from standard normal cumulative distribution tables [35,136]. According to the MK test, two hypotheses were tested: the null hypothesis, H 0, that there is no trend in the time series; and the alternative hypothesis, H a, that there is a significant trend in the series, for a given significance level limit [136]. Probability, p, was calculated to determine the level of confidence in the hypothesis. If the computed value p is lower than the chosen significance level α (e.g. α = 5%), the H 0 (there is no trend) should be rejected, and the H a (there is a significant trend) should be accepted; and if p is greater than the significance level α, then the H 0 is accepted (or cannot be rejected) [35,136,138].
This test was performed in Python software using the pyMannKendall module. This module is a non-parametric MK trend analysis package implemented in pure Python, which brings together almost all types of MK tests. Currently, this package has 11 MK Tests and 2 Sen’s slope estimator functions [139]. In this research, the Original MK test was applied [136]. The Original MK test [137,138] is a non-parametric test, which does not consider serial correlation or seasonal effects [139]. The pyMannKendall module requests two or more parameters depending on the type of test. For the original MK test, two parameters were needed [139]. The first x is a vector which could be a python list, numPy array or pandas series, and the second alpha is a significance level, which in this case was a default value of 0.05 [139]. In this research, the first parameter was a Python dictionary with municipalities’ names as dictionary keys and a numPy array of numbers of traffic accidents, fatalities, and injuries separately for the dictionary values.
The utilization of geographic information systems (GIS) for spatial representation of diseases and the conditions in the health sector (government, provinces, and municipalities) of the given population can contribute to its intensive development and applicative importance according to Kričković et al. [34,140]. The second analysis implied spatial-temporal analysis (STA) using Hotspot Analysis (Getis-Ord
where
The
The analysis of traffic safety hotspots in the AP Vojvodina was divided into two groups. In the first group, the hotspots of traffic accidents were analysed based on the number of traffic accidents, traffic fatalities, and traffic injuries separately, based on RTSA reports from 2011 to 2020 [47,48,49,50,51,52,53,54,55,56,57,58,59,60,61,62,63,64,65,66,67,68,69,70,71,72,73,74,75,76,77,78,79,80,81,82,83,84,85,86,87,88,89,90,91,92,93,94,95,96,97,98,99,100,101,102,103,104,105,106,107,108,109,110,111,112,113,114,115,116,117,118,119,120,121,122,123,124,125,126,127,128,129,130,131,132,133,134]. The second group included an analysis of the weighted number of traffic casualties, summarized and separated into drivers and passengers in a passenger car; cyclists, moped riders, and motorcyclists; pedestrians; persons in trucks and persons in tractors based on RTSA reports from 2016 to 2020 [91,92,93,94,95,96,97,98,99,100,101,102,103,104,105,106,107,108,109,110,111,112,113,114,115,116,117,118,119,120,121,122,123,124,125,126,127,128,129,130,131,132,133,134]. Because of the RTSA manner of storing data on weighted number, it was impossible to use data in the MK analysis and in hotspot analysis for the same period as in the first group. This weighted number of casualties considers all the weights of traffic consequences and multiplies them with a specific weighting factor – weight (fatality persons – weight 99, severely injured persons - weight 13, slightly injured persons– weight 1), and adds up the values thus obtained [147].
3 Results
3.1 Trend analysis of the number of traffic accidents, fatalities, and injuries
As previously mentioned, the first analysis focused on exploring the application of the MK trend test. This analysis provided insights into the trends in the number of road accidents, fatalities, and injuries. The results are illustrated through parameters derived from the MK test for each municipality from 2011 to 2020, as presented in Table 1. The most significant statistical findings in the table are marked in bold. Although the module offers additional parameters, this presentation includes key ones – p, Z, and s, which represent the Theil-Sen estimator/slope or Sen’s slope.
Parameters of the MK test for the number of traffic accidents, fatalities, and injuries at the significance level of 0.05 by municipality from 2011 to 2020 in the study area
| Municipality | Number of traffic accidents | Number of traffic fatalities | Number of traffic injuries | ||||||
|---|---|---|---|---|---|---|---|---|---|
| p | Z | s | p | Z | s | p | Z | s | |
| Ada | 0.124 | −1.539 | −0.40 | 0.511 | −0.658 | 0.00 | 0.127 | −1.527 | −1.88 |
| Alibunar | 0.591 | −0.537 | −1.50 | 0.170 | −1.373 | −0.25 | 0.857 | −0.180 | −0.33 |
| Apatin | 0.720 | 0.358 | 0.75 | 0.570 | 0.568 | 0.00 | 0.471 | −0.721 | −1.75 |
| Bač | 0.530 | −0.629 | −1.00 | 0.926 | −0.093 | 0.00 | 0.474 | −0.716 | −1.33 |
| Bačka Palanka | 0.025 | 2.245 | 5.00 | 0.848 | 0.192 | 0.00 | 0.653 | 0.449 | 0.33 |
| Bačka Topola | 0.000 | 3.531 | 5.50 | 0.030 | −2.164 | −0.67 | 0.578 | 0.556 | 0.38 |
| Bački Petrovac | 0.049 | −1.968 | −4.50 | 0.494 | 0.684 | 0.00 | 0.323 | −0.988 | −2.50 |
| Bečej | 0.530 | −0.629 | −2.67 | 0.088 | −1.703 | −0.25 | 0.088 | −1.706 | −6.20 |
| Bela Crkva | 0.243 | −1.167 | −1.22 | 0.852 | 0.187 | 0.00 | 0.088 | −1.706 | −2.50 |
| Beočin | 0.653 | 0.449 | 0.67 | 0.850 | −0.189 | 0.00 | 0.530 | −0.629 | −1.17 |
| Čoka | 0.178 | 1.347 | 1.00 | 0.565 | 0.575 | 0.00 | 0.653 | −0.449 | −0.60 |
| Inđija | 0.928 | 0.090 | 0.25 | 0.780 | 0.279 | 0.00 | 0.474 | −0.716 | −1.75 |
| Irig | 0.720 | 0.358 | 1.20 | 0.079 | −1.759 | −0.25 | 0.927 | −0.092 | 0.00 |
| Kanjiža | 0.005 | 2.784 | 4.00 | 0.052 | −1.940 | −0.20 | 0.588 | −0.541 | −0.50 |
| Kikinda | 0.020 | 2.326 | 10.00 | 0.174 | 1.358 | 0.33 | 0.928 | 0.090 | 0.13 |
| Kovačica | 0.059 | −1.886 | −2.33 | 0.203 | −1.273 | −0.33 | 0.059 | −1.886 | −3.63 |
| Kovin | 0.858 | −0.179 | −1.00 | 0.854 | 0.184 | 0.00 | 0.243 | −1.167 | −1.88 |
| Kula | 1.000 | 0.000 | 0.29 | 1.000 | 0.000 | 0.00 | 0.057 | −1.906 | −2.78 |
| Mali Iđoš | 0.025 | 2.245 | 2.00 | 0.185 | 1.325 | 0.25 | 0.419 | 0.808 | 1.33 |
| Nova Crnja | 0.149 | −1.443 | −0.80 | 0.222 | −1.221 | −0.14 | 0.466 | −0.729 | −0.50 |
| Novi Bečej | 0.530 | −0.629 | −1.17 | 0.045 | −2.000 | −0.40 | 0.858 | −0.179 | −0.40 |
| Novi Kneževac | 0.025 | 2.245 | 1.71 | 0.836 | −0.207 | 0.00 | 0.651 | 0.453 | 0.67 |
| Novi Sad | 1.000 | 0.000 | 18.50 | 0.858 | −0.179 | −0.50 | 1.000 | 0.000 | −8.20 |
| Odžaci | 0.591 | −0.537 | −3.80 | 0.927 | 0.092 | 0.00 | 0.283 | −1.073 | −1.86 |
| Opovo | 0.471 | −0.721 | −0.50 | 0.455 | 0.746 | 0.00 | 0.045 | −2.006 | −1.00 |
| Pančevo | 0.720 | −0.358 | −6.20 | 0.149 | −1.443 | −0.71 | 1.000 | 0.000 | 0.00 |
| Pećinci | 0.530 | 0.629 | 2.00 | 0.718 | −0.361 | −0.20 | 0.279 | 1.082 | 2.20 |
| Plandište | 0.239 | −1.177 | −1.33 | 0.702 | −0.383 | 0.00 | 0.419 | −0.808 | −1.25 |
| Ruma | 0.928 | −0.090 | −2.33 | 1.000 | 0.000 | 0.00 | 0.074 | 1.789 | 5.50 |
| Sečanj | 0.415 | −0.815 | −0.33 | 0.443 | −0.766 | 0.00 | 0.015 | −2.425 | −2.00 |
| Senta | 0.210 | 1.252 | 1.88 | 0.629 | −0.483 | 0.00 | 0.088 | −1.706 | −1.75 |
| Sombor | 0.720 | 0.358 | 3.67 | 0.314 | −1.007 | −0.33 | 1.000 | 0.000 | 0.33 |
| Srbobran | 1.000 | 0.000 | 0.00 | 0.307 | 1.022 | 0.00 | 1.000 | 0.000 | 0.00 |
| Sremska Mitrovica | 0.530 | 0.629 | 11.25 | 0.927 | −0.092 | 0.00 | 0.591 | 0.537 | 3.29 |
| Sremski Karlovci | 0.788 | 0.269 | 0.50 | 0.522 | −0.641 | −0.20 | 0.419 | −0.808 | −2.00 |
| Stara Pazova | 1.000 | 0.000 | −4.00 | 0.928 | −0.091 | 0.00 | 0.243 | −1.167 | −3.00 |
| Subotica | 0.591 | 0.537 | 12.67 | 0.410 | −0.824 | −0.50 | 0.591 | −0.537 | −2.40 |
| Šid | 0.243 | 1.167 | 3.00 | 0.925 | 0.094 | 0.00 | 0.786 | 0.272 | 1.00 |
| Temerin | 0.653 | −0.449 | −4.25 | 1.000 | 0.000 | 0.00 | 0.123 | −1.543 | −0.86 |
| Titel | 0.788 | 0.269 | 1.89 | 0.033 | −2.133 | −0.20 | 0.718 | −0.361 | −0.44 |
| Vrbas | 0.049 | 1.968 | 9.00 | 0.584 | −0.547 | −0.17 | 0.127 | 1.527 | 4.00 |
| Vršac | 0.858 | −0.179 | −3.33 | 0.234 | −1.190 | −0.25 | 0.039 | −2.065 | −4.20 |
| Zrenjanin | 0.591 | 0.537 | 2.50 | 0.146 | −1.455 | −0.57 | 0.049 | −1.968 | −15.00 |
| Žabalj | 0.032 | −2.147 | −3.50 | 0.517 | −0.648 | −0.13 | 0.007 | −2.683 | −6.14 |
| Žitište | 1.000 | 0.000 | 0.00 | 0.081 | −1.746 | −0.25 | 0.059 | −1.886 | −2.00 |
Note: p – p-value of the significance test, Z – standardized test statistics, s – so-called Sen’s slope.
Marked values in bold are the most significant statistical findings.
In this analysis, specific trends were identified in 15 out of 45 municipalities. Notably, in the municipality of Bačka Topola, the number of road accidents is increasing, while the number of fatalities is decreasing. However, no significant trend was observed in the number of injuries. Conversely, in the municipality of Žabalj, both the number of road accidents and injuries are decreasing, with no discernible trend in the number of fatalities.
In the MK analysis of traffic accident numbers, trends were identified in 9 out of 45 municipalities, with 7 exhibiting an upward trend and only 2 showing a downward trend. Diagrams only depict statistically confirmed trends.
Figure 4(b) and (d) reveal the decreasing trends in traffic accidents for Bački Petrovac and Žabalj municipalities, with p, Z values of 0.050, −1.968 and 0.032, −2.147, respectively. Increasing trends are demonstrated in Figure 4(a) for Bačka Palanka (p = 0.025, Z = 2.245), Figure 4(h) for Bačka Topola (p = 0.0004, Z = 3.531), Figure 4(e) for Kanjiža (p = 0.005, Z = 2.784), Figure 4(f) for Kikinda (p = 0.020, Z = 2.326), Figure 4(i) for Mali Iđoš (p = 0.025, Z = 2.245), Figure 4(g) for Novi Kneževac (p = 0.025, Z = 2.245), and Figure 4(c) for Vrbas (p = 0.049, Z = 1.968).
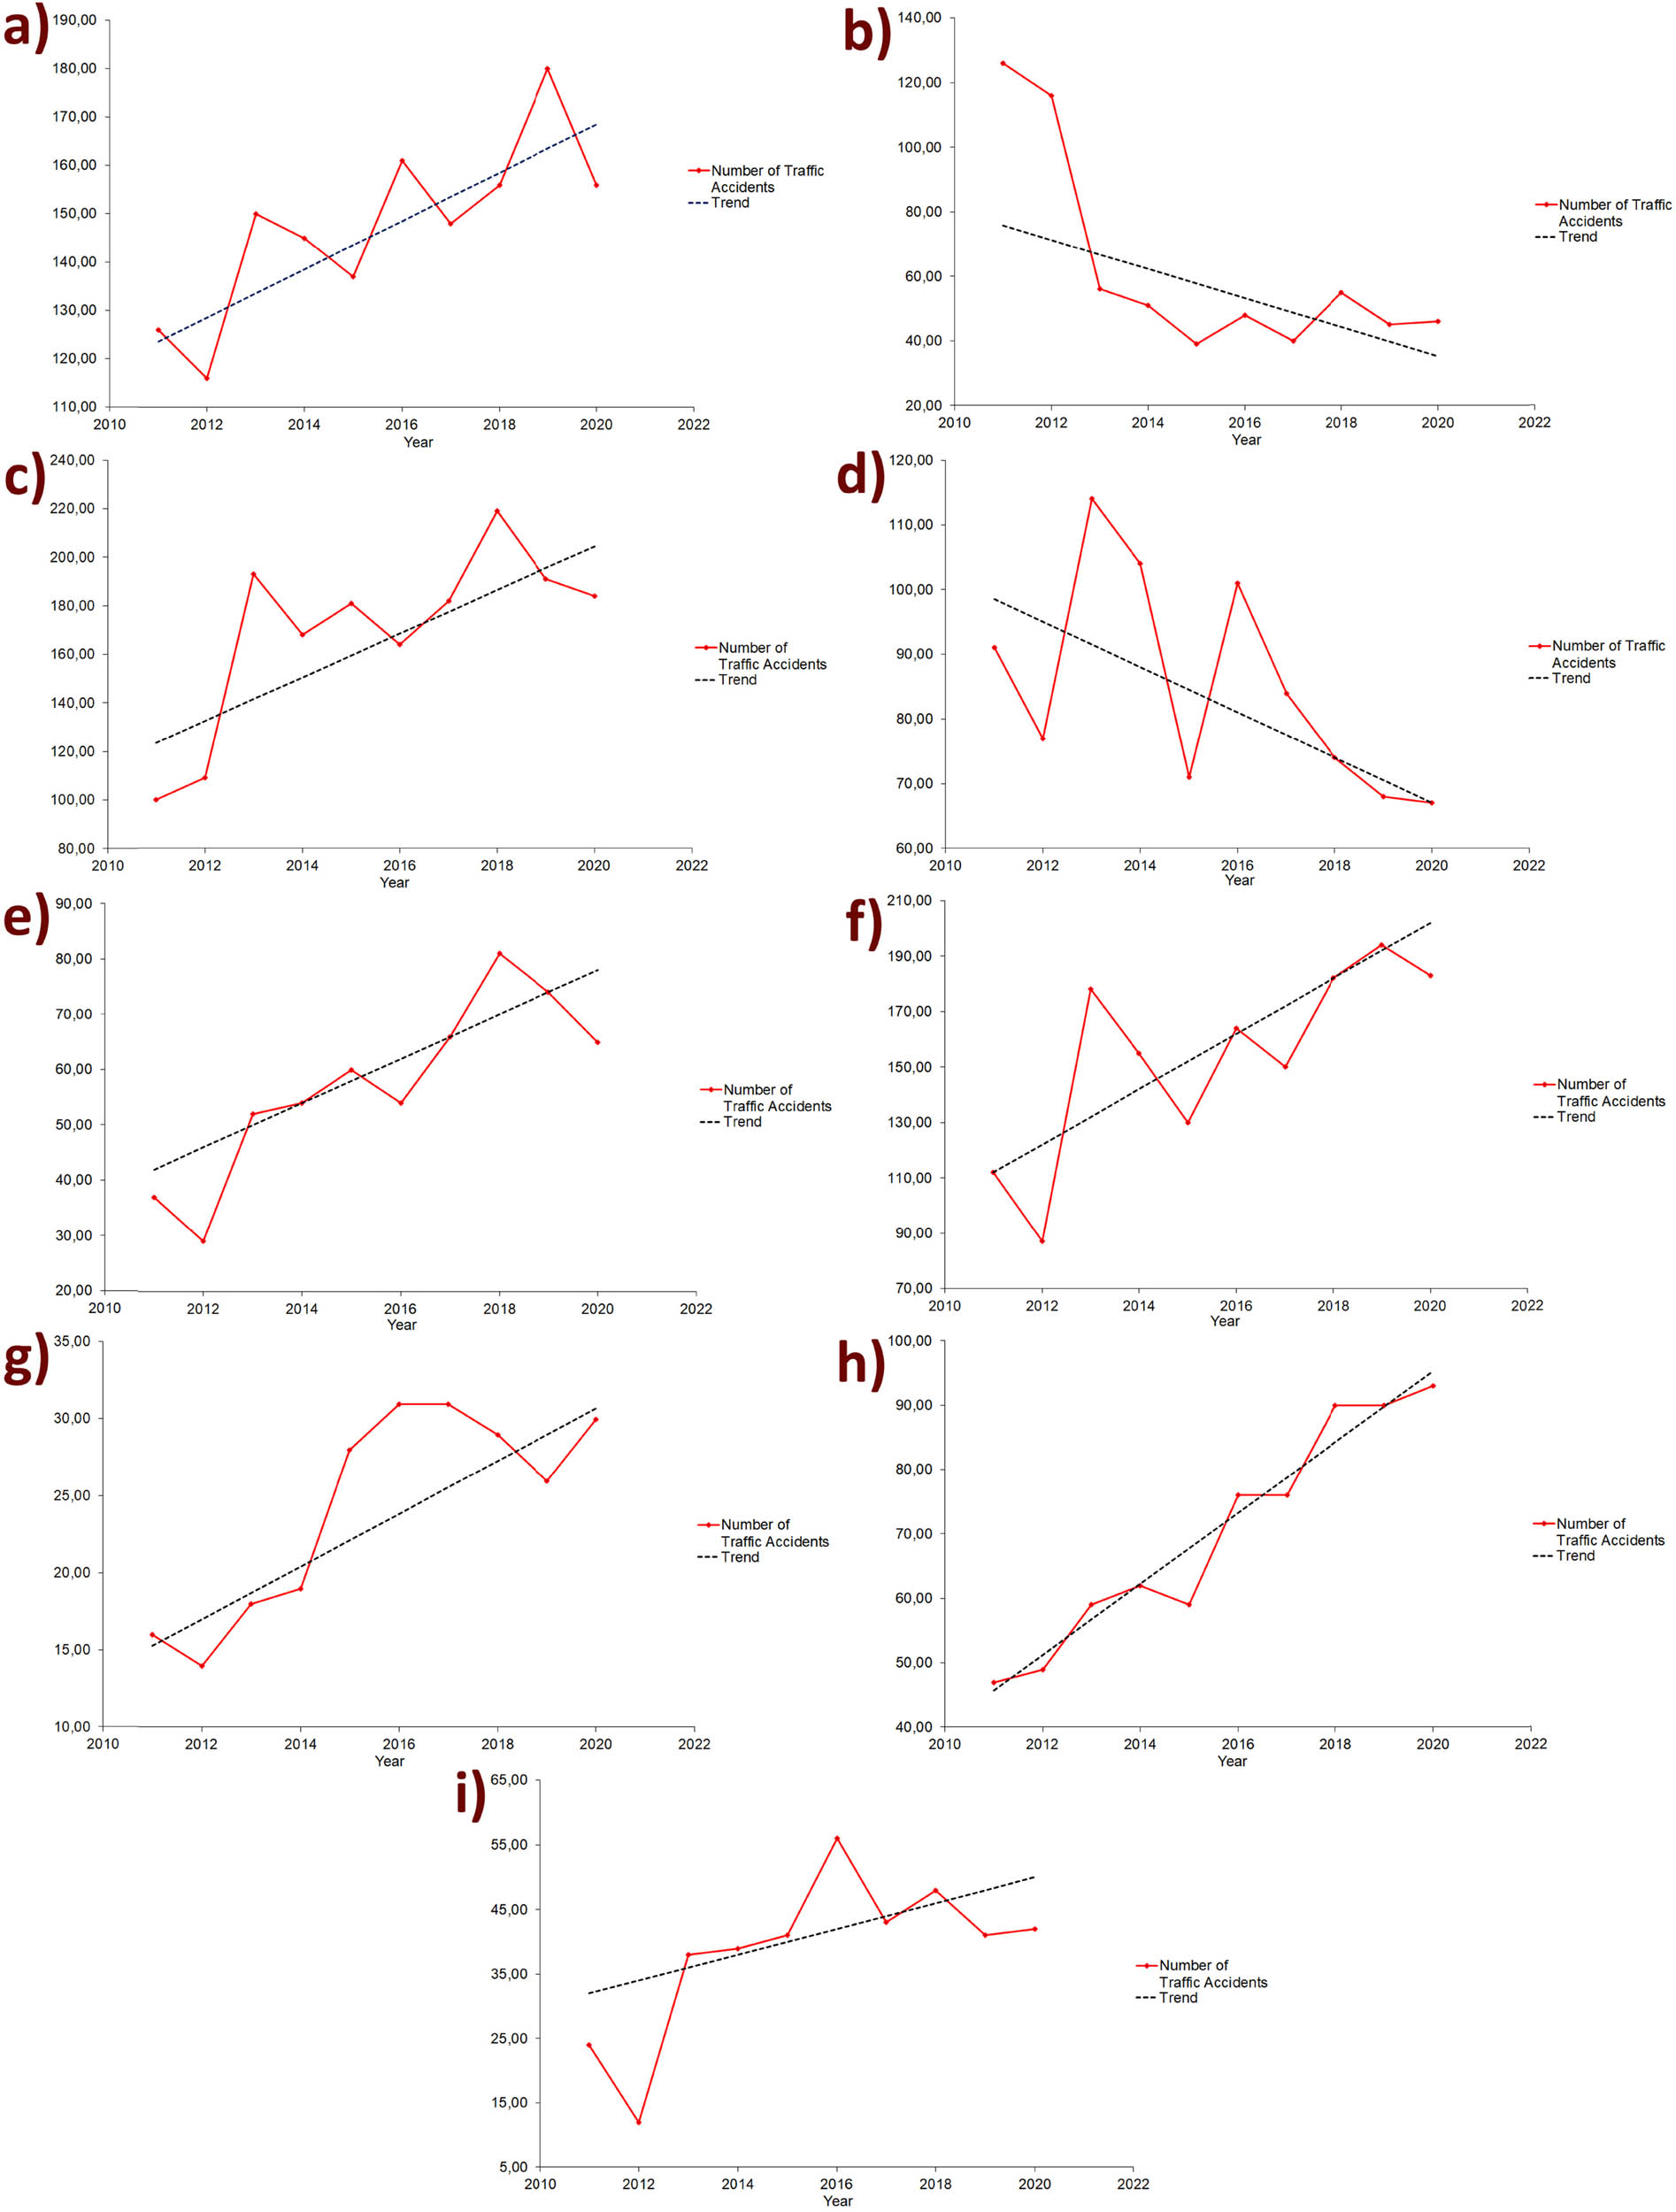
Trends in the number of traffic accidents according to the MK test from 2011 to 2020 for the municipalities of: (a) Bačka Palanka, (b) Bački Petrovac, (c) Vrbas, (d) Žabalj, (e) Kanjiža, (f) Kikinda, (g) Novi Kneževac, (h) Bačka Topola, and (i) Mali Idoš.
Apart from the MK analysis of the number of traffic accidents, the MK analysis of traffic fatalities only identified a declining trend in three municipalities. These trends are illustrated in Figure 5(a) for Bačka Topola, Figure 5(b) for Novi Bečej, and Figure 5(c) for Titel. The p-values for these trends are 0.030, 0.045, and 0.033, respectively, with corresponding Z values of −2.164, −2.000, and −2.133. Notably, no fatal accidents were recorded in any of these municipalities in 2020.
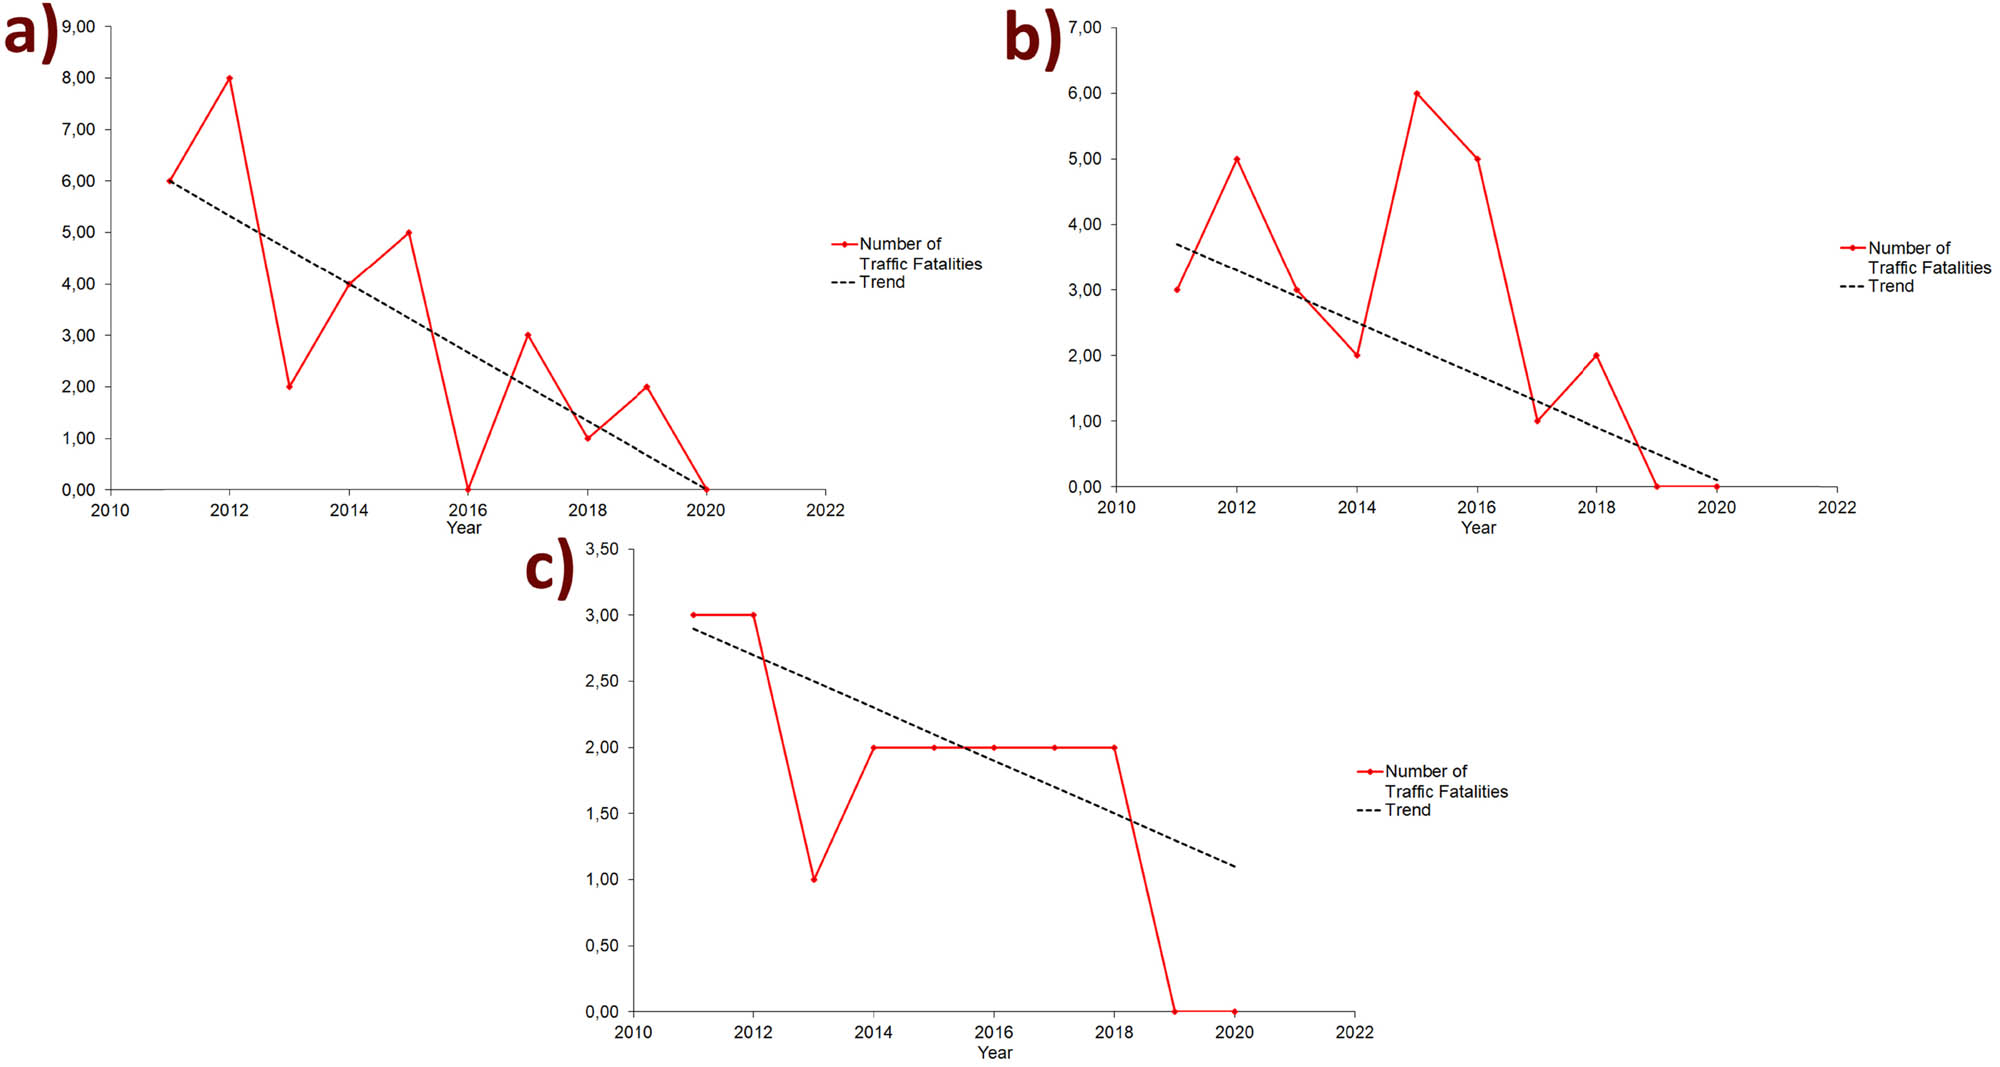
Trends in the number of traffic fatalities using MK test from 2011 to 2020 for the municipalities of: (a) Bačka Topola, (b) Novi Bečej, and (c) Titel.
The MK analysis of the number of traffic accidents unveiled a declining trend in 5 out of 45 municipalities. These trends are depicted in Figure 6(a) for Opovo (p = 0.045, Z = −2.006), Figure 6(b) for Sečanj (p = 0.015, Z = −2.425), Figure 6(c) for Vršac (p = 0.034, Z = −2.065), Figure 6(d) for Zrenjanin (p = 0.045, Z = −1.968), and Figure 6(e) for Žabalj (p = 0.045, Z = −2.006).
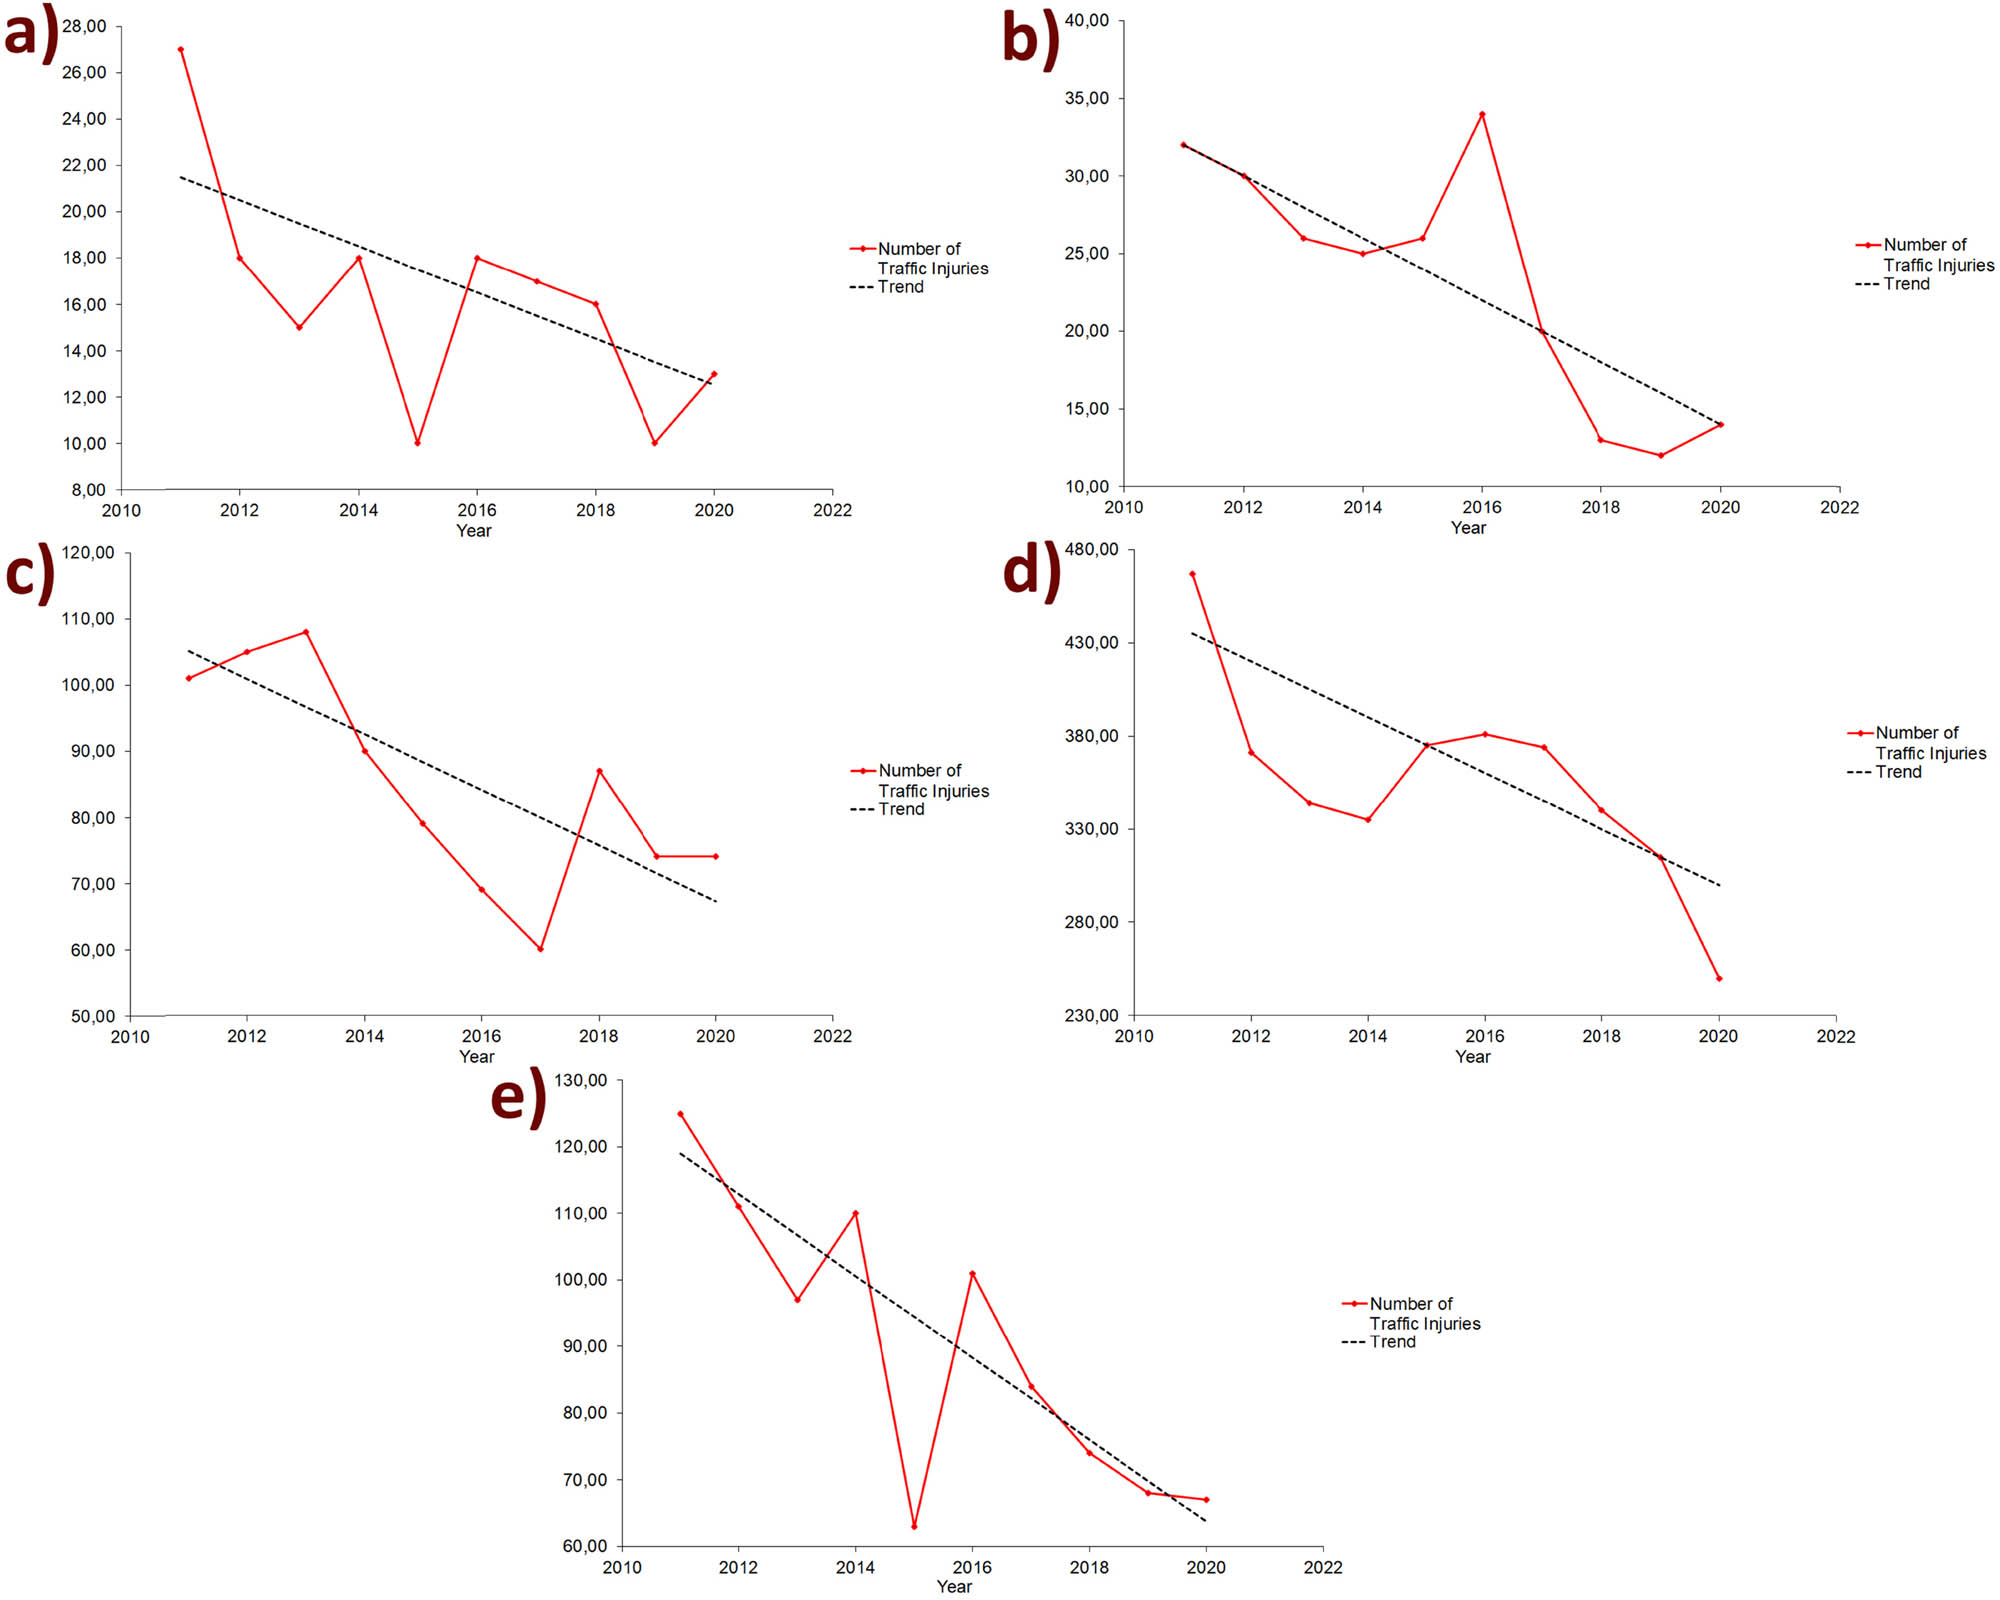
Trends in the number of traffic injuries using MK test from 2011 to 2020 for the municipalities of: (a) Opovo, (b) Sečanj, (c) Vršac, (d) Zrenjanin, and (e) Žabalj.
3.2 STA
In the STA, also known as hot-spot analysis (Getis Ord
STA parameters for the number of traffic accidents, fatalities, and injuries by municipality from 2011 to 2020 in the study area
| Municipality name | Number of traffic accidents | Number of traffic accidents fatalities | Number of traffic accidents injuries | ||||||
|---|---|---|---|---|---|---|---|---|---|
| Σ | GiZScore | GiPValue | Σ | GiZScore | GiPValue | Σ | GiZScore | GiPValue | |
| Ada | 364 | −0.663 | 0.507 | 18 | −1.103 | 0.270 | 318 | −0.760 | 0.447 |
| Alibunar | 375 | −0.637 | 0.524 | 22 | −0.855 | 0.393 | 408 | −0.681 | 0.496 |
| Apatin | 701 | 0.028 | 0.978 | 19 | −0.374 | 0.709 | 605 | 0.053 | 0.958 |
| Bač | 338 | −0.304 | 0.761 | 16 | −1.065 | 0.287 | 607 | −0.522 | 0.602 |
| Bačka Palanka | 1,475 | −0.469 | 0.639 | 9 | −1.082 | 0.279 | 321 | −0.480 | 0.631 |
| Bačka Topola | 701 | −0.036 | 0.971 | 31 | 0.077 | 0.939 | 666 | 0.040 | 0.968 |
| Bački Petrovac | 622 | 2.500 | 0.012 | 40 | 1.172 | 0.241 | 1,505 | 2.376 | 0.018 |
| Bečej | 1,115 | −0.655 | 0.512 | 35 | −1.115 | 0.265 | 1,114 | −0.777 | 0.437 |
| Bela Crkva | 362 | −0.333 | 0.739 | 17 | −0.393 | 0.695 | 315 | −0.415 | 0.678 |
| Beočin | 525 | 2.584 | 0.010 | 14 | 1.337 | 0.181 | 395 | 2.389 | 0.017 |
| Čoka | 229 | −0.638 | 0.524 | 11 | −1.306 | 0.192 | 223 | −0.780 | 0.435 |
| Inđija | 1,491 | −0.397 | 0.691 | 56 | −0.482 | 0.629 | 1,425 | −0.385 | 0.700 |
| Irig | 490 | 2.455 | 0.014 | 14 | 1.613 | 0.107 | 370 | 2.401 | 0.016 |
| Kanjiža | 572 | −0.550 | 0.582 | 163 | 0.979 | 0.328 | 450 | −0.695 | 0.487 |
| Kikinda | 1,535 | −0.457 | 0.648 | 40 | −0.870 | 0.384 | 1,275 | −0.532 | 0.595 |
| Kovačica | 4,29 | −0.637 | 0.524 | 33 | −0.900 | 0.368 | 538 | −0.687 | 0.492 |
| Kovin | 694 | 0.215 | 0.830 | 49 | 1.208 | 0.227 | 779 | 0.520 | 0.603 |
| Kula | 1,080 | −0.369 | 0.712 | 35 | −0.351 | 0.725 | 1,085 | −0.352 | 0.725 |
| Mali Iđoš | 384 | −0.442 | 0.658 | 21 | −0.582 | 0.561 | 353 | −0.456 | 0.649 |
| Nova Crnja | 165 | −0.447 | 0.655 | 12 | −0.719 | 0.472 | 179 | −0.511 | 0.610 |
| Novi Bečej | 492 | −0.449 | 0.653 | 27 | −0.614 | 0.539 | 440 | −0.479 | 0.632 |
| Novi Kneževac | 242 | −0.626 | 0.532 | 5 | 0.874 | 0.382 | 186 | −0.755 | 0.450 |
| Novi Sad | 21,205 | 1.962 | 0.050 | 202 | 0.641 | 0.521 | 14,495 | 1.995 | 0.046 |
| Odžaci | 921 | −0.456 | 0.648 | 25 | −0.871 | 0.384 | 787 | −0.419 | 0.675 |
| Opovo | 177 | −0.525 | 0.599 | 6 | −0.756 | 0.449 | 162 | −0.567 | 0.570 |
| Pančevo | 3,125 | 0.215 | 0.830 | 98 | 1.208 | 0.227 | 3,217 | 0.520 | 0.603 |
| Pećinci | 677 | −0.004 | 0.996 | 52 | 0.935 | 0.350 | 593 | 0.068 | 0.946 |
| Plandište | 179 | −0.679 | 0.497 | 9 | −1.200 | 0.230 | 184 | −0.765 | 0.444 |
| Ruma | 2.191 | −0.185 | 0.853 | 80 | 0.378 | 0.706 | 2,032 | −0.173 | 0.863 |
| Sečanj | 206 | −0.576 | 0.564 | 10 | −1.120 | 0.263 | 232 | −0.661 | 0.509 |
| Senta | 626 | −0.664 | 0.507 | 18 | 0.643 | 0.520 | 442 | −0.814 | 0.416 |
| Sombor | 2,856 | 0.154 | 0.877 | 52 | −0.174 | 0.862 | 2,431 | 0.204 | 0.839 |
| Srbobran | 523 | −0.371 | 0.711 | 7 | −0.661 | 0.508 | 233 | −0.418 | 0.676 |
| Sremska Mitrovica | 2,853 | −0.016 | 0.987 | 84 | 0.182 | 0.855 | 2,115 | −0.152 | 0.879 |
| Sremski Karlovci | 340 | 2.532 | 0.011 | 22 | 1.307 | 0.191 | 543 | 2.398 | 0.017 |
| Stara Pazova | 1,805 | 0.094 | 0.925 | 52 | 0.499 | 0.618 | 1,634 | 0.211 | 0.833 |
| Subotica | 3,392 | 0.278 | 0.781 | 80 | 0.553 | 0.580 | 2,900 | 0.378 | 0.705 |
| Šid | 867 | 0.192 | 0.848 | 35 | 0.699 | 0.485 | 562 | 0.085 | 0.932 |
| Temerin | 1,051 | 2.413 | 0.016 | 23 | 1.315 | 0.188 | 889 | 2.459 | 0.014 |
| Titel | 461 | −0.128 | 0.898 | 17 | 0.293 | 0.770 | 295 | 0.144 | 0.885 |
| Vrbas | 1,691 | −0.462 | 0.644 | 60 | −0.615 | 0.539 | 1,529 | −0.333 | 0.739 |
| Vršac | 1,078 | −0.333 | 0.739 | 42 | −0.393 | 0.695 | 847 | −0.415 | 0.678 |
| Zrenjanin | 3,225 | 0.184 | 0.854 | 102 | 0.699 | 0.485 | 3,552 | 0.471 | 0.638 |
| Žabalj | 851 | 2.968 | 0.003 | 29 | 1.447 | 0.148 | 900 | 2.806 | 0.005 |
| Žitište | 279 | −0.563 | 0.574 | 21 | −0.865 | 0.387 | 302 | −0.640 | 0.522 |
Note: Σ – sum of the number, GiZScore – Z-value of the
The STA on the number of traffic accidents has identified hotspots in seven municipalities. These hotspots are shown in Figure 7(a). The following municipalities were identified as hotspots: Bački Petrovac (Z = 2.5, p = 0.012), Beočin (Z = 2.584, p = 0.010), Irig (Z = 2.455, p = 0.014), Novi Sad (Z = 1.962, p = 0.050), Sremski Karlovci (Z = 2.532, p = 0.011), Temerin (Z = 2.413, p = 0.016), and Žabalj (Z = 2.968, p = 0.003). It is interesting to note that six of these seven municipalities are located in the district of South Bačka, while only the municipality of Irig is located in the district of Srem. The municipalities of Beočin and Žabalj were identified as hotspots with a probability of 99%, while all other municipalities were identified with a probability of 95%. No hotspots were detected in the STA for the number of traffic fatalities, as can be seen from Figure 7(b). In the STA for the number of traffic injuries, hotspots were identified in the same municipalities as for the number of traffic accidents, as can be seen from Figure 7(c). The only difference is that the municipality of Žabalj (Z = 2.806, p = 0.005) was identified as a hotspot with a probability of 99%, while all others were identified as hotspots with a probability of 95%. These municipalities are: Bački Petrovac (Z = 2.376, p = 0.018), Beočin (Z = 2.389, p = 0.017), Irig (Z = 2.401, p = 0.016), Novi Sad (Z = 1.995, p = 0.046), Sremski Karlovci (Z = 2.398, p = 0.017), and Temerin (Z = 2.459, p = 0.014).
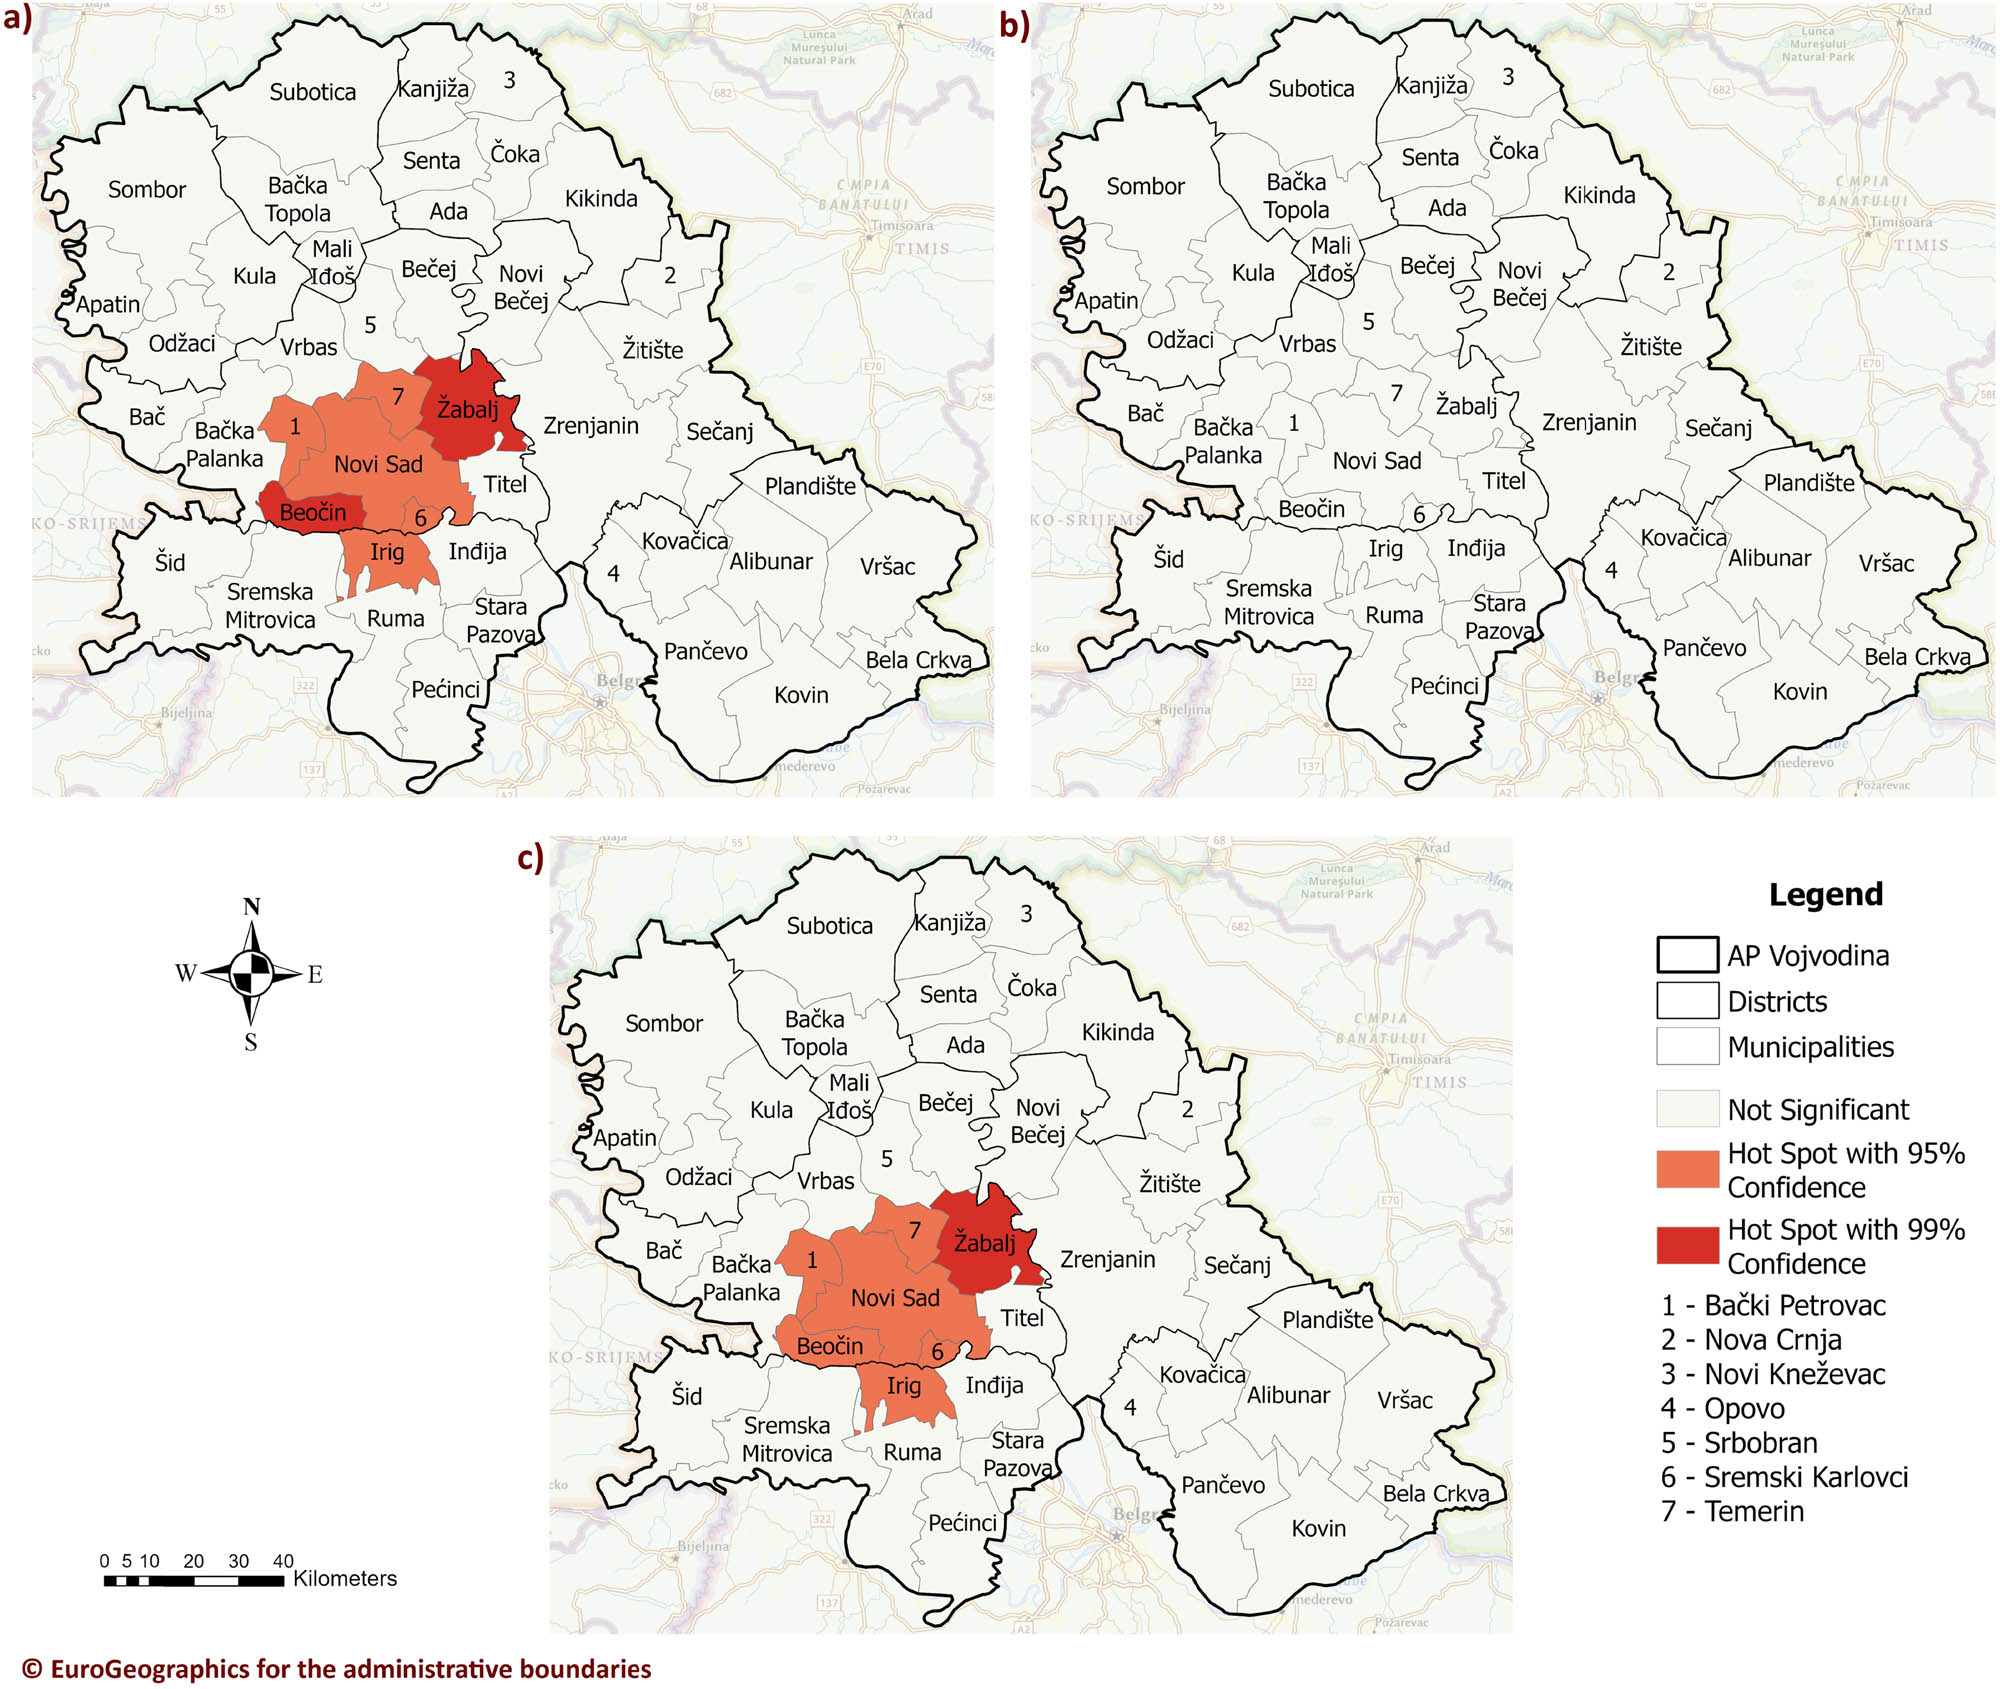
The STA on the: (a) Number of traffic accidents, (b) number of traffic fatalities, and (c) number of traffic injuries.
The STA on the weighted number of traffic casualties identified hotspots in nine municipalities. As previously mentioned, this analysis was divided into six categories, as shown in Table 3. The results for each category were presented by municipality using the STA parameters. Similar to the previous analyses, these parameters include the Z and p values of the
STA parameters for the traffic casualties weighted number, fatalities, and injuries by municipality in the study area from 2011 to 2020
| Municipality name | Traffic casualties weighted number | Traffic casualties weighted number – drivers and passengers in a passenger car | Traffic casualties weighted number – cyclists, moped riders, and motorcyclist | Traffic casualties weighted number – pedestrians | Traffic casualties weighted number – persons in trucks | Traffic casualties weighted number – persons in tractors | ||||||
|---|---|---|---|---|---|---|---|---|---|---|---|---|
| Z | p | Z | p | Z | p | Z | p | Z | p | Z | p | |
| Ada | −0.938 | 0.348 | −1.158 | 0.247 | −0.802 | 0.423 | −0.759 | 0.448 | −0.716 | 0.474 | −0.936 | 0.349 |
| Alibunar | −0.876 | 0.381 | −0.906 | 0.365 | −1.056 | 0.291 | −0.653 | 0.514 | −0.692 | 0.489 | −0.773 | 0.440 |
| Apatin | 0.121 | 0.904 | −0.175 | 0.861 | 0.664 | 0.506 | −0.014 | 0.989 | 0.065 | 0.948 | 0.813 | 0.416 |
| Bač | −0.735 | 0.462 | −0.705 | 0.481 | −0.700 | 0.484 | −0.768 | 0.443 | −0.690 | 0.490 | −0.327 | 0.744 |
| Bačka Palanka | −0.737 | 0.461 | −0.609 | 0.543 | −0.747 | 0.455 | −0.668 | 0.504 | −0.951 | 0.341 | −0.396 | 0.692 |
| Bačka Topola | 0.153 | 0.878 | 0.281 | 0.779 | 0.468 | 0.639 | −0.206 | 0.836 | 0.037 | 0.971 | −1.020 | 0.308 |
| Bački Petrovac | 2.109 | 0.035 | 1.979 | 0.048 | 2.025 | 0.043 | 2.415 | 0.016 | 1.954 | 0.051 | −0.825 | 0.410 |
| Bečej | −0.996 | 0.319 | −0.906 | 0.365 | −1.231 | 0.218 | −0.830 | 0.407 | −0.849 | 0.396 | −1.190 | 0.234 |
| Bela Crkva | −0.422 | 0.673 | −0.373 | 0.709 | −0.525 | 0.599 | −0.213 | 0.831 | −0.633 | 0.527 | 0.237 | 0.812 |
| Beočin | 2.164 | 0.030 | 2.074 | 0.038 | 2.050 | 0.040 | 2.343 | 0.019 | 2.096 | 0.036 | −0.546 | 0.585 |
| Čoka | −0.840 | 0.401 | −1.141 | 0.254 | −0.401 | 0.688 | −0.824 | 0.410 | −0.731 | 0.465 | −0.242 | 0.808 |
| Inđija | −0.347 | 0.729 | −0.127 | 0.899 | −0.619 | 0.536 | −0.441 | 0.659 | −0.138 | 0.890 | −1.214 | 0.225 |
| Irig | 2.272 | 0.023 | 2.270 | 0.023 | 1.735 | 0.083 | 2.451 | 0.014 | 2.566 | 0.010 | −0.395 | 0.692 |
| Kanjiža | −0.784 | 0.433 | −1.035 | 0.301 | −0.402 | 0.687 | −0.639 | 0.523 | −0.836 | 0.403 | −0.592 | 0.554 |
| Kikinda | −0.418 | 0.676 | −0.678 | 0.498 | −0.117 | 0.907 | −0.657 | 0.511 | −0.016 | 0.987 | 0.638 | 0.524 |
| Kovačica | −0.865 | 0.387 | −0.829 | 0.407 | −1.097 | 0.273 | −0.689 | 0.491 | −0.685 | 0.493 | −0.773 | 0.440 |
| Kovin | 0.754 | 0.451 | 1.210 | 0.226 | 0.458 | 0.647 | 0.316 | 0.752 | 0.619 | 0.536 | 1.055 | 0.292 |
| Kula | −0.260 | 0.795 | −0.172 | 0.864 | −0.217 | 0.828 | −0.420 | 0.674 | −0.166 | 0.868 | −0.855 | 0.393 |
| Mali Iđoš | −0.478 | 0.633 | −0.355 | 0.722 | −0.564 | 0.573 | −0.472 | 0.637 | −0.445 | 0.656 | −1.152 | 0.249 |
| Nova Crnja | −0.412 | 0.680 | −0.682 | 0.495 | −0.157 | 0.875 | −0.602 | 0.547 | −0.269 | 0.788 | 3.236 | 0.001 |
| Novi Bečej | −0.643 | 0.520 | −0.669 | 0.503 | −0.730 | 0.466 | −0.540 | 0.589 | −0.510 | 0.610 | −0.327 | 0.744 |
| Novi Kneževac | −0.815 | 0.415 | −1.090 | 0.276 | −0.538 | 0.590 | −0.737 | 0.461 | −0.571 | 0.568 | −0.761 | 0.447 |
| Novi Sad | 1.517 | 0.129 | 1.377 | 0.169 | 1.324 | 0.185 | 1.826 | 0.068 | 1.544 | 0.123 | −0.432 | 0.666 |
| Odžaci | −0.546 | 0.585 | −0.590 | 0.555 | −0.418 | 0.676 | −0.638 | 0.523 | −0.400 | 0.689 | −0.539 | 0.590 |
| Opovo | −0.697 | 0.486 | −0.715 | 0.475 | −0.850 | 0.395 | −0.641 | 0.521 | −0.412 | 0.680 | −0.449 | 0.654 |
| Pančevo | 0.754 | 0.451 | 1.210 | 0.226 | 0.458 | 0.647 | 0.316 | 0.752 | 0.619 | 0.536 | 1.055 | 0.292 |
| Pećinci | 0.497 | 0.619 | 0.791 | 0.429 | 0.091 | 0.928 | 0.430 | 0.667 | 0.406 | 0.685 | 0.748 | 0.454 |
| Plandište | −1.067 | 0.286 | −1.112 | 0.266 | −1.154 | 0.249 | −0.666 | 0.505 | −1.130 | 0.258 | −1.303 | 0.192 |
| Ruma | 0.090 | 0.928 | 0.314 | 0.753 | −0.330 | 0.741 | 0.090 | 0.928 | 0.179 | 0.858 | 0.137 | 0.891 |
| Sečanj | −0.942 | 0.346 | −1.058 | 0.290 | −0.919 | 0.358 | −0.614 | 0.539 | −0.951 | 0.341 | −1.091 | 0.275 |
| Senta | −0.895 | 0.371 | −1.121 | 0.262 | −0.605 | 0.545 | −0.743 | 0.458 | −0.768 | 0.443 | −1.606 | 0.108 |
| Sombor | 0.258 | 0.797 | −0.079 | 0.937 | 0.830 | 0.406 | 0.252 | 0.801 | 0.028 | 0.977 | 1.150 | 0.250 |
| Srbobran | −0.414 | 0.679 | −0.265 | 0.791 | −0.574 | 0.566 | −0.350 | 0.727 | −0.419 | 0.675 | −1.156 | 0.248 |
| Sremska Mitrovica | 0.028 | 0.978 | 0.016 | 0.987 | −0.008 | 0.994 | 0.217 | 0.828 | −0.167 | 0.867 | 0.198 | 0.843 |
| Sremski Karlovci | 2.098 | 0.036 | 1.993 | 0.046 | 1.733 | 0.083 | 2.257 | 0.024 | 2.469 | 0.014 | −0.975 | 0.330 |
| Stara Pazova | 0.553 | 0.580 | 1.063 | 0.288 | 0.013 | 0.989 | 0.356 | 0.722 | 0.564 | 0.573 | −1.069 | 0.285 |
| Subotica | 0.516 | 0.606 | 0.494 | 0.621 | 1.075 | 0.282 | 0.130 | 0.896 | 0.295 | 0.768 | −0.259 | 0.796 |
| Šid | 0.449 | 0.654 | 0.421 | 0.674 | 0.474 | 0.635 | 0.496 | 0.620 | 0.261 | 0.794 | 0.967 | 0.333 |
| Temerin | 2.197 | 0.028 | 2.069 | 0.039 | 2.038 | 0.042 | 2.489 | 0.013 | 2.059 | 0.039 | 0.020 | 0.984 |
| Titel | 0.253 | 0.800 | 0.483 | 0.629 | 0.071 | 0.943 | −0.091 | 0.927 | 0.458 | 0.647 | −0.008 | 0.994 |
| Vrbas | −0.257 | 0.797 | −0.095 | 0.924 | −0.306 | 0.760 | −0.308 | 0.758 | −0.311 | 0.756 | −1.059 | 0.290 |
| Vršac | −0.422 | 0.673 | −0.373 | 0.709 | −0.525 | 0.599 | −0.213 | 0.831 | −0.633 | 0.527 | 0.237 | 0.812 |
| Zrenjanin | 0.616 | 0.538 | 0.629 | 0.529 | 0.763 | 0.446 | 0.297 | 0.766 | 0.786 | 0.432 | −0.390 | 0.696 |
| Žabalj | 2.302 | 0.021 | 2.010 | 0.044 | 2.192 | 0.028 | 2.752 | 0.006 | 2.248 | 0.025 | −0.364 | 0.716 |
| Žitište | −0.790 | 0.429 | −1.092 | 0.275 | −0.749 | 0.454 | −0.607 | 0.544 | −0.689 | 0.491 | 2.740 | 0.006 |
Note: Σ – sum of the number, GiZScore – Z-value of the
No cold spots were detected in these analyses. The weighted number of traffic casualties was the first category in the STA. It identified hotspots in six municipalities, all with a 95% probability. These municipalities, along with their Z and p values, are as follows: Bački Petrovac (Z = 2.109, p = 0.035), Beočin (Z = 2.164, p = 0.030), Irig (Z = 2.272, p = 0.023), Sremski Karlovci (Z = 2.098, p = 0.036), Temerin (Z = 2.197, p = 0.028), and Žabalj (Z = 2.302, p = 0.021). Figure 8(a) illustrates these hotspots.
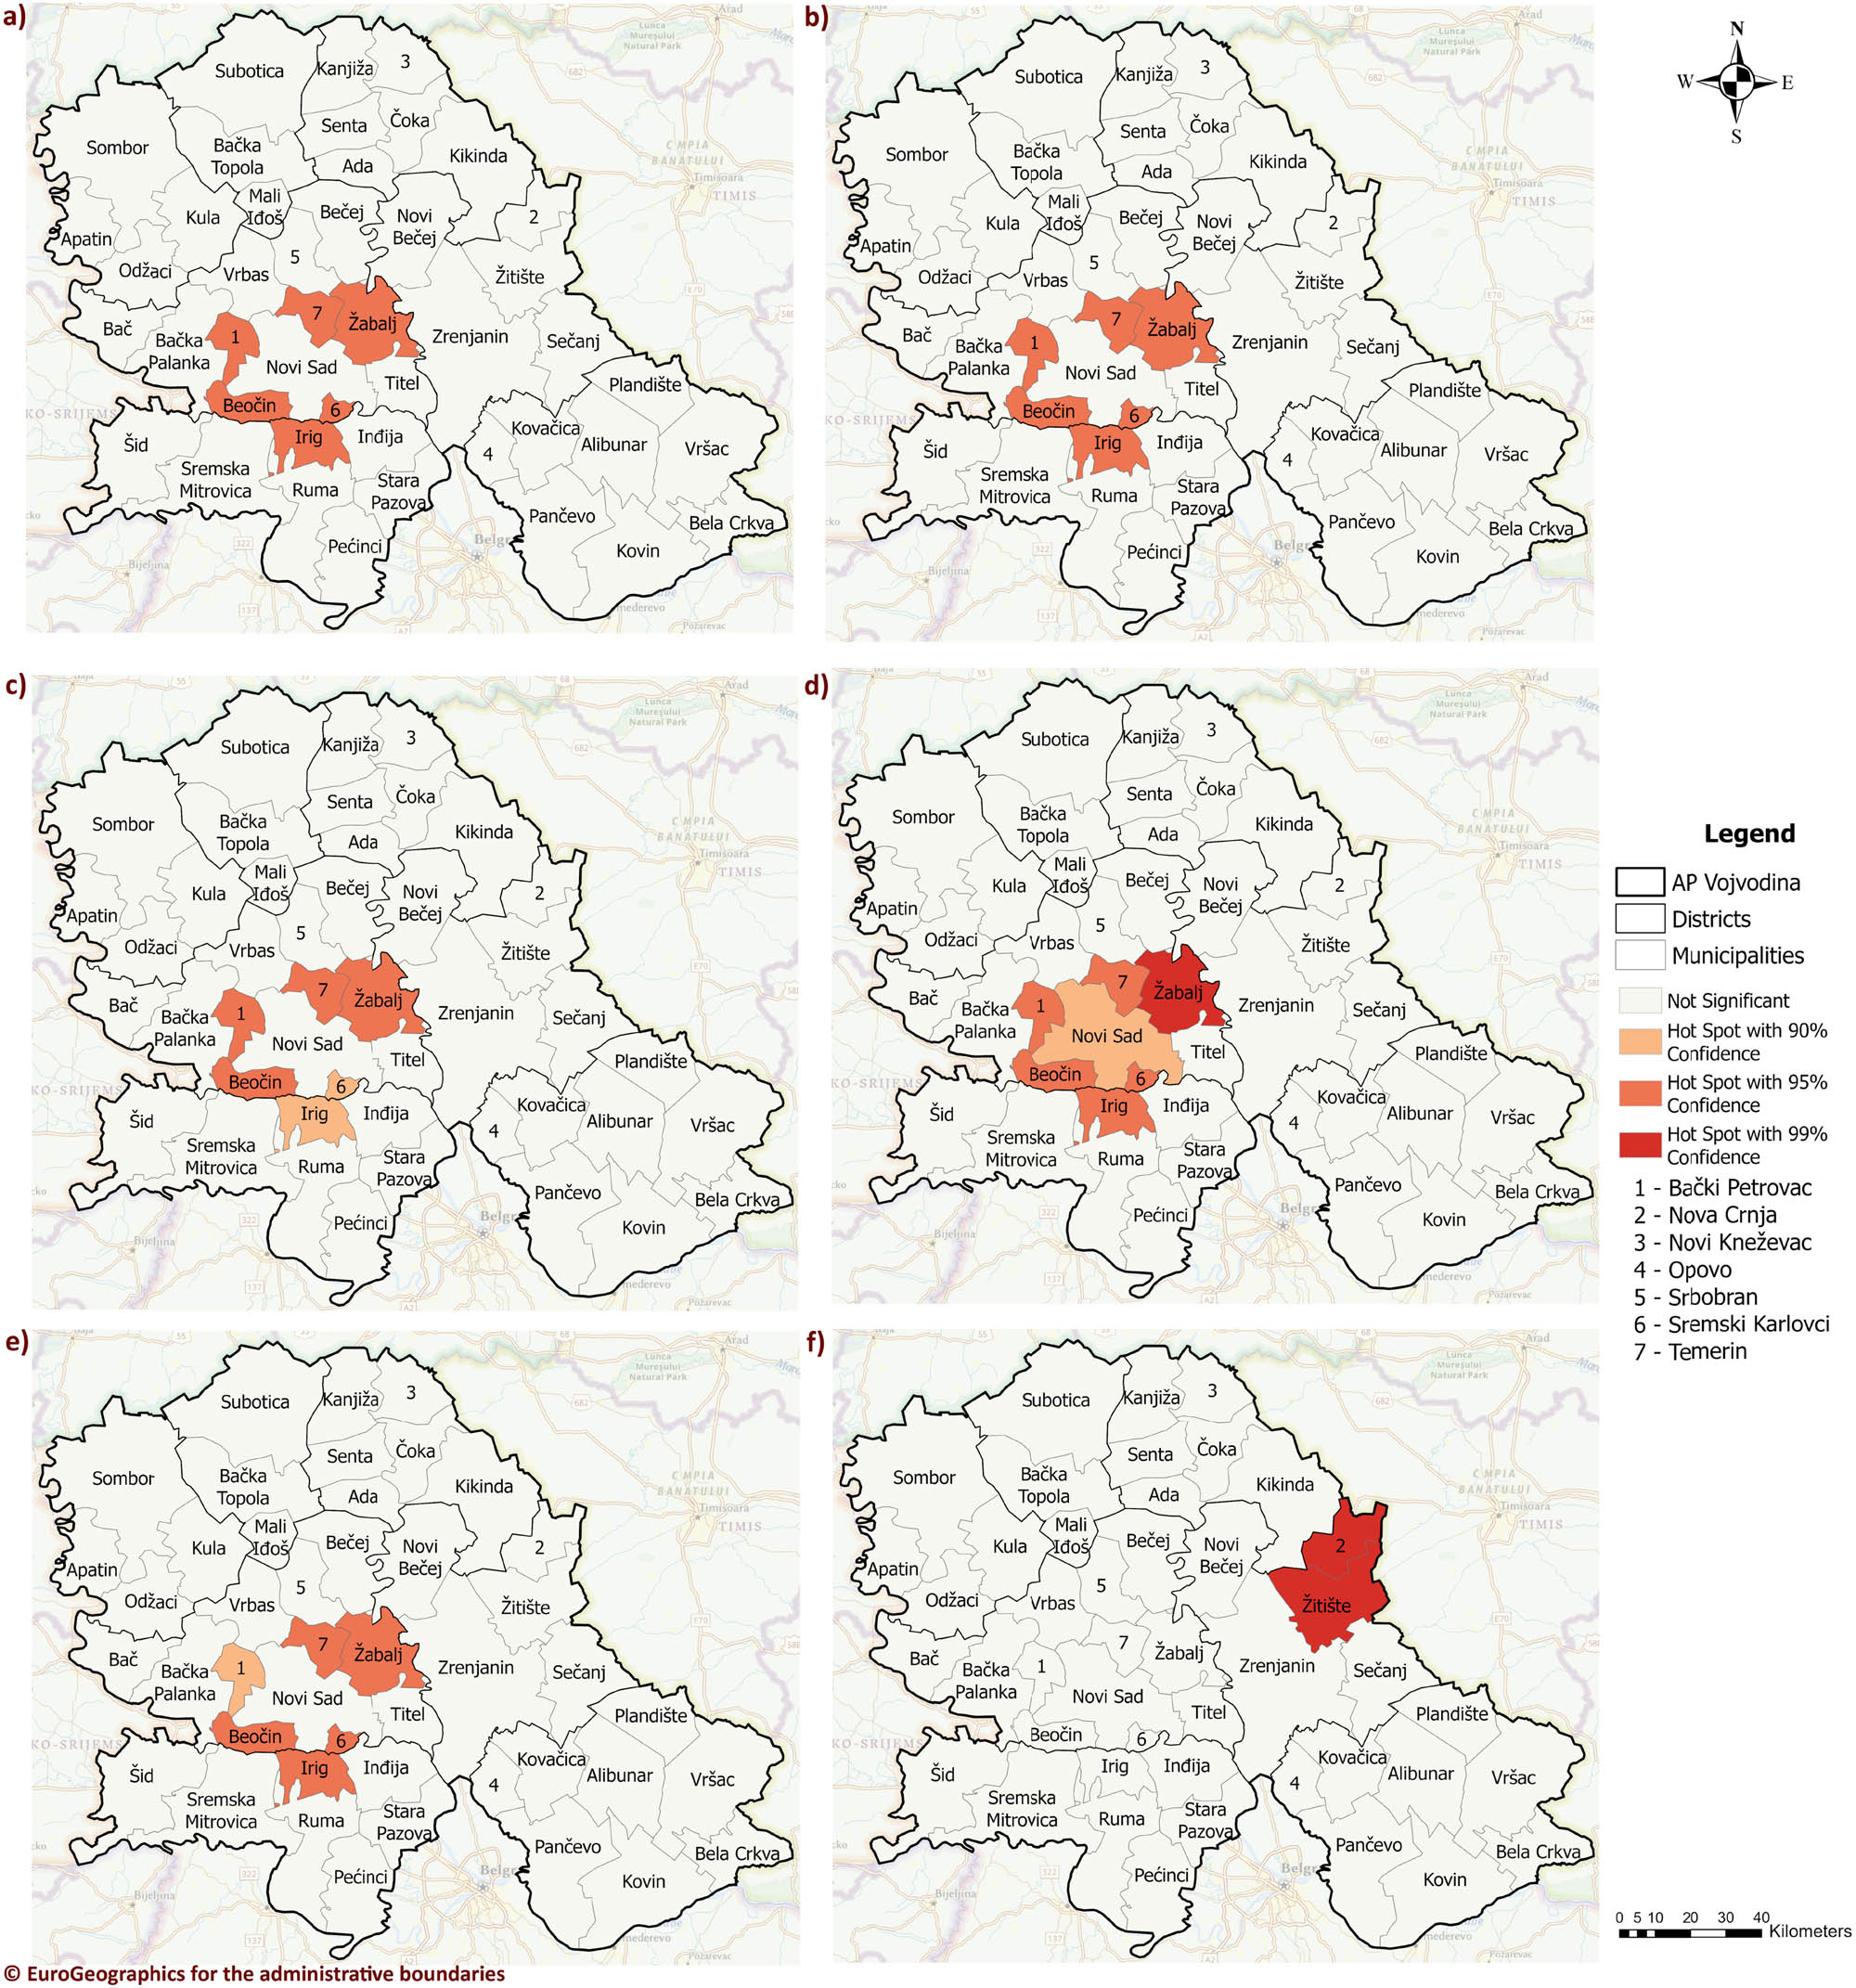
The STA on the: (a) Traffic casualties weighted number, (b) traffic casualties weighted number – drivers and passengers in a passenger car, (c) traffic casualties weighted number – cyclists, moped riders, and motorcyclist, (d) traffic casualties weighted number – pedestrians, (e) traffic casualties weighted number – persons in trucks, and (f) traffic casualties weighted number – persons in tractors.
The weighted number of traffic casualties was divided into five categories. The first category encompassed drivers and passengers in a car. In this STA, hotspots were identified in the same municipalities as in the previous analysis (Figure 8(b)). The Z and p values for these hotspots are 1.979 and 0.048 for Bački Petrovac, 2.074 and 0.038 for Beočin, 2.270 and 0.023 for Irig, 1.993 and 0.046 for Sremski Karlovci, 2.069 and 0.039 for Temerin, and 2.010 and 0.044 for Žabalj.
The second category included cyclists, moped riders, and motorcyclists (Figure 8(c)). The situation regarding these hotspots is the same as in the two previous analyses, with the only difference being that the municipalities of Irig and Sremski Karlovci were identified as hotspots with a probability of 90%, while others were identified with a probability of 95%. The Z and p values for these hotspots are 2.025 and 0.043 for Bački Petrovac, 2.050 and 0.040 for Beočin, 1.735 and 0.083 for Irig, 1.733 and 0.083 for Sremski Karlovci, 2.038 and 0.042 for Temerin, and 2.192 and 0.028 for Žabalj.
The third category in the hotspot analysis included pedestrians (Figure 8(d)). In this analysis, seven municipalities were identified as hotspots (Figure 8(d)). These municipalities, along with their respective Z and p values, are: Bački Petrovac (2.415, 0.016), Beočin (2.343, 0.019), Irig (2.451, 0.014), Novi Sad (1.826, 0.068), Sremski Karlovci (2.257, 0.024), Temerin (2.489, 0.013), and Žabalj (2.752, 0.006). While Žabalj was identified as a hotspot with a 99% probability, Novi Sad was identified with a 90% probability, and all other municipalities were identified with a 95% probability.
The next category analysed included people in trucks which is presented in Figure 8(e). The STA for this category identified six municipalities as hotspots. Five municipalities were identified with a 95% probability, namely, Beočin (2.096, 0.036), Irig (2.566, 0.010), Sremski Karlovci (2.469, 0.014), Temerin (2.059, 0.039), and Žabalj (2.248, 0.025), while Bački Petrovac (1.954, 0.051) was identified as a hotspot with a probability of 90%.
The last category analysed differed the most from the other STA analyses. It included people in tractors (Figure 8(f)). Only two municipalities were identified as hotspots, both with a 99% probability: Nova Crnja (Z = 3.236, p = 0.001) and Žitiste (Z = 2.740, p = 0.006).
4 Discussion
Monitoring and analysing the temporal distribution of traffic accidents and their consequences over several years allow us to observe trends in the development of these phenomena. This process provides comprehensive knowledge, enabling us to plan and implement appropriate measures [148]. By monitoring and analysing these trends, we gain insights into changes over time and specific phenomena related to road safety [28]. Space–time pattern analysis has been employed to understand where accidents cluster in traffic, confirm whether the overall number of traffic accidents is increasing or decreasing, and determine if the trend is statistically significant [17].
In this research, the STA of traffic accidents in the territory of the AP Vojvodina has been conducted to analyse trends in their occurrence and identify hotspots. Trends in the number of traffic accidents, fatalities, and injuries were found in 15 out of 45 local administrative units. Notably, only two municipalities, Bački Petrovac and Žabalj, show a decreasing trend in the number of traffic accidents, while seven municipalities – Bačka Palanka, Bačka Topola, Kanjiža, Kikinda, Mali Iđoš, Novi Kneževac, and Vrbas – exhibit an increasing trend.
Studies are recommended in these areas to investigate the causes of traffic accidents, assess road infrastructure, and enhance road safety. Additionally, understanding the “habits” and behaviour of road users in vulnerable areas is crucial. A trend of reducing traffic accident fatalities was observed in three municipalities: Bačka Topola, Novi Bečej, and Titel. Furthermore, the municipalities of Opovo, Sečanj, Vršac, Zrenjanin, and Žabalj exhibited a decline in traffic accident injuries. These municipalities set positive examples by effectively reducing both fatalities and injuries.
The STA on the number of traffic accidents, fatalities, and injuries identified hotspots in seven municipalities: Bački Petrovac, Beočin, Irig, Novi Sad, Sremski Karlovci, Temerin, and Žabalj. No hotspots were detected for traffic fatalities, except for the weighted number of traffic fatalities in Nova Crnja and Žabalj, attributed to their predominantly rural nature and agricultural activities. Figure 9 illustrates the intensity of hotspot occurrences. It shows that six municipalities – Bački Petrovac, Beočin, Irig, Sremski Karlovci, Temerin, and Žabalj – were identified as hotspots seven times in various spatial analyses. The city of Novi Sad was identified as a hotspot in three analyses, while the municipalities of Nova Crnja and Žitište were identified as hotspots only once in the analyses.

Intensity of Hotspots (number represents frequency of municipality identification as hotspot in analyses).
Similar to this, Figure 10 illustrates the weighted number of traffic casualties' ratios by categories. It is evident that the highest weighted number is within the first category, which includes drivers and passengers in a passenger car (42.54%), while the lowest is within the last analysed category, persons in tractors (2.39%). The weighted numbers in between are as follows: cyclists, moped riders, and motorcyclists (23.66%); persons in trucks (16.53%); and pedestrians (14.89%).
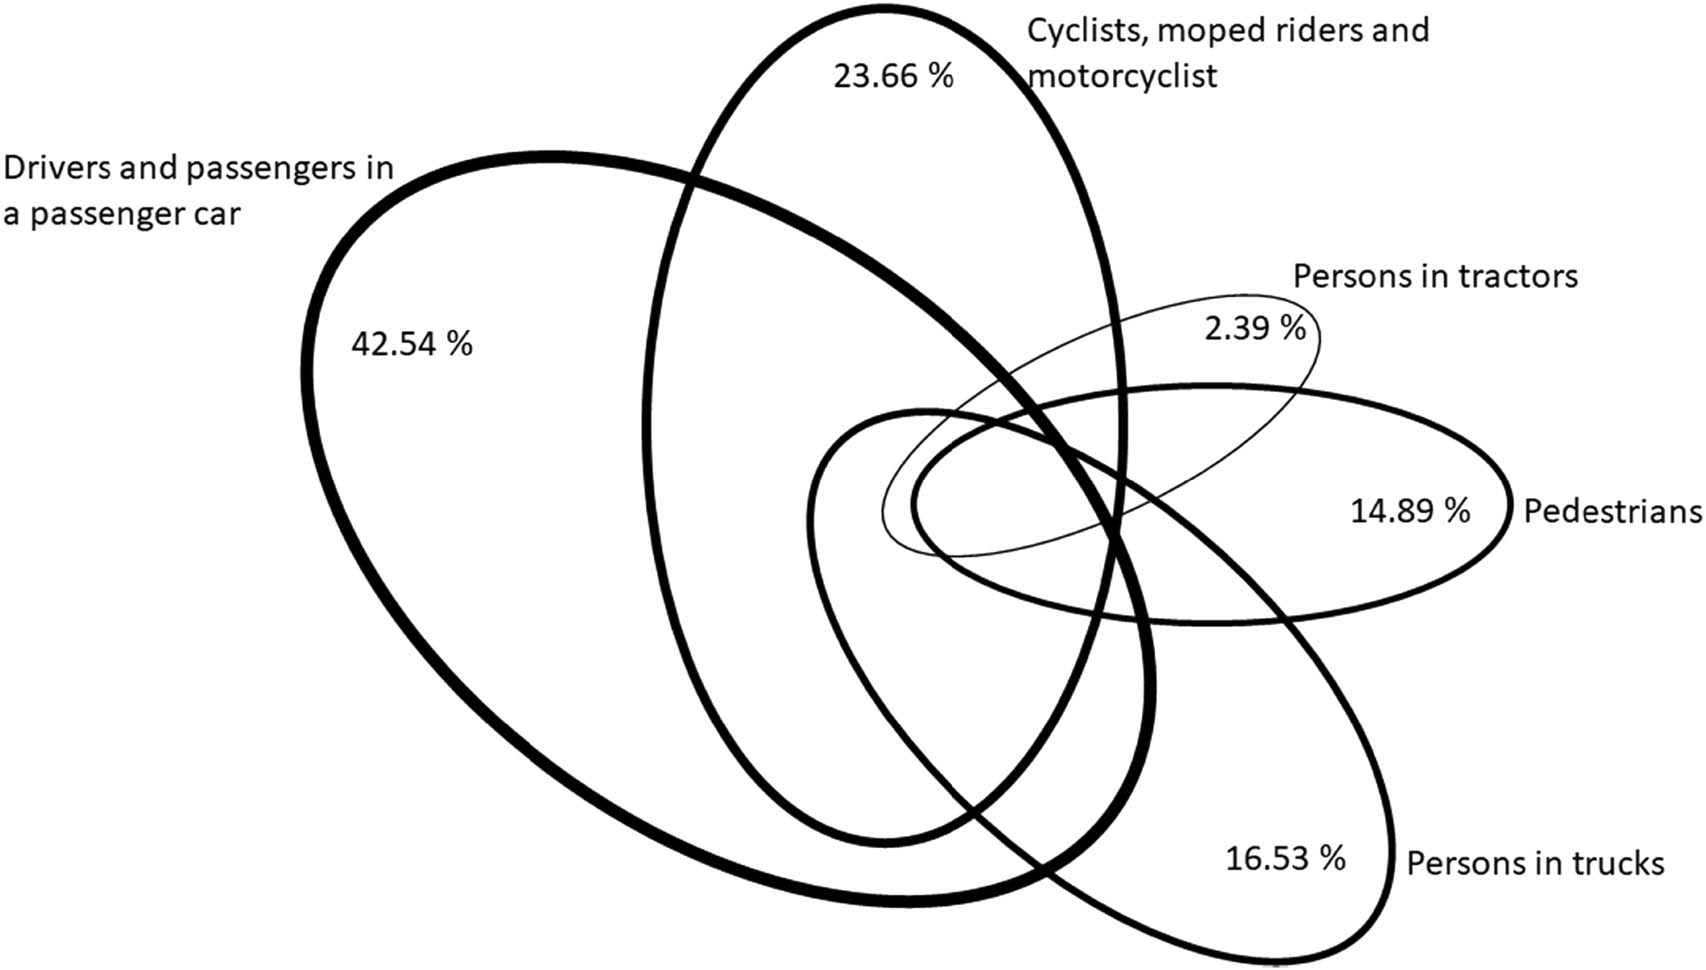
Weighted number of traffic casualties' ratios by categories.
Bačkalić and Pljakić et al. offer valuable insights into spatial analysis and critical time periods for traffic accidents, respectively [16,18]. Future research should identify hotspots in other municipalities and conduct a similar analysis for the period after 2009. Implementing “stricter” measures during critical periods could contribute to reducing accidents, injuries, and fatalities.
In the study “Understanding the Physical Environment through Safe Highway Transport Mobility with a Special Review on Climate – The Highway Route Belgrade–Novi Sad, Serbia,” particular attention was given to climate elements that may pose a significant risk to road safety [29]. The research found that these climate elements exert a strong influence, but their impact can be effectively controlled through vegetation safety measures [29]. Furthermore, the study “Understanding the Influence of Climate Elements on Traffic: The Wind Impact Approach” emphasizes the effects of wind on traffic safety in Belgrade and Novi Sad [30].
The landscape design of both directions of the highway offers a potential means to mitigate the impact of climate elements on safety [29]. It is crucial to pay more attention to planning landscape design along highways and other roads to reduce the influence of climatic factors on the occurrence of traffic accidents. Additionally, conducting more detailed studies to comprehend traffic accidents related to physical-geographical factors is necessary. Identifying anthropogenic activities that can influence these occurrences is also imperative.
Environmental accidents and the unsustainable use of land resources can contribute to an increase in the number of traffic accidents. In 2018, an 800 ha fire in the fields of Stajićevo, Perlez, and Belo Blato near Zrenjanin affected a 200 ha of the Special Nature Reserve Carska Bara. The cause was the irresponsible burning of stubble on surrounding plots, leading to the rapid spread of the fire. Igniting crop residues, exacerbated by favourable meteorological conditions conducive to fire spread (low precipitation in the autumn period and pronounced windiness), the fire extended from adjacent agricultural areas to protected zones. The most affected areas were those covered with grass vegetation and reeds. The resulting smoke on the highway also led to a chain collision. Critical periods for fire outbreaks are March–April, July–August, and October–November.
There is a need to intensify penal policy measures in areas where stubble burning is prevalent. This activity poses a significant risk to the environment, and consequently, the health and lives of the population of the AP Vojvodina. In Figure 11a and b, cases of burning plant residues after harvesting are depicted, leading to fires and smoke that threaten traffic safety.
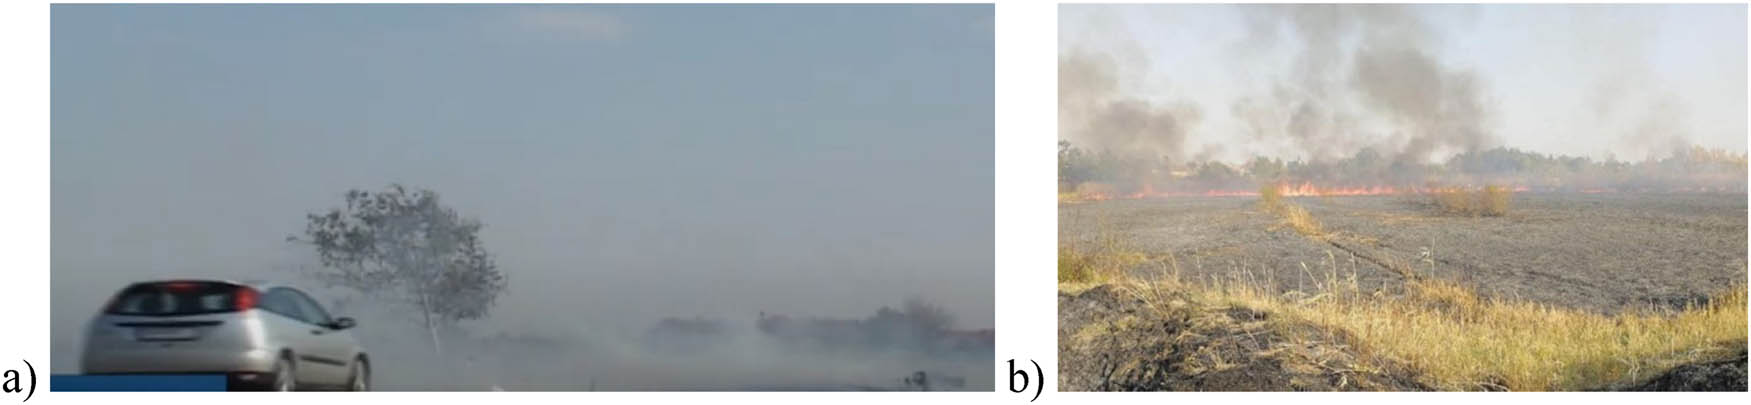
Cases of burning plant residues after harvesting: (a) near the road in Novi Sad and (b) in the Special Nature Reserve Carska Bara. Source: Petra Živić (17.10.2018).
Driving under the influence of alcohol significantly impacts the rising number of road accidents. Data from the Serbian RTSA in 2020 highlighted areas with very high percentages of alcoholised persons, including the municipalities of Pančevo, Zrenjanin, Novi Sad, Kikinda, and Sombor [4]. Municipalities of the Subotica and Sremska Mitrovica recorded very low indicators [4]. Identifying these areas help prioritize interventions to improve road safety.
Daily migration is a dynamic and spatial phenomenon that reshapes the spatial dynamics of a territory [149]. According to Tomašević and Sokolovska [149], in the AP Vojvodina, the proportion of daily migrants traveling outside their municipality exceeds the national average of 44.08% [149,150]. Also, Tomašević and Sokolovska identify three functional regions centred around three cities in the region: Novi Sad, Zrenjanin, and Subotica [149].
The Statistical Office of the Republic of Serbia (Daily Migrants) reports that within the region, 52.29% individuals of the active population work within their own municipality (54,073 men and 36,868 women), 24.19% work outside their municipality (24,576 men and 17,495 women), 23.16% work in another area (26,556 men and 13,730 women), and 0.36% work outside the country (482 men and 137 women) [150]. Figure 12 shows the percentage of daily commuters engaging in employment outside their residing municipality, compared to the overall number of active workers across various municipalities and cities within the study area. The majority of daily migrants working outside their municipality are drawn to the metropolitan area of Novi Sad, encompassing municipalities such as Sremski Karlovci, Temerin, Beočin, Žabalj, and Irig [149]. In Zrenjanin, despite a significant number of daily migrations, they are dispersed, and due to the city's underdevelopment, there is no gravitational zone that could alleviate the depopulation process in the long term [149]. Subotica's migration area is the least developed, resulting in most daily migrations occurring between smaller municipalities, with only a portion directed towards Subotica [149].
![Figure 12
Share of daily migrants who perform an occupation in another municipality. Source: [150], revised by authors.](/document/doi/10.1515/geo-2022-0630/asset/graphic/j_geo-2022-0630_fig_012.jpg)
Share of daily migrants who perform an occupation in another municipality. Source: [150], revised by authors.
Daily migrants studying in another municipality represent a significant portion of the population in Beočin, Temerin, Petrovaradin, and Sremski Karlovci, constituting over 35% of the population [150]. Conversely, in Novi Sad, less than 5% of daily migrants pursue education in another municipality [150]. Figure 13 shows share of daily migrants who go to school or university in another municipality in the total number of pupils and students, by municipalities and cities in the study area. Comparing the geographical distribution of traffic accidents, fatalities, and injuries by participation category (Figure 9) with the distribution of daily migrants (Figure 12 and Figure 13), it is evident that the highest number of traffic accidents occur around the city of Novi Sad, illustrating the correlation between these phenomena.
![Figure 13
Share of daily migrants who go to school/university in another municipality. Source: [150], revised by authors.](/document/doi/10.1515/geo-2022-0630/asset/graphic/j_geo-2022-0630_fig_013.jpg)
Share of daily migrants who go to school/university in another municipality. Source: [150], revised by authors.
The Statistical Office of the Republic of Serbia solely reports data on daily migrations based on the place of residence, posing a significant limitation for sociological analysis of this phenomenon [149]. Therefore, there is a need to collect more detailed information regarding the structural characteristics of daily migrations to facilitate comprehensive analyses of the relationship between daily migrations and traffic accidents in future research.
As previously mentioned, daily migrations in the study area exceed the national average. Therefore, improving road conditions is crucial. This improvement would not only decrease the number of traffic accidents but also reduce fatalities and injuries, thereby lessening road trauma. Figure 14 presents two examples of poor road maintenance in the areas of Subotica (Figure 14a) and Novi Sad (Figure 14b).
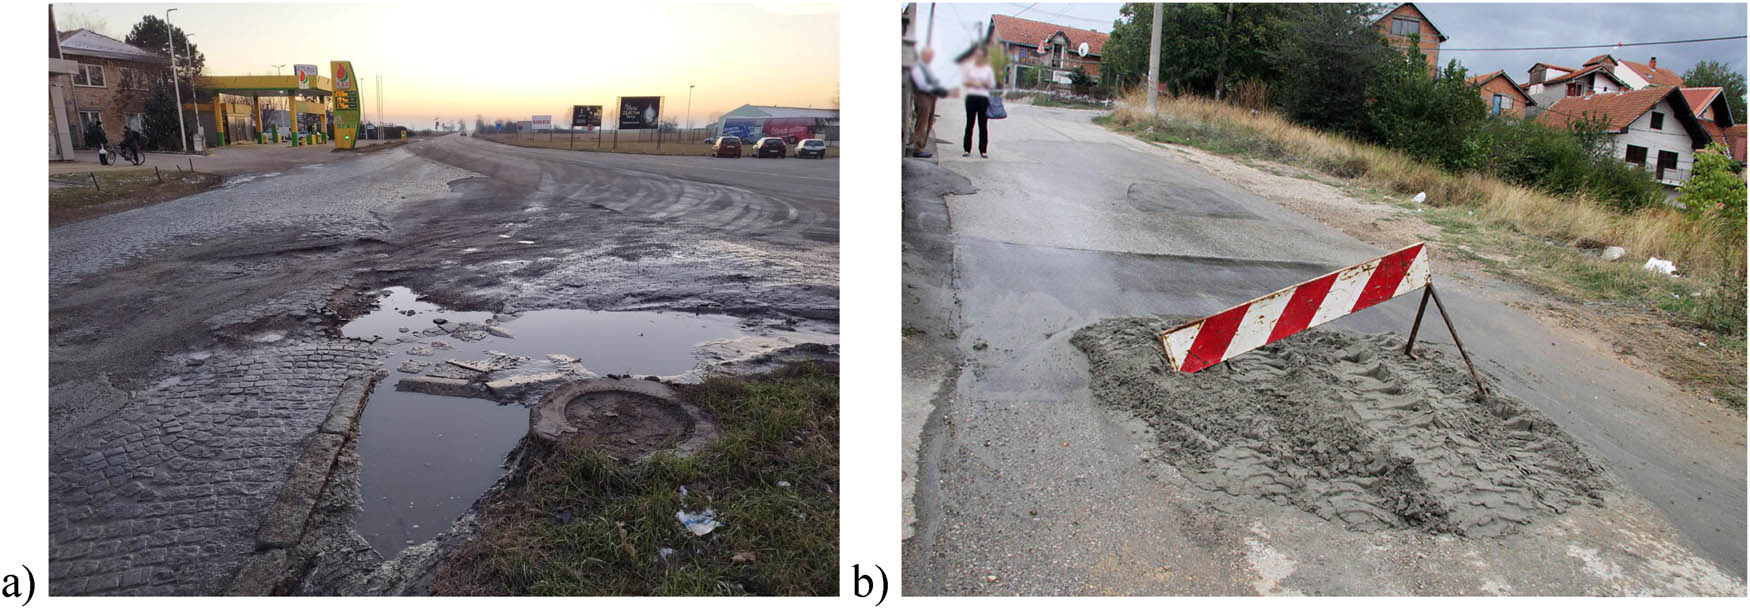
Examples of poor road maintenance in the area of (a) Subotica and (b) Novi Sad. Source: 14a. Authors (12.01.2024), 14b. Dragan Kadić (18.05.2022).
Road trauma stands as one of the leading epidemiological problems worldwide [4]. Unfortunately, there is no organized and systematic monitoring of road trauma in the AP Vojvodina [4,5]. Until 1992, the Provincial Secretariat for Internal Affairs collected relevant data on traffic traumas. However, with its abolition, this responsibility shifted to the Department of the Ministry of Internal Affairs in Novi Sad until 1995 when data collection on traffic traumas ceased entirely [4,5]. The absence of legal provisions regulating the obligation to report the consequences of traffic accidents, along with the lack of institutions organizing the collection, processing, analysis, and storage of data related to traffic trauma, is a notable gap compared to highly developed countries [4,5].
Doctors who treat casualties must commit themselves not only to providing optimum care but also to becoming equally involved in the epidemiological and sociological aspects of road trauma prevention [151]. The prevention of trauma requires a threefold approach: prevent the traffic accident, prevent injury in it, and prevent injury aggravation after the traffic accident [151].
Training for teams managing trauma care is vital. It is generally acknowledged that the standard for such training in high-income countries is the Advanced Trauma Life Support course of the American College of Surgeons [152]. However, the applicability of this course to low-income and middle-income countries is yet to be established [152]. In Trinidad and Tobago, for instance, the introduction of the Advanced Trauma Life Support course for doctors and the Pre-Hospital Trauma Life Support course for paramedics, together with improved emergency equipment, led to improvements in trauma care and a decrease in trauma mortality, both in the field and in hospital [152,153]. Rehabilitation services are an essential component of the comprehensive package of initial and post-hospital care of the injured. They help minimize future functional disabilities and restore the injured person to an active life within society [152].
Despite these valuable findings, the study has limitations, mainly due to the use of publicly available municipal-level data. The inability to access precise accident locations, occurrence time frames, and other characteristics hindered a more comprehensive analysis.
This type of analysis, utilizing GIS-based hotspot analysis, can serve as a crucial tool for road authorities in decision-making and holds potential for future improvements. Advanced GIS applications contribute to a better understanding of accident features, aiding efforts to make roads safer over the past half-century.
Potential next steps for enhancing road safety include the development of a national crash hotspot (blackspot) identification manual, regular spatial and temporal mapping of crash patterns, training safety engineers in crash hotspot identification methodologies, and adopting GIS technology advancements [23]. Based on the obtained results, it is crucial for relevant authorities to take appropriate actions at identified hotspots [154]. Effective road safety management has the potential to reduce the number of road accidents, fatalities, and injuries, leading to cost savings [4,155]. In developed countries, good habits of safe cycling are taught at a young age, which is certainly not the case in the territory of the AP Vojvodina [4,5].
In order to achieve a downward trend in accident mortality and establish a stable road safety system in the future, funds allocated for improving road safety must be directed towards implementing measures that have the most significant impact on enhancing the current situation [4,156].
The protective measures that can be applied encompass:
Primary prevention measures (they aim to prevent the occurrence of road accidents);
Secondary prevention measures (they aim to mitigate the severity of accidents);
Improvement of road and environmental elements;
Tertiary prevention measures (they aim to mitigate the consequences of accidents that have already occurred);
First aid;
Transport;
Treatment and rehabilitation; and
Identifying hotspots where traffic accidents cluster would facilitate the definition and implementation of measures to prevent road trauma in vulnerable areas. Local self-governments should collaborate more closely with police administrations and relevant epidemiological services of health institutions in the AP Vojvodina to adapt and intensify the road trauma prevention program. Establishing a unified system for registering and monitoring road accident victims is crucial for gaining insight into the number of victims and their clinical conditions, ultimately impacting the establishment of protective measures.
The balance between prevention on the one hand and investigation and procedure on the other needs to be addressed [151]. Productive research adequately funded is essential if prevention initiatives are to succeed in reducing the incidence of injury in road [151].
Detecting long-term trends in crashes or casualties in these focus areas could significantly influence future roadway safety management [14]. Understanding these trends is likely to affect the planning process for safety countermeasures and can facilitate future safety budget planning [14]. The lack of financial resources remains a limiting factor in reviewing existing and introducing new road safety measures, necessitating a more intensive search for incentives. A punitive policy towards negligent drivers and increased fines for traffic violations could help reduce the number of road accidents, fatalities, and injuries. Implementing these measures would not only improve public health in the AP Vojvodina but also reduce the financial costs associated with treating patients and repairing vehicles.
The adoption of newer legislation has contributed to a decline in the number of people killed in road accidents. The implementation of the Road Traffic Safety Strategy has further contributed to the reduction in both deaths and injuries. This is evident from the fact that the number of registered vehicles has more than doubled from 1990 to 2019, while the number of road accidents has decreased almost fourfold.
5 Conclusion
Utilizing the Getis-Ord
Future research should focus on investigating the locations of traffic accidents using x and y coordinates to identify hotspots through dot displays. Consequently, it is recommended to publicly release statistical data related to road accident characteristics, enabling more sophisticated geographical analyses. Collaborative efforts involving experts from diverse disciplines should be encouraged to collectively shape new road safety strategies or adapt existing ones. Such collaborative research endeavours could significantly enhance road safety by directing targeted protective measures to identified hotspots, consequently reducing the overall number of road accidents and, in turn, diminishing traffic fatalities and injuries.
Acknowledgements
This study was supported by the Ministry of Education, Science and Technological Development of the Republic of Serbia (Contract numbers 451-03-68/2022-14/200091 and 451-03-68/2022-14/200125).
-
Funding information: This research received no external funding that has supported the work.
-
Author contributions: Conceptualization and methodology: E. K. and T. L.; Formal analysis: E. K., T. L., Z. K., T. S., A. S. M., and V. S.; GIS software and mapping: Z. K.; Technical editing: E. K. and Z. K.; Supervision: T. L.; All authors discussed the results and contributed to the final manuscript. All authors have read and agreed to the published version of the manuscript.
-
Conflict of interest: Authors state no conflict of interest.
-
Data availability statement: All results are presented through tables entries.
References
[1] World Health Organization. Global status report on road safety 2013: Supporting a decade of action. Geneva: World Health Organization; 2013.Suche in Google Scholar
[2] World Health Organization. World Report on Road Traffic Injury Prevention. Geneva: World Health Organization; 2004.Suche in Google Scholar
[3] Sanayei R, Vafainejad AR, Karami J, Aghamohammadi H. Traffic collision time series analysis (A case study of Karaj–Qazvin freeway). The International Archives of the Photogrammetry, Remote Sensing and Spatial Information Sciences. GeoSpatial Conference 2019 – Joint Conferences of SMPR and GI Research. Karaj: 2019. 10.5194/isprs-archives-XLII-4-W18-941-2019.Suche in Google Scholar
[4] Kričković E. The influence of geographical and medical factors on the health of the population of AP Vojvodina. PhD thesis. University of Belgrade. Belgrade: Faculty of Geography; 2022.Suche in Google Scholar
[5] Đurić P, Miladinov-Mikov M. Epidemiological charachteristics of road traffic injuries in AP Vojvodina. Med Pregl. 2009;LXII (1–2):17–22. (in Serbian with English summary) 10.2298/MPNS09020170.Suche in Google Scholar
[6] World Health Organization. Global Status Report on Road Safety, Supporting a Decade of Action. Geneva: World Health Organization; 2013.Suche in Google Scholar
[7] Bačkalić S, Matović B, Bašić A. The time-space approach in the analyis of traffic safety on rural road. Rom J Transp Infrastruc. 2017;6(1):66–76. 10.1515/rjti-20.Suche in Google Scholar
[8] World Health Organization. Global status report on road safety: time for action. Geneva: World Health Organization; 2009.Suche in Google Scholar
[9] World Health Organization. Road traffic injuries. 2023. https://www.who.int/news-room/fact-sheets/detail/road-traffic-injuries.Suche in Google Scholar
[10] Lović Obradović S, Rabiei-Dastjerdi H, Matović S. Identifying spatiotemporal variability of traffic accident mortality. Evidence from the City of Belgrade, Serbia. Central European Journal of Geography and Sustainable Development. 2022;4(2):78–93. 10.47246/CEJGSD.2022.4.2.5.Suche in Google Scholar
[11] The World Bank. Mortality caused by road traffic injury (per 100,000 population). 2023. https://data.worldbank.org/indicator/SH.STA.TRAF.P5.Suche in Google Scholar
[12] The International Transport Forum (ITF). Road Safety Annual Report 2022. Paris: OECD Publishing; 2022.Suche in Google Scholar
[13] Ngwira GM, Bolaane B, Parida BP. Investigating the trend of road traffic fatalities in Malawi using Mann-Kendall statistic. Heliyon. 2023;9(2):e13700. 10.1016/j.heliyon.2023.e13700.Suche in Google Scholar PubMed PubMed Central
[14] Hossain A, Rahman A, Sun X. Roadway crash trend analysis with Innovative Trend Analysis and Mann-Kendall Test. Southeast Symposium on Contemporary Engineering Topics 2022. Little Rock, Arkansas: 2022.Suche in Google Scholar
[15] Peltzman S. The effects of automobile safety regulation. J Polit Econ. 1975;83(4):677–726.10.1086/260352Suche in Google Scholar
[16] Bačkalić S. Temporal analysis of the traffic accidents occurence in Province of Vojvodina. Transp Probl. 2013;8(1):87–93.Suche in Google Scholar
[17] Erdoğan S, Dereli MA, Şenol HIA. GIS‑based assessment of long‑term traffic accidents using spatiotemporal and empirical Bayes analysis in Turkey. Appl Geomat. 2022;14:147–62. 10.1007/s12518-022-00419-1.Suche in Google Scholar
[18] Pljakić M, Basarić Đ, Gugleta S. Spatial clustering of traffic analysis zone: a case study from Novi Sad, Serbia. XIV International Symposium “Road accidents prevention 2018. Novi Sad; 2018.Suche in Google Scholar
[19] Cheng Z, Zu Z, Lu J. Traffic crash evolution characteristic analysis and spatiotemporal hotspot identification of Urban road intersections. Sustainability-Basel. 2019;11(1):160. 10.3390/su11010160.Suche in Google Scholar
[20] Hazaymeh K, Almagbile A, Alomari AH. Spatiotemporal analysis of traffic accidents hotspots based on geospatial techniques. ISPRS Int J Geo-Inf. 2022;11:260. 10.3390/ijgi11040260.Suche in Google Scholar
[21] Prasannakumar V, Vijith H, Charutha R, Geetha N. Spatio-temporal clustering of road accidents: GIS based analysis and assessment. Procd Soc Behv. 2011;21:317–25. 10.1016/j.sbspro.2011.07.020.Suche in Google Scholar
[22] Afolayan A, Easa SM, Abiola OS, Alayaki FM, Folorunso AM. GIS-based spatial analysis of accident hotspots: A Nigerian case study. Infrastructures. 2022;7(8):103–126. 10.3390/infrastructures7080103.Suche in Google Scholar
[23] Alam MS, Tabassum NJ. Spatial pattern identification and crash severity analysis of road traffic crash hot spots in Ohio. Heliyon. 2023;9(5):e16303. 10.1016/j.heliyon.2023.e16303.Suche in Google Scholar PubMed PubMed Central
[24] Miljuš S, Pešiđ A, Miljković B, Panić I, Kovač M. Statistical report on the state of road traffic safety in the Republic of Serbia for 2021. Belgrade: Road Traffic Safety Agency Republic of Serbia; 2022.Suche in Google Scholar
[25] Official Gazette of the Republic of Serbia (no. 41/2009, 53/2010, 101/2011, 32/2013, 55/2014, 96/2015 - other laws, 9/2016 – US decision, 24/2018, 41/2018, 41/2018 - other laws, 87/2018, 23/2019 and128/2020 - other laws). Law on Road Traffic Safety. http://demo.paragraf.rs/WebParagrafDemo/?actid=104239.Suche in Google Scholar
[26] Official Gazette of the Republic of Serbia (no. 64/2015). Strategy traffic safety on the roads of the Republic of Serbia for the period from 2015 to 2020.Suche in Google Scholar
[27] Jović Vraneš A, Kosanovic V. Road traffic accidents in Serbia in 1999–2014. Eur J Public Health. 2016;26(1):ckw175.065. 10.1093/eurpub/ckw175.065.Suche in Google Scholar
[28] Petrović A, Jovanović D, Stojanović P. Changes in the number of traffic accidents fatalities in the republic of Serbia. Tehnika–Saobraćaj. 2020;67(4):479–84.10.5937/tehnika2004479PSuche in Google Scholar
[29] Sentić I, Đorđević T. Understanding physical environment through safe highway transport mobility with special review on climate – the highway route Belgrade–Novi Sad, Serbia. Geogr Pannonica. 2019;23(1):1–13. 10.5937/gp23-19285.Suche in Google Scholar
[30] Sentić I, Đorđević T, Đorđević J, Ljubojević M, Čukanović J. Understanding the influence of climate elements on traffic: the wind impact approach. Theor Appl Climatol. 2022;149:661–81. 10.1007/s00704-022-04067-8.Suche in Google Scholar
[31] Data from the Chamber of Commerce of Vojvodina: Traffic, 2004. https://pkv.rs/saobracaj/.Suche in Google Scholar
[32] Kričković E, Jovanović-Popović D. Using the DPSEEA model in the research of the connection between air pollution and the health of the population in the territory of AP Vojvodina. Proceedings of the eleventh scientific-expert meeting with international participation "Planning and normative protection of space and environment. Belgrade: 2021.Suche in Google Scholar
[33] Statistical Office of the Republic of Serbia Report: Registered road motor and trailer vehicles and traffic accidents on the roads 2019; 2020. https://www.stat.gov.rs/en-US/vesti/20200309-registrovana-drumska-motorna-i-prikljucna-vozila-i-saobracajne-nezgode-na-putevima-2019/?a=0&s=1801.Suche in Google Scholar
[34] Kričković E, Lukić T, Jovanović-Popović D. Geographic medical overview of noncommunicable diseases (cardiovascular diseases and diabetes) in the territory of the AP Vojvodina (Northern Serbia). Healthcare. 2023;11(1):48. 10.3390/healthcare11010048.Suche in Google Scholar PubMed PubMed Central
[35] Čvoro J, Golubović P. Geography of Yugoslavia. Belgrade: National Library of Serbia; 2001.Suche in Google Scholar
[36] Tomić P, Romelić J, Kicošev S, Lazić L. Population of Vojvodina. 2nd edn. Novi Sad: Association of Geographers of Vojvodina; 2004.Suche in Google Scholar
[37] Stojanović M. The influence of relief on the climate of Vojvodina. Master thesis. University of Niš, Faculty of Science. Department of Geography Niš; 2020.Suche in Google Scholar
[38] Proroković D. Threats to regional security and consequences for the geopolitical position of Vojvodina. In: Despotović L, Ivančević G, editors. Culture of Polis, Journal for Fostering a Democratic Political Structure, Special ed. Vojvodina as a potential geopolitical focal point in the Republic of Serbia. Vol. 15, Issue 1. Novi Sad and Belgrade: Culture – Polis and Institute for European Studies; 2018. p. 25–38.Suche in Google Scholar
[39] Statistical Office of the Republic of Serbia Report: 2022 Census of Population, Households and Dwellings. Ethnicity. Data by municipalities and cities; 2023. https://publikacije.stat.gov.rs/G2023/Pdf/G20234001.pdf.Suche in Google Scholar
[40] Rodić D. Geography of Yugoslavia I. Belgrade: Scientific book; 1970.Suche in Google Scholar
[41] JP Institute for Urban Planning of Vojvodina: Analysis of the economic and social status of marginalized settlements in the border areas of AP Vojvodina. JP Institute for Urban Planning of Vojvodina, 2013 http://www.zavurbvo.rs/images/codex/analiza_ekonomskog_i_socijalnog_statusa_marginalizovanih_obl.pdf.Suche in Google Scholar
[42] Malinović-Milićević S. Monitoring of non-ionizing radiation, pollutants and heat indices in the region of Vojvodina. PhD thesis. University of Novi Sad, Faculty of Science, Department of Geography, Tourism and Hotel Management. Novi Sad; 2012.Suche in Google Scholar
[43] Public Enterprise roads of Serbia: Reference system, 2023. https://www.putevi-srbije.rs/index.php/peфepeнтни-cиcтeм.Suche in Google Scholar
[44] Petrović D. Geopolitical position of Vojvodina within Serbia; Historical and demographic analysis, relations in the environment. Culture of the polis, Journal for fostering a democratic political structure. Special issue, Vojvodina as a potential geopolitical focal point in the Republic of Serbia 2018;1:59–72.Suche in Google Scholar
[45] Ivkov A. Population as a factor in the development of tourism in Vojvodina. PhD thesis. University of Novi Sad, Faculty of Science, Department of Geography, Tourism and Hotel Management. Novi Sad: 2005.Suche in Google Scholar
[46] Lutovac M. Geographical determinants of the regional development of Vojvodina. PhD thesis. University of Belgrade, Faculty of Geography. Belgrade; 2016.Suche in Google Scholar
[47] Road Traffic Safety Agency Republic of Serbia Report: Report on the basic indicators of the state of traffic safety in the period from 2011 to 2015. Municipality of Ada, 2018 https://www.abs.gov.rs/admin/upload/documents/20180619093935-ada.pdf.Suche in Google Scholar
[48] Road Traffic Safety Agency Republic of Serbia Report: Report on the basic indicators of the state of traffic safety in the period from 2011 to 2015. Municipality of Alibunar, 2018 https://www.abs.gov.rs/admin/upload/documents/20180619093911-alibunar.pdf.Suche in Google Scholar
[49] Road Traffic Safety Agency Republic of Serbia Report: Report on the basic indicators of the state of traffic safety in the period from 2011 to 2015. Municipality of Apatin, 2018 https://www.abs.gov.rs/admin/upload/documents/20180619093904-apatin.pdf.Suche in Google Scholar
[50] Road Traffic Safety Agency Republic of Serbia Report: Report on the basic indicators of the state of traffic safety in the period from 2011 to 2015. Municipality of Bač, 2018 https://www.abs.gov.rs/admin/upload/documents/20180619093836-bac.pdf.Suche in Google Scholar
[51] Road Traffic Safety Agency Republic of Serbia Report: Report on the basic indicators of the state of traffic safety in the period from 2011 to 2015. Municipality of Bačka Palanka, 2018 https://www.abs.gov.rs/admin/upload/documents/20180619093830-backa-palanka.pdf.Suche in Google Scholar
[52] Road Traffic Safety Agency Republic of Serbia Report: Report on the basic indicators of the state of traffic safety in the period from 2011 to 2015. Municipality of Bačka Topola, 2018 https://www.abs.gov.rs/admin/upload/documents/20180619093823-backa-topola.pdf.Suche in Google Scholar
[53] Road Traffic Safety Agency Republic of Serbia Report: Report on the basic indicators of the state of traffic safety in the period from 2011 to 2015. Municipality of Bački Petrovac, 2018 https://www.abs.gov.rs/admin/upload/documents/20180619093815-backi-petrovac.pdf.Suche in Google Scholar
[54] Road Traffic Safety Agency Republic of Serbia Report: Report on the basic indicators of the state of traffic safety in the period from 2011 to 2015. Municipality of Bela Crkva, 2018 https://www.abs.gov.rs/admin/upload/documents/20180619093716-bela-crkva.pdf.Suche in Google Scholar
[55] Road Traffic Safety Agency Republic of Serbia Report: Report on the basic indicators of the state of traffic safety in the period from 2011 to 2015. Municipality of Beočin, 2018 https://www.abs.gov.rs/admin/upload/documents/20180619093645-beocin.pdf.Suche in Google Scholar
[56] Road Traffic Safety Agency Republic of Serbia Report: Report on the basic indicators of the state of traffic safety in the period from 2011 to 2015. Municipality of Bečej, 2018 https://www.abs.gov.rs/admin/upload/documents/20180619093746-becej.pdf.Suche in Google Scholar
[57] Road Traffic Safety Agency Republic of Serbia Report: Report on the basic indicators of the state of traffic safety in the period from 2011 to 2015. Municipality of Vrbas, 2018 https://www.abs.gov.rs/admin/upload/documents/20180619085932-vrbas.pdf.Suche in Google Scholar
[58] Road Traffic Safety Agency Republic of Serbia Report: Report on the basic indicators of the state of traffic safety in the period from 2011 to 2015. The city of Vršac, 2018 https://www.abs.gov.rs/admin/upload/documents/20180619085916-vrsac.pdf.Suche in Google Scholar
[59] Road Traffic Safety Agency Republic of Serbia Report: Report on the basic indicators of the state of traffic safety in the period from 2011 to 2015. Municipality of Žabalj, 2018 https://www.abs.gov.rs/admin/upload/documents/20180619085909-zabalj.pdf.Suche in Google Scholar
[60] Road Traffic Safety Agency Republic of Serbia Report: Report on the basic indicators of the state of traffic safety in the period from 2011 to 2015. Municipality of Žitište, 2018 https://www.abs.gov.rs/admin/upload/documents/20180619085831-zitiste.pdf.Suche in Google Scholar
[61] Road Traffic Safety Agency Republic of Serbia Report: Report on the basic indicators of the state of traffic safety in the period from 2011 to 2015. The city of Zrenjanin, 2018 https://www.abs.gov.rs/admin/upload/documents/20180619085815-zrenjanin.pdf.Suche in Google Scholar
[62] Road Traffic Safety Agency Republic of Serbia Report: Report on the basic indicators of the state of traffic safety in the period from 2011 to 2015. Municipality of Inđija, 2018 https://www.abs.gov.rs/admin/upload/documents/20180619093303-indjija.pdf.Suche in Google Scholar
[63] Road Traffic Safety Agency Republic of Serbia Report: Report on the basic indicators of the state of traffic safety in the period from 2011 to 2015. Municipality of Irig, 2018 https://www.abs.gov.rs/admin/upload/documents/20180619093254-irig.pdf.Suche in Google Scholar
[64] Road Traffic Safety Agency Republic of Serbia Report: Report on the basic indicators of the state of traffic safety in the period from 2011 to 2015. Municipality of Kanjiža, 2018 https://www.abs.gov.rs/admin/upload/documents/20180619092702-kanjiza.pdf.Suche in Google Scholar
[65] Road Traffic Safety Agency Republic of Serbia Report: Report on the basic indicators of the state of traffic safety in the period from 2011 to 2015. The city of Kikinda, 2018 https://www.abs.gov.rs/admin/upload/documents/20180619092650-kikinda.pdf.Suche in Google Scholar
[66] Road Traffic Safety Agency Republic of Serbia Report: Report on the basic indicators of the state of traffic safety in the period from 2011 to 2015. Municipality of Kovačica, 2018 https://www.abs.gov.rs/admin/upload/documents/20180619092542-kovacica.pdf.Suche in Google Scholar
[67] Road Traffic Safety Agency Republic of Serbia Report: Report on the basic indicators of the state of traffic safety in the period from 2011 to 2015. Municipality of Kovin, 2018 https://www.abs.gov.rs/admin/upload/documents/20180619092530-kovin.pdf.Suche in Google Scholar
[68] Road Traffic Safety Agency Republic of Serbia Report: Report on the basic indicators of the state of traffic safety in the period from 2011 to 2015. Municipality of Kula, 2018 https://www.abs.gov.rs/admin/upload/documents/20180619092402-kula.pdf.Suche in Google Scholar
[69] Road Traffic Safety Agency Republic of Serbia Report: Report on the basic indicators of the state of traffic safety in the period from 2011 to 2015. Municipality of Mali Iđoš, 2018 https://www.abs.gov.rs/admin/upload/documents/20180619092138-mali-idjos.pdf.Suche in Google Scholar
[70] Road Traffic Safety Agency Republic of Serbia Report: Report on the basic indicators of the state of traffic safety in the period from 2011 to 2015. Municipality of Novi Bečej, 2018 https://www.abs.gov.rs/admin/upload/documents/20180619091820-novi-becej.pdf.Suche in Google Scholar
[71] Road Traffic Safety Agency Republic of Serbia Report: Report on the basic indicators of the state of traffic safety in the period from 2011 to 2015. Municipality of Novi Kneževac, 2018 https://www.abs.gov.rs/admin/upload/documents/20180619091717-novi-knezevac.pdf.Suche in Google Scholar
[72] Road Traffic Safety Agency Republic of Serbia Report: Report on the basic indicators of the state of traffic safety in the period from 2011 to 2015. The city of Novi Sad, 2018 https://www.abs.gov.rs/admin/upload/documents/20180619091654-novi-sad.pdf.Suche in Google Scholar
[73] Road Traffic Safety Agency Republic of Serbia Report: Report on the basic indicators of the state of traffic safety in the period from 2011 to 2015. Municipality of Opovo, 2018 https://www.abs.gov.rs/admin/upload/documents/20180619091620-opovo.pdf.Suche in Google Scholar
[74] Road Traffic Safety Agency Republic of Serbia Report: Report on the basic indicators of the state of traffic safety in the period from 2011 to 2015. Municipality of Odžaci, 2018 https://www.abs.gov.rs/admin/upload/documents/20180619091634-odzaci.pdf.Suche in Google Scholar
[75] Road Traffic Safety Agency Republic of Serbia Report: Report on the basic indicators of the state of traffic safety in the period from 2011 to 2015. The city of Pančevo, 2018 https://www.abs.gov.rs/admin/upload/documents/20180619091543-pancevo.pdf.Suche in Google Scholar
[76] Road Traffic Safety Agency Republic of Serbia Report: Report on the basic indicators of the state of traffic safety in the period from 2011 to 2015. Municipality of Pećinci, 2018 https://www.abs.gov.rs/admin/upload/documents/20180619091521-pecinci.pdf.Suche in Google Scholar
[77] Road Traffic Safety Agency Republic of Serbia Report: Report on the basic indicators of the state of traffic safety in the period from 2011 to 2015. Municipality of Plandište, 2018 https://www.abs.gov.rs/admin/upload/documents/20180619091428-plandiste.pdf.Suche in Google Scholar
[78] Road Traffic Safety Agency Republic of Serbia Report: Report on the basic indicators of the state of traffic safety in the period from 2011 to 2015. Municipality of Ruma, 2018 https://www.abs.gov.rs/admin/upload/documents/20180619091209-ruma.pdf.Suche in Google Scholar
[79] Road Traffic Safety Agency Republic of Serbia Report: Report on the basic indicators of the state of traffic safety in the period from 2011 to 2015. Municipality of Senta, 2018 https://www.abs.gov.rs/admin/upload/documents/20180619091120-senta.pdf.Suche in Google Scholar
[80] Road Traffic Safety Agency Republic of Serbia Report: Report on the basic indicators of the state of traffic safety in the period from 2011 to 2015. Municipality of Sečanj, 2018 https://www.abs.gov.rs/admin/upload/documents/20180619091128-secanj.pdf.Suche in Google Scholar
[81] Road Traffic Safety Agency Republic of Serbia Report: Report on the basic indicators of the state of traffic safety in the period from 2011 to 2015. The city of Sombor, 2018 https://www.abs.gov.rs/admin/upload/documents/20180619091020-sombor.pdf.Suche in Google Scholar
[82] Road Traffic Safety Agency Republic of Serbia Report: Report on the basic indicators of the state of traffic safety in the period from 2011 to 2015. Municipality of Srbobran, 2018 https://www.abs.gov.rs/admin/upload/documents/20180619090959-srbobran.pdf.Suche in Google Scholar
[83] Road Traffic Safety Agency Republic of Serbia Report: Report on the basic indicators of the state of traffic safety in the period from 2011 to 2015. The city of of Sremska Mitrovica, 2018 https://www.abs.gov.rs/admin/upload/documents/20180619090950-sremska-mitrovica.pdf.Suche in Google Scholar
[84] Road Traffic Safety Agency Republic of Serbia Report: Report on the basic indicators of the state of traffic safety in the period from 2011 to 2015. Municipality of Sremski Karlovci, 2018 https://www.abs.gov.rs/admin/upload/documents/20180619090939-sremski-karlovci.pdf.Suche in Google Scholar
[85] Road Traffic Safety Agency Republic of Serbia Report: Report on the basic indicators of the state of traffic safety in the period from 2011 to 2015. Municipality of Stara Pazova, 2018 https://www.abs.gov.rs/admin/upload/documents/20180619090929-stara-pazova.pdf.Suche in Google Scholar
[86] Road Traffic Safety Agency Republic of Serbia Report: Report on the basic indicators of the state of traffic safety in the period from 2011 to 2015. The city of Subotica, 2018 https://www.abs.gov.rs/admin/upload/documents/20180619090759-subotica.pdf.Suche in Google Scholar
[87] Road Traffic Safety Agency Republic of Serbia Report: Report on the basic indicators of the state of traffic safety in the period from 2011 to 2015. Municipality of Temerin, 2018 https://www.abs.gov.rs/admin/upload/documents/20180619090416-temerin.pdf.Suche in Google Scholar
[88] Road Traffic Safety Agency Republic of Serbia Report: Report on the basic indicators of the state of traffic safety in the period from 2011 to 2015. Municipality of Titel, 2018 https://www.abs.gov.rs/admin/upload/documents/20180619090407-titel.pdf.Suche in Google Scholar
[89] Road Traffic Safety Agency Republic of Serbia Report: Report on the basic indicators of the state of traffic safety in the period from 2011 to 2015. Municipality of Šid, 2018 https://www.abs.gov.rs/admin/upload/documents/20180619091111-sid.pdf.Suche in Google Scholar
[90] Road Traffic Safety Agency Republic of Serbia Report: Report on the basic indicators of the state of traffic safety in the period from 2011 to 2015. Municipality of Čoka, 2018 https://www.abs.gov.rs/admin/upload/documents/20180619093453-coka.pdf.Suche in Google Scholar
[91] Road Traffic Safety Agency Republic of Serbia Report: Report on the basic indicators of the state of traffic safety in the period from 2016 to 2020. Municipality of Ada, 2021 https://abs.gov.rs/admin/upload/documents/20210714112034-ada.pdf.Suche in Google Scholar
[92] Road Traffic Safety Agency Republic of Serbia Report: Report on the basic indicators of the state of traffic safety in the period from 2016 to 2020. Municipality of Alibunar, 2021 https://abs.gov.rs/admin/upload/documents/20210714112006-alibunar.pdf.Suche in Google Scholar
[93] Road Traffic Safety Agency Republic of Serbia Report: Report on the basic indicators of the state of traffic safety in the period from 2016 to 2020. Municipality of Apatin, 2021 https://abs.gov.rs/admin/upload/documents/20210714111958-apatin.pdf.Suche in Google Scholar
[94] Road Traffic Safety Agency Republic of Serbia Report: Report on the basic indicators of the state of traffic safety in the period from 2016 to 2020. Municipality of Bač, 2021 https://abs.gov.rs/admin/upload/documents/20210714111844-bac.pdf.Suche in Google Scholar
[95] Road Traffic Safety Agency Republic of Serbia Report: Report on the basic indicators of the state of traffic safety in the period from 2016 to 2020. Municipality of Bačka Palanka, 2021 https://abs.gov.rs/admin/upload/documents/20210714111836-backa-palanka.pdf.Suche in Google Scholar
[96] Road Traffic Safety Agency Republic of Serbia Report: Report on the basic indicators of the state of traffic safety in the period from 2016 to 2020. Municipality of Bačka Topola, 2021 https://abs.gov.rs/admin/upload/documents/20210714111823-backa-topola.pdf.Suche in Google Scholar
[97] Road Traffic Safety Agency Republic of Serbia Report: Report on the basic indicators of the state of traffic safety in the period from 2016 to 2020. Municipality of Bački Petrovac, 2021 https://abs.gov.rs/admin/upload/documents/20210714111728-backi-petrovac.pdf.Suche in Google Scholar
[98] Road Traffic Safety Agency Republic of Serbia Report: Report on the basic indicators of the state of traffic safety in the period from 2016 to 2020. Municipality of Bela Crkva, 2021 https://abs.gov.rs/admin/upload/documents/20210714111657-bela-crkva.pdf.Suche in Google Scholar
[99] Road Traffic Safety Agency Republic of Serbia Report: Report on the basic indicators of the state of traffic safety in the period from 2016 to 2020. Municipality of Beočin, 2021 https://abs.gov.rs/admin/upload/documents/20210714111649-beocin.pdf.Suche in Google Scholar
[100] Road Traffic Safety Agency Republic of Serbia Report: Report on the basic indicators of the state of traffic safety in the period from 2016 to 2020. Municipality of Bečej, 2021 https://abs.gov.rs/admin/upload/documents/20210714111638-becej.pdf.Suche in Google Scholar
[101] Road Traffic Safety Agency Republic of Serbia Report: Report on the basic indicators of the state of traffic safety in the period from 2016 to 2020. Municipality of Vrbas, 2021 https://abs.gov.rs/admin/upload/documents/20210714111323-vrbas.pdf.Suche in Google Scholar
[102] Road Traffic Safety Agency Republic of Serbia Report: Report on the basic indicators of the state of traffic safety in the period from 2016 to 2020. The city of Vršac, 2021 https://abs.gov.rs/admin/upload/documents/20210714111303-vrsac.pdf.Suche in Google Scholar
[103] Road Traffic Safety Agency Republic of Serbia Report: Report on the basic indicators of the state of traffic safety in the period from 2016 to 2020. Municipality of Žabalj, 2021 https://abs.gov.rs/admin/upload/documents/20210714111149-zabalj.pdf.Suche in Google Scholar
[104] Road Traffic Safety Agency Republic of Serbia Report: Report on the basic indicators of the state of traffic safety in the period from 2016 to 2020. Municipality of Žitište, 2021 https://abs.gov.rs/admin/upload/documents/20210714111124-itiste.pdf.Suche in Google Scholar
[105] Road Traffic Safety Agency Republic of Serbia Report: Report on the basic indicators of the state of traffic safety in the period from 2016 to 2020. The city of Zrenjanin, 2021 https://abs.gov.rs/admin/upload/documents/20210714111016-zrenjanin.pdf.Suche in Google Scholar
[106] Road Traffic Safety Agency Republic of Serbia Report: Report on the basic indicators of the state of traffic safety in the period from 2016 to 2020. Municipality of Inđija, 2021 https://abs.gov.rs/admin/upload/documents/20210714110943-indjija.pdf.Suche in Google Scholar
[107] Road Traffic Safety Agency Republic of Serbia Report: Report on the basic indicators of the state of traffic safety in the period from 2016 to 2020. Municipality of Irig, 2021 https://abs.gov.rs/admin/upload/documents/20210714110930-irig.pdf.Suche in Google Scholar
[108] Road Traffic Safety Agency Republic of Serbia Report: Report on the basic indicators of the state of traffic safety in the period from 2016 to 2020. Municipality of Kanjiža, 2021 https://abs.gov.rs/admin/upload/documents/20210714110911-kanjiza.pdf.Suche in Google Scholar
[109] Road Traffic Safety Agency Republic of Serbia Report: Report on the basic indicators of the state of traffic safety in the period from 2016 to 2020. The city of Kikinda, 2021 https://abs.gov.rs/admin/upload/documents/20210714110852-kikinda.pdf.Suche in Google Scholar
[110] Road Traffic Safety Agency Republic of Serbia Report: Report on the basic indicators of the state of traffic safety in the period from 2016 to 2020. Municipality of Kovačica, 2021 https://abs.gov.rs/admin/upload/documents/20210714110742-kovacica.pdf.Suche in Google Scholar
[111] Road Traffic Safety Agency Republic of Serbia Report: Report on the basic indicators of the state of traffic safety in the period from 2016 to 2020. Municipality of Kovin, 2021 https://abs.gov.rs/admin/upload/documents/20210714110734-kovin.pdf.Suche in Google Scholar
[112] Road Traffic Safety Agency Republic of Serbia Report: Report on the basic indicators of the state of traffic safety in the period from 2016 to 2020. Municipality of Kula, 2021 https://abs.gov.rs/admin/upload/documents/20210714110619-kula.pdf.Suche in Google Scholar
[113] Road Traffic Safety Agency Republic of Serbia Report: Report on the basic indicators of the state of traffic safety in the period from 2016 to 2020. Municipality of Mali Iđoš, 2021 https://abs.gov.rs/admin/upload/documents/20210714110351-mali-idjos.pdf.Suche in Google Scholar
[114] Road Traffic Safety Agency Republic of Serbia Report: Report on the basic indicators of the state of traffic safety in the period from 2016 to 2020. Municipality of Novi Bečej, 2021 https://abs.gov.rs/admin/upload/documents/20210714105058-novi-becej.pdf.Suche in Google Scholar
[115] Road Traffic Safety Agency Republic of Serbia Report: Report on the basic indicators of the state of traffic safety in the period from 2016 to 2020. Municipality of Novi Kneževac, 2021 https://abs.gov.rs/admin/upload/documents/20210714105041-novi-knezevac.pdf.Suche in Google Scholar
[116] Road Traffic Safety Agency Republic of Serbia Report: Report on the basic indicators of the state of traffic safety in the period from 2016 to 2020. The city of Novi Sad, 2021 https://abs.gov.rs/admin/upload/documents/20210714105018-novi-sad.pdf.Suche in Google Scholar
[117] Road Traffic Safety Agency Republic of Serbia Report: Report on the basic indicators of the state of traffic safety in the period from 2016 to 2020. Municipality of Opovo, 2021 https://abs.gov.rs/admin/upload/documents/20210714104956-opovo.pdf.Suche in Google Scholar
[118] Road Traffic Safety Agency Republic of Serbia Report: Report on the basic indicators of the state of traffic safety in the period from 2016 to 2020. Municipality of Odžaci, 2021 https://abs.gov.rs/admin/upload/documents/20210714104932-odzaci.pdf.Suche in Google Scholar
[119] Road Traffic Safety Agency Republic of Serbia Report: Report on the basic indicators of the state of traffic safety in the period from 2016 to 2020. The city of Pančevo, 2021 https://abs.gov.rs/admin/upload/documents/20210714104911-pancevo.pdf.Suche in Google Scholar
[120] Road Traffic Safety Agency Republic of Serbia Report: Report on the basic indicators of the state of traffic safety in the period from 2016 to 2020. Municipality of Pećinci, 2021 https://abs.gov.rs/admin/upload/documents/20210714104842-pecinci.pdf.Suche in Google Scholar
[121] Road Traffic Safety Agency Republic of Serbia Report: Report on the basic indicators of the state of traffic safety in the period from 2016 to 2020. Municipality of Plandište, 2021 https://abs.gov.rs/admin/upload/documents/20210714104820-plandiste.pdf.Suche in Google Scholar
[122] Road Traffic Safety Agency Republic of Serbia Report: Report on the basic indicators of the state of traffic safety in the period from 2016 to 2020. Municipality of Ruma, 2021 https://abs.gov.rs/admin/upload/documents/20210714082700-ruma.pdf.Suche in Google Scholar
[123] Road Traffic Safety Agency Republic of Serbia Report: Report on the basic indicators of the state of traffic safety in the period from 2016 to 2020. Municipality of Senta, 2021 https://abs.gov.rs/admin/upload/documents/20210714082601-senta.pdf.Suche in Google Scholar
[124] Road Traffic Safety Agency Republic of Serbia Report: Report on the basic indicators of the state of traffic safety in the period from 2016 to 2020. Municipality of Sečanj, 2021 https://abs.gov.rs/admin/upload/documents/20210714082545-secanj.pdf.Suche in Google Scholar
[125] Road Traffic Safety Agency Republic of Serbia Report: Report on the basic indicators of the state of traffic safety in the period from 2016 to 2020. The city of Sombor, 2021 https://abs.gov.rs/admin/upload/documents/20210714082440-sombor.pdf.Suche in Google Scholar
[126] Road Traffic Safety Agency Republic of Serbia Report: Report on the basic indicators of the state of traffic safety in the period from 2016 to 2020. Municipality of Srbobran, 2021 https://abs.gov.rs/admin/upload/documents/20210714082423-srbobran.pdf.Suche in Google Scholar
[127] Road Traffic Safety Agency Republic of Serbia Report: Report on the basic indicators of the state of traffic safety in the period from 2016 to 2020. The city of of Sremska Mitrovica, 2021 https://abs.gov.rs/admin/upload/documents/20210714082407-sremska-mitrovica.pdf.Suche in Google Scholar
[128] Road Traffic Safety Agency Republic of Serbia Report: Report on the basic indicators of the state of traffic safety in the period from 2016 to 2020. Municipality of Sremski Karlovci, 2021 https://abs.gov.rs/admin/upload/documents/20210714082358-sremski-karlovci.pdf.Suche in Google Scholar
[129] Road Traffic Safety Agency Republic of Serbia Report: Report on the basic indicators of the state of traffic safety in the period from 2016 to 2020. Municipality of Stara Pazova, 2021 https://abs.gov.rs/admin/upload/documents/20210714082334-stara-pazova.pdf.Suche in Google Scholar
[130] Road Traffic Safety Agency Republic of Serbia Report: Report on the basic indicators of the state of traffic safety in the period from 2016 to 2020. The city of of Subotica, 2021 https://abs.gov.rs/admin/upload/documents/20210714082310-subotica.pdf.Suche in Google Scholar
[131] Road Traffic Safety Agency Republic of Serbia Report: Report on the basic indicators of the state of traffic safety in the period from 2016 to 2020. Municipality of Temerin, 2021 https://abs.gov.rs/admin/upload/documents/20210714082224-temerin.pdf.Suche in Google Scholar
[132] Road Traffic Safety Agency Republic of Serbia Report: Report on the basic indicators of the state of traffic safety in the period from 2016 to 2020. Municipality of Titel, 2021 https://abs.gov.rs/admin/upload/documents/20210714082216-titel.pdf.Suche in Google Scholar
[133] Road Traffic Safety Agency Republic of Serbia Report: Report on the basic indicators of the state of traffic safety in the period from 2016 to 2020. Municipality of Šid, 2021 https://abs.gov.rs/admin/upload/documents/20210714081829-id.pdf.Suche in Google Scholar
[134] Road Traffic Safety Agency Republic of Serbia Report: Report on the basic indicators of the state of traffic safety in the period from 2016 to 2020. Municipality of Čoka, 2021https://abs.gov.rs/admin/upload/documents/20210714081906-coka.pdf.Suche in Google Scholar
[135] EUROSTAT: Administrative Units/Statistical Units, 2023 https://ec.europa.eu/eurostat/web/gisco/geodata/reference-data/administrative-units-statistical-units.Suche in Google Scholar
[136] Gavrilov MB, Marković SB, Jarad A, Korać VM. The analysis of temperature trends in Vojvodina (Serbia) from 1949 to 2006. Therm Sci. 2015;19(2):S339–50.10.2298/TSCI150207062GSuche in Google Scholar
[137] Mann HB. Non-parametric tests against trend. Econometrica. 1945;13(3):245–59.10.2307/1907187Suche in Google Scholar
[138] Kendall MG. Rank Correlation Methods. 4th edn. London: Charles Griffin; 1975.Suche in Google Scholar
[139] Hussain MM, Mahmud I. pyMannKendall: a python package for non-parametric Mann Kendall family of trend tests. J Open Source Software. 2019;4(39):1556. 10.21105/joss.01556.Suche in Google Scholar
[140] Kričković E, Novković I, Lukić T, Kričković Z. Using DPSEEA framework to investigate the relation between arsenic concentration values in waters and cancer rates in AP Vojvodina (North Serbia). Pol J Environ. 2022;31(3):2117–29.10.15244/pjoes/143918Suche in Google Scholar
[141] ESRI: ESRI online help for spatial statistics and analysis, 2023. http://resources.esri.com/help/9.3/arcgisdesktop/com/.Suche in Google Scholar
[142] Kumari B, Pandey AC. MODIS based forest fire hotspot analysis and its relationship with climatic variables. Spat Inf Res. 2020;28(7):87–99.10.1007/s41324-019-00275-zSuche in Google Scholar
[143] Said SNBM, Zahran ESMM, Shams S. Forest fire risk assessment using hotspot analysis in GIS. Open Civ Eng J. 2017;11:786–801.10.2174/1874149501711010786Suche in Google Scholar
[144] Vizuete-Jaramillo E, Meza-Figueroa D, Reyes-Castro PA, Robles-Morua A. Using a sensitivity analysis and spatial clustering to determine vulnerability to potentially toxic elements in a Semiarid City in Northwest Mexico. Sustainability-Basel. 2022;14(17):10461.10.3390/su141710461Suche in Google Scholar
[145] Getis A, Ord J. The analysis of spatial association by use of distance statistics. Geogr Anal. 1992;24(3):189–206.10.1111/j.1538-4632.1992.tb00261.xSuche in Google Scholar
[146] Ord JK, Getis A. Local spatial autocorrelation statistics: distributional issues and an application. Geogr Anal. 1995;27(4):286–306. 10.1111/j.1538-4632.1995.tb00912.x.Suche in Google Scholar
[147] Open data portal: Risks of injury to road users, 2022 https://data.gov.rs/sr/datasets/rizitsi-stradanja-uchesnika-u-saobratshaju/.Suche in Google Scholar
[148] Gitelman V, Hakkert AS, Doveh E. Development of tools for short-term monitoring of road accident trends. Proceedings of The European Transport Conference; 2007 "HAELD", Leiden, 2007.Suche in Google Scholar
[149] Tomašević A, Sokolovska V. Network of daily migration in AP Vojvodina. Culture of polis. 2017;14(34):269–81.Suche in Google Scholar
[150] Statistical Office of the Republic of Serbia Report: 2011 Census of Population, Households and Dwellings in the Republic of Serbia. Population, Daily migrants, Data by municipalities/cities, 2013 https://publikacije.stat.gov.rs/G2013/pdf/G20134016.pdf.Suche in Google Scholar
[151] Trinca GW. Road trauma prevention: Perspectives. World J Surg. 1992;16:370–3. 10.1007/BF02104433.Suche in Google Scholar PubMed
[152] World Health Organization Report: World report on road traffic injury prevention. 2004 https://iris.who.int/bitstream/handle/10665/42871/9241562609.pdf?sequence=1.Suche in Google Scholar
[153] Ali J, Adam R, Butler AK, Chang H, Howard M, Gonsalves D, et al. Trauma outcome improves following the advanced trauma life support program in a developing country. J Trauma. 1993;34(6):898–9.10.1097/00005373-199306000-00022Suche in Google Scholar PubMed
[154] Shariff SSR, Maad HA, Nursyaza Halim NNA, Derasit Z. Determining hotspots of road accidents using spatial analysis. Indones J Electr Eng Comput Sci. 2018;9(1):146–51. 10.11591/ijeecs.v9.i1.pp146-151.Suche in Google Scholar
[155] Mićić S. Predictive model of traffic accident frequency on rural roads. PhD thesis. University of Novi Sad, Faculty of Technical Sciences. Novi Sad; 2019.Suche in Google Scholar
[156] Mladenović S. Characteristics of pedestrians killed in traffic in the area of AP Vojvodina. Proceedings of the Faculty of Technical Sciences in Novi Sad. Vol. 4; 2020. p. 653–56.Suche in Google Scholar
[157] Arandjelovic M, Jovanovic J. Occupational medicine. The first electronic edition for students of integrated academic and basic professional studies. Faculty of Medicine. Niš; 2009.Suche in Google Scholar
© 2024 the author(s), published by De Gruyter
This work is licensed under the Creative Commons Attribution 4.0 International License.
Artikel in diesem Heft
- Regular Articles
- Theoretical magnetotelluric response of stratiform earth consisting of alternative homogeneous and transitional layers
- The research of common drought indexes for the application to the drought monitoring in the region of Jin Sha river
- Evolutionary game analysis of government, businesses, and consumers in high-standard farmland low-carbon construction
- On the use of low-frequency passive seismic as a direct hydrocarbon indicator: A case study at Banyubang oil field, Indonesia
- Water transportation planning in connection with extreme weather conditions; case study – Port of Novi Sad, Serbia
- Zircon U–Pb ages of the Paleozoic volcaniclastic strata in the Junggar Basin, NW China
- Monitoring of mangrove forests vegetation based on optical versus microwave data: A case study western coast of Saudi Arabia
- Microfacies analysis of marine shale: A case study of the shales of the Wufeng–Longmaxi formation in the western Chongqing, Sichuan Basin, China
- Multisource remote sensing image fusion processing in plateau seismic region feature information extraction and application analysis – An example of the Menyuan Ms6.9 earthquake on January 8, 2022
- Identification of magnetic mineralogy and paleo-flow direction of the Miocene-quaternary volcanic products in the north of Lake Van, Eastern Turkey
- Impact of fully rotating steel casing bored pile on adjacent tunnels
- Adolescents’ consumption intentions toward leisure tourism in high-risk leisure environments in riverine areas
- Petrogenesis of Jurassic granitic rocks in South China Block: Implications for events related to subduction of Paleo-Pacific plate
- Differences in urban daytime and night block vitality based on mobile phone signaling data: A case study of Kunming’s urban district
- Random forest and artificial neural network-based tsunami forests classification using data fusion of Sentinel-2 and Airbus Vision-1 satellites: A case study of Garhi Chandan, Pakistan
- Integrated geophysical approach for detection and size-geometry characterization of a multiscale karst system in carbonate units, semiarid Brazil
- Spatial and temporal changes in ecosystem services value and analysis of driving factors in the Yangtze River Delta Region
- Deep fault sliding rates for Ka-Ping block of Xinjiang based on repeating earthquakes
- Improved deep learning segmentation of outdoor point clouds with different sampling strategies and using intensities
- Platform margin belt structure and sedimentation characteristics of Changxing Formation reefs on both sides of the Kaijiang-Liangping trough, eastern Sichuan Basin, China
- Enhancing attapulgite and cement-modified loess for effective landfill lining: A study on seepage prevention and Cu/Pb ion adsorption
- Flood risk assessment, a case study in an arid environment of Southeast Morocco
- Lower limits of physical properties and classification evaluation criteria of the tight reservoir in the Ahe Formation in the Dibei Area of the Kuqa depression
- Evaluation of Viaducts’ contribution to road network accessibility in the Yunnan–Guizhou area based on the node deletion method
- Permian tectonic switch of the southern Central Asian Orogenic Belt: Constraints from magmatism in the southern Alxa region, NW China
- Element geochemical differences in lower Cambrian black shales with hydrothermal sedimentation in the Yangtze block, South China
- Three-dimensional finite-memory quasi-Newton inversion of the magnetotelluric based on unstructured grids
- Obliquity-paced summer monsoon from the Shilou red clay section on the eastern Chinese Loess Plateau
- Classification and logging identification of reservoir space near the upper Ordovician pinch-out line in Tahe Oilfield
- Ultra-deep channel sand body target recognition method based on improved deep learning under UAV cluster
- New formula to determine flyrock distance on sedimentary rocks with low strength
- Assessing the ecological security of tourism in Northeast China
- Effective reservoir identification and sweet spot prediction in Chang 8 Member tight oil reservoirs in Huanjiang area, Ordos Basin
- Detecting heterogeneity of spatial accessibility to sports facilities for adolescents at fine scale: A case study in Changsha, China
- Effects of freeze–thaw cycles on soil nutrients by soft rock and sand remodeling
- Vibration prediction with a method based on the absorption property of blast-induced seismic waves: A case study
- A new look at the geodynamic development of the Ediacaran–early Cambrian forearc basalts of the Tannuola-Khamsara Island Arc (Central Asia, Russia): Conclusions from geological, geochemical, and Nd-isotope data
- Spatio-temporal analysis of the driving factors of urban land use expansion in China: A study of the Yangtze River Delta region
- Selection of Euler deconvolution solutions using the enhanced horizontal gradient and stable vertical differentiation
- Phase change of the Ordovician hydrocarbon in the Tarim Basin: A case study from the Halahatang–Shunbei area
- Using interpretative structure model and analytical network process for optimum site selection of airport locations in Delta Egypt
- Geochemistry of magnetite from Fe-skarn deposits along the central Loei Fold Belt, Thailand
- Functional typology of settlements in the Srem region, Serbia
- Hunger Games Search for the elucidation of gravity anomalies with application to geothermal energy investigations and volcanic activity studies
- Addressing incomplete tile phenomena in image tiling: Introducing the grid six-intersection model
- Evaluation and control model for resilience of water resource building system based on fuzzy comprehensive evaluation method and its application
- MIF and AHP methods for delineation of groundwater potential zones using remote sensing and GIS techniques in Tirunelveli, Tenkasi District, India
- New database for the estimation of dynamic coefficient of friction of snow
- Measuring urban growth dynamics: A study in Hue city, Vietnam
- Comparative models of support-vector machine, multilayer perceptron, and decision tree predication approaches for landslide susceptibility analysis
- Experimental study on the influence of clay content on the shear strength of silty soil and mechanism analysis
- Geosite assessment as a contribution to the sustainable development of Babušnica, Serbia
- Using fuzzy analytical hierarchy process for road transportation services management based on remote sensing and GIS technology
- Accumulation mechanism of multi-type unconventional oil and gas reservoirs in Northern China: Taking Hari Sag of the Yin’e Basin as an example
- TOC prediction of source rocks based on the convolutional neural network and logging curves – A case study of Pinghu Formation in Xihu Sag
- A method for fast detection of wind farms from remote sensing images using deep learning and geospatial analysis
- Spatial distribution and driving factors of karst rocky desertification in Southwest China based on GIS and geodetector
- Physicochemical and mineralogical composition studies of clays from Share and Tshonga areas, Northern Bida Basin, Nigeria: Implications for Geophagia
- Geochemical sedimentary records of eutrophication and environmental change in Chaohu Lake, East China
- Research progress of freeze–thaw rock using bibliometric analysis
- Mixed irrigation affects the composition and diversity of the soil bacterial community
- Examining the swelling potential of cohesive soils with high plasticity according to their index properties using GIS
- Geological genesis and identification of high-porosity and low-permeability sandstones in the Cretaceous Bashkirchik Formation, northern Tarim Basin
- Usability of PPGIS tools exemplified by geodiscussion – a tool for public participation in shaping public space
- Efficient development technology of Upper Paleozoic Lower Shihezi tight sandstone gas reservoir in northeastern Ordos Basin
- Assessment of soil resources of agricultural landscapes in Turkestan region of the Republic of Kazakhstan based on agrochemical indexes
- Evaluating the impact of DEM interpolation algorithms on relief index for soil resource management
- Petrogenetic relationship between plutonic and subvolcanic rocks in the Jurassic Shuikoushan complex, South China
- A novel workflow for shale lithology identification – A case study in the Gulong Depression, Songliao Basin, China
- Characteristics and main controlling factors of dolomite reservoirs in Fei-3 Member of Feixianguan Formation of Lower Triassic, Puguang area
- Impact of high-speed railway network on county-level accessibility and economic linkage in Jiangxi Province, China: A spatio-temporal data analysis
- Estimation model of wild fractional vegetation cover based on RGB vegetation index and its application
- Lithofacies, petrography, and geochemistry of the Lamphun oceanic plate stratigraphy: As a record of the subduction history of Paleo-Tethys in Chiang Mai-Chiang Rai Suture Zone of Thailand
- Structural features and tectonic activity of the Weihe Fault, central China
- Application of the wavelet transform and Hilbert–Huang transform in stratigraphic sequence division of Jurassic Shaximiao Formation in Southwest Sichuan Basin
- Structural detachment influences the shale gas preservation in the Wufeng-Longmaxi Formation, Northern Guizhou Province
- Distribution law of Chang 7 Member tight oil in the western Ordos Basin based on geological, logging and numerical simulation techniques
- Evaluation of alteration in the geothermal province west of Cappadocia, Türkiye: Mineralogical, petrographical, geochemical, and remote sensing data
- Numerical modeling of site response at large strains with simplified nonlinear models: Application to Lotung seismic array
- Quantitative characterization of granite failure intensity under dynamic disturbance from energy standpoint
- Characteristics of debris flow dynamics and prediction of the hazardous area in Bangou Village, Yanqing District, Beijing, China
- Rockfall mapping and susceptibility evaluation based on UAV high-resolution imagery and support vector machine method
- Statistical comparison analysis of different real-time kinematic methods for the development of photogrammetric products: CORS-RTK, CORS-RTK + PPK, RTK-DRTK2, and RTK + DRTK2 + GCP
- Hydrogeological mapping of fracture networks using earth observation data to improve rainfall–runoff modeling in arid mountains, Saudi Arabia
- Petrography and geochemistry of pegmatite and leucogranite of Ntega-Marangara area, Burundi, in relation to rare metal mineralisation
- Prediction of formation fracture pressure based on reinforcement learning and XGBoost
- Hazard zonation for potential earthquake-induced landslide in the eastern East Kunlun fault zone
- Monitoring water infiltration in multiple layers of sandstone coal mining model with cracks using ERT
- Study of the patterns of ice lake variation and the factors influencing these changes in the western Nyingchi area
- Productive conservation at the landslide prone area under the threat of rapid land cover changes
- Sedimentary processes and patterns in deposits corresponding to freshwater lake-facies of hyperpycnal flow – An experimental study based on flume depositional simulations
- Study on time-dependent injectability evaluation of mudstone considering the self-healing effect
- Detection of objects with diverse geometric shapes in GPR images using deep-learning methods
- Behavior of trace metals in sedimentary cores from marine and lacustrine environments in Algeria
- Spatiotemporal variation pattern and spatial coupling relationship between NDVI and LST in Mu Us Sandy Land
- Formation mechanism and oil-bearing properties of gravity flow sand body of Chang 63 sub-member of Yanchang Formation in Huaqing area, Ordos Basin
- Diagenesis of marine-continental transitional shale from the Upper Permian Longtan Formation in southern Sichuan Basin, China
- Vertical high-velocity structures and seismic activity in western Shandong Rise, China: Case study inspired by double-difference seismic tomography
- Spatial coupling relationship between metamorphic core complex and gold deposits: Constraints from geophysical electromagnetics
- Disparities in the geospatial allocation of public facilities from the perspective of living circles
- Research on spatial correlation structure of war heritage based on field theory. A case study of Jinzhai County, China
- Formation mechanisms of Qiaoba-Zhongdu Danxia landforms in southwestern Sichuan Province, China
- Magnetic data interpretation: Implication for structure and hydrocarbon potentiality at Delta Wadi Diit, Southeastern Egypt
- Deeply buried clastic rock diagenesis evolution mechanism of Dongdaohaizi sag in the center of Junggar fault basin, Northwest China
- Application of LS-RAPID to simulate the motion of two contrasting landslides triggered by earthquakes
- The new insight of tectonic setting in Sunda–Banda transition zone using tomography seismic. Case study: 7.1 M deep earthquake 29 August 2023
- The critical role of c and φ in ensuring stability: A study on rockfill dams
- Evidence of late quaternary activity of the Weining-Shuicheng Fault in Guizhou, China
- Extreme hydroclimatic events and response of vegetation in the eastern QTP since 10 ka
- Spatial–temporal effect of sea–land gradient on landscape pattern and ecological risk in the coastal zone: A case study of Dalian City
- Study on the influence mechanism of land use on carbon storage under multiple scenarios: A case study of Wenzhou
- A new method for identifying reservoir fluid properties based on well logging data: A case study from PL block of Bohai Bay Basin, North China
- Comparison between thermal models across the Middle Magdalena Valley, Eastern Cordillera, and Eastern Llanos basins in Colombia
- Mineralogical and elemental analysis of Kazakh coals from three mines: Preliminary insights from mode of occurrence to environmental impacts
- Chlorite-induced porosity evolution in multi-source tight sandstone reservoirs: A case study of the Shaximiao Formation in western Sichuan Basin
- Predicting stability factors for rotational failures in earth slopes and embankments using artificial intelligence techniques
- Origin of Late Cretaceous A-type granitoids in South China: Response to the rollback and retreat of the Paleo-Pacific plate
- Modification of dolomitization on reservoir spaces in reef–shoal complex: A case study of Permian Changxing Formation, Sichuan Basin, SW China
- Geological characteristics of the Daduhe gold belt, western Sichuan, China: Implications for exploration
- Rock physics model for deep coal-bed methane reservoir based on equivalent medium theory: A case study of Carboniferous-Permian in Eastern Ordos Basin
- Enhancing the total-field magnetic anomaly using the normalized source strength
- Shear wave velocity profiling of Riyadh City, Saudi Arabia, utilizing the multi-channel analysis of surface waves method
- Effect of coal facies on pore structure heterogeneity of coal measures: Quantitative characterization and comparative study
- Inversion method of organic matter content of different types of soils in black soil area based on hyperspectral indices
- Detection of seepage zones in artificial levees: A case study at the Körös River, Hungary
- Tight sandstone fluid detection technology based on multi-wave seismic data
- Characteristics and control techniques of soft rock tunnel lining cracks in high geo-stress environments: Case study of Wushaoling tunnel group
- Influence of pore structure characteristics on the Permian Shan-1 reservoir in Longdong, Southwest Ordos Basin, China
- Study on sedimentary model of Shanxi Formation – Lower Shihezi Formation in Da 17 well area of Daniudi gas field, Ordos Basin
- Multi-scenario territorial spatial simulation and dynamic changes: A case study of Jilin Province in China from 1985 to 2030
- Review Articles
- Major ascidian species with negative impacts on bivalve aquaculture: Current knowledge and future research aims
- Prediction and assessment of meteorological drought in southwest China using long short-term memory model
- Communication
- Essential questions in earth and geosciences according to large language models
- Erratum
- Erratum to “Random forest and artificial neural network-based tsunami forests classification using data fusion of Sentinel-2 and Airbus Vision-1 satellites: A case study of Garhi Chandan, Pakistan”
- Special Issue: Natural Resources and Environmental Risks: Towards a Sustainable Future - Part I
- Spatial-temporal and trend analysis of traffic accidents in AP Vojvodina (North Serbia)
- Exploring environmental awareness, knowledge, and safety: A comparative study among students in Montenegro and North Macedonia
- Determinants influencing tourists’ willingness to visit Türkiye – Impact of earthquake hazards on Serbian visitors’ preferences
- Application of remote sensing in monitoring land degradation: A case study of Stanari municipality (Bosnia and Herzegovina)
- Optimizing agricultural land use: A GIS-based assessment of suitability in the Sana River Basin, Bosnia and Herzegovina
- Assessing risk-prone areas in the Kratovska Reka catchment (North Macedonia) by integrating advanced geospatial analytics and flash flood potential index
- Analysis of the intensity of erosive processes and state of vegetation cover in the zone of influence of the Kolubara Mining Basin
- GIS-based spatial modeling of landslide susceptibility using BWM-LSI: A case study – city of Smederevo (Serbia)
- Geospatial modeling of wildfire susceptibility on a national scale in Montenegro: A comparative evaluation of F-AHP and FR methodologies
- Geosite assessment as the first step for the development of canyoning activities in North Montenegro
- Urban geoheritage and degradation risk assessment of the Sokograd fortress (Sokobanja, Eastern Serbia)
- Multi-hazard modeling of erosion and landslide susceptibility at the national scale in the example of North Macedonia
- Understanding seismic hazard resilience in Montenegro: A qualitative analysis of community preparedness and response capabilities
- Forest soil CO2 emission in Quercus robur level II monitoring site
- Characterization of glomalin proteins in soil: A potential indicator of erosion intensity
- Power of Terroir: Case study of Grašac at the Fruška Gora wine region (North Serbia)
- Special Issue: Geospatial and Environmental Dynamics - Part I
- Qualitative insights into cultural heritage protection in Serbia: Addressing legal and institutional gaps for disaster risk resilience